Article

Soybean-Oil-Modified Petrochemical-Source Polyester Polyurethane Improves the Nutrient Release Performance of Coated Urea

1
National Engineering Research Center for Efficient Utilization of Soil and Fertilizer Resources, National Engineering & Technology Research Center for Slow and Controlled Release Fertilizers, College of Resources and Environment, Shandong Agricultural University, Tai’an 271018, China
2
Faculty of Engineering, University of Bristol, Bristol BS8 1TH, UK
*
Author to whom correspondence should be addressed.
Agronomy 2023, 13(12), 3008; https://doi.org/10.3390/agronomy13123008
Submission received: 24 October 2023 / Revised: 20 November 2023 / Accepted: 1 December 2023 / Published: 7 December 2023

Abstract

:
Due to the difficult degradation and high cost of polyester polyols (PPs), their further development in controlled-release fertilizers (CRFs) has been limited. It was of great significance to partially substitute PPs with soybean oil polyols (SOPs) in the preparation of CRFs, which can adjust the proportion of substitution to balance the nutrient release period and membrane degradability. And it is possible to adjust the nitrogen release curve and prepare coated urea with different release days without changing the coating thickness. In this study, a two-factor five-level interaction experiment was designed with different SOP addition ratios (70%, 60%, 50%, 40%, and 30%) and mass ratios of polyols to PAPI (1:1.2; 1:1; 1.2:1; 1.4:1; and 1.6:1). In 25 groups of soybean-oil-modified polyester polyurethane-coated urea (SMPCU) treatments, with the increase in SOP, the thermal decomposition performance of the coated urea was improved, and the residual ash contents of the coating material was reduced. The coating surface was made smoother and denser with a reasonable ratio of polyols to PAPI, preventing the release of non-film-forming substances. When the proportion of soybean oil was 60% and the ratio of polyols to PAPI was 1.2:1, the N release days of the prepared SMPCU reached 137 days. Compared to soybean-oil polyol-coated urea (SOPCU) and polyester polyol-coated urea (PPCU), the nitrogen release days increased by 73.42% (79 days) and 234.15% (41 days), respectively. The ratio of polyols to polyaryl polymethylene isocyanate (PAPI) was explored, as well as the effect of polyol composition on coatings, and prepared SMPCUs with different nitrogen release days. According to the growth needs of crops and soil environmental characteristics, adjusting the proportion of coating materials, prolonging or shortening the nitrogen fertilizer release time, meets the nutritional needs of crops under different planting systems and provides conditions for farmers to plant different crops.

1. Introduction

Controlled-release fertilizers (CRFs) are an important means of improving fertilizer utilization efficiency by wrapping a film around urea to slowly release nutrients [1]. Different crops have different growth cycles, resulting in different requirements for the slow-release rate of nitrogen. Utilizing controlled-release fertilizers (CRFs) resulted in higher yields of wheat and maize compared to conventional urea treatments, with increases ranging from 8.2% to 11.9% for wheat and 6.8% to 9.8% for maize. Furthermore, the use of CRFs improved nitrogen use efficiencies by 35.7% to 37.6% for wheat and 13.2% to 14.3% for maize [2,3]. When CRF is applied to soil, water molecules can penetrate the membrane shell and dissolve the nutrients wrapped in it. Nutrients are released for crop absorption by the osmotic pressure difference inside and outside the membrane, releasing them [4]. Uncontrollable environmental factors such as soil moisture, temperature and humidity, as well as the performance and structure of the film, all have an important impact on nutrient release [5,6].
The current coating materials used for producing CRFs are mainly polyethylene, epoxy resin, alkyd resin, etc. [7]. However, the vertical fluidized-bed coating process used for polyethylene film materials consumes a vast amount of energy and was carried out in solvents [8]. The epoxy group of epoxy resin can be crosslinked and cured with various composite compounds containing active hydrogen to form a three-dimensional network structure, but the synthetic material is easy to brittle crack and has poor impact damage resistance, which limits the application and development of epoxy resin [9].
Although the comprehensive performance of alkyd resin film material is good, its production cost, including raw materials and additives, was relatively high, and it is rarely used in the industry [10]. Polyurethane-based coating materials are currently the mainstream membrane materials due to their simple preparation, easy molding, and stable nutrient release [11]. The molecular chains of petrochemical polyurethane are usually composed of repetitive units such as aldehyde and imine groups. This polymer structure makes this material have high strength and stability and difficult to decompose under conventional conditions [12].
In addition, short-term controlled-release effects cannot meet the growth needs of crops with long growth cycles [13]. Therefore, a coating with good controlled-release performance was sought to reduce the initial nutrient release rate and improve the persistence of nitrogen release. Tian et al. achieved precise nutrient control by using polyolefin wax, bio-based polyurethane, and epoxy resin composite coatings, but the outer control layer of epoxy resin has strong rigidity, poor degradation performance, and high viscosity, which was not conducive to industrial application [14]. The original intention of modifying petrochemical source materials was to reduce their impact on the environment, but these modification methods not only make the production process of coatings more complex but also still pose environmental risks [15]. On the basis of not increasing the coating process and other petrochemical source materials, using bio-based materials to partially replace stone-based materials has become a research hotspot to develop green, environmentally friendly, and low-cost-performance membrane materials [16]. Therefore, cheap, degradable, and renewable bio-based materials have attracted more and more attention. This type of membrane material is mainly prepared from agricultural waste such as lignin, cellulose, and starch to produce bio-based polyols, which are then polymerized with polyisocyanates [17]. Tian et al. modified starch-based polyols (SPs) and castor oil (CO), and the degradation rate of the coating material prepared after 9 months (5.05%) was significantly higher than that of petroleum-based polyurethane (3.74%) [18]. The starch used lacks elasticity and cracks after recrystallization, easily leaving pores on the coating [19]. However, agricultural wastes such as lignin, cellulose, and starch contain a large number of impurities, resulting in poor performance and shortened nutrient release period of bio-based polyurethane-coated urea [20].
The study suggested that by either increasing the coating thickness, the lag period can be prolonged, and the release rate can be slowed down in both the linear and decay phases. However, to maintain a consistent and season-long supply of crop nutrients, The nutrient release period of polyurethane-coated fertilizers is often prolonged by increasing the amount of coating material [21]. Liu et al. used organic silicon to modify soybean oil polyols and achieved a maximum nutrient release period of 70 days with a 7% film thickness [22]. On the one hand, the production and transportation costs of large products have been greatly increased, putting greater pressure on farmers to apply fertilizers. On the other hand, the residue of coating materials in the soil has increased [23].
In this research, soybean-oil-based modified polyester polyurethane-coated urea (SMPCU) was prepared by crosslinking modification with SOP and polyester polyurethane (PP), followed by reaction with polyaryl polymethylene isocyanate (PAPI) on the surface of urea. Soybean oil polyols (SOPs) were made from soybean oil and have renewable properties in resource utilization. They have low viscosity and good flowability, and the polyurethane materials prepared have excellent mechanical properties and degradation properties [24].
By adjusting the ratio of PAPI to polyols and the ratio of SOP to PP, CRFs with different release periods can be prepared to meet nutritional production needs and achieve automation and customization of different crop production. An appropriate increase in the proportion of polyols added to prepare coated urea with a relatively short nitrogen release cycle was applied to short-term growing crops. The aim of this was to provide guarantees for the nitrogen demand of crops at different stages and reduce losses caused by excessive fertilization or improper fertilization periods for farmers.

2. Materials and Methods

2.1. Materials

Polyaryl polymethylene isocyanate (PAPI) with 31.1 wt.% of –NCO group (Yantai Wan Hua Polyurethane Co., Ltd., Yantai, China). Paraffin (melting point 58 °C) (Sinopharm Chemical Reagent Co., Ltd., Shanghai, China). Urea particles (3–5 mm and 46.4% N) (Shandong Hua Lu Heng sheng Chemical Industry Co., Ltd. (Dezhou, China). SOP (the hydroxyl value was 193.97 mg KOH/g) and PP (the hydroxyl value was 220.19 mg KOH/g) (Shandong Ding hao Fertilize Co., Ltd., Weifang, China).

2.2. Preparation of Different CRFs

After 3.0–5.0 mm urea granules (1.0 kg) were added into a rotating drum and preheated to 80 ± 2 °C for about 20 min, 5 g of paraffin as a surface modifier was uniformly spread on the surface of urea granules and mixed approximately for 5–10 min. Then, PAPI, SOP, and PP were mixed according to the ratio in Table S1 and were sprayed evenly onto the wax-modified urea, and heated it at 80 ± 2 °C for about 5–30 min. The mixture accounted for about 1% of the fertilizer mass each time. The coating materials were sprayed manually onto the surface of the rolling fertilizer at a flowrate of 3.0 g/s with the spray structure of streamline.
Meanwhile, polyester polyurethane-coated urea (PPCU) and soybean-oil-based polyurethane-coated urea (SOPCU) were prepared by the reaction of PP, SOP, and PAPI according to the ratio of polyhydric alcohols: PAPI in Table 1. The detailed processing plan is displayed in the Table S2.
The R value is given as follows [25]:
N C O O H = M P A P I × W P A P I M p o l y o l × W p o l y o l = N N C O N O H
where MPAPI is the content of the isocyanate group in PAPI, Mpolyol is the content of the hydroxyl group (hydroxyl number/56.1, in mmol/g), and WPAPI and Wpolyol are the weights (g) of PAPI and polyols. The isocyanate index is the ratio of the polyisocyanate equivalent to the polyol equivalent, i.e., the molar ratio of the –NCO group to the –OH group (Figure 1).

2.3. Wear Resistance Test

After 4 min of wear and tear on the fertilizer by fixing 60 mesh sandpaper in a drum, the nitrogen release behavior of the pre and post wear and repaired fertilizer was measured under static water cultivation conditions at 25 °C.

2.4. Statistical Analysis

All statistical analyses were performed using Statistical Product and Service Solutions (SPSS). Comparisons of multiple treatments were assessed using analysis of variance (ANOVA). The statistical analysis using the 95% confidence interval.

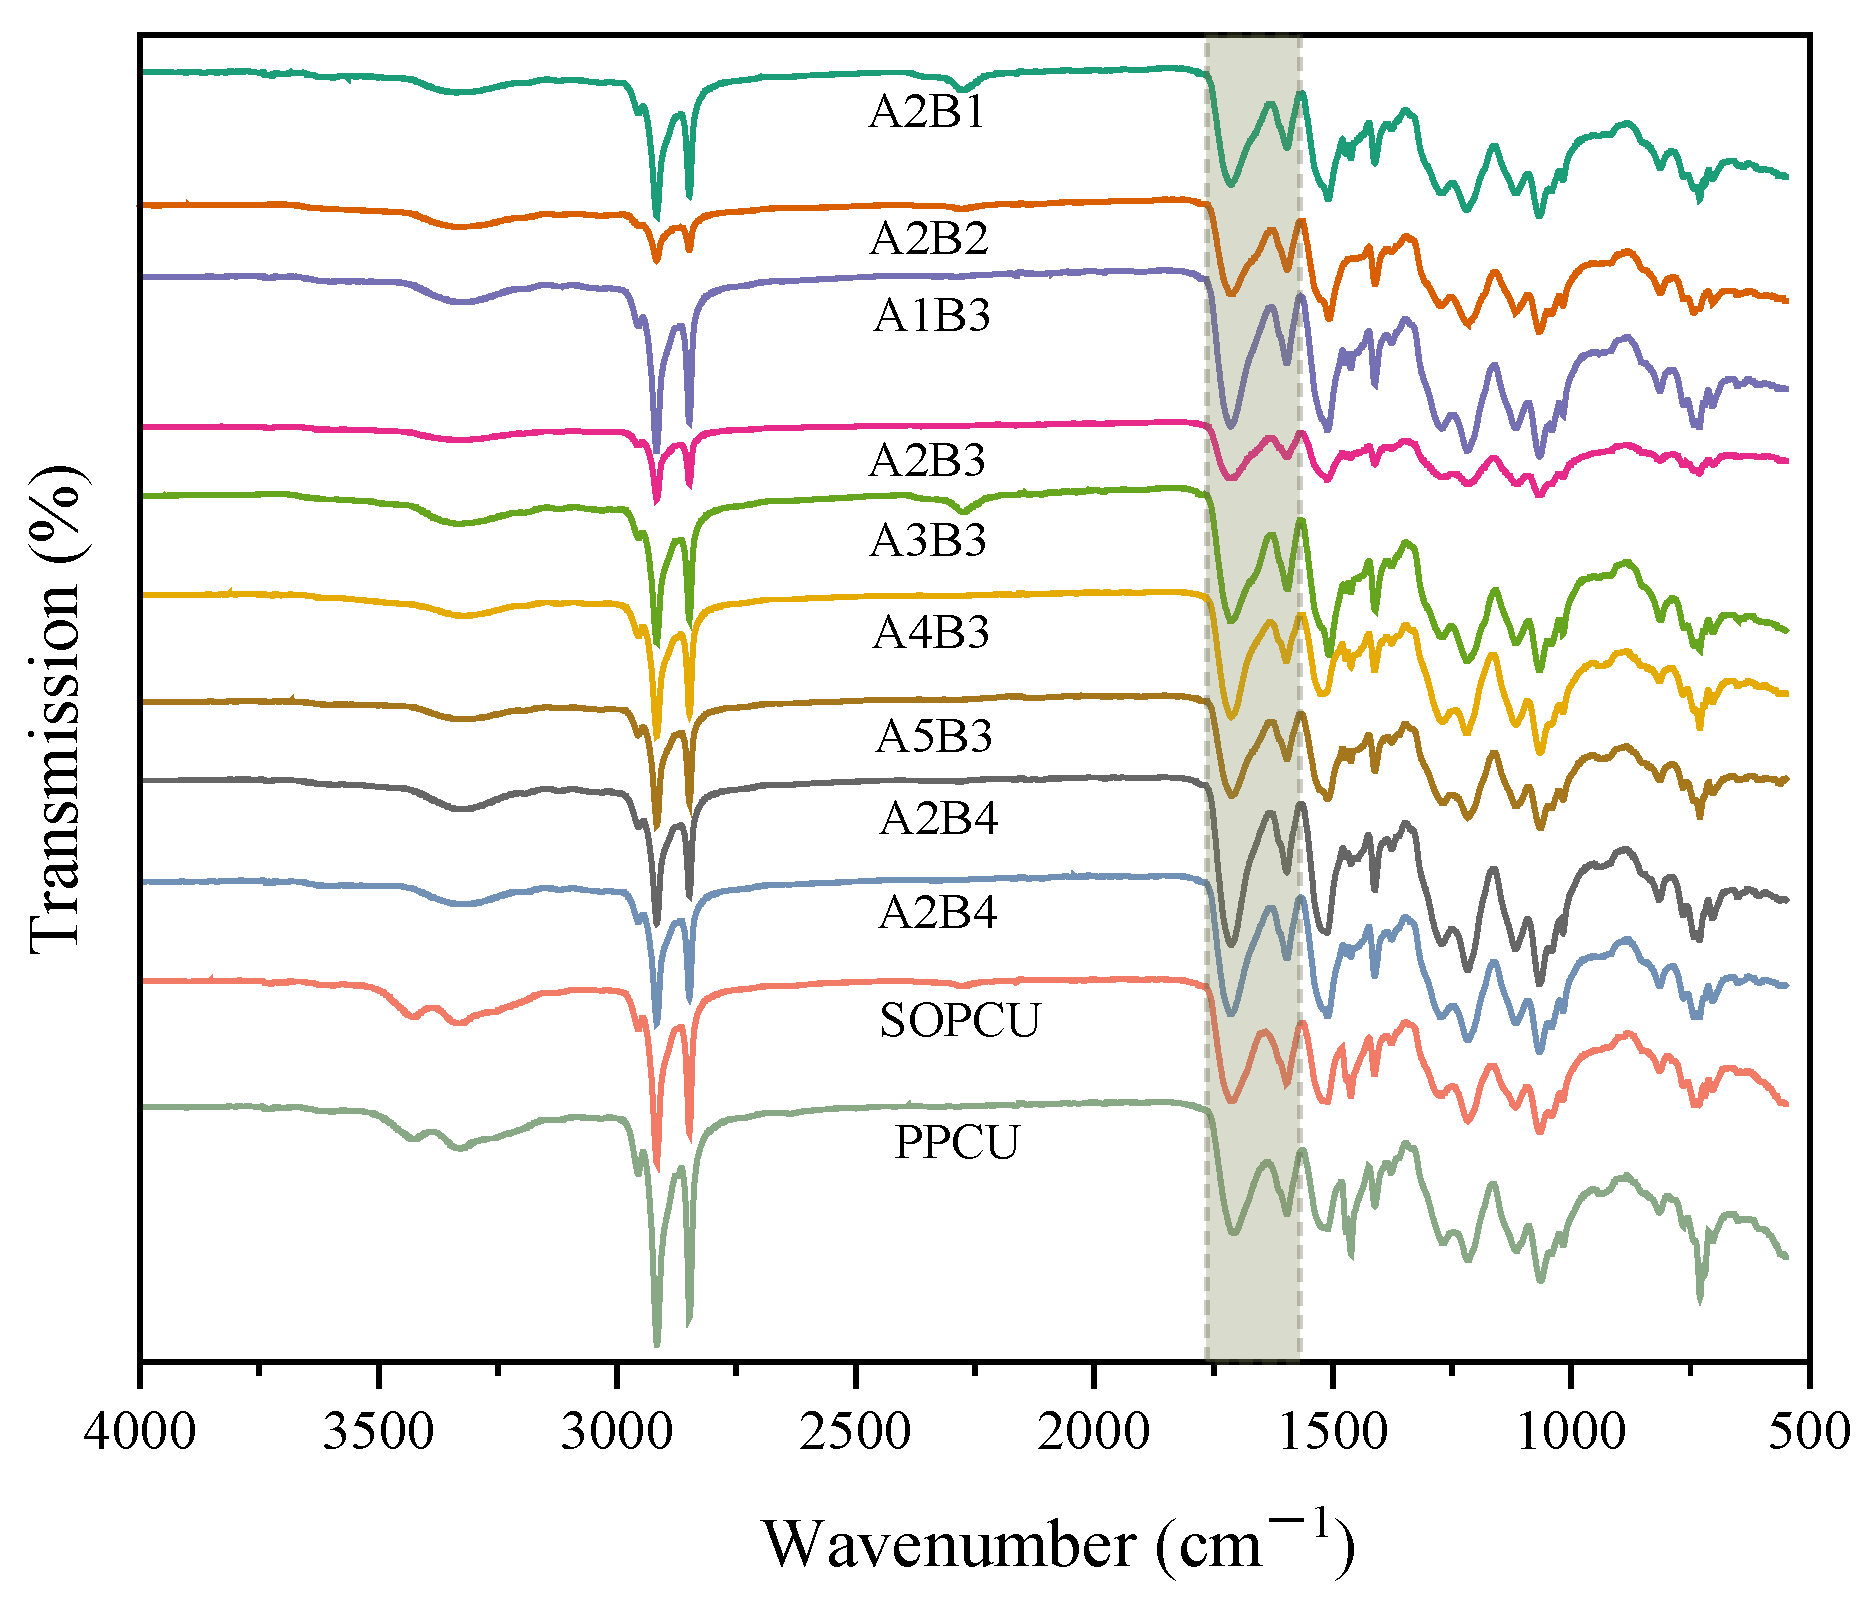
2.5. FTIR Characterization

A Thermo Nicolet 380 FTIR spectrometer (Thermo Fisher Scientific, Waltham, MA, USA) was used to analyze the Fourier transform infrared (FTIR) spectra of SOP, PP, and PAPI. All spectra were recorded at a resolution of 4 cm−1 over the scanning range from 4000 to 500 cm−1 at room temperature.
Peak-fit processing was thus performed on the FTIR spectra in order to calculate the peak area of the hydrogen-bonded C=O groups and the free C=O groups, respectively. The hydrogen bonding index (HBI) of coating material was defined using Equation (2), and the DPS of the PU binders was calculated by Equation (3)
H B I = A H b o n d e d     C = O A f r e e     C = O
D P S = H B I H B I + 1
where AH-bonded C=O and Afree C=O represent the peak area of the hydrogen-bonded C=O stretching vibration and the free C=O stretching vibration, respectively [26,27].

2.6. Characterization of Coating Materials

The surface microscopic morphology of the coated urea was detected using a QUANTA250 scanning electron microscope (SEM) from Thermo Fisher Scientific. The thermal stability of the SOPCU, PPCU, and SMPCU coating was determined by an analysis using DTG60A thermogravimetric instrument from B Shimadzu Corporation. The particle hardness of conventional urea, SOPCU, PPCU, and SMPCU were measured using ab FT-803 particle hardness tester. Each treatment measured 15 particles. The water contact angles (WCAs) were analyzed using a JC2000A contact angle meter.

2.7. Nitrogen Release Characteristics of SMPCUs

Coated urea (10 g) was added into a bottle containing 200 mL of deionized water and placed in a biochemical incubator at 25 ± 0.5 °C. The solution samples were collected and the N cumulative release rates from each of the coated fertilizers were determined by sampling at 1, 3, 5, 7, 14, 28, and 56 days or until the cumulative N release reached more than 80%. In other words, if the cumulative release rate of nitrogen did not exceed 80% during the 56 days, the measurement continued until the accumulative release exceeds 80%. Then, fresh 200 mL deionized water was added into the bottle after each sampling.
The refractive index of the solution samples was determined using a refractometer (RX-5000α, ATAGO Co., Ltd., Tokyo, Japan) at regular intervals until the cumulative N release exceeded 80% [20]. The cumulative N release rates were determined with Equation (4):
v t = w t   w × 100
where vt is the cumulative N release rate during a specific period (days), wt is the mass of N released during the period, and w is the initial mass of total N.

3. Results and Discussion

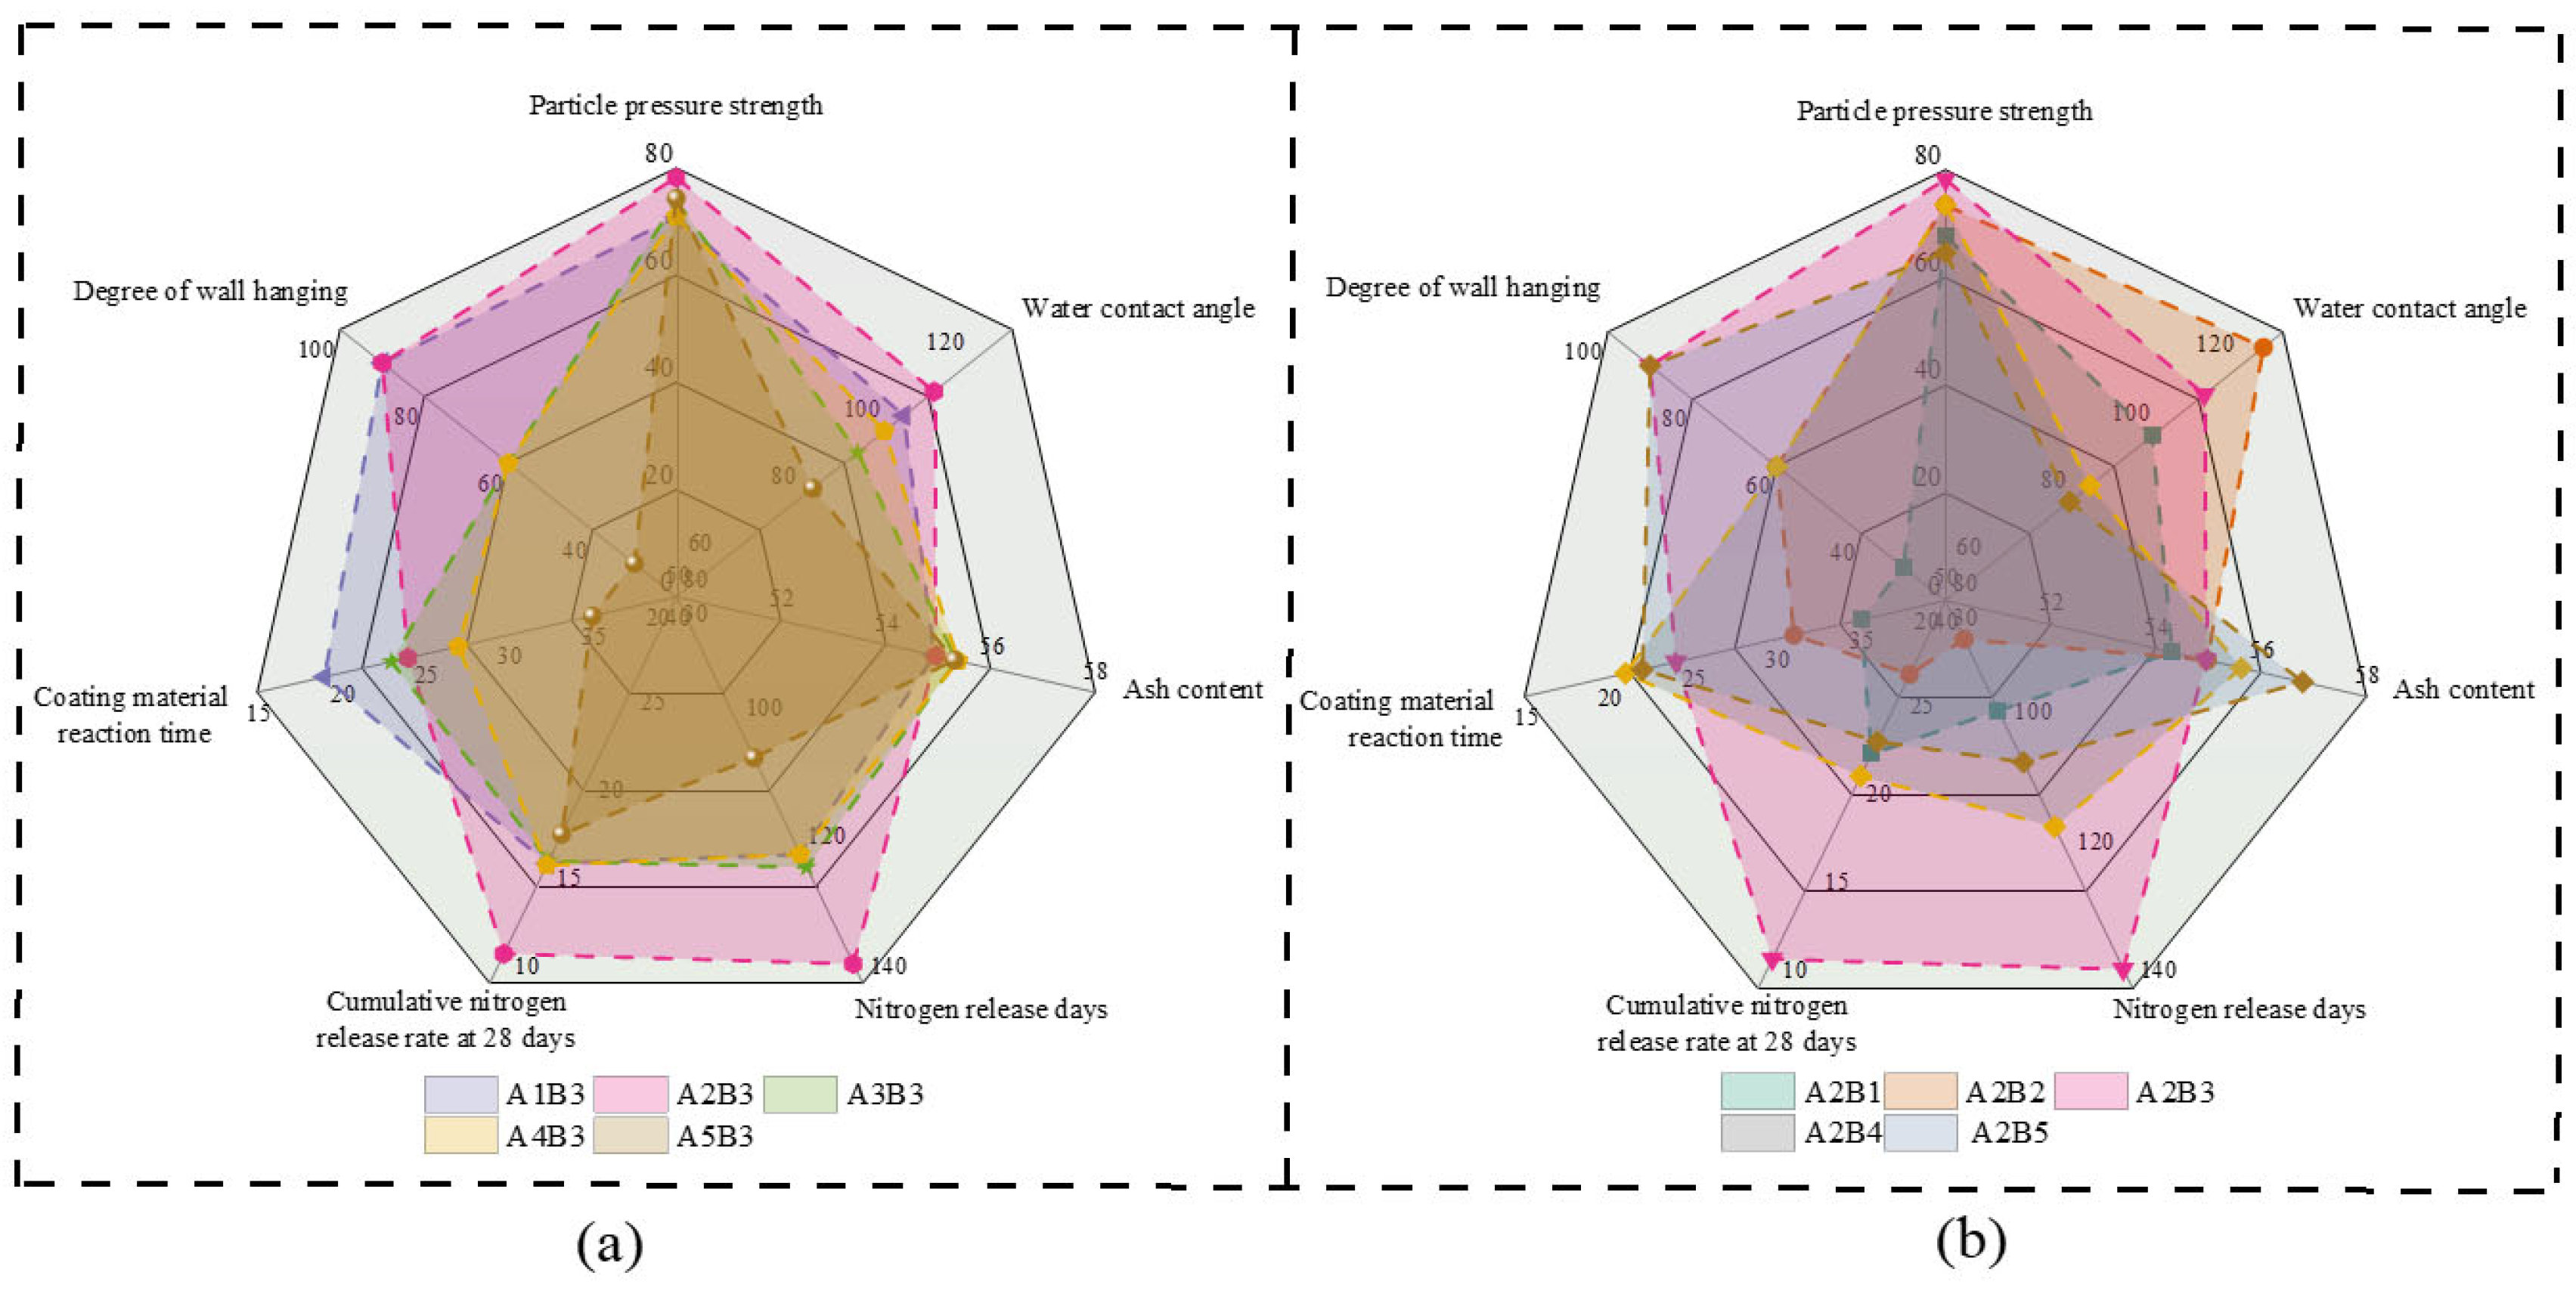
3.1. Characteristics of the Coating Materials

The FTIR spectra of SOP, PP, and PAPI in Figure 2a show the chemical changes during the synthesis of SMPCU. For the hard segment of PAPI, the absorption peak at around 2240 cm−1 was associated with the –N=C=O bonding. Sharp absorption peaks at 1520 cm−1 were related to the C=C stretching vibration of the benzene ring. The 1107 cm−1 absorption peak reflecting the stretching vibration might be from the C–O [28]. For SOP in the soft segment, there was a wide peak in the range of 3400–3200 cm−1, corresponding to –OH stretching vibration [29].
The SOP contains –OH, which is beneficial for the synthesis of polyurethane. There is a peak in the range of 1722 cm−1, corresponding to C=O stretching vibration. There are multiple peaks in the range of 2923 cm−1, corresponding to C-H stretching vibration. The main peak in this range corresponds to the component of polyols –CH2, with a peak position of approximately 2850 cm−1. There is a peak in the 1069 cm−1, 1122 cm−1 range, corresponding to the C–O stretching vibration in the ester bond [26]. The ester bond breaks under the influence of microorganisms, soil moisture, and soil temperature, accelerating the degradation of polyurethane coating materials. In the infrared curve of PP, a characteristic peak of –OH appears at 3427 cm−1, and the peak at 1266 cm−1 is related to the tensile vibration of C–O [27].
SOP has a Mn of 529 Da and a Mw of 869 Da (Table S1). The Mn of PP is 468 Da and the Mw is 796 Da. The Polydispersity Index of SOP and PP was 1.63 and 1.70, respectively, so the molecular weight distribution of SOP was more uniform, and the performance was more stable [30].
There are two forms of hydrogen bonding interactions that exist in the PU binders: One type is the hydrogen bond (C=O–N–H) formed between the N–H groups and the C=O groups in the hard segment material. Another is the hydrogen bonding between the N–H groups of the hard segment and the C–O group of the soft segment (C–O–N–H) [31]. The hydrogen bonding (C=O–N-H) between the hard domains can result in the phase separation of the hard and soft domains and provide higher mechanical strength, while the hydrogen bonding (C–O–N–H) between the hard and soft domains may lead to the phase mixing of the hard and soft domains [32].
From Figure 3, it can be clearly seen that all spectra of the coating materials show similar typical peaks of the PAPI/SOP/PP-based PU structures, including the free N–H stretching vibration at 3467 cm−1, (νfree (N–H)), the hydrogen-bonded N-H stretching vibration at 3334 cm−1H(N–H)), the CH3 asymmetric stretching vibration at 2915 cm−1as(CH3)), the CH2 symmetric stretching vibration at 2850 cm−1 (νs(CH2)), the free C=O stretching vibration at 1716 cm−1free(C=O)), the hydrogen-bonded N-H stretching vibration at 1600 cm−1H(C=O)), and the C-O stretching vibration in the –NHCOO– linkage at 1220 cm−1. These aforementioned characteristic peaks verify the presence of urethane and urea linkages in the PU structures. The absence of a characteristic band corresponding to the isocyanate groups at 2240 cm−1 indicates that the –NCO groups of PAPI have been completely consumed via reactions with the –OH groups of SOP and PP to form the urethane linkages and urea linkages, respectively [26,27].
The multiplet band consists of bands originating from the C=O-group vibrations of the urea bond and bonded (1640–1680 cm−1) and unbonded (1690–1701 cm−1) hydrogen, from the C=O-group vibrations of the urethane bond and bonded (1705–1727 cm−1) and unbonded (1736–1745 cm−1) hydrogen, and from the allophanate group vibrations (1750–1760 cm−1) (Figure 4b). Also observed in the multiplet band was the occurrence of a band from the carbonyl groups in the polyurethane soft segment (1723–1732 cm−1) [33].
The main vibration regions studied in polyurethane materials were NH stretching vibration and carbonyl C=O stretching vibration, mainly because the formation of hydrogen bonds was related to the presence of these functional groups [34]. Among them, bands from the carbonyl group have been widely used to characterize the hydrogen bonding state of the polymer, and to correlate this with the degree of phase separation in the system (DPS) [35]. The data obtained via Gaussian fitting are listed in Table 2. Obviously, when the amount of soft chain segments is constant, the DPS changes with the amount of hard chain segments added. A higher hard segment content yields larger hard domains and stronger hydrogen bonding interactions between hard domains, which inhibits the dispersion of the hard domains in the soft domains. When the amount of hard segments added is moderate, the hydrogen bonds in the structure formed after the complete reaction with the soft segment are more likely to promote phase mixing, thus reducing DPS.

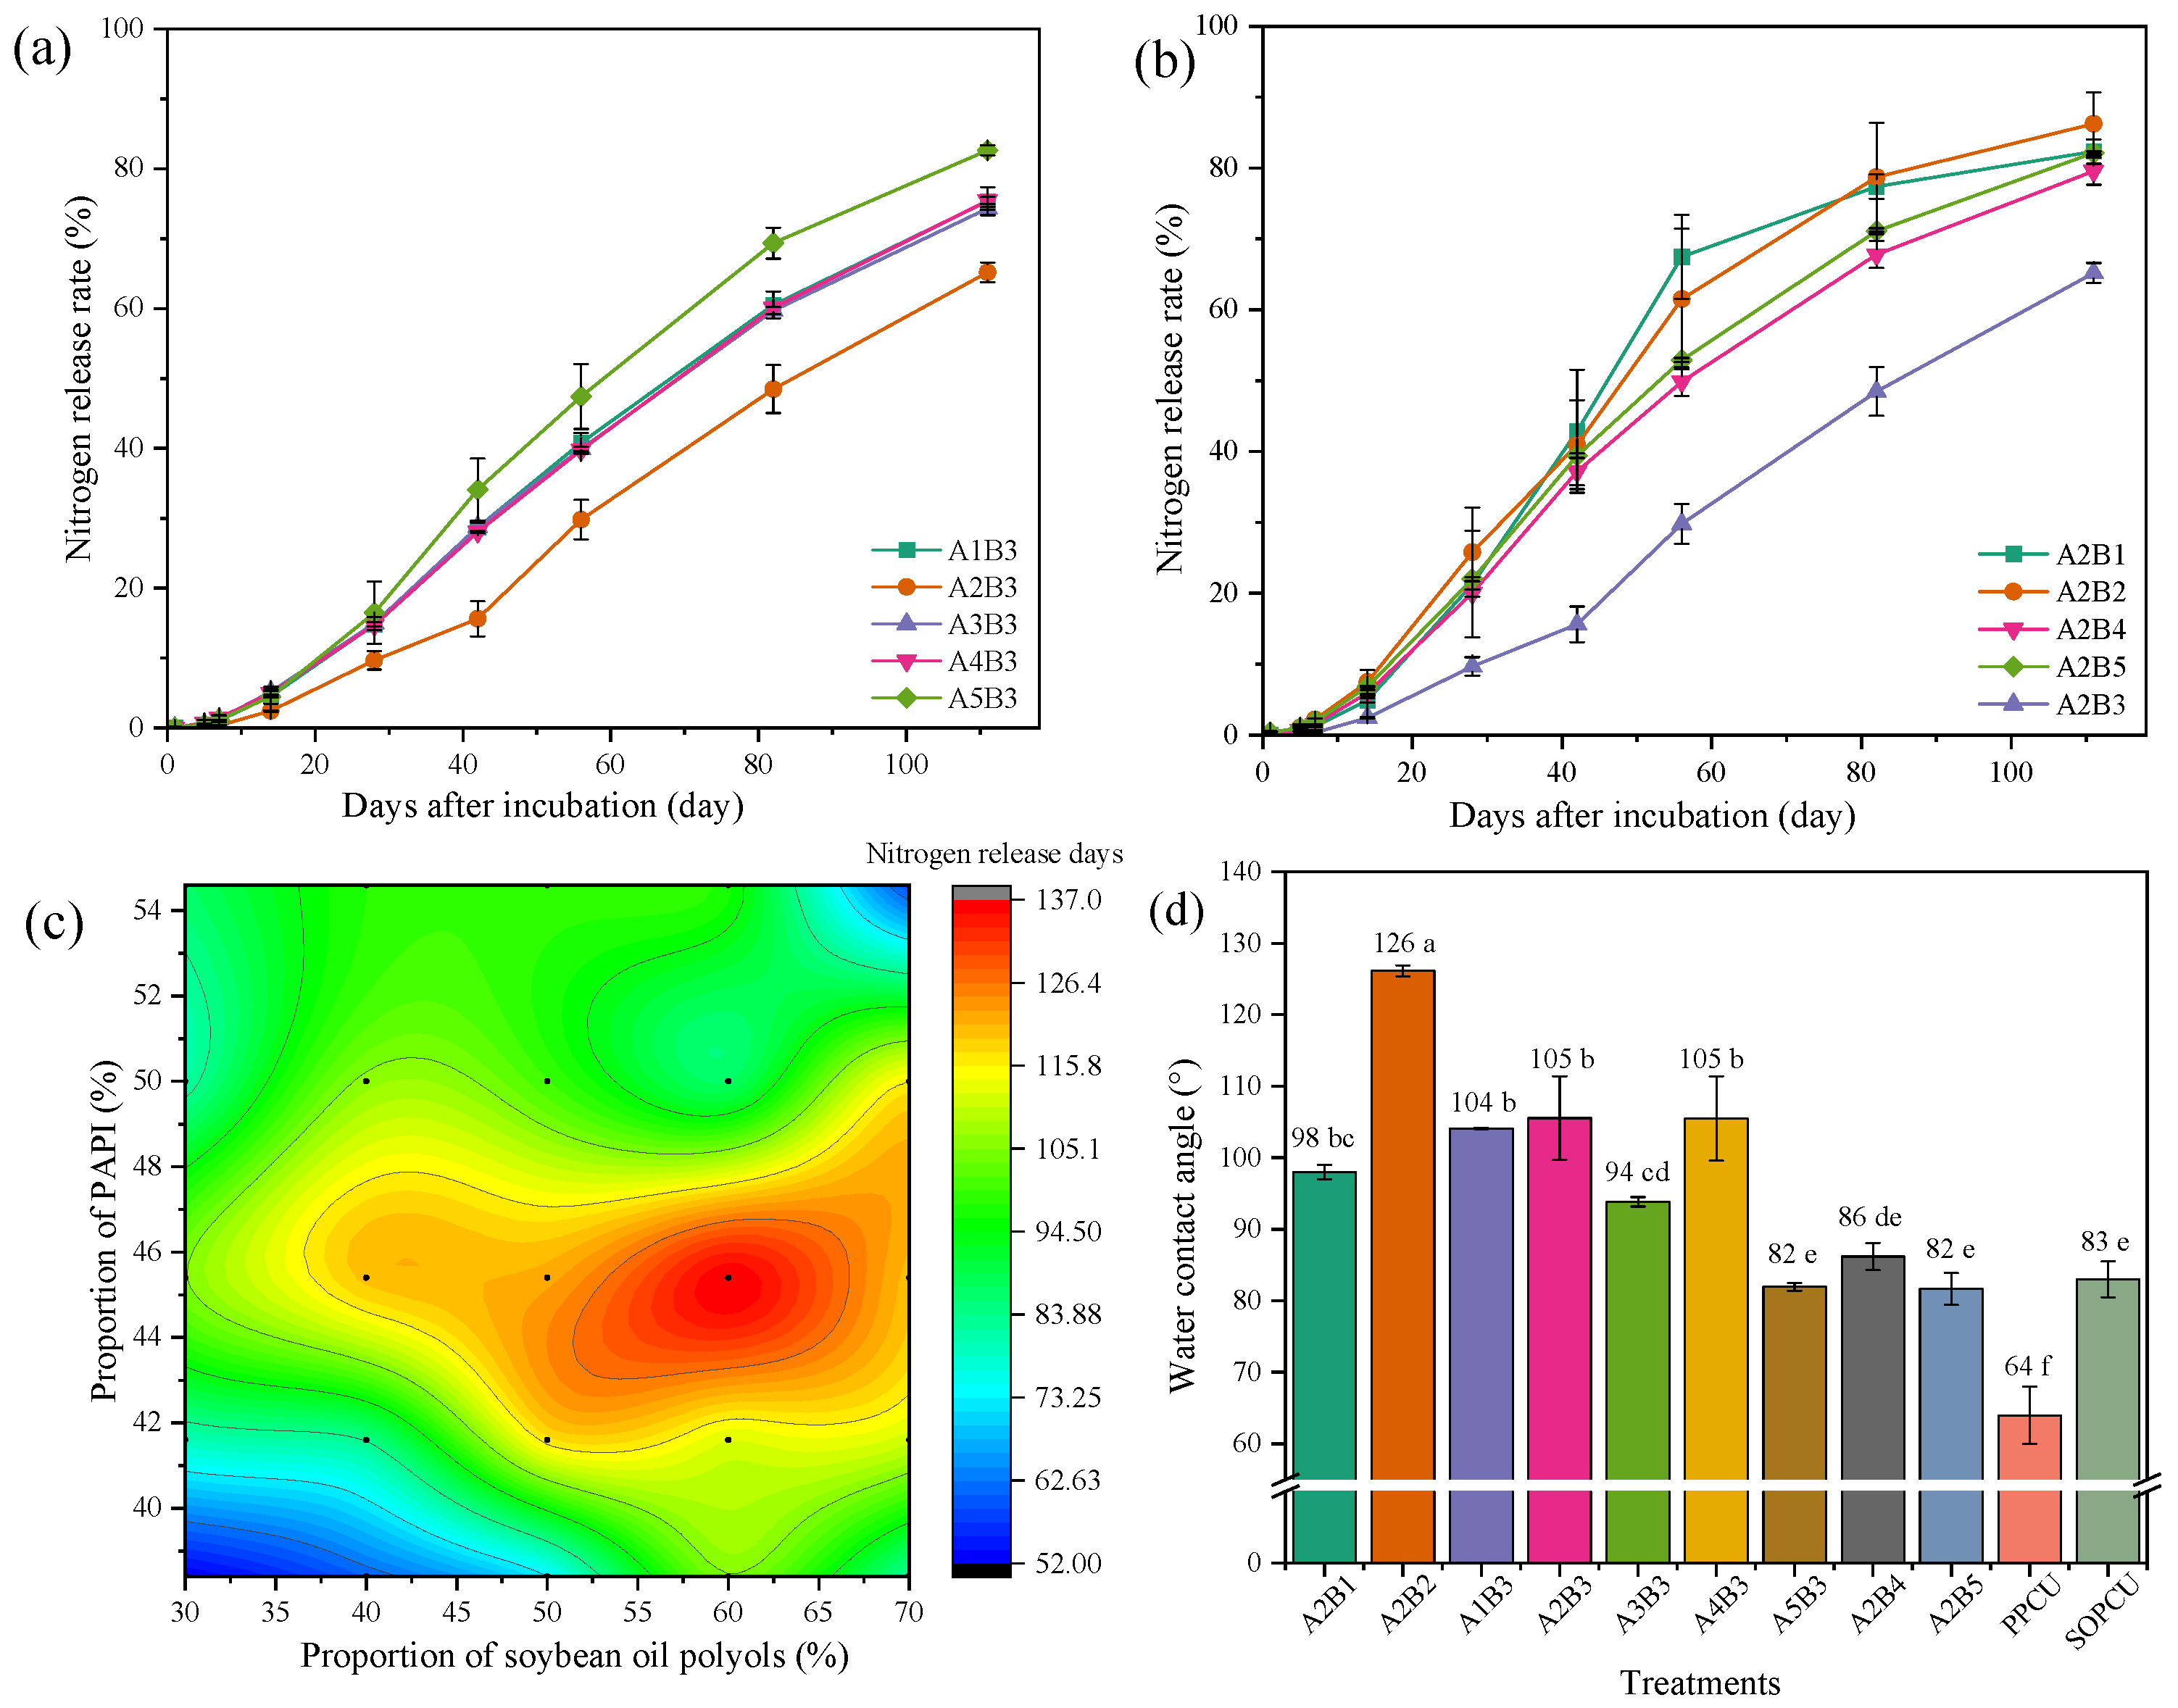
3.2. Nitrogen Release Behavior and Water Contact Angle of CRUs Coated with Different Materials

The nitrogen release days of PPCU are 41 days (Figure S1A). In previous studies, coating materials prepared from biomass materials had good degradation performance, but their controllability is poor. In this study, the nitrogen release rate of SOPCU was relatively slow, with 79 days of nitrogen release. From the perspective of physical properties, the water contact angle of PPCU was 64°, and that of SOPCU was 83° (Figure 5d). When the two materials were crosslinked in a 1:1 ratio, the hydrophobic angle increases to 94°, indicating that the crosslinking modification of SOP and PP increases the hydrophobicity of the coating and delays water infiltration (Figure 5c).
After performing SOP and PP crosslinking modification, at the optimal crosslinking ratio (A2B3), the 28-day cumulative nitrogen release rate was significantly increased by 34% and 73% compared to SOPCU and PPCU, respectively, and the nitrogen release days were increased to 137 days. This effectively improved the inaccurate nitrogen release characteristics of polyurethane-coated urea prepared from a single polyol.
The N release characteristics of coated urea were significantly influenced by the PAPI ratio and the proportion of SOP (Figure 5b). Under the same ratio of SOP and PP, when the ratio of polyol to PAPI was 1:1.2; 1:1; 1.2:1; 1.4:1; and 1.6:1, the nitrogen release rates on the seventh day were 1.24%, 2.19%, 0.33%, 1.52%, and 1.94%, respectively. The nitrogen release days were 97 d, 87 d, 137 d, 112 d, and 105 d, respectively. The A2B1 treatment resulted in a rapid release of nitrogen between 28 and 56 days, which is beneficial for the growth of crops with shorter growth cycles and a higher nitrogen demand. The nitrogen release rate of A2B3 is relatively slow, and the release cycle is as long as 137 days, making it more suitable for crops with longer growth cycles such as fruit trees. For corn with a growth cycle of about 90 days, when the SOP ratio was adjusted to 60% and the ratio of polyols to curing agents to 1:1, a nitrogen slow-release for 90 days under a 3% coating thickness was achieved. In regions with cold climates, the growth cycle of corn is extended to about 120 days, with an adjusted SOP ratio of 40% and a ratio of 1.2:1 between polyols and solidifying agents, achieving controlled nitrogen release for 120 days.
When the amount of PAPI added was insufficient, there was not enough –NCO to react with –OH to form a complete coating, so the nutrients were easily released. The addition ratio of –NCO was adjusted appropriately to fully react with –OH to form RNHCOOR, forming a more dense and uniform film layer, filling pores and cracks, and reducing the release rate of nitrogen (Figure 6a,c,e).
When the ratio of polyols to PAPI was 1.2:1 and the proportion of SOP was 0.7, 0.6, 0.5, 0.4, and 0.3, the nitrogen release rates on the seventh day were 1.08%, 0.33%, 1.29%, 1.43%, and 1.19%, respectively (Figure 5a). The nutrient release days were 120 d, 137 d, 122 d, 120 d, and 105 d, respectively. When the proportion of SOP increased from 0.3 to 0.6, the nitrogen release days were extended by 30.48%. However, further increasing the proportion of SOP resulted in a decrease in the number of nitrogen release days.
This was because as the SOP further increases, the polar groups in the soft segment interact with water molecules, resulting in the membrane material having a certain degree of water absorption. Water molecules penetrated into the coating, and dissolved urea molecules were transported out of the membrane through osmotic pressure. Finally, the crosslinked network lost elasticity after the nutrient was completely released, and the remaining liquid flowed out through the pores or evaporated out of the membrane in the form of steam. The rate of nutrient release was more easily affected by the osmotic pressure difference inside and outside the membrane, so the soft segment structure of the membrane material had a weakened control effect on nutrient release. The sufficient response of hard and soft segments is of great significance in improving the nutrient release cycle. Without increasing the coating thickness, the amount of hard segment added can be adjusted to optimize nutrient release. Further consideration for production and application can be given to using SOP and PP for mixed crosslinking, which can regulate the nutrient release during a certain period of time by regulating the composition of polyols [36].

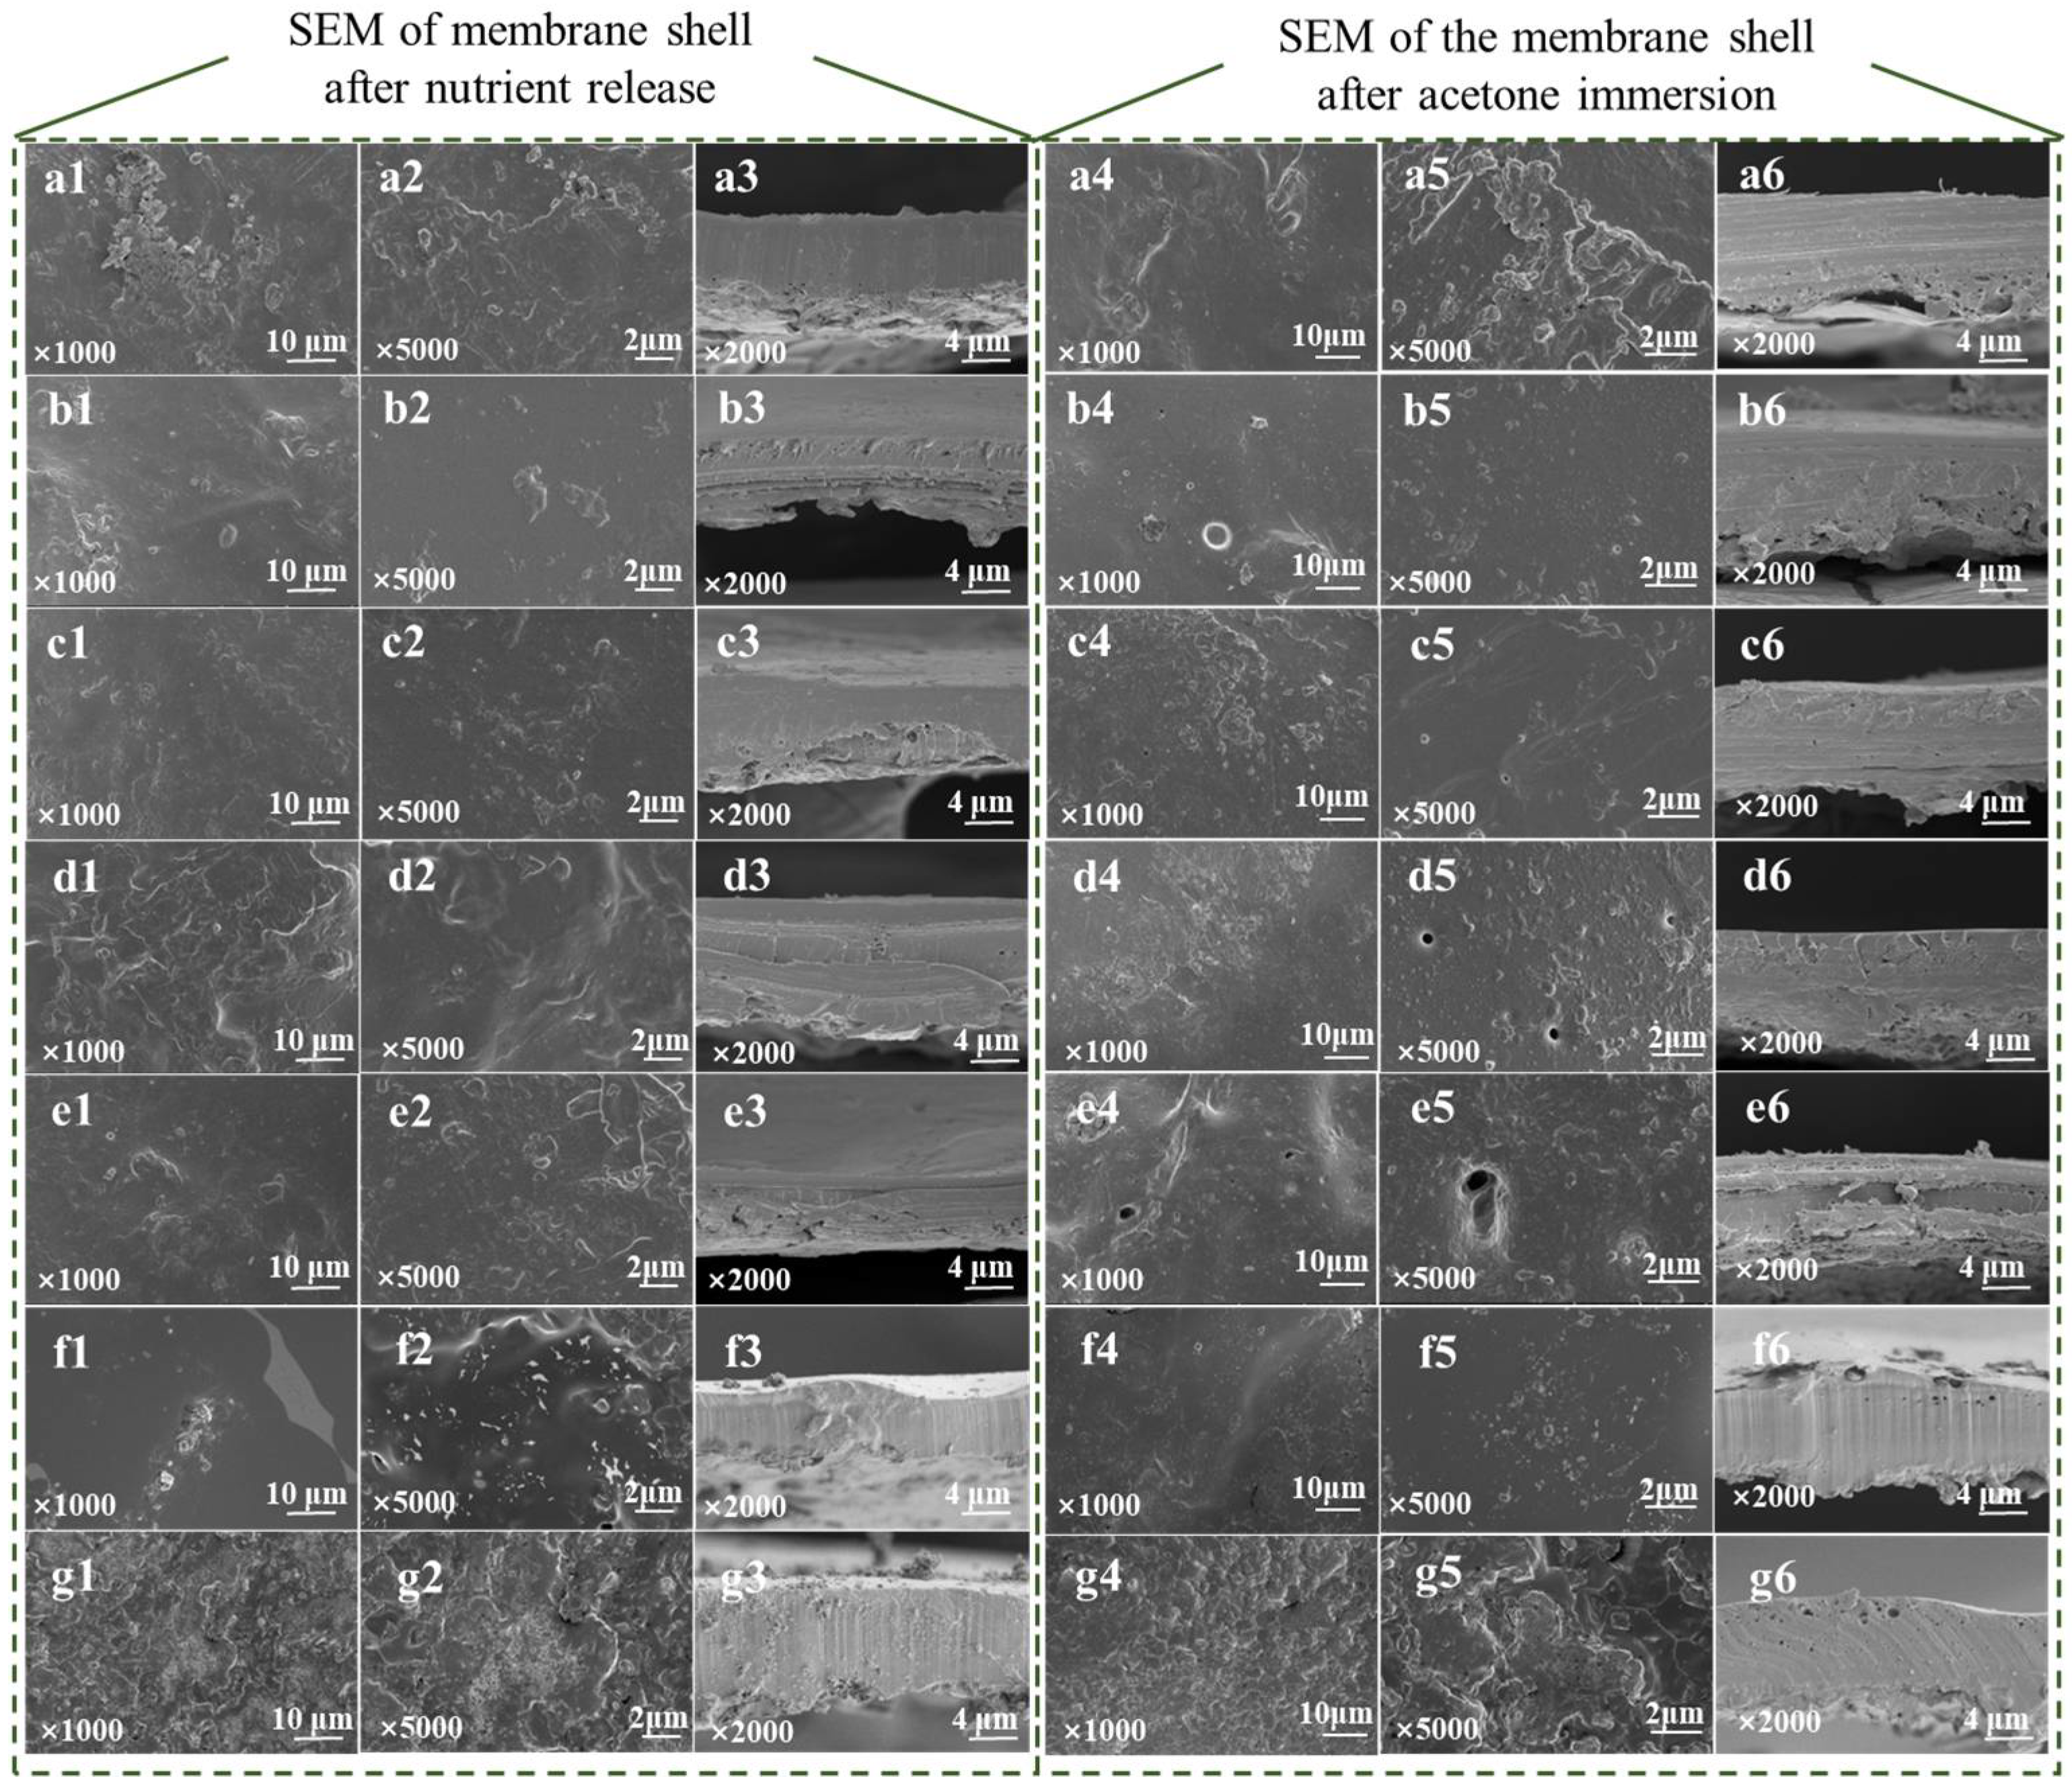
3.3. Microstructure of Different Coating Materials

Figure 6 shows that the addition ratio of two polyols has a significant impact on the microstructure of the coating material under the same R-value conditions. When the ratio of soft segment (polyol) to hard segment (PAPI) was fixed at 1.2:1, the convex structure on the surface became looser when the amount of soybean oil polyol added was too high (Figure 6c). In Figure S2(a3), when the ratio of the two materials was 1:1 (A2B2), a large number of wrinkles appeared on the surface of coating material. The reason for this phenomenon is that during the process of coating, the material solidified from liquid to solid during spraying. There were also some components that did not participate in the membrane formation reaction, which formed irregular protrusions and micropores.
And after soaking in acetone, a large number of pores can be observed on the surface and cross-section of materials treated with polyols with a higher proportion (Figure 6(d5,d6,e5,e6)). Compared to PPCU, more and more larger pores appeared in the cross-sectional images of the SOPCU coating materials (Figure 6(g6)). This may be because the specific molecular chain composition of soybean oil polyols was more complex, containing fatty alcohols with carbon chain lengths of 12 to 22, such as dodecanol (C12), tridecanol (C13), tetradecanol (C14), pentadecanol (C15), etc. After soaking in acetone, it leached out of the membrane material, resulting in the formation of a large number of pores, which can easily lead to the release of nitrogen.
The effect of the R value on the microsurface of coating materials was also evident. Under the condition of a 1:1 ratio of SOP to PP, the surface of coating materials treated with R value 1.2 (Figure S2(b1)) was smoother, and the nutrient release characteristics of this treatment were better. This was because the addition ratio of polyols and isocyanates was appropriate, and the reaction between the two only had a small amount of residual residue. The formation of a smooth and complete surface slows down the infiltration of nutrients. In the treatment with an R value of 1.8 (A2B1) and 0.9 (A2B5), there was a large number of protrusions on the surface (Figure 6(a1,a2,e1,e2)), which was caused by the excessive proportion of polyols or isocyanates added, resulting in a large amount of unreacted substances remain on the surface. Therefore, regardless of the excess of polyols or isocyanates, a smooth and flat membrane shell surface cannot be formed. It was necessary to adjust the addition ratio of the two to adjust the roughness of the membrane shell surface to optimize nitrogen release characteristics.

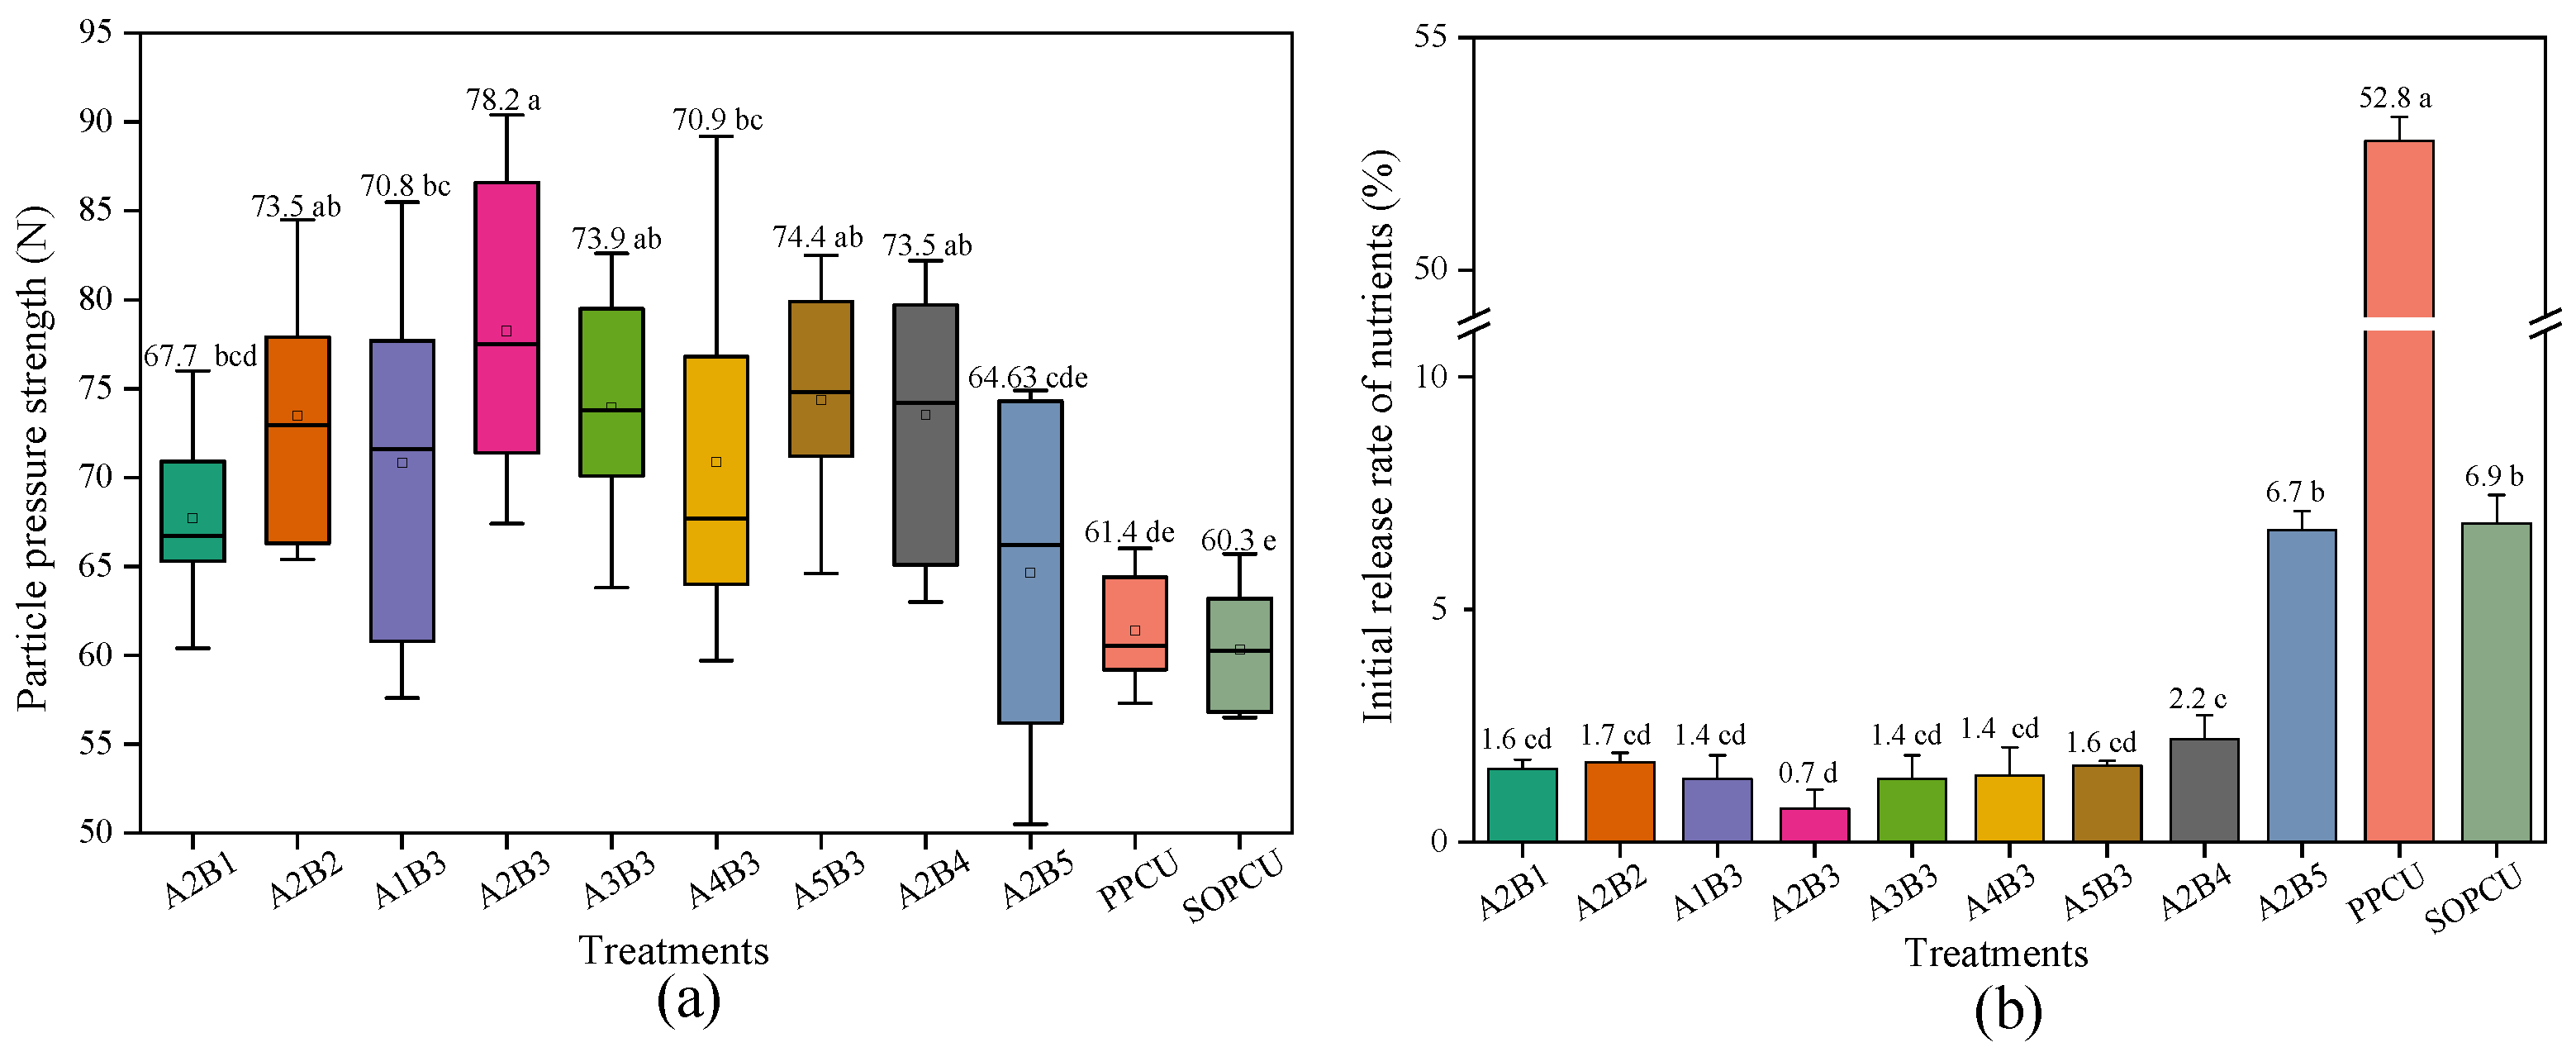
3.4. Hardness and Wear Resistance of CRUs Coated with Different Materials

When the amount of PAPI added to the hard segment was the same, there was no significant difference in particle pressure strength between different amounts of SOP added. This may be because the molar masses of SOP and PP polyols were similar, and the proportion of the two materials varied. Additionally, the soft segment in polyurethane had a small impact on particle pressure strength, so the particle pressure strength of the prepared coated fertilizer was similar [37].
When the addition ratio of polyols was the same, the addition ratio of polyols and PAPI in polyurethane had a significant impact on particle hardness (Figure 7a). The average particle hardness of the isocyanate-based polyurethane coating material (A2B1) formed by excessive hard segments (soft segment/hard segment = 1:1.2) was 67.72 N. The average particle hardness of the hydroxyl-terminated polyurethane coating material (A2B5) formed by excessive soft segments (soft segment/hard segment = 1.6:1) was 64.63 N. When the soft segment/hard segment was 1.2:1 (A2B3), the average particle hardness was the highest at 78.24 N, which was 15.53% and 21.05% higher than A2B1 and A2B5. The particle pressure strength of crosslinked interpenetrating modified CRFs was better than that of single-material CRFs. This was because hydrogen bonds (C=O–N–H) were easily formed between N–H and –C=O in the hard segment, and hydrogen bonds (C–O–N–H) can also be formed between N–H in the hard segment and C–O in the soft segment, which can improve the mechanical strength of the coating material [38]. Too many hard or soft segments are not conducive to the formation of hydrogen bonds. Therefore, the particle pressure strength of the coating material can be optimized by adjusting the proportion of the two additives.
The initial nitrogen release behavior of the coated fertilizer after the wear test was measured under static water cultivation conditions at 25 °C, and the results showed that the integrity of the fertilizer film was effectively damaged during the wear process (Figure 7b). The initial release rate of PP-coated fertilizer increased from 8.8% to 52.78%, an increase of 499.7%. The initial release rate of the SOP-coated fertilizer increased from 1.62% to 6.86%, an increase of 323.5%. By comparison, except for the A2B5 treatment with a 1.6:1 ratio of polyols to PAPI, the initial release rate of the coated fertilizers in other treatments after wear testing was still controlled within 2%. Fertilizers coated with single materials such as SOP or PP have basically lost their controlled-release performance after wear tests, while the nutrient release period of SMPCU significantly decreased, but it still reached a nutrient release time of over 40 days (Figure S3). The network structure formed by the crosslinking and interpenetration of two polyols enhances the toughness of the coating material, thereby reducing wear and extrusion during production and transportation [23,39]. the anti-extrusion ability and wear resistance of particles improved, reducing the coating material damage caused by wear and extrusion during production and transportation, thereby maintaining slow nutrient release.

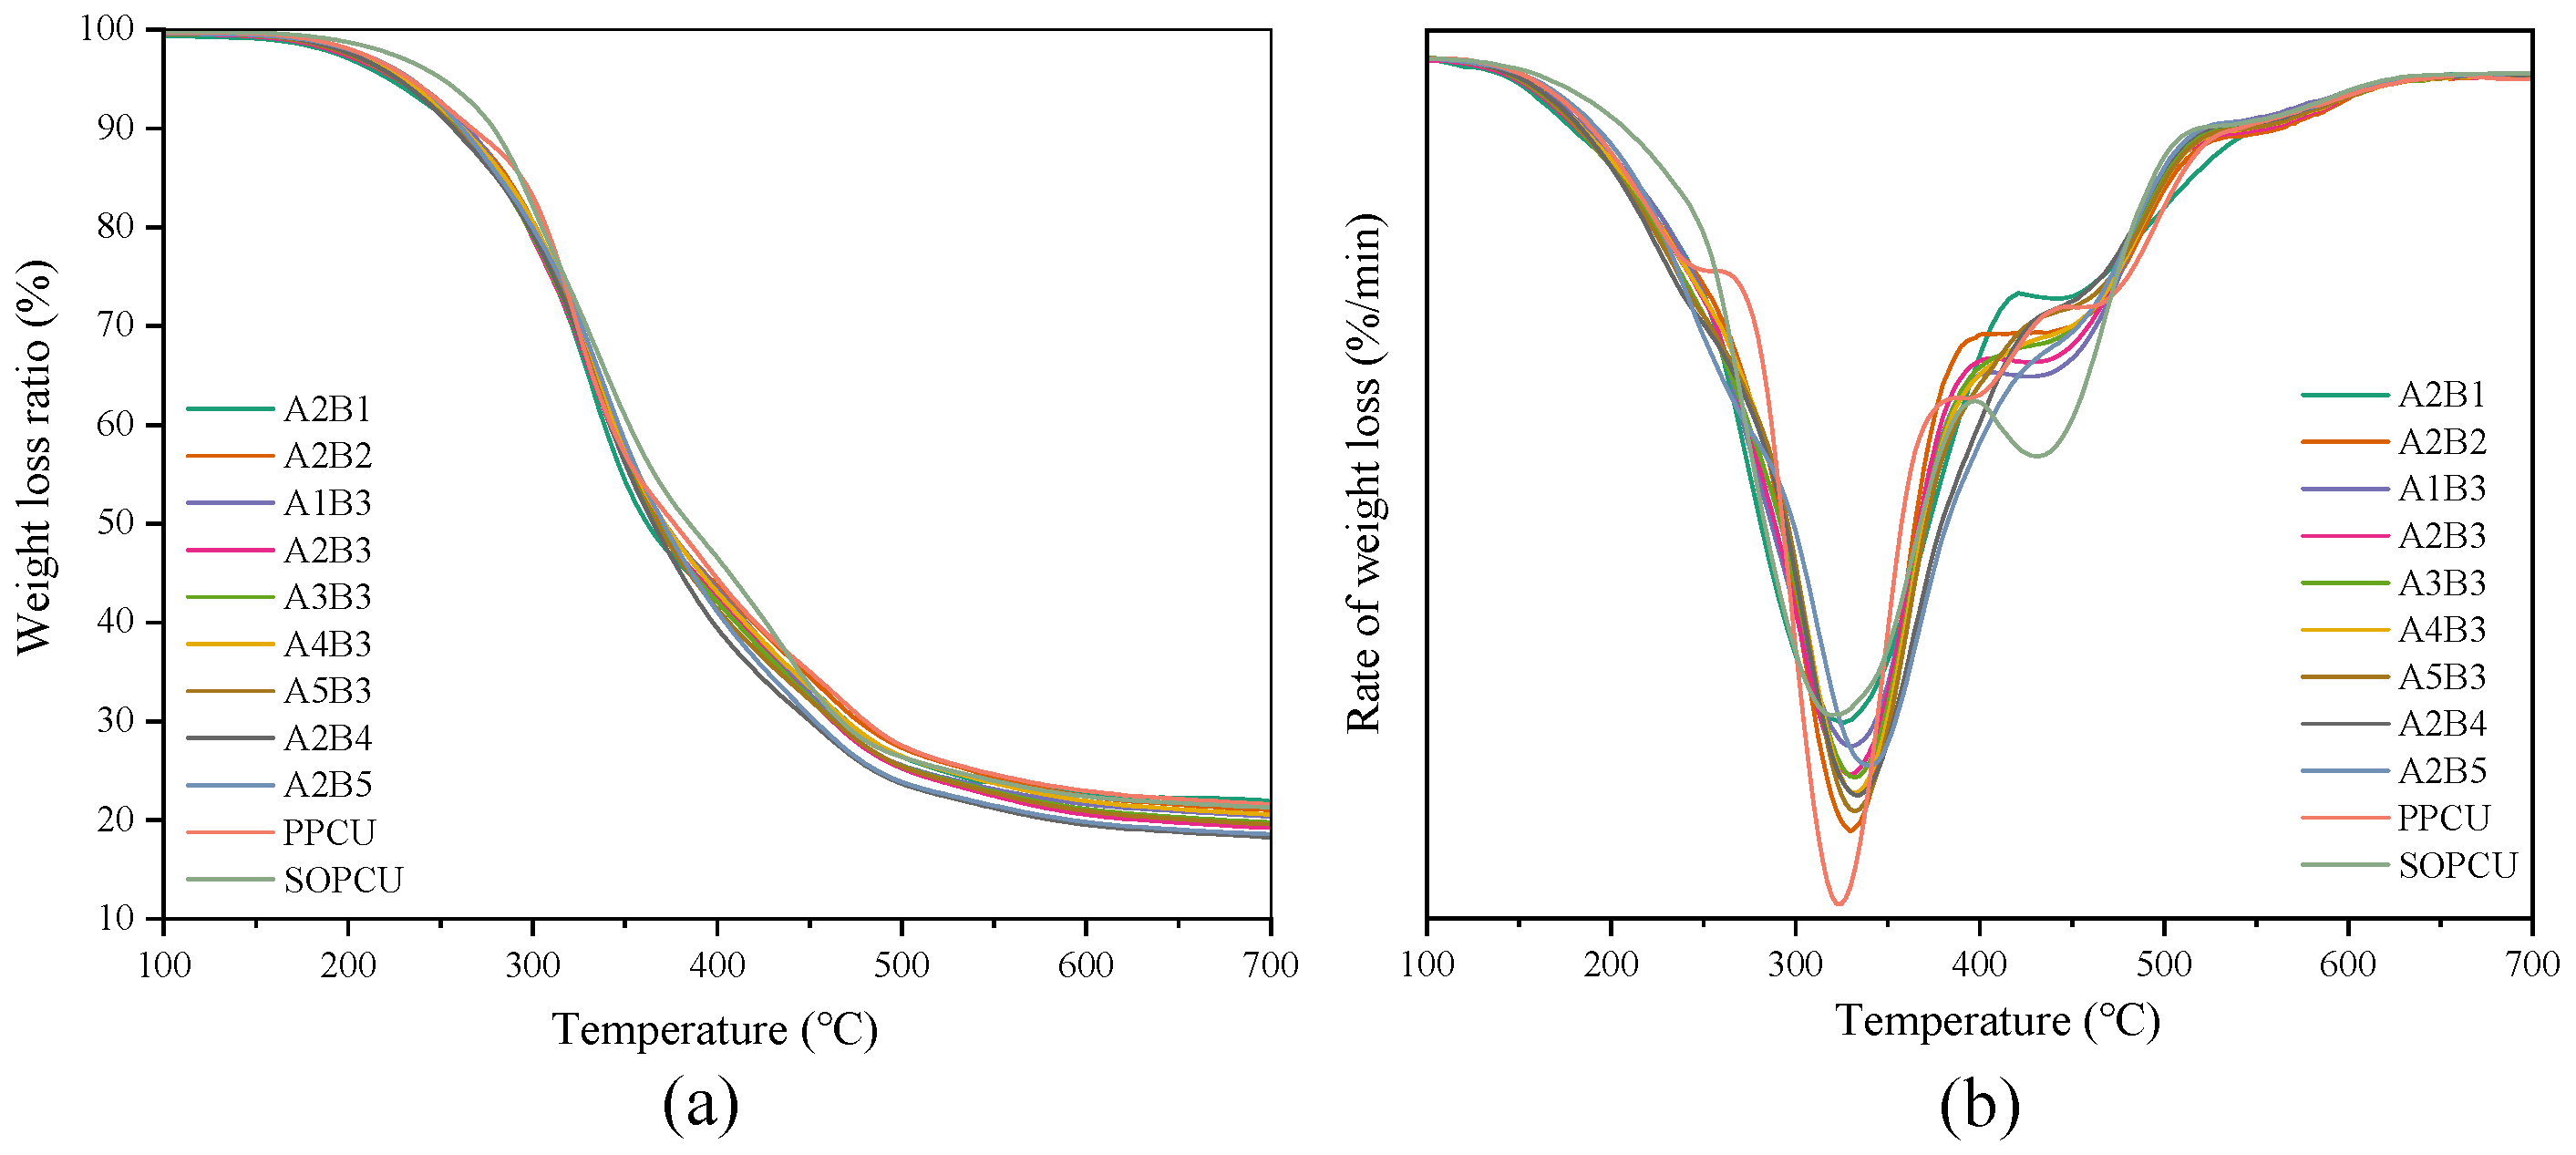
3.5. Thermal Stability Analysis of Coating Materials

The stability and thermal resistance of the produced materials was determined by thermogravimetric analysis TGA. Exemplary thermogravimetric curves presenting the loss of weight (TG) and a weight loss derivative (DTG) of the polyols with different SOP and PAPI contents are shown in Figure 8.
In the polyurethane prepared from SOP polyols, the first peak appears in the temperature range of 112.45–397.44 °C (Table S3), with the highest degradation rate and weight loss of approximately 52.44% (m1) at 320.38 °C (T1). The second peak has a maximum value in the range of 397.44 to 444.67 °C and a weight loss of approximately 12.46% (m2) at 431.67 °C (T2). In the polyurethane prepared from PP polyols, the first peak appears in the temperature range of 113.56–381.81 °C, with the highest decomposition rate and weight loss of about 50.9% (m1) at 322.83 °C (T1). The second peak appears in the range of 381.81 to 442.74 °C, with a maximum value at 396.74 °C (T2) and a weight loss of approximately 9.23% (m2). The first weight loss peak is related to the weight loss of residual water inside the polyurethane and the decomposition of carbamate bonds in the rigid chain segment of the polyurethane [40]. The second weight loss peak was the result of ester bond decomposition in the soft chain segment, which occurs at 431.67 °C, while the decomposition of aromatic compounds begins at 480 °C. The third weight loss peak is mainly the decomposition of the remaining covalent bonds [41]. The thermal stability of coating materials has a direct impact on the release rate of the fertilizer components contained inside. High temperatures can cause the decomposition or deformation of controlled-release fertilizer film materials, thereby affecting the release rate of fertilizer components. Therefore, good thermal stability can ensure that the controlled-release fertilizer film material can still maintain structural integrity in high temperature environments, thereby ensuring the stability of fertilizer release rate.
The thermal stability of coating materials was related to the amount of PAPI added and the composition of polyols. From the thermal weight-loss images of the coating material, it can be seen that as the amount of PAPI added decreased, the final ash content gradually decreased (Figure 8a). As the proportion of polyols gradually increased, the ash content gradually decreased. Moreover, when the ratio of polyols to PAPI was 1.6:1, the ash content was only 17.83%. When the proportion of SOP addition increases, the temperature (T1) corresponding to the maximum weight loss (m1) gradually decreases. In the second weight-loss stage, the temperature (T2) that reached the maximum weight loss rate in this stage gradually increased. After the proportion of SOP decreases from 0.7 to 0.3, the weight loss decreases from 18.92% to 11.64% (Figure 8b). This was because in the second stage, the main decomposition was the ester bonds in the soft segment. SOP was prepared from soybean oil and contained a large amount of lipids fatty acids, triglycerides, and other components; therefore, when there was a high amount of SOP added, a large amount of these substances in the coating material decomposed at this stage.

3.6. Thermal Stability Analysis of Coating Materials

According to the radar diagram shown in Figure 9, it can be seen that the A2B3 treatment was superior to other treatments in terms of Particle pressure intensity, cumulative nutrient release rate of 28 days, and nitrogen release days. According to the degree of adhesion between fertilizer particles and the state of wall adhesion during the coating process, the fertilizer was divided into three levels: excellent, good, and poor. The excellent level was given a score of 90; the good level was given a score of 60; and the poor level, with severe wall adhesion, was only given a score of 30. By comparing the reaction process and reaction time, it was found that the higher the content of polyols and the larger the proportion of SOP in polyols, the smoother the reaction process and faster the reaction speed. A2B3 treatment has the most significant and comprehensive performance, although its reaction time and ash residue are at a moderate level. The lower the degree of adhesion and the faster the reaction rate, the lower the energy consumption during the preparation of coated urea. Good fluidity is beneficial for the sufficient reaction of the coating material to form a smoother and more complete surface. Comprehensive evaluation is beneficial for selecting suitable coating schemes, improving production efficiency, and regulating the controlled-release performance of the product.

4. Conclusions

Soybean oil polyols were used to replace some petrochemical polyols, and polyurethane grafted with plant-based petrochemical polyols were successfully prepared. There were numerous hydrogen bonds and suitable crosslinked networks in these systems. The nitrogen release days of coated urea were regulated within the range of 52 to 137 days, due to the synergistic effect of soybean oil polyols and petrochemical-source polyol copolymerization. According to these experimental tests and obtained results, varying the hard segment content and soft segment length provides an effective method to control the mechanical performance of coating materials. Compared to the cases of excessive hard and soft segments, the particle pressure strength and wear resistance under reasonable R-value conditions increased by 21.05% and 15.53%, respectively, and the wear resistance increased by 121% and 211%. The research results indicate that using soybean-based polyols instead of petrochemical polyols can achieve the same good effect, and the proportion and composition of soft segments can be controlled according to application needs, When the proportion of SOP increased from 0.3 to 0.6, the nitrogen release days were extended by 30.48%. The source, molecular weight, and functionality of polyester polyols have not been discussed in this article. The degradation performance of polyurethane under different levels of SOP addition should also be compared to ensure the controlled release and degradation of the product.

Supplementary Materials

The following supporting information can be downloaded at: https://www.mdpi.com/article/10.3390/agronomy13123008/s1, Figure S1: T N release characteristic curves of 25 groups of SMPCU, PPCU and SOPCU; Figure S2: SEM scans of SMPCU surfaces and cross sections; Figure S3: Nitrogen release curve after wear test; Table S1: Molecular weight of SOP and PP; Table S2: Experimental design of interaction between SOP and polyhydric alcohols: PAPI; Table S3: Sample thermogravimetric data for weight loss (TG) and weight loss derivatives (DTG) of polyols with different SOP and PAPI contents.

Author Contributions

Conceptualization, J.D.; methodology, Z.Z.; software, H.T.; validation, S.C.; formal analysis, X.H.; investigation, M.L.; resources, T.W.; data curation, J.W.; writing—original draft preparation, C.Y.; writing—review and editing, visualization, X.Z.; supervision, Q.C.; project administration, M.Z.; funding acquisition, Z.L. All authors have read and agreed to the published version of the manuscript.

Funding

This study was supported by the Shandong Province Key R&D Plan (Science and Technology Demonstration Project) Project (2022SFGC0301).

Data Availability Statement

The data presented in this study are available upon request from the corresponding author.

Conflicts of Interest

The authors declare no conflict of interest.

References

  1. Akiyama, H.; Yan, X.; Yagi, K. Evaluation of Effectiveness of Enhanced-Efficiency Fertilizers as Mitigation Options for N2O and NO Emissions from Agricultural Soils: Meta-Analysis. Glob. Chang. Biol. 2010, 16, 1837–1846. [Google Scholar] [CrossRef]
  2. Guilpart, N.; Grassini, P.; Sadras, V.O.; Timsina, J.; Cassman, K.G. Estimating Yield Gaps at the Cropping System Level. Field Crops Res. 2017, 206, 21–32. [Google Scholar] [CrossRef]
  3. Guo, J.; Wang, Y.; Blaylock, A.D.; Chen, X. Mixture of Controlled Release and Normal Urea to Optimize Nitrogen Management for High-Yielding (>15 Mg ha−1) Maize. Field Crops Res. 2017, 204, 23–30. [Google Scholar] [CrossRef]
  4. Herdiana, Y.; Wathoni, N.; Shamsuddin, S.; Muchtaridi, M. Drug Release Study of the Chitosan-Based Nanoparticles. Heliyon 2022, 8, e08674. [Google Scholar] [CrossRef] [PubMed]
  5. Wang, Y.; Li, J.; Yang, X. The Diffusion Model of Nutrient Release from Membrane Pore of Controlled Release Fertilizer. Environ. Technol. Innov. 2022, 25, 102256. [Google Scholar] [CrossRef]
  6. Azeem, B.; KuShaari, K.; Man, Z.B.; Basit, A.; Thanh, T.H. Review on Materials & Methods to Produce Controlled Release Coated Urea Fertilizer. J. Control. Release 2014, 181, 11–21. [Google Scholar] [PubMed]
  7. Zhang, M.; Chen, P.; Wang, G.; Dai, T.; Sun, P. Preparation of Bio-Inspired Liquid-Infused Surface on Epoxy Resin Coating for Reliable Hydrophobic and Anti-Corrosion.Properties. Prog. Org. Coat. 2023, 184, 107851. [Google Scholar] [CrossRef]
  8. Vejan, P.; Khadiran, T.; Abdullah, R.; Ahmad, N. Controlled Release Fertilizer: A Review on Developments, Applications and Potential in Agriculture. J. Control. Release 2021, 339, 321–334. [Google Scholar] [CrossRef]
  9. Lu, P.; Zhang, M.; Li, Q.; Xu, Y. Structure and Properties of Controlled Release Fertilizers Coated with Thermosetting Resin. Polym. Plast. Technol. Eng. 2013, 52, 381–386. [Google Scholar] [CrossRef]
  10. Uzoh, C.F.; Onukwuli, O.D.; Ozofor, I.H.; Odera, R.S. Encapsulation of Urea with Alkyd Resin-Starch Membranes for Controlled N2 Release: Synthesis, Characterization, Morphology and Optimum N2 Release. Process Saf. Environ. Prot. 2019, 121, 133–142. [Google Scholar] [CrossRef]
  11. Park, W.J.; Hwangbo, M.; Chu, K.-H. Plastisphere and Microorganisms Involved in Polyurethane Biodegradation. Sci. Total Environ. 2023, 886, 163932. [Google Scholar] [CrossRef]
  12. Badr, E.C.; Ayoub, E.; Mohamed, Z.; Younes, E. Starch-Based Controlled Release Fertilizers: A Review. Int. J. Biol. Macromol. 2023, 238, 124075. [Google Scholar]
  13. Zhou, D.; Choi, P. Molecular Dynamics Study of Water Diffusivity at Low Concentrations in Non-Swollen and Swollen Polyurethanes. Polymer 2012, 53, 3253–3260. [Google Scholar] [CrossRef]
  14. Naz, M.Y.; Sulaiman, S.A. Attributes of Natural and Synthetic Materials Pertaining to Slow-Release Urea Coating Industry. Rev. Chem. Eng. 2017, 33, 293–308. [Google Scholar] [CrossRef]
  15. Echeverria-Altuna, O.; Ollo, O.; Larraza, I.; Elizetxea, C.; Harismendy, I.; Eceiza, A. Development of a Novel Biobased Polyurethane Resin System for Structural Composites. Polymers 2022, 14, 4553. [Google Scholar] [CrossRef] [PubMed]
  16. Liao, Y.; Liu, L.; Wang, M.; Li, L.X.; Cao, B.; Wang, H.; Huang, W.Q. Preparation and Properties of Starch-Based Polyurethane/Montmorillonite Composite Coatings for Controlled-Release Fertilizer. Polym. Compos. 2021, 42, 2293–2304. [Google Scholar] [CrossRef]
  17. Lu, H.; Dun, C.; Jariwala, H.; Wang, R.; Cui, P.; Zhang, H.; Dai, Q.; Yang, S.; Zhang, H. Improvement of Bio-Based Polyurethane and Its Optimal Application in Controlled Release Fertilizer. J. Control. Release 2022, 350, 748–760. [Google Scholar] [CrossRef] [PubMed]
  18. Zhao, Y.; Zhong, K.; Liu, W.; Cui, S.; Zhong, Y.; Jiang, S. Preparation and Oil Adsorption Properties of Hydrophobic Microcrystalline Cellulose Aerogel. Cellulose 2020, 27, 7663–7675. [Google Scholar] [CrossRef]
  19. Audrey, M.; Eric, P.; Vincent, P.; Avérous, L. Evaluation of Biological Degradation of Polyurethanes. Biotechnol. Adv. 2020, 39, 107457. [Google Scholar]
  20. Tian, H.; Liu, Z.; Zhang, M.; Guo, Y.; Zheng, L.; Li, Y.C. Biobased Polyurethane, Epoxy Resin, and Polyolefin Wax Composite Coating for Controlled-Release Fertilizer. ACS Appl. Mater. 2019, 11, 5380–5392. [Google Scholar] [CrossRef]
  21. Chao, Y.; Yu, Z.; Yang, B. Improvement of Thermoregulating Performance for Outlast/Silk Fabric by the Incorporation of Polyurethane Microcapsule Containing Paraffin. Fibers Polym. 2013, 14, 1290–1294. [Google Scholar]
  22. Wang, S.; Huang, R.; Ren, K.; Shen, L.; Li, X.; Lei, G.; Shen, L.; Zhan, Y.; Zheng, Y.; Jiang, L. Structural Control of PEG-Intercalating Na-Bentonite and Its Influence on the Properties of Castor Oil-Based Polyurethane Coating. Prog. Org. Coat. 2023, 178, 107499. [Google Scholar] [CrossRef]
  23. Lawrencia, D.; Wong, S.K.; Low, D.Y.S.; Goh, B.H.; Goh, J.K.; Ruktanonchai, U.R.; Soottitantawat, A.; Lee, L.H.; Tang, S.Y. Controlled Release Fertilizers: A Review on Coating Materials and Mechanism of Release. Plants 2021, 10, 238. [Google Scholar] [CrossRef] [PubMed]
  24. Liu, X.Q.; Yang, Y.C.; Gao, B.; Li, Y.C. Organic silicone-modified transgenic soybean oil as bio-based coating material for controlled-release urea fertilizers. J. Appl. Polym. Sci. 2016, 133, 44097. [Google Scholar] [CrossRef]
  25. Bortoletto-Santos, R.; Ribeiro, C.; Polito, W.L. Controlled release of nitrogen-source fertilizers by natural-oil-based poly (urethane) coatings: The kinetic aspects of urea release. J. Appl. Polym. Sci. 2016, 133, 43790. [Google Scholar] [CrossRef]
  26. Yilgor, I.; Eynur, T.; Yilgor, E.; Wilkes, G.L. Contribution of Soft Segment Entanglement on the Tensile Properties of Silicone–Urea Copolymers with Low Hard Segment Contents. Polymer 2009, 50, 4432–4437. [Google Scholar] [CrossRef]
  27. Bortoletto-Santos, R.; Cavigelli, M.A.; Montes, S.E.; Schomberg, H.H.; Le, A.; Thompson, A.I.; Kramer, M.; Polito, W.l.; Ribeiro, C. Oil-based polyurethane-coated urea reduces nitrous oxide emissions in a corn field in a Maryland loamy sand soil. J. Clean. Prod. 2020, 249, 119329. [Google Scholar] [CrossRef]
  28. Wu, Q.; Zhang, P.; Zhang, Y.; Fan, B.; Zhu, M.; Wu, Z. Thermoplastic Starch Modified with Hydrophobic Polyurethane Microparticles. Starke 2011, 63, 373–380. [Google Scholar] [CrossRef]
  29. Li, S.; Bouzidi, L.; Narine, S.S. Polyols from Self-Metathesis-Generated Oligomers of Soybean Oil and Their Polyurethane Foams. Eur. Polym. J. 2017, 93, 232–245. [Google Scholar] [CrossRef]
  30. Lozada, Z.; Suppes, G.J.; Hsieh, F.-H.; Lubguban, A.; Tu, Y.-C. Preparation of Polymerized Soybean Oil and Soy-Based Polyols. J. Appl. Polym. Sci. 2009, 112, 2127–2135. [Google Scholar] [CrossRef]
  31. Li, R.; Loontjens, J.A.T.; Shan, Z. The varying mass ratios of soft and hard segments in waterborne polyurethane films: Performances of thermal conductivity and adhesive properties. Eur. Polym. J. 2019, 112, 423–432. [Google Scholar] [CrossRef]
  32. Fakhar, A.; Sadeghi, M.; Dinari, M.; Lammertink, R. Association of hard segments in gas separation through polyurethane membranes with aromatic bulky chain extenders. J. Membr. Sci. 2019, 574, 136–146. [Google Scholar] [CrossRef]
  33. Oprea, S. The Effect of Chain Extenders Structure on Properties of New Polyurethane Elastomers. Polym. Bull. 2010, 65, 753–766. [Google Scholar] [CrossRef]
  34. Oprea, S.; Potolinca, V.O.; Oprea, V. Synthesis and Properties of New Crosslinked Polyurethane Elastomers Based on Isosorbide. Eur. Polym. J. 2016, 83, 161–172. [Google Scholar] [CrossRef]
  35. Pietrzak, K.; Kirpluks, M.; Cabulis, U.; Ryszkowska, J. Effect of the Addition of Tall Oil-Based Polyols on the Thermal and Mechanical Properties of Ureaurethane Elastomers. Polym. Degrad. Stab. 2014, 108, 201–211. [Google Scholar] [CrossRef]
  36. Mizera, K.; Ryszkowska, J. Polyurethane Elastomers from Polyols Based on Soybean Oil with a Different Molar Ratio. Polym. Degrad. Stab. 2016, 132, 21–31. [Google Scholar] [CrossRef]
  37. Huang, H.; Pang, H.; Huang, J.; Yu, P.; Li, J.; Lu, M.; Liao, B. Influence of Hard Segment Content and Soft Segment Length on the Microphase Structure and Mechanical Performance of Polyurethane-Based Polymer Concrete. Constr. Build Mater. 2021, 284, 122388. [Google Scholar] [CrossRef]
  38. Sun, Y.; Sheng, D.; Wu, H.; Tian, X.; Xie, H.; Shi, B.; Liu, X.; Yang, Y. Bio-Based Vitrimer-like Polyurethane Based on Dynamic Imine Bond with High-Strength, Reprocessability, Rapid-Degradability and Antibacterial Ability. Polymer 2021, 233, 124208. [Google Scholar] [CrossRef]
  39. Das, B.; Konwar, U.; Mandal, M.; Karak, N. Sunflower Oil Based Biodegradable Hyperbranched Polyurethane as a Thin Film Material. Ind. Crops Prod. 2013, 44, 396–404. [Google Scholar] [CrossRef]
  40. Rueda-Larraz, L.; d’Arlas, B.F.; Tercjak, A.; Ribes, A.; Mondragon, I.; Eceiza, A. Synthesis and microstructure–mechanical property relationships of segmented polyurethanes based on a PCL–PTHF–PCL block copolymer as soft segment. Eur. Polym. J. 2009, 45, 2096–432109. [Google Scholar] [CrossRef]
  41. Ye, L.; Meng, X.-Y.; Ji, X.; Li, Z.-M.; Tang, J.-H. Synthesis and Characterization of Expandable Graphite–Poly(Methyl Methacrylate) Composite Particles and Their Application to Flame Retardation of Rigid Polyurethane Foams. Polym. Degrad. Stab. 2009, 94, 971–979. [Google Scholar] [CrossRef]
Figure 1. Picture of coated urea particles and picture of membrane shell after nutrient release.
Agronomy 13 03008 g001
Figure 2. Characterization diagram of SOP, PP, and PAPI. (a) Infrared characteristic curves of soybean oil polyol (SOP), polyester polyol (PP), polyaryl polymethylene isocyanate (PAPI); (b) molecular weight maps of soybean oil polyol (SOP) and polyester polyol (PP).
Agronomy 13 03008 g002
Figure 3. FTIR spectra of SMPCU, PPCU, and SOPCU coating materials, the numbers represent individual processes. Note: The number in the figure represents the processing number.
Agronomy 13 03008 g003
Figure 4. Infrared curve analysis diagram of coating material. Curve fitting of SMPCU coating material in the expanded zone: (a) A2B1; (b) A2B2; (c) A2B3; (d) A2B4; (e) A2B5; (f) carbonyl group stretching band of the multiplet structure in the FTIR spectrum of A2B3.
Agronomy 13 03008 g004
Figure 5. The nitrogen release behaviors of coated urea with different PP:SOP ratios (a) and different polyols: PAPI (b); Contour plots of PP: SOP and polyols: PAPI for nitrogen release days, Among them, 25 treatments correspond to 25 treatments, and the corresponding treatment plan can be found by the location of the black dot (c); Water contact angle of different coated urea (d). Note: The numbers in (d) represent the average value. Means within each column followed by the same letters were not significantly different based on a one-way ANOVA followed by Duncan’s multiple-range tests (p > 0.05).
Agronomy 13 03008 g005
Figure 6. SEM scans of SMPCU surfaces (rows I, II, IV, and V) and cross sections (rows III and VI). Magnification of 1000 times (columns I and IV), magnification of 5000 times (columns II and V), and magnification of 2000 times (columns III and VI). The numbers in the figure correspond to each other: (a) A2B1; (b) A1B3; (c) A2B2; (d) A5B3; (e) A2B5; (f) PPCU; (g) SOPCU.
Agronomy 13 03008 g006
Figure 7. Particle strength of coated urea (a); initial nitrogen release rate of coated urea after wear test (b). Note: The numbers in (b) represent the average value, the square represents the mean, and the horizontal line represents the median Means within each column followed by the same letters were not significantly different based on one-way ANOVA followed by Duncan’s multiple-range tests (p > 0.05).
Agronomy 13 03008 g007
Figure 8. Thermogravimetric analysis of the SMPCU, PPCU, and SOPCU (a), Thermal analysis curves of the SMPCU, PPCU, and SOPCU (b).
Agronomy 13 03008 g008
Figure 9. (a,b) Radar diagram of synthetic properties of SMPCUs.
Agronomy 13 03008 g009
Table 1. Experimental factors and levels.
CodeAB
10.71:1.2
20.61:1
30.51.2:1
40.41.4:1
50.31.6:1
A refers to the proportion of SOP (%), and B represents the ratio of polyols to PAPI.
Table 2. Results of the FTIR spectral analysis of tested materials.
Sample CodeAH-bonded C=OAfree C=OHBIDPS
A2B122,278.0024,553.791.100.52
A2B224,435.6226,736.521.090.52
A1B326,267.4028,785.071.100.52
A2B329,152.7830,263.881.040.51
A3B330,183.8433,652.631.110.53
A4B332,394.9833,433.701.030.51
A5B316,595.9018,170.091.090.52
A2B413,416.5814,922.811.110.53
A2B511,703.0013,909.001.190.54
SOPCU19,821.8421,211.181.070.52
PPCU19,101.5420,354.391.070.52
Disclaimer/Publisher’s Note: The statements, opinions and data contained in all publications are solely those of the individual author(s) and contributor(s) and not of MDPI and/or the editor(s). MDPI and/or the editor(s) disclaim responsibility for any injury to people or property resulting from any ideas, methods, instructions or products referred to in the content.

