Article

Genome-Wide Analysis and Expression of MYC Family Genes in Tomato and the Functional Identification of slmyc1 in Response to Salt and Drought Stress

Faculty of Life Science and Technology, Kunming University of Science and Technology, Jingming South Street, Kunming 650224, China
*
Author to whom correspondence should be addressed.
Agronomy 2023, 13(3), 757; https://doi.org/10.3390/agronomy13030757
Submission received: 11 January 2023 / Revised: 4 February 2023 / Accepted: 5 February 2023 / Published: 5 March 2023
(This article belongs to the Special Issue Progress in Horticultural Crops - from Genotype to Phenotype)

Abstract

:
Myelocytomatosis (MYC) transcription factors are crucial mediators of the jasmonate signaling pathway, which mediates the growth and developmental processes of plants. However, the function of MYC genes in tomato, Solanum lycopersicum (SlMYC), remains poorly understood. In this study, we have identified 14 non-redundant SlMYC genes across the genome of tomatoes. Six of the twelve chromosomes included these genes, and four syntenic pairs of SlMYC were identified. According to the results of phylogenetic analysis, 14 SlMYC genes were clustered into classes I, II, III, and IV, and their functional domains were predicted. The SlMYC upstream promoter region contained a variety of light-, stress-, and hormone-response regulatory elements. The expression of the 14 SlMYC genes differed significantly across organs. SlMYCs primarily showed an upregulation trend after methyl jasmonate (MeJA) treatment. In contrast, after treatment with sodium chloride (NaCl), SlMYCs showed a trend of downregulation. However, there were differences in the expression patterns of SlMYCs after mannitol treatment. Using clustered regularly interspaced short palindromic repeats/Cas 9 (CRISPR/Cas 9) technology, the loss-of-function of SlMYC1 (slmyc1) was obtained. The slmyc1 tomato plants demonstrated reduced resistance to NaCl and mannitol stress compared to wild-type plants due to their shorter root length and higher reactive oxygen species (ROS) content. In brief, this study provides valuable information about the taxonomy of the SlMYC genes in tomato. It establishes a foundation for future research on the mechanism by which SlMYC influences plant development and stress response.

1. Introduction

The basic helix–loop–helix (bHLH) family is the second largest transcription factor family in plants. Myelocytomatosis (MYC), a subfamily of the bHLH family, has an N-terminal bHLH_MYC_N region and a C-terminal bHLH region. The bHLH region is a dimerization domain composed of a helix of hydrophobic amino acid residues connected by distinct loops [1]. It is a DNA-binding domain that enables the attachment of HLH proteins to an E-box [2,3]. In addition, bHLH domains allow for the development of homodimeric or heterodimeric complexes and protein–protein interactions [2]. MYC transcription factors are a core regulator in the jasmonic acid signaling pathway [4]. As oxylipin phytohormones, jasmonates (JAs) play a crucial role in plant growth, development, and stress response by reprogramming gene expression across the genome [5,6,7]. JA zinc-finger inflorescence meristem (ZIM) domain (JAZ) proteins act as JA signaling pathway repressors.
The MYC gene plays a role in several physiological phases of plants, particularly in the growth and development of distinct species [8]. In rice (Oryza sativa L.), OsMYC2 is expressed in all plant tissues; in particular, a higher level of expression is evident in spikelets and floral organs [9]. OsMYC2 regulates rice spikelet development through interactions with OsJAZ1 and the activation of downstream genes [10]. MYC genes have been extensively studied in Arabidopsis sp. They regulate leaf senescence, root development, and stamen development and play a role in seed production and development, seed protein accumulation, and chlorophyll degradation [11,12,13,14,15]. In addition, studies have demonstrated that overexpression of MYC3 and MYC4 in Arabidopsis sp. results in increased anthocyanin accumulation [16]. MYC2, MYC3, and MYC4 could regulate the biosynthesis of glucosinolates [17]. In grasses, MYC1 of barley and wheat regulates the biosynthesis of anthocyanin in the pericarp [18,19]. MYC genes also play an essential role in the response to abiotic stress. In Arabidopsis sp., overexpressed AtMYC2 could enhance salt tolerance [20], and AtMYC67 and AtMYC70 could enhance cold tolerance [21]. In addition, MYCs activate the JA signaling pathway by binding to the G-box sequence of the downstream gene promoter [22,23,24,25,26]. AtMYC2 plays an important role in the JA-induced activation of defense genes [27]. In addition, the MYC1 gene in tomato (SlMYC1) could affect the relationship between JA and gibberellin hormone signal transduction; it could also affect pathogen defense [28]. SlMYC1 could play a crucial role in the morphological development of type VI trichomes as well as in the division and proliferation of glandular cells [29,30]. MYC1 and MYC2 have a dual role in the regulation of constitutive and stress-inducible specialized metabolism in tomato [31].
Until presently, the MYC gene family has been identified in multiple species such as 26 TaMYC of Triticum aestivum, 7 OsMYC of Oryza sativa, 7 BdMYC of Brachypodium distachyon, and 8 ZmMYC of Zea mays [8]. However, the bioinformatics analysis of the SlMYC family has not been documented. Using bioinformatics methods, 14 members of the tomato MYC gene family were identified. Their phylogenetic relationships, protein-conserved motifs, chromosome structure analysis, and localization were then thoroughly examined. Finally, the expression profiles of SlMYC genes were determined using real-time quantitative PCR in various organs and under stress treatment with methyl jasmonate (MeJA), sodium chloride (NaCl), and mannitol. Using clustered regularly interspaced short palindromic repeats/Cas 9 (CRISPR/Cas 9), the mutant of SlMYC1 was obtained, and reduced salt and mannitol resistance was observed. This study established a foundation for further research into the role of the tomato MYC gene under abiotic stress.

2. Materials and Methods

2.1. Plant Materials and Treatments

Tomato seeds were soaked in warm water at 55 °C for 1 to 2 h. The seeds were placed in a Petri dish covered with two layers of wet filter paper and germinated in an incubator (BIOBASE, China) at 28 °C. Following 80% germination, the seeds were planted on perlite, covered with perlite, and sprayed with tomato nutrient solution, including Ca(NO3)2·4H2O 590 mg·L−1, KNO3 404 mg·L−1, KH2PO4 136 mg·L−1, MgSO4·7H2O 246 mg·L−1, EDTA·Na2-Fe 40 mg·L−1, H3BO3 2.86 mg·L−1, MnSO4·4H2O 2.13 mg·L−1, ZnSO4·7H2O 0.22 mg·L−1, CuSO4·5H2O 0.08 mg·L−1, (NH4)6Mo7O24·4H2O 0.02 mg·L−1. The tomato seedlings were transferred to a 4 L square pot for hydroponic growth once they had produced a true leaf. The roots, stems, leaves, flowers, immature fruit, and mature fruits were collected for tissue analysis during the growth stage. When the tomato seedlings had three leaves, they were treated for 3 h, 6 h, and 12 h with 150 mM NaCl, 100 µM MeJA, or 100 mM mannitol (Sangon Biotech., Shanghai, China), and their leaves were collected. Meanwhile, another set of plants that had not been exposed to any stress was utilized as a control.

2.2. Identification and Characterization of the Tomato MYC Transcription Factors

The hidden Markov model (HMM) of the bHLH-MYC_N domain (PF14215) and HLH domain (PF00010) and the characteristics of MYCs were retrieved from the Pfam website. A Venn diagram was created using TBtools (v1.112) [32]. The tomato genome files (SL3.0) were downloaded from the database of the National Center for Biotechnology Information (NCBI) (https://www.ncbi.nlm.nih.gov/) (accessed on 20 September 2021.), and MYC protein sequences were obtained (with an E-value cutoff of 0.005) from the tomato genome employing BLAST and hmm search functions; thereafter, the bHLH-MYC_N and HLH domains were further determined using Pfam analysis. Based on the database accession, the number of proteins and the nucleotide and genomic sequences of each TaMYC, NtMYC, and AtMYC gene copy were validated [8]. The theoretical predicted isoelectric point (PI), molecular weight (Da), and grand average of hydropathy (GRAVY) of the SlMYC protein were examined by the online analysis software Expasy (http://www.expasy.ch/tools/protparam.html) (accessed on 21 September 2021).

2.3. Protein Sequence, Phylogenesis, Gene Structure, Mapping MYC Genes, and Subcellular Localization of SlMYC Analyses

The structural and functional domains of SlMYC were analyzed. The coding sequence of SlMYC was obtained from the transcriptome (https://www.ncbi.nlm.nih.gov/refseq) (accessed on 22 September 2021.). Using Pfam (http://pfam.xfam.org/) (accessed on 24 September 2021.) and HMMER (https://www.ebi.ac.uk/Tools/hmmer/) (accessed on 24 September 2021.), the protein domain of SlMYC was predicted. The protein sequences of bHLH-MYC_ N and HLH domains were determined using the multiple sequence alignment of cluster omega and visualization of jalview software (2.11.1.4). The tree was visualized using the iTol online website (https://itol.embl.de/tree/) (accessed on 28 September 2021.), which was built using adjacency joining (NJ) and 1000 repeat bootstrap methods. The phylogenetic tree and conserved protein domain of SlMYC were visualized using the MEGAX program (1.0.0.0) and TBtools (v1.112), respectively. The exon and intron structure, as well as the conserved protein domain of the MYC gene, were determined with gene structure display server 2.0 (http://mg2c.iask.in/mg2c_v2.1/) (accessed on 5 October 2021.) using information from the genome database. The location of SlMYC on the tomato chromosome and the synteny relationship were determined through TBtools software (v1.112). Subcellular localization prediction was examined through the online analysis Cell-PLoc 2.0 (http://www.csbio.sjtu.edu.cn/bioinf/Cell-PLoc-2/) (accessed on 8 March 2022).

2.4. Analysis of cis-Regulatory Elements of the SlMYC

To analyze cis-elements in the SlMYC promoters, 2000 base pair (bp) sequences upstream of the transcription start sites of the SlMYC genes were obtained from the genomic sequence of tomato, and cis-acting elements were predicted in these sequences employing PlantCARE (http://bioinformatics.psb.ugent.be/webtools/plantcare/html/) (accessed on 15 February 2022).

2.5. Gene Expression Analysis

Using the EastepTM Universal RNA Extraction Kit (Promega, Shanghai, China), total RNA was extracted from leaves of various treatments (Promega, Shanghai, China). All of the quantitative real-time PCR (qRT-PCR) primers were designed using the NCBI online program Primer-BLAST (https://www.ncbi.nlm.nih.gov/tools/primer-blast/) (accessed on 2 April 2022). qRT-PCR was performed in three technical repetitions with complementary DNAs (cDNAs) synthesized from three biological replicates of leaves. The relative expression of specific genes was quantified using the 2−ΔΔCt method, and the SlActin gene was used as a constitutive internal control. These primer sequences are listed in Supplemental Table S1.

2.6. Plasmid Construction, Plant Transformation, and Mutant Analysis

The CRISPR-Cas9 technique was performed in accordance with an earlier study [33]. SlMYC1 mutant primers were designed using the CRISPR-Cas9 website (http://crispr.hzau.edu.cn/cgi-bin/CRISPR2/CRISPR) (accessed on 5 November 2019.). The primer sequences are listed in Supplemental Table S2. After that, pHEE401E-pME6DT1DT2 was used as a template for PCR amplification, and the amplified band was 600–700 bp in size. The PCR product was mixed with the final vector pHEE401E to cut and ligate (15 cycles of 37 °C for 5 min, 10 °C for 5 min, 20 °C for 5 min, and 37 °C for 5 min). The plasmid was then transformed into “Alisa Craig” tomato using Agrobacterium LBA4404-mediated transformation. The transgenic tomato was selected using hygromycin resistance.
In order to identify transgenic tomatoes, we designed primers (forward primer: 5′-ATGACGGACTATAGATTA-3′; reverse primer: 5′-TTTCATCGCGATTCAGCA-3′). Tomato genomic DNA was extracted using the cetyltrimethylammonium bromide (CTAB) method [34]. Genomic DNA was employed as the template for PCR amplification. The PCR products were electrophoresed to confirm their sizes and sequenced.

2.7. Salt and Mannitol Treatments to slmyc1 Seeds

The slmyc1 seeds were soaked in warm water for 1 to 2 h at 55 °C. The soaked seeds were subsequently placed in Petri dishes covered with two layers of filter paper and allowed to germinate in an incubator at 28 °C. The germinated slmyc1 and Ailsa Craig (AC) seeds were subjected to nutrient solution added to 100 mM NaCl or 100 mM mannitol (Sangon Biotech., Shanghai, China) treatment for 96 h. A tomato nutrient solution was employed as a control (CK). As the last step, the root length was measured, and the contents of reactive oxygen species (ROS) in root tips were examined with 2,7-dichlorodihydrofluorescein diacetate (H2 DCF-DA) [35]. The root tip of the tomato seedlings was cut into approximately 0.5 cm–1 cm with scissors, rinsed with pure water, and placed in an EP tube containing 2 µM H2DCFDA (Beyotime Biotech., Shanghai, China) for 30 min in the dark. The root tip was then immersed three times in a 20 mM HEPES-KOH (pH 7.8) buffer solution (Beyotime Biotech., China) for 45 min. The rinsed sample was photographed under a fluorescence microscope.

2.8. Statistical Analysis

All data represent the average of three biological replicates ± standard deviation (SD). One-way analysis of variance (ANOVA) of the t-test was performed on the data. (p-values < 0.05 are summarized with one asterisk, and p-values < 0.01 are summarized with two asterisks).

3. Results

3.1. Identification and Characterization of SlMYC Genes

SL3.0 tomato genome annotations for both bHLH-MYC_N and HLH domains were scanned. Approximately 199 HLH domain-containing genes and 32 bHLH-MYC_N domain-containing genes were identified, and 17 candidates of SlMYC were found in both groups (Figure S1). We retrieved 14 SlMYC genes upon removing the redundant genes. The SlMYC genes were assigned their respective names and chromosomal locations (SlMYC1-SlMYC12) (Table 1). The coding sequence length of the SlMYC genes ranged between 1182 (SlMYC2-like-1) and 2070 (SlMYC4) bp. The length of predicted proteins ranged between 393 (SlMYC2-like-2) and 689 (SlMYC2) amino acids. The molecular weight ranged from 45.11 (SlMYC2-like-2) to 75.69 (SlMYC12) kDa, while the theoretical PI ranged from 5.10 (SlMYC12) to 8.4 (SlMYC11). It was expected that all SlMYCs would remain in the nucleus, implying that they could act as transcription factors in regulating plant-specific processes. All values of GRAVY were <0, indicating that all SlMYC proteins are hydrophilic.

3.2. Chromosomal Localization and Synteny Relationship of SlMYC Genes

The chromosomal location of each SlMYC gene was determined according to the genomic sequence of the tomato. A total of 14 SlMYC genes were located on 6 of the 12 chromosomes (Figure 1). The maximum number of SlMYC genes was found in chromosome 8, which comprised six SlMYC genes. Two SlMYC genes were found in chromosomes 1, 5, and 10. A single SlMYC gene was located in chromosomes 6 and 9. Five syntenic pairs of SlMYC were identified and linked by colored lines.

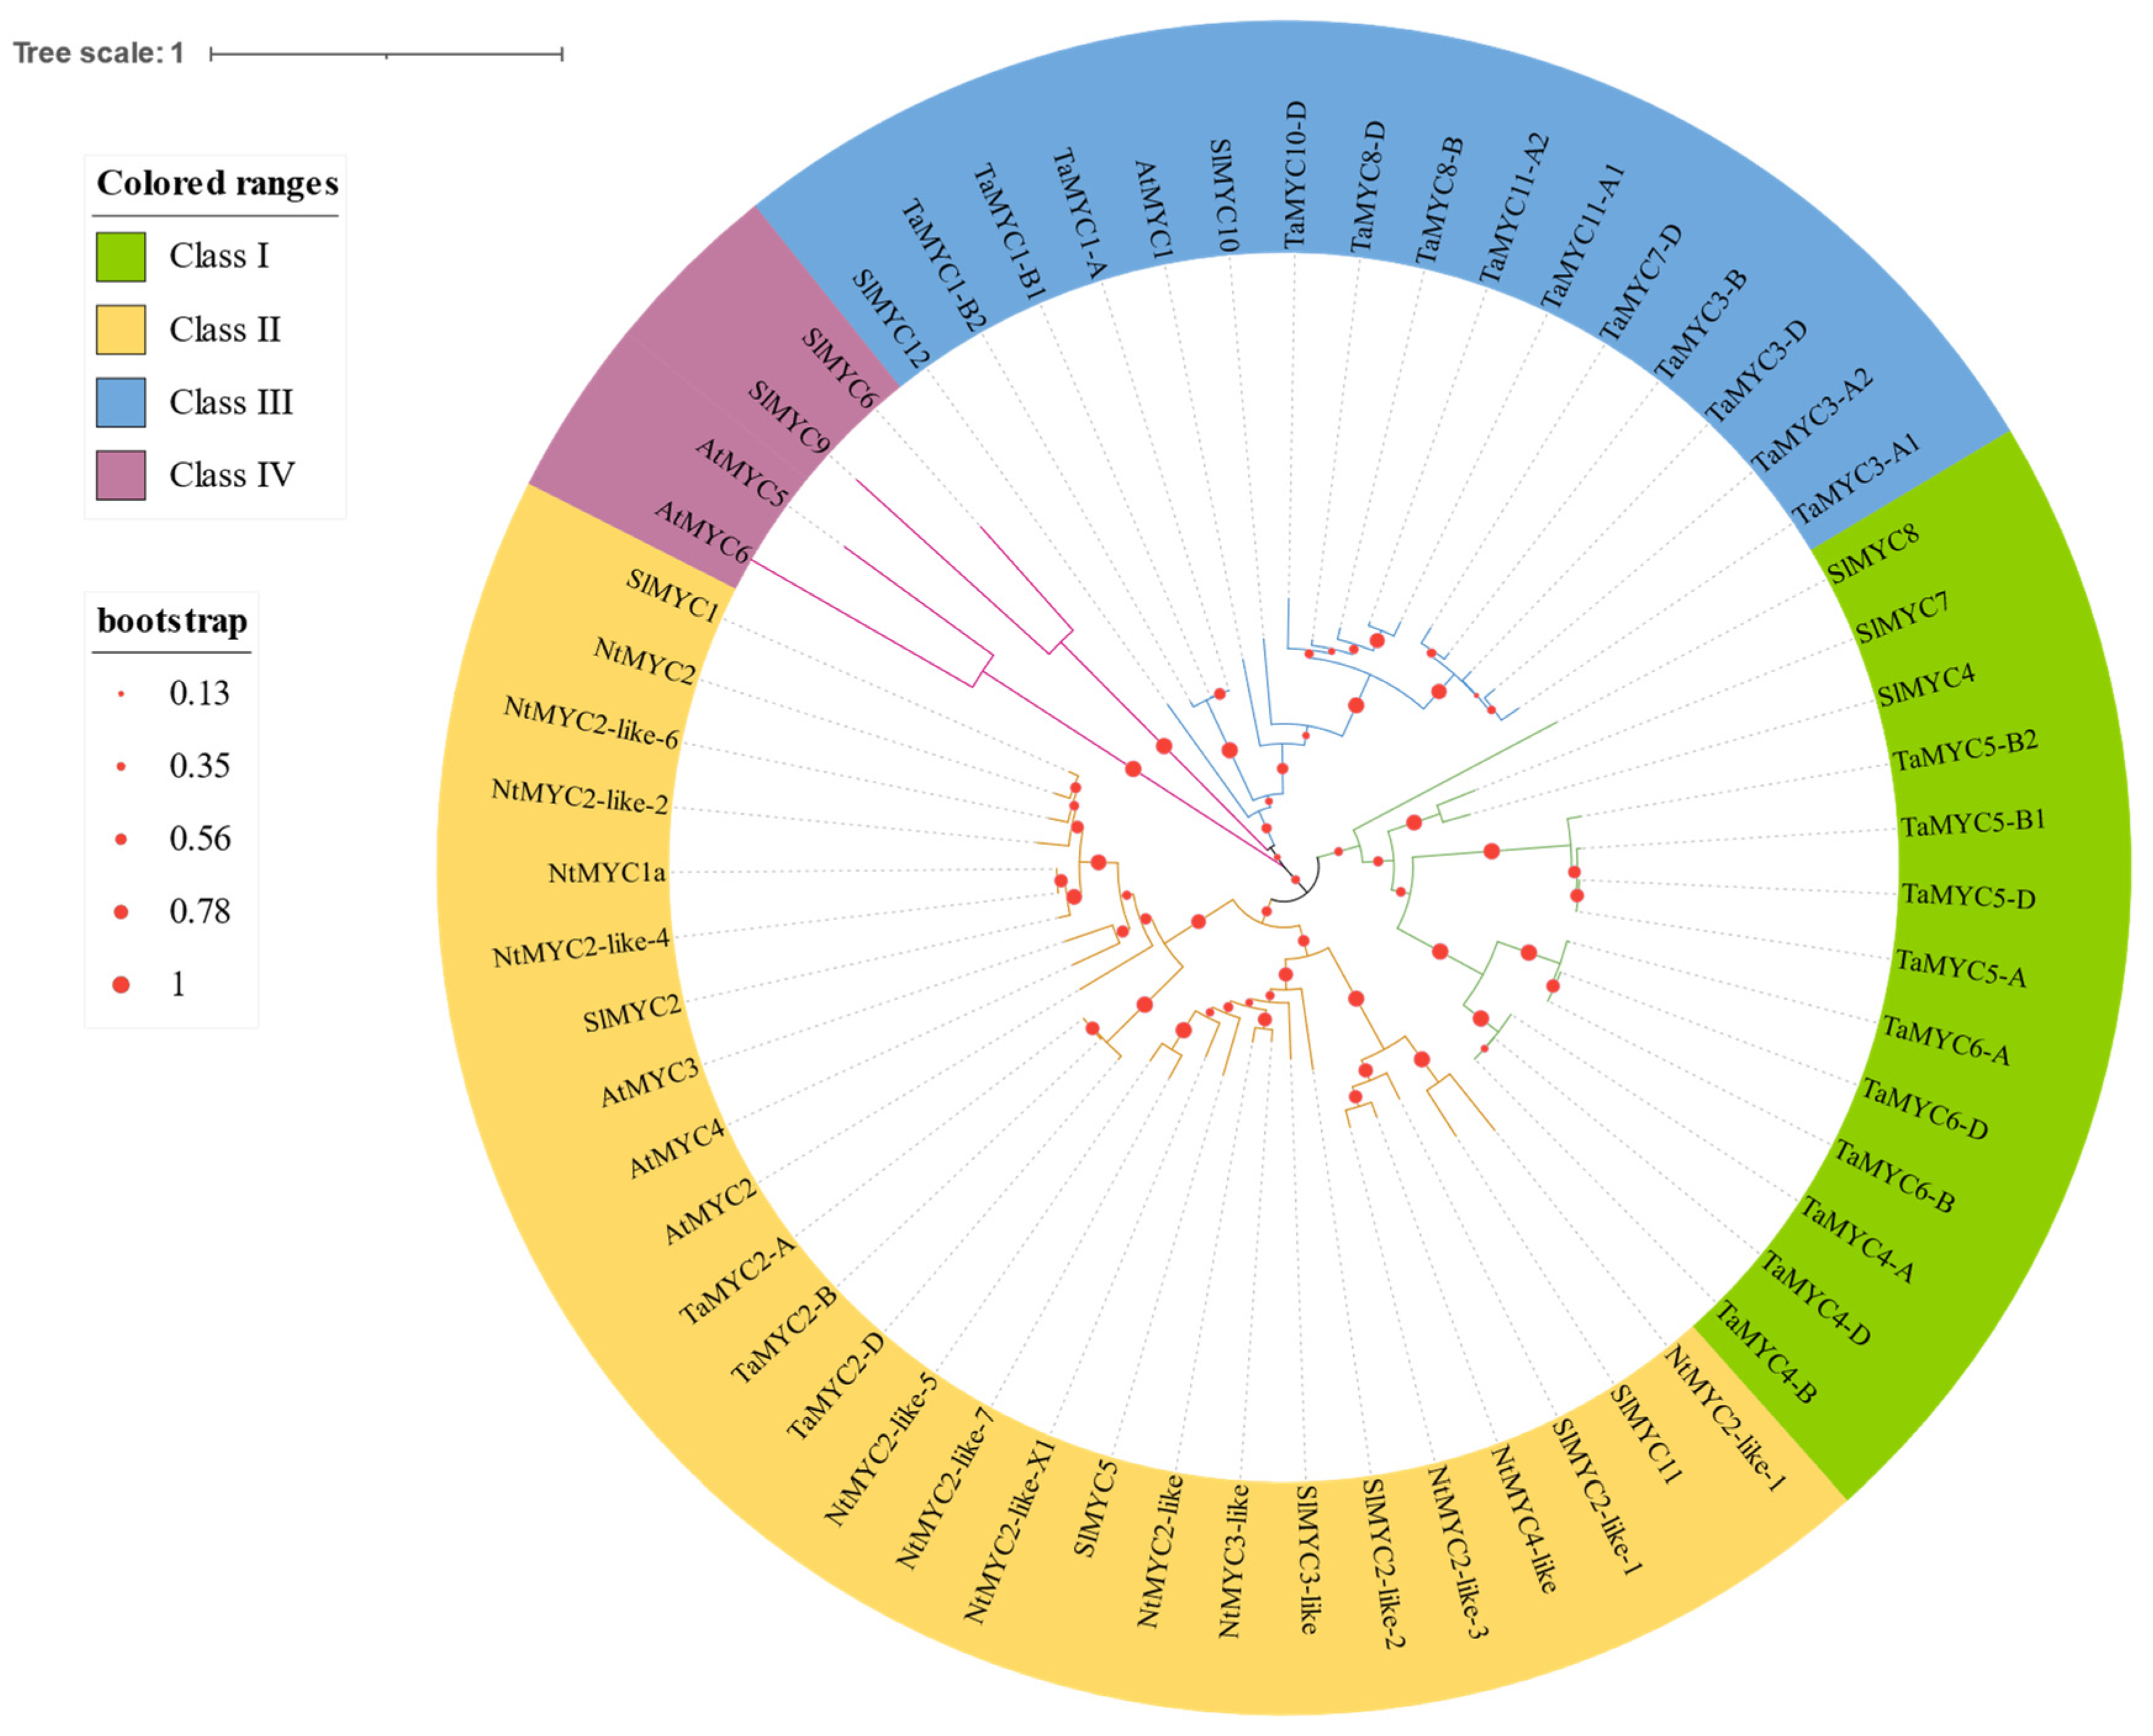
3.3. Phylogenetic Analysis of SlMYC Proteins

All of the SlMYCs were expected to remain in the nucleus, implying that they could act as transcription factors in the regulation of plant-specific processes. The SlMYC proteins were categorized into four groups based on the expression of conserved motifs (Figure 2), such as class I (SlMYC4, SlMYC7, and SlMYC8), class II (SlMYC1, SlMYC2, SlMYC2-like-1, SlMYC2-like-2, SlMYC3-like, SlMYC5, and SlMYC11), class III (SlMYC10 and SlMYC12), and class IV (SlMYC6 and SlMYC9).

3.4. Conserved Motifs and SlMYC Protein Sequence Alignment

The top seven potential conserved motifs in SlMYCs from diverse classes were identified using the MEME software. SlMYC proteins belonging to the same class shared similar motifs. Class I (SlMYC1, SlMYC2, SlMYC2-like-1, SlMYC2-like-2, SlMYC3-like, SlMYC5, and SlMYC11) exhibited five to seven motifs. Class II (SlMYC4, SlMYC7, and SlMYC8) exhibited six to seven motifs. Class III (SlMYC10 and SlMYC12) had five motifs. In comparison, Class IV (SlMYC6 and SlMYC9) had the lowest number of motifs with three to four motifs, indicating that proteins on the same branches might have substantially similar functions (Figure 3A). Motifs three, four, five, and seven corresponded to the bHLH-MYC_N domains. In contrast, motif one corresponded to the bHLH domain (Figure 3A,B). The bHLH_MYC_N and bHLH domains are located at the N- and C-termini of the MYC family, respectively (Figure 3C). An extremely conserved bHLH domain was predicted for all 14 SlMYC proteins. The highly conserved bHLH domain, which is associated with DNA binding, consists of approximately 50 amino acids.

3.5. Analysis of Exon–Intron Structure and cis-Regulatory Elements of SlMYC Genes

The full lengths of the SlMYC genes ranged between 1556 (SlMYC2-like-1) and 3030 bp (SlMYC4). Various exon–intron locations were compared to gain insight into potential mechanisms of structural diversity found in SlMYC. The number of introns varied in this study from 0 to 12. SlMYC12 exhibited a maximum of 12 introns; however, SlMYC1, SlMYC2, SlMYC3-like, SlMYC4, SlMYC7, SlMYC8, and SlMYC11 were found to exist without introns in their structure (Figure 4A). Furthermore, SlMYC6, SlMYC9, and SlMYC10 contained seven introns, the SlMYC2-like-2 gene contained two introns, while the SlMYC2-like-1 and SlMYC5 genes contained one intron (Figure 4A).
The upstream promoter region (2000 bp) of the SlMYC genes was extracted from the tomato genome to identify cis-regulatory components. In SlMYC promoter regions, four hormone-responsive regulatory elements were identified, including abscisic-acid-responsive elements (ABRE), a TGACG motif, a TGA element, and a TATC box, which were correlated with abscisic acid, MeJA, auxin, gibberellin, and salicylic acid responses (Figure 4B). The promoter region of SlMYC copies contained three light-responsive regulatory elements, including circadian, a TCT motif, and an MSL recognition element (MRE). Moreover, other regulatory elements (such as CAT box, TC-rich repeats, a CCAAT-box, a myosin-binding subunit (MBS), and a TCA element) associated with meristem expression, defense, and stress response as well as myeloblastosis (MYB) binding site involved in drought-inducibility and salicylic acid response were identified (Figure 4B).

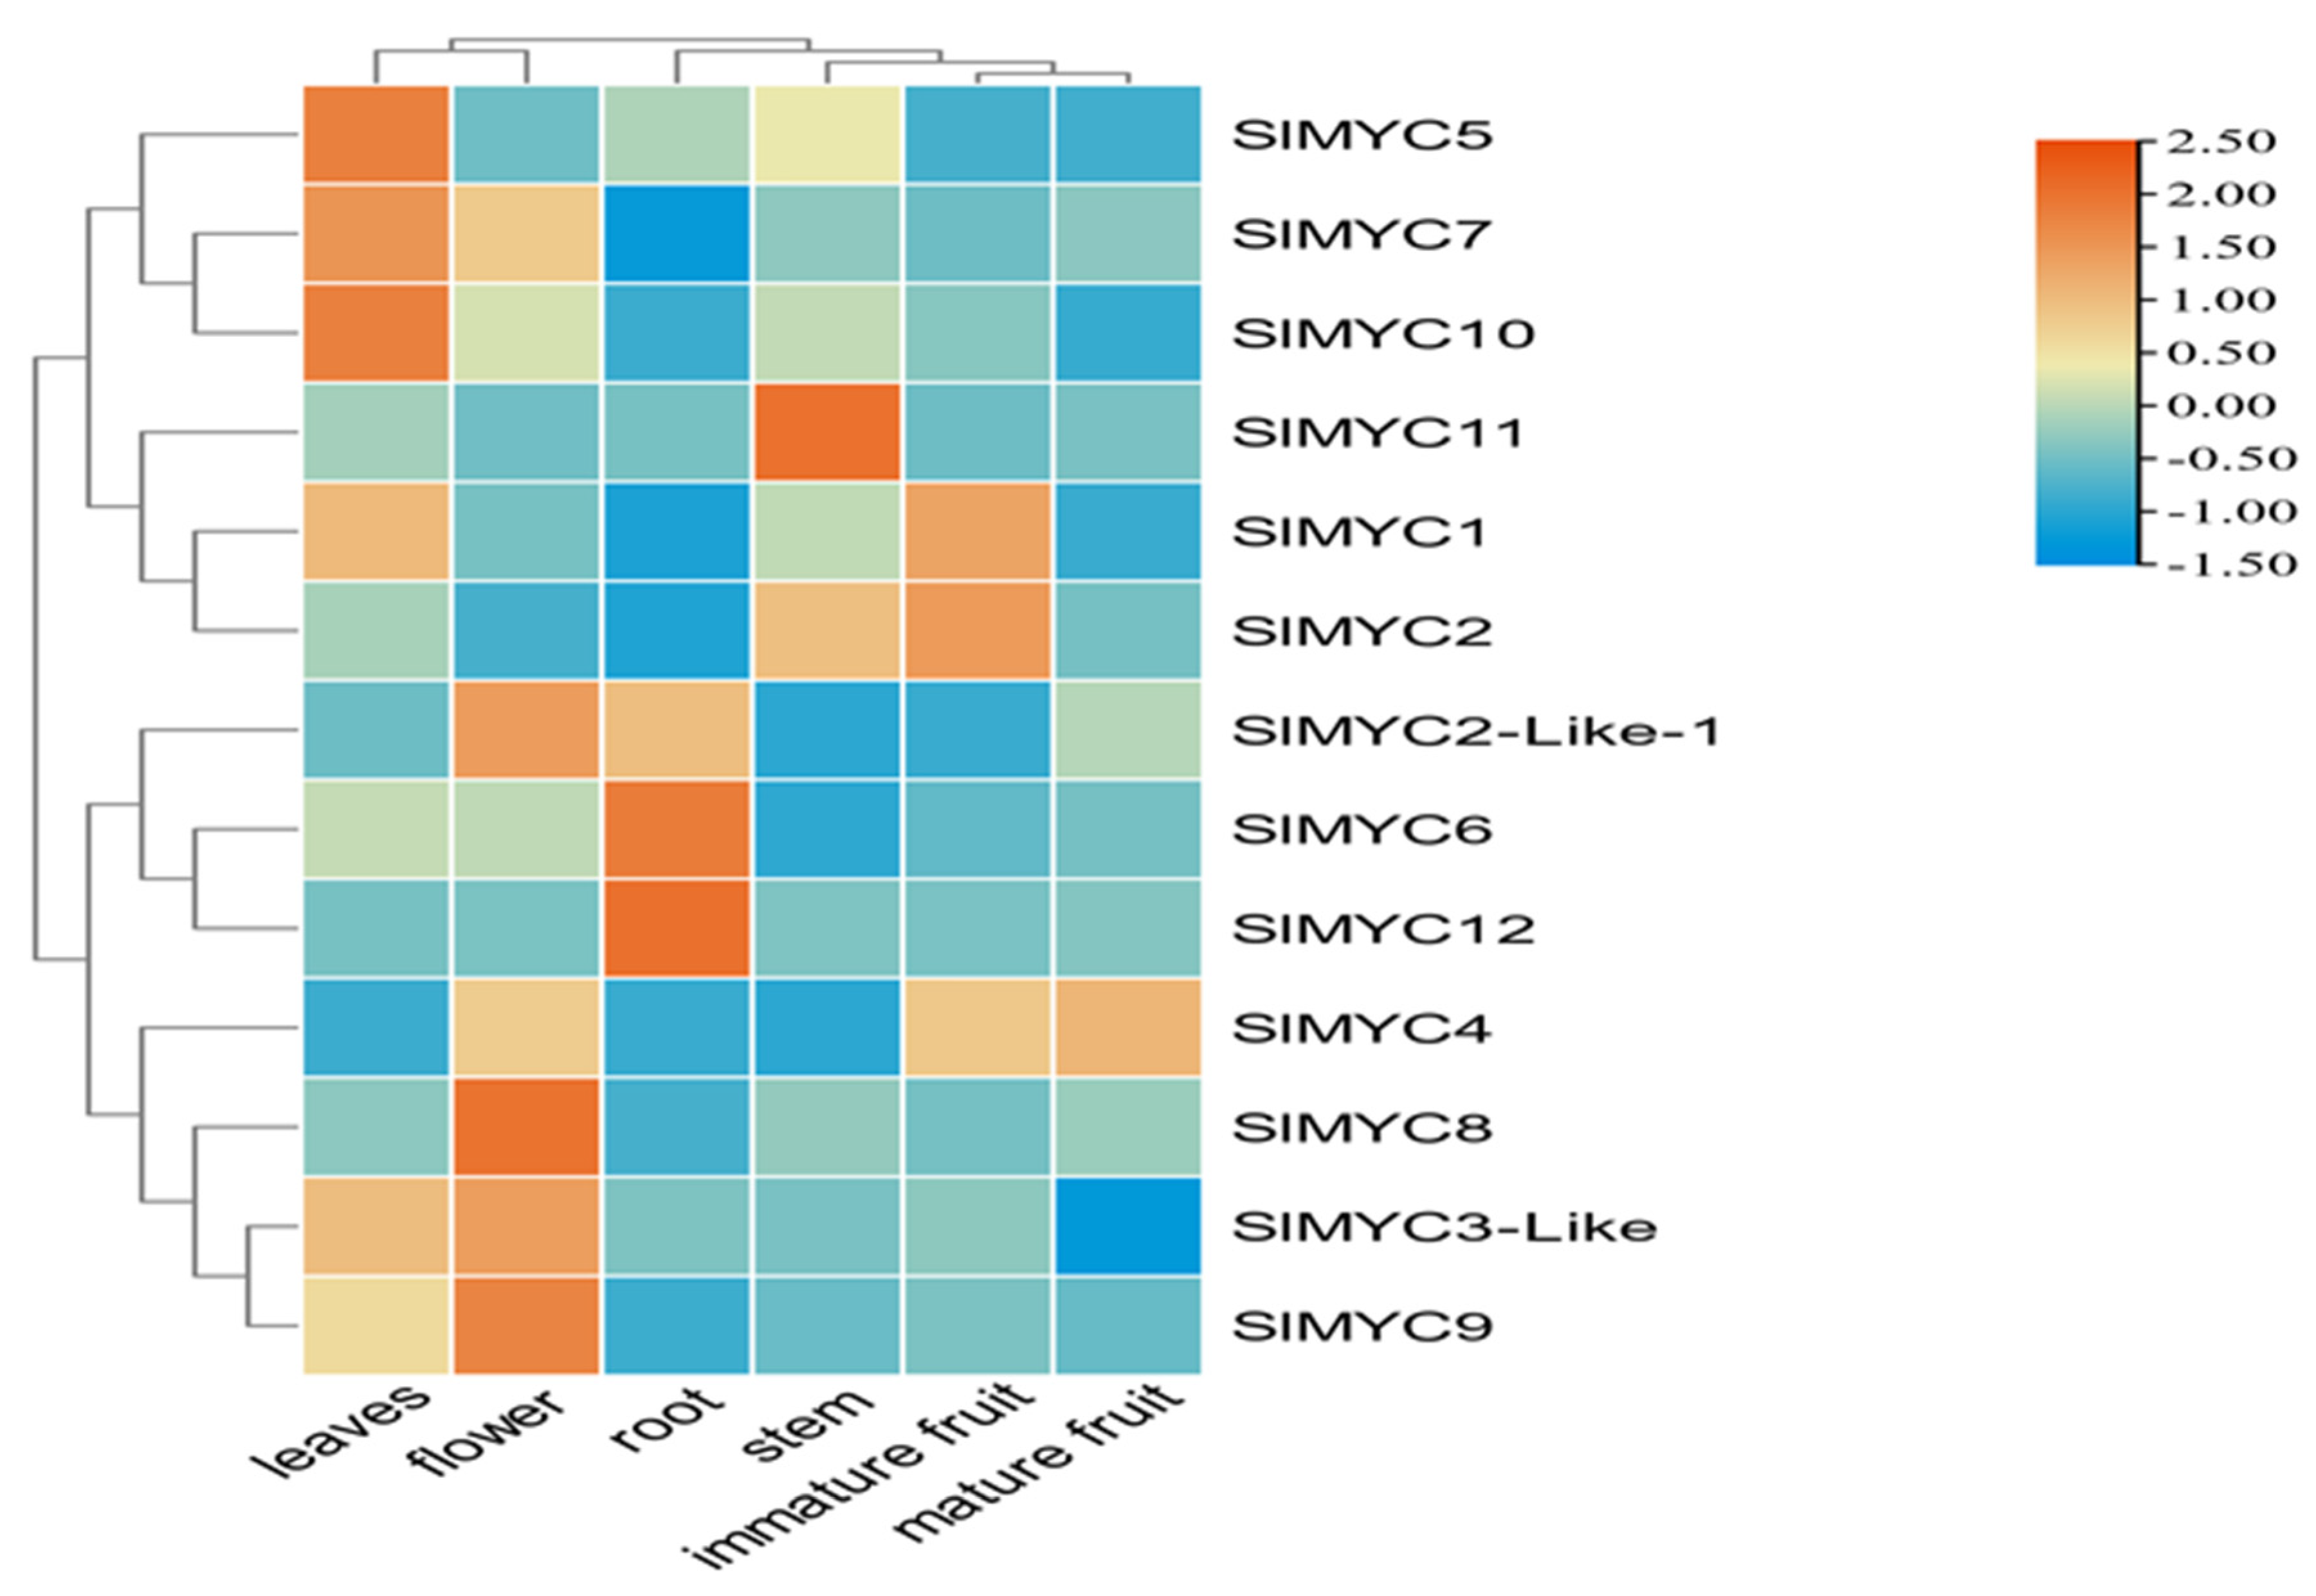
3.6. Expression Profiles of SlMYC in Various Organs of Tomato Plants

Using qRT-PCR, the expression levels of the 14 SlMYC genes were examined in the roots, stems, leaves, immature fruit, and mature fruit of tomato plants. SlMYC6 and SlMYC12 were expressed in the roots, and SlMYC11 was expressed in the stem. SlMYC5, SlMYC7, and SlMYC10 were extremely exhibited in the leaves. SlMYC2-like-1, SlMYC3-like, SlMYC8, and SlMYC9 were extremely expressed in the flowers. SlMYC1 and SlMYC2 were extremely expressed in the immature fruit. SlMYC4 was exhibited in the mature fruit (Figure 5). Among these 14 SlMYC genes, the expression of SlMYC2-like-2 and SlMYC11 was not detected in any of the organs of tomato. According to this finding, the SlMYC gene is expressed to varying degrees in each of these organs, with leaves and flowers exhibiting the highest expression levels.

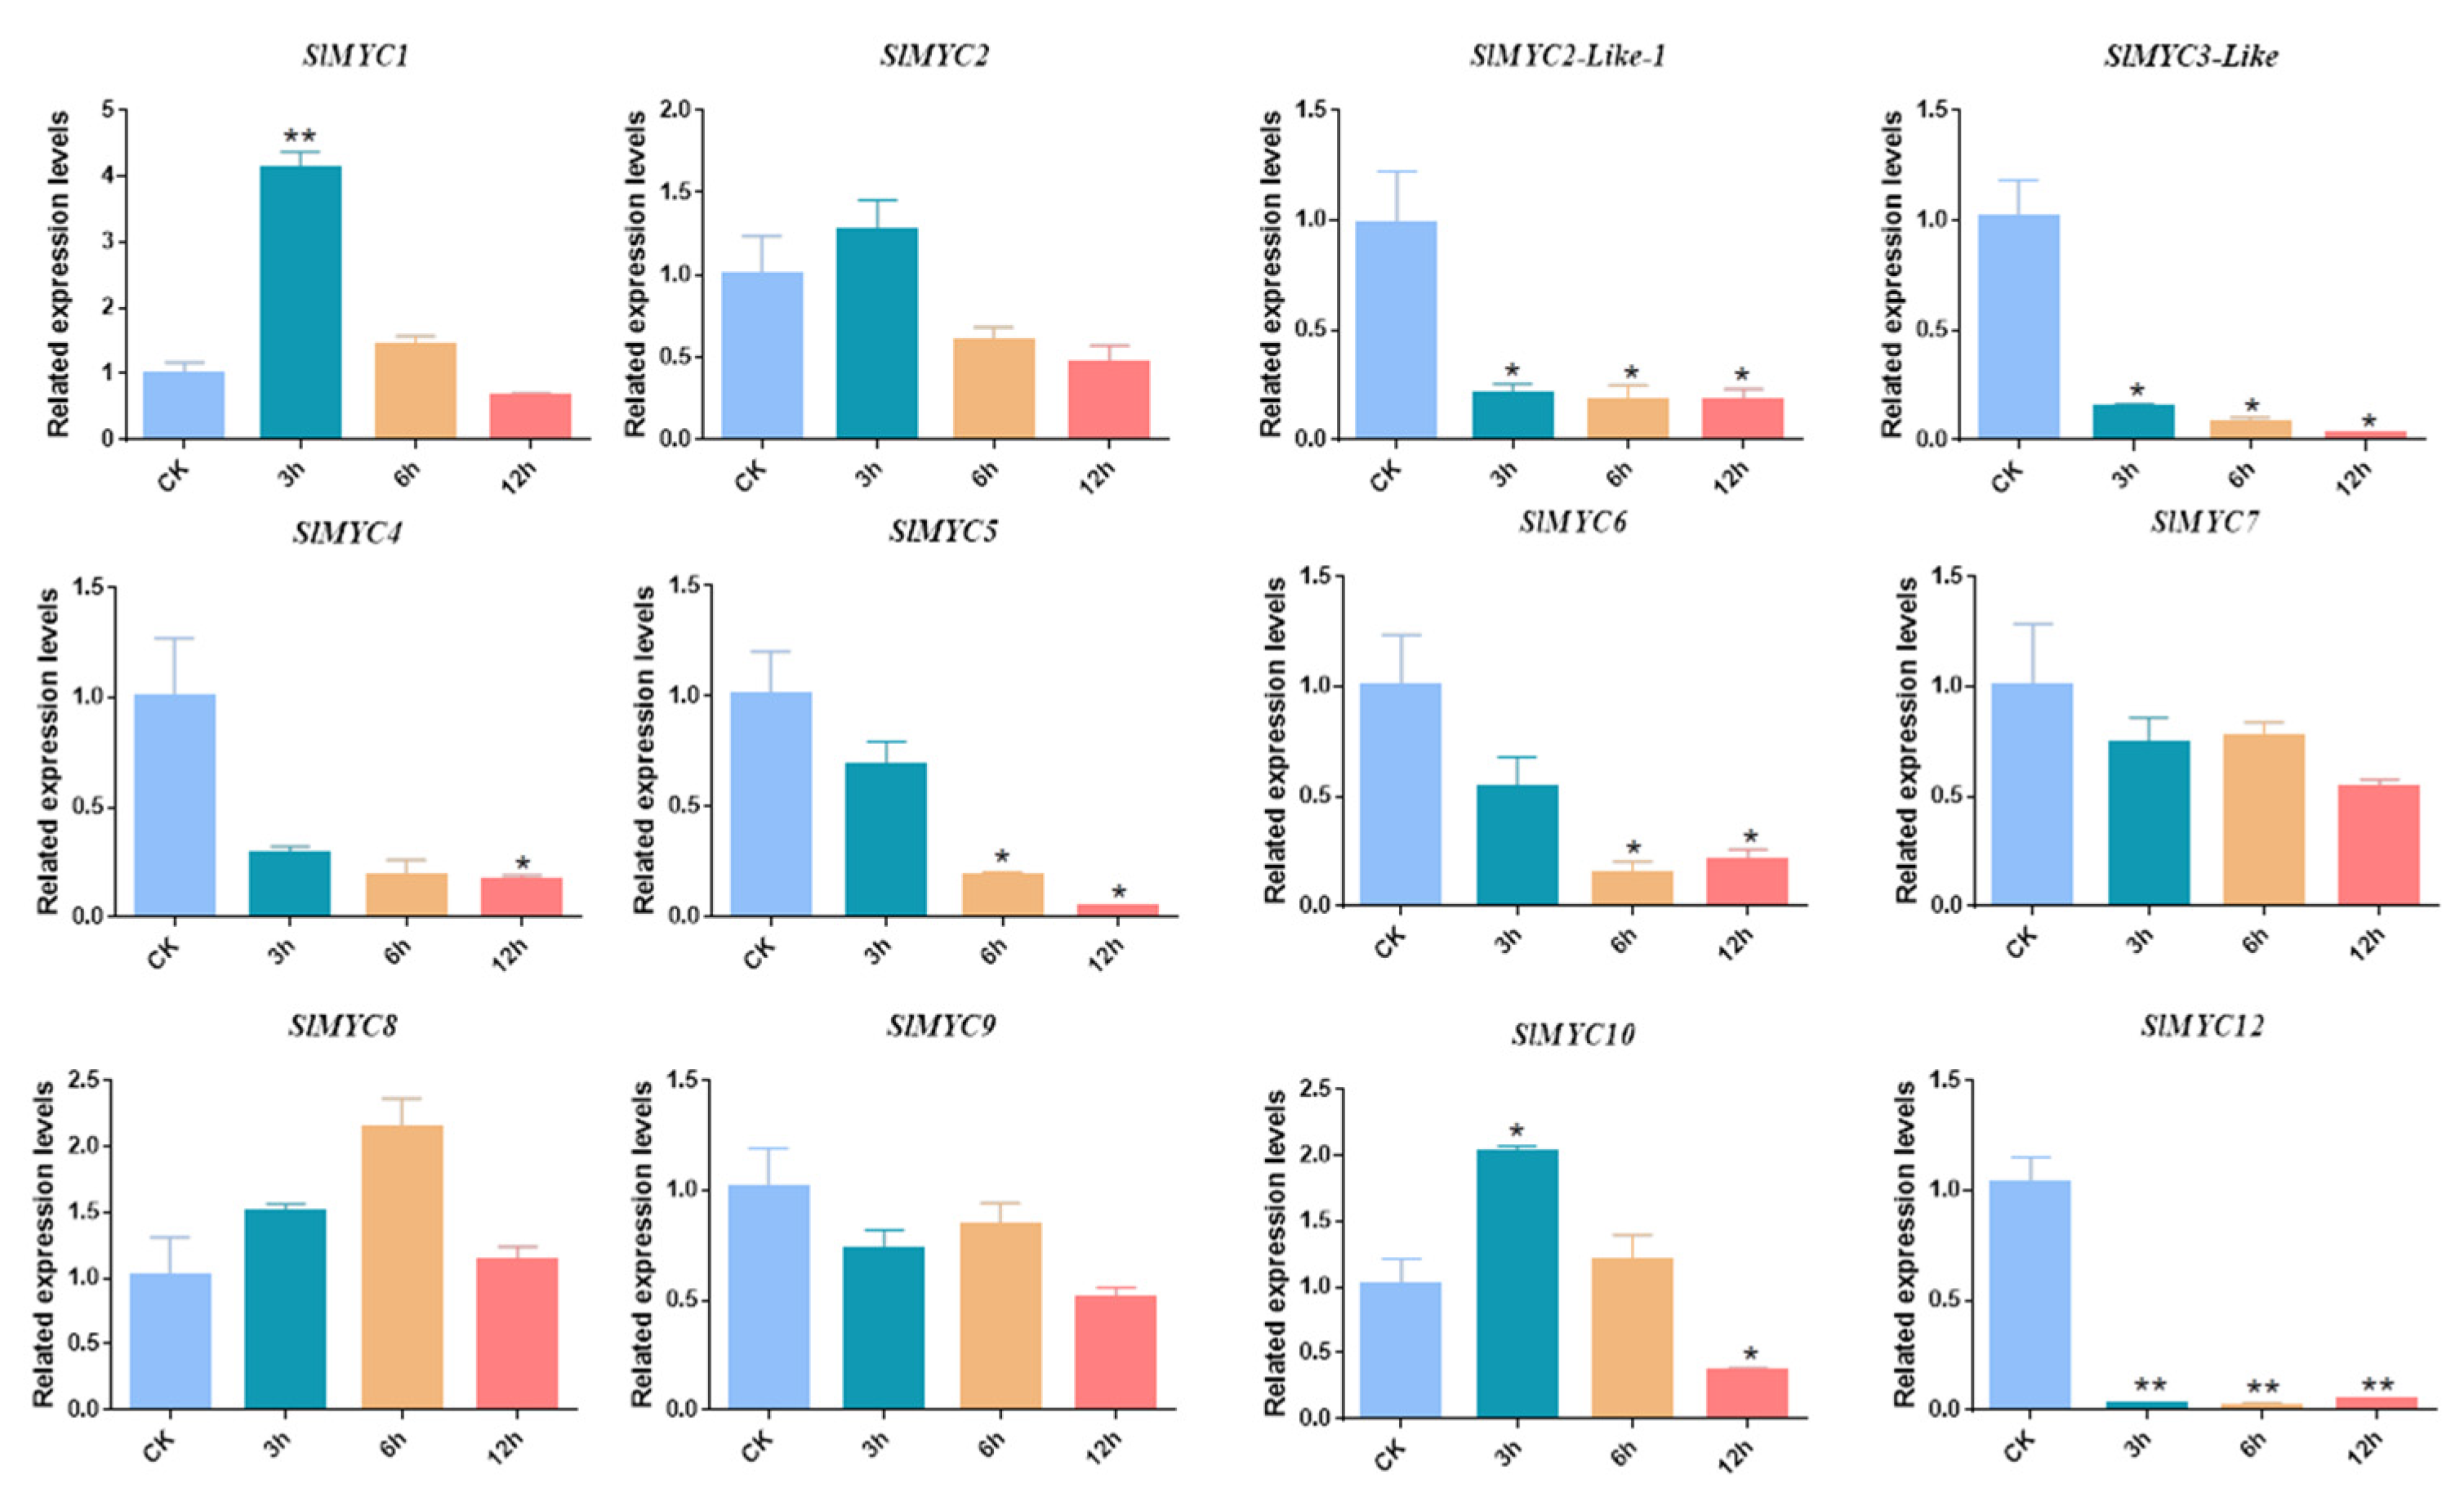
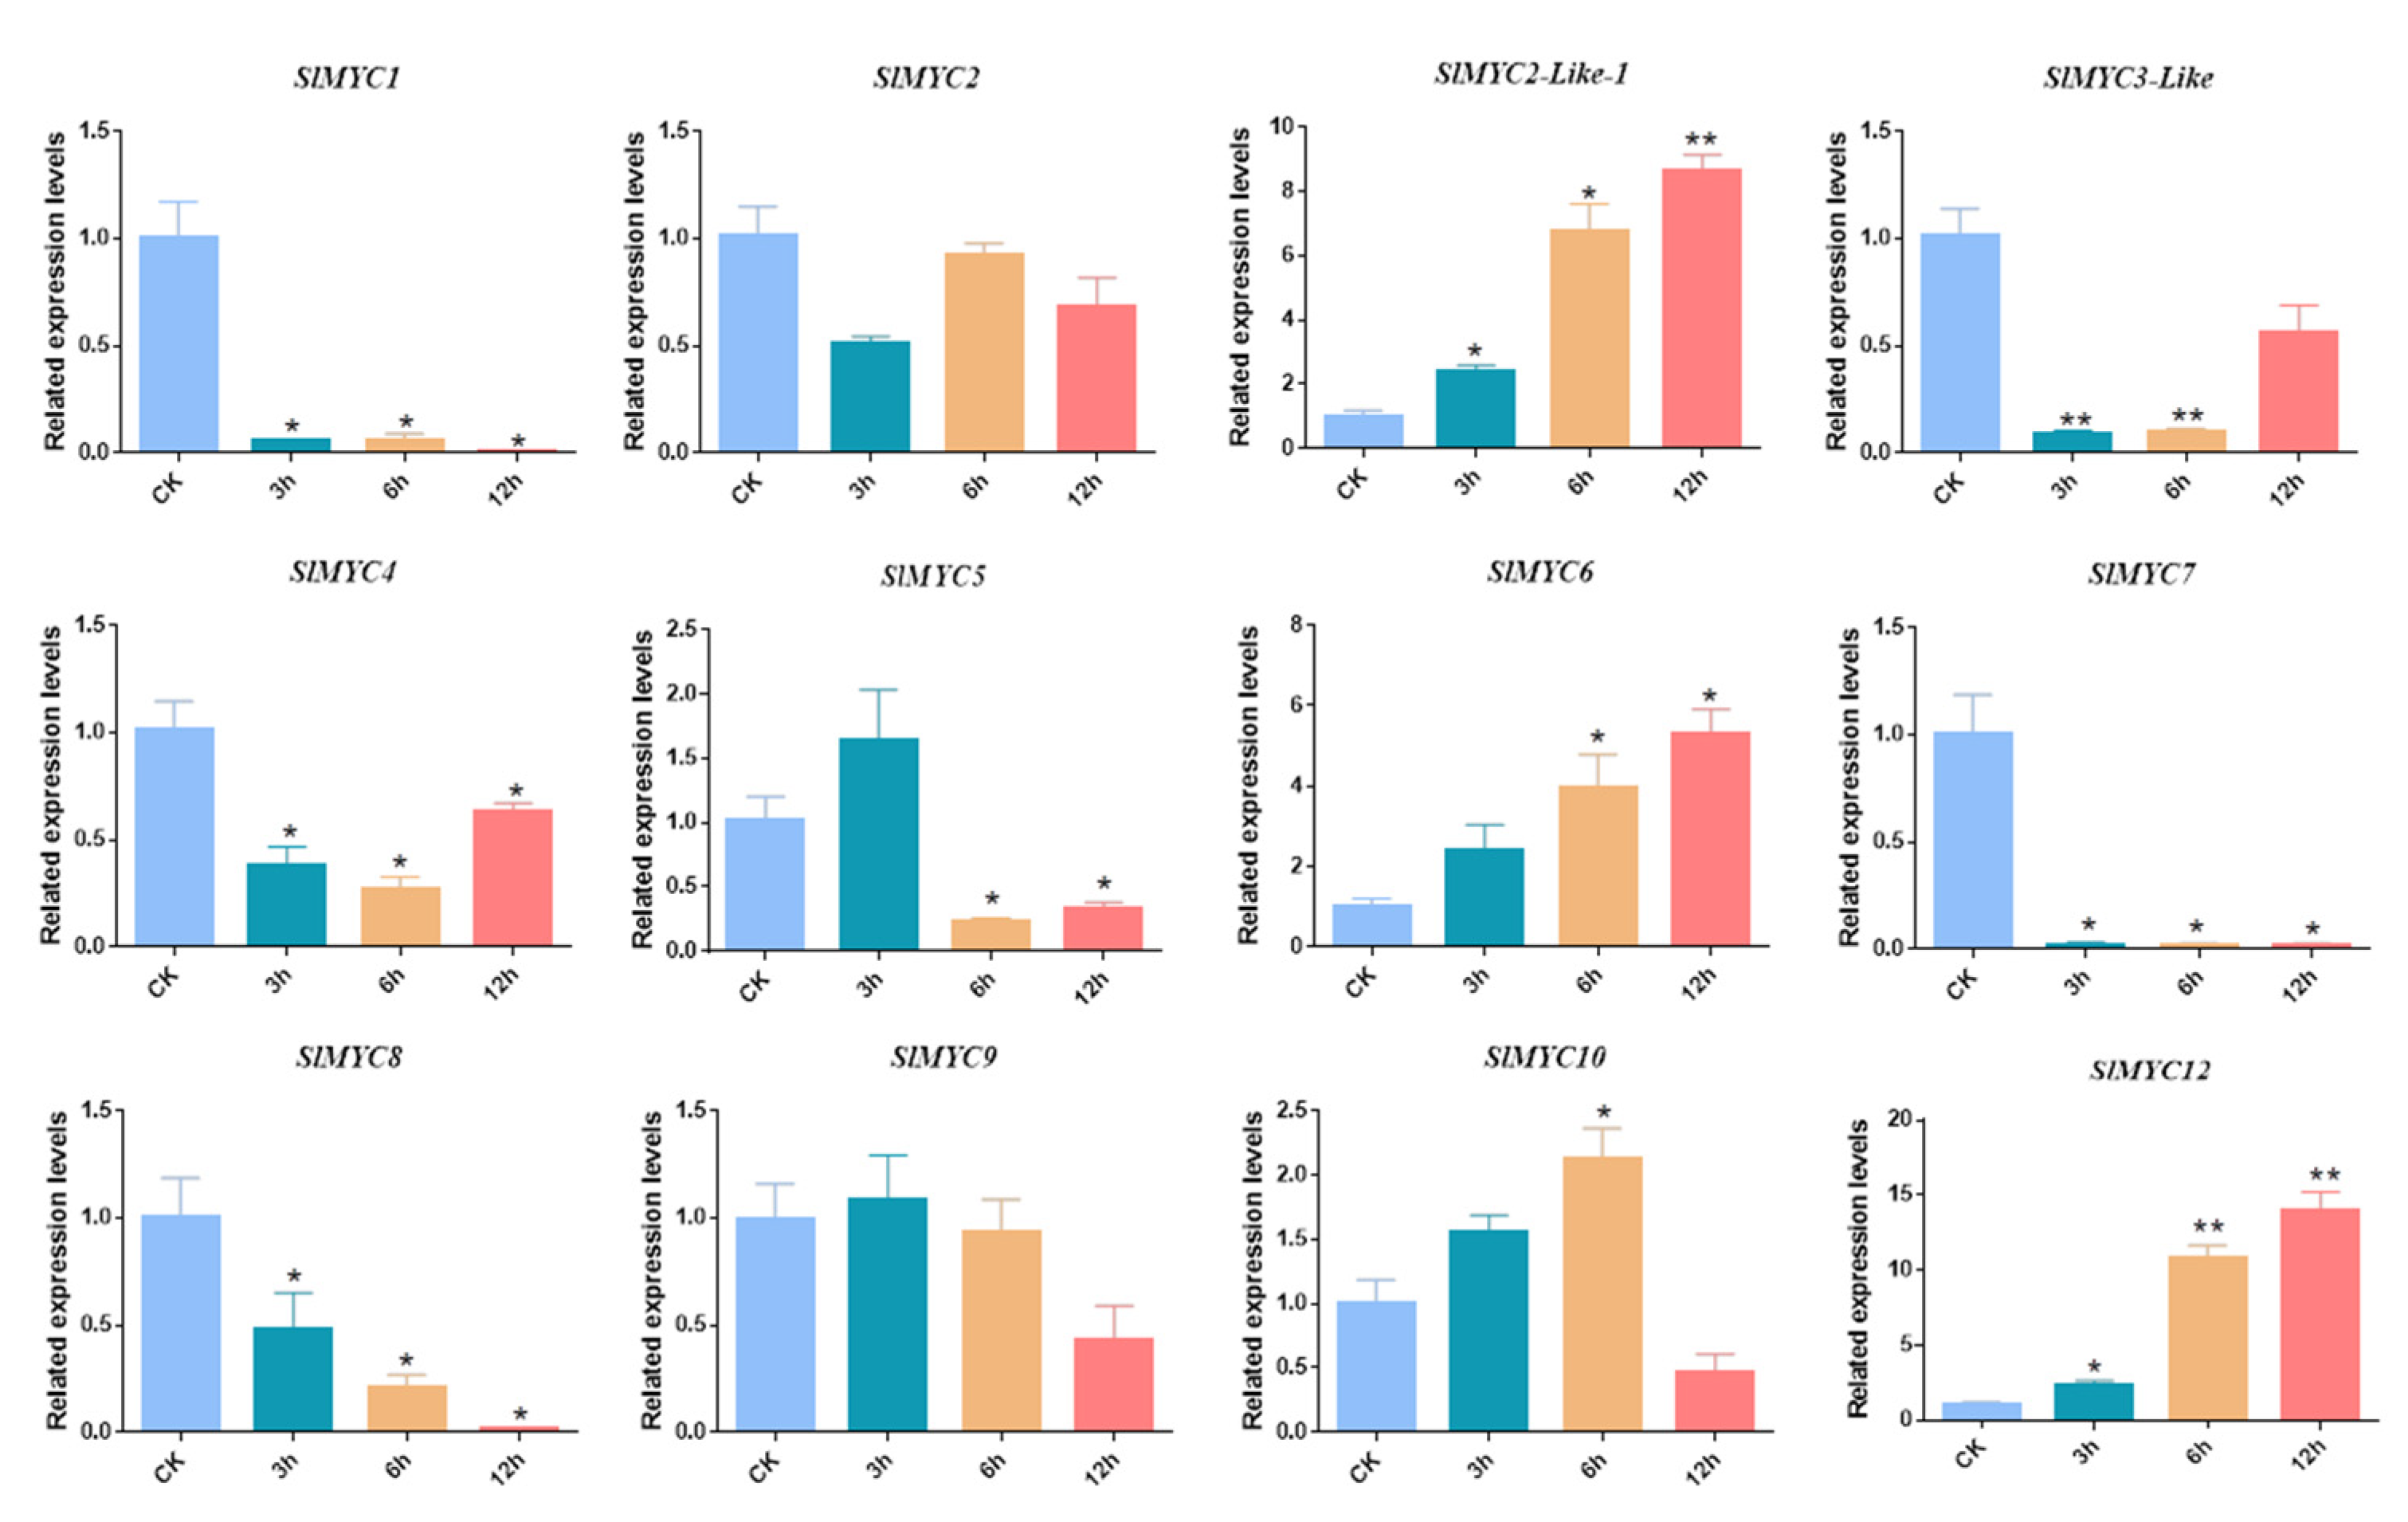
3.7. Expression Patterns of SlMYC under MeJA, NaCl, and Mannitol Stress

To better understand the role of SlMYCs in the response to abiotic stress, tomato seedlings were subjected to MeJA, NaCl, and mannitol treatment. As illustrated in Figure 6, SlMYC2-like-1, SlMYC6, SlMYC9, and SlMYC12 exhibited a similar expression pattern and increased significantly by 14.0-, 41.0-, 1.9-, and 19.0-fold in comparison to the control following 3 h of MeJA treatment. Subsequently, the expression level was progressively decreased, and SlMYC2-like-1, SlMYC9, and SlMYC12 reduced to the same level as the control at 6 h and 12 h. At 6 and 12 h, SlMYC6 was expressed at 2.0- and 9.5-fold higher levels compared to the control. In contrast, SlMYC5 expression was distinctly downregulated by 68.2% at 3 h compared to the control. At 6 h, following MeJA treatment, SlMYC1, SlMYC8, and SlMYC10 exhibited a significant upregulation of 2.1-, 5.0-, and 2.7-fold, respectively. SlMYC7 was gradually increased at 3 h, 6 h, and 12 h following MeJA treatment, and the expression peaked at 6 h. Following MeJA treatment, the expression of SlMYC2, SlMYC3-like, and SlMYC4 did not differ substantially from the control (Figure 6).
Following 3 h of NaCl treatment, SlMYC1 and SlMYC10 showed 4.1- and 2.0-fold upregulation, respectively, in comparison to the control. After that, the expression level gradually decreased with time, and at 12 h after NaCl treatment, SlMYC10 was downregulated by 65.0% compared to the control. However, although sharing a similar expression pattern, SlMYC2-like-1, SlMYC3-like, SlMYC4, and SlMYC12 were significantly downregulated following exposure to NaCl. SlMYC5 and SlMYC6 progressively decreased following NaCl treatment and were downregulated significantly by 82.0% and 95.0% at 6 h and 85.1% and 80.2% at 12 h, respectively. Following NaCl treatment, the expression of SlMYC2, SlMYC7, SlMYC8, and SlMYC9 did not differ substantially from the control (Figure 7).
Finally, the expression of SlMYC genes under 100 mM mannitol treatment was examined. At 3 h, 6 h, and 12 h following mannitol treatment, the expression levels of SlMYC1, SlMYC3-like, SlMYC4, SlMYC7, and SlMYC8 were lower. SlMYC2-like-1, SlMYC6, and SlMYC12 exhibited a similar expression pattern, and their expression gradually increased over the treatment period and peaked at 12 h. The expression of SlMYC5 was significantly downregulated by 78.5% and 68.4% 3 and 6 h after mannitol treatment, respectively. Following 6 h of mannitol treatment, the expression of SlMYC10 was 2.1-fold higher than in the control. The expression of SlMYC2 and SlMYC9 did not differ substantially from the control group following mannitol treatment (Figure 8).

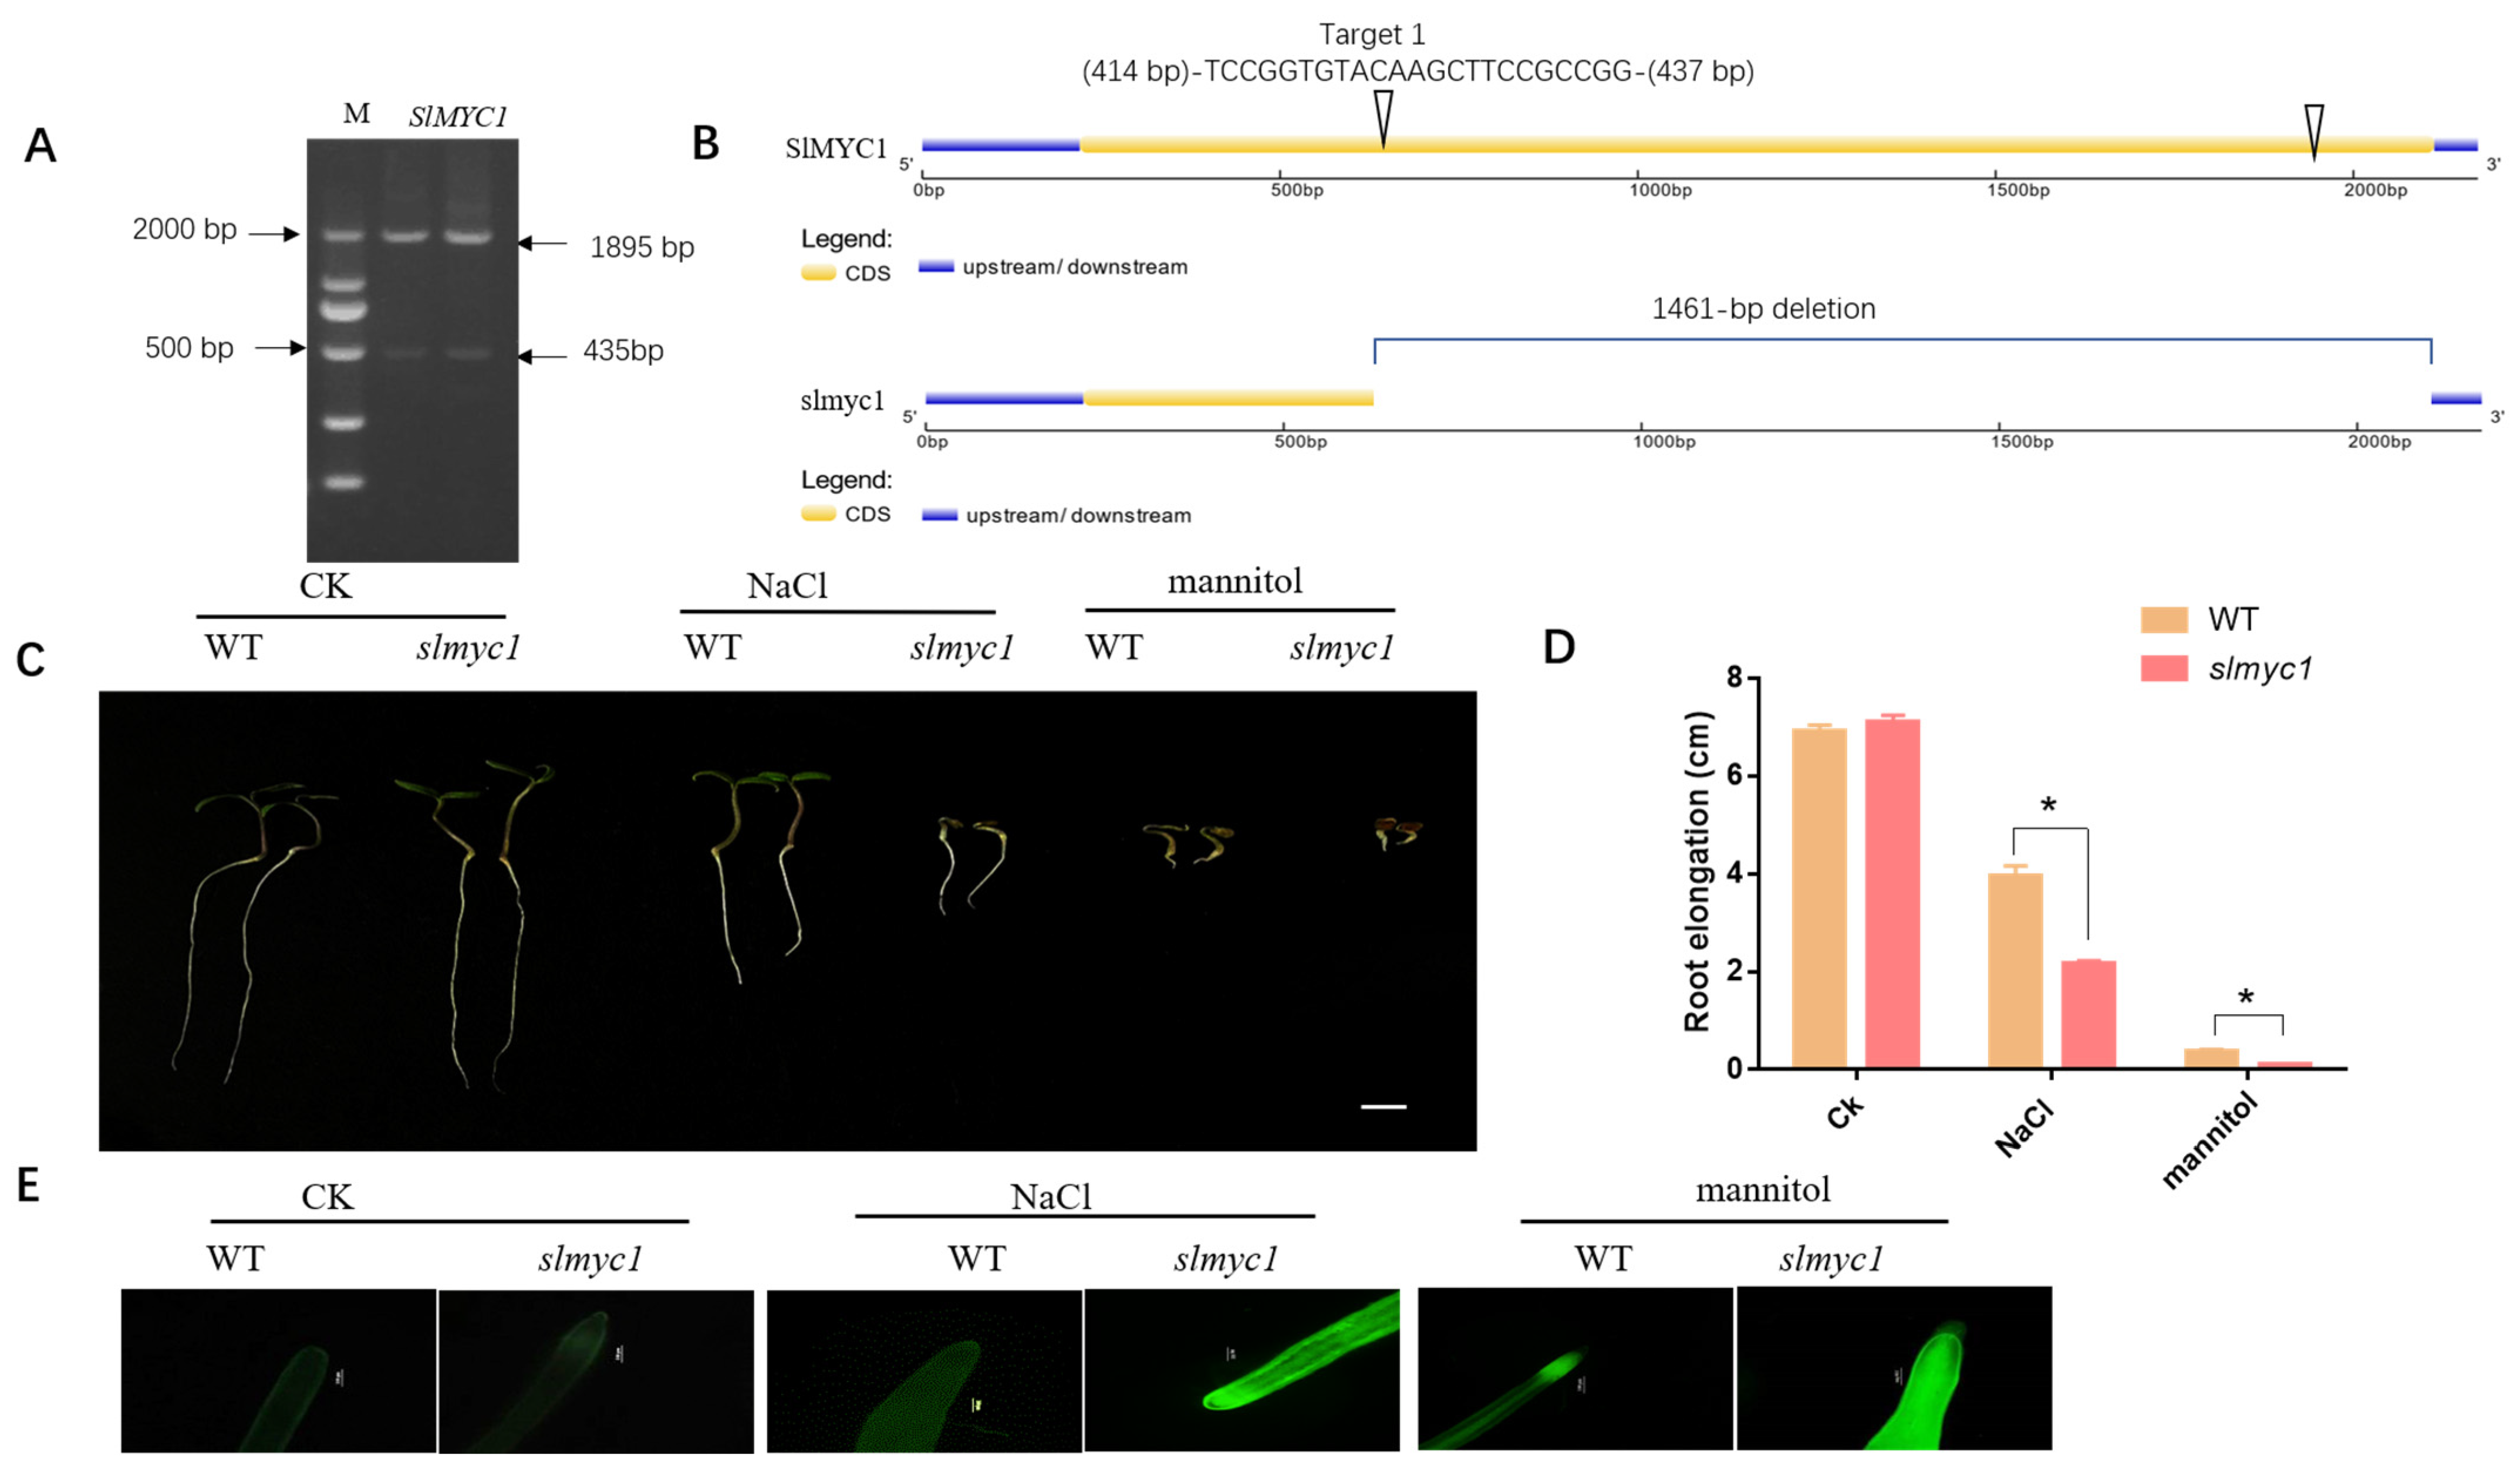
3.8. CRISPR/Cas9-Mediated Mutagenesis in slmyc1

Our previous transcriptome data of tomatoes under low nitrogen stress showed that the transcript of SlMYC1 was significantly changed (data not shown). To further understand the function of SlMYC1 under abiotic stress, the SlMYC1 was mutated in the Alisa Craig tomato using the CRISPR/Cas9 technique. In the exons encoding the function domain of SlMYC1, two target sites, target 1 and target 2, were designed. A hygromycin-resistant transgenic line (T0 generation) was created and grown. A pair of primers was designed to amplify the sequence including target 1 and target 2 in the genomic DNA. The size of the PCR product of the T0 generation was 435 bp, according to agarose gel electrophoresis of the PCR products with the genomic DNA containing the two target sequences, whereas that of the wild-type (WT) was 1895 bp (Figure 9A). In addition, DNA sequence analysis revealed that 1461 bp was deleted in the mutation (Figure 9B).

3.9. slmyc1 Had Decreased Tolerance to NaCl and Mannitol Stress

The effects of NaCl and mannitol on the growth of slmyc1 were analyzed. We observed that the seed germination of slmyc1 was not affected under normal conditions (Figure 9C). However, following 96 h of 100 mM NaCl treatment, the growth of slmyc1 was substantially inhibited, and the root elongation decreased by 50.1% in comparison to the control (Figure 9D). Following 96 h of treatment with 100 mM mannitol, both the WT and slmyc1 exhibited significant root length inhibition, with slmyc1 exhibiting more inhibition compared to WT (Figure 9D). In addition, following NaCl and mannitol treatment, ROS fluorescence in the root tips increased in both WT and slmyc1; however, slmyc1 had more ROS in comparison to the WT (Figure 9E). These results indicated that the slmyc1 mutant significantly decreased the resistance to NaCl and mannitol stress and SlMYC1 might function as a positive regulator under salt and dehydration stress.

4. Discussion

In this study, 14 members of the MYC gene family were isolated and identified to better understand the function of MYC genes in tomato plants (Table 1). Phylogenetic analysis separated these SlMYCs into four subgroups (Figure 2). Cis-acting elements may function as an important molecular switch to regulate gene expression under stressful conditions [36]. Four hormone regulatory elements, four light response regulatory elements, and one emergency stress response element were identified in our study (Figure 4). Besides SlMYC3-like, SlMYC4, SlMYC6, and SlMYC9, other members of the MYC family contain varying quantities of hormone-responsive elements, particularly ABA (ABRE). As a “stress hormone”, ABA could regulate many of the growth and development processes of plants, including seed germination, the senescence of tissues and organs, and stress tolerance [37]. Studies have demonstrated that MYC2 is associated with the ABA signaling pathway in Arabidopsis sp. [38]. Fourteen SlMYC genes have different types and numbers of cis-acting elements in their respective promoter regions, suggesting that these genes might be regulated differently and respond to different stresses.
As a subfamily of the bHLH family, SlMYC possesses a highly conserved domain HLH at the C-terminus (Figure 3C), which binds to the G-box cis-element in the JA-responsive promoter [39,40]. Phylogenetic tree analysis revealed that SlMYC6 and SlMYC9 have more independent evolutionary trends than other members of the MYC family (Figure 1). According to gene structure analysis, the majority of SlMYC family members have fewer introns (71%). A significant proportion has no introns (70%) (Figure 3). This variation in gene structure could be due to alternative splicing. Genes with fewer introns could evolve quickly through rapid replication or reverse transcription, whereas genes with more introns could evolve and acquire new functions [41]. Sequence logos of conserved amino acid residues (protein motif) exhibit an extremely conserved pattern of SlMYC family members at the C- and N- termini (Figure 3), indicating that SlMYC is evolutionarily conserved.
Earlier studies have demonstrated that MYC transcription factors play a crucial role in the growth and development of plants [14,42,43]. For example, MYC proteins could regulate plant seed germination, root elongation, leaf senescence, and flower development [44]. In one study, OsMYC genes were significantly expressed in stems [44]. In another study, BdMYC genes were exhibited substantially in inflorescences [44]. In an additional study, TaMYC genes were significantly expressed in leaves [8]. In our study, SlMYC gene expression varied to different degrees in all the organs of tomato plants and was expressed primarily in the leaves and flowers (Figure 5).
The expression profiles of MYC genes indicates their potential roles in the response to abiotic stress. For example, FaMYC2 was significantly increased at 15 min, 30 min, and 6 h following MeJA treatment [45]. JA could induce the expression of AtMYC [23]. In our study, the expression of most SlMYC genes was upregulated following MeJA treatment (Figure 6). These results indicate that the SlMYC gene is involved in the JA signaling pathway. Salinity stress induced the expression of TaMyc-B1 and TaMyc-A2; however, TaMyc-A1 was suppressed [46]. In our experiment, SlMYC primarily exhibited a declining trend following NaCl treatment (Figure 7). ZmMYC was significantly upregulated under drought stress [47]. TcMYC in Taxus sp. was upregulated as a result of drought and excessive salinity stress [48]. However, in this study, SlMYC exhibited various expression patterns under mannitol treatment (Figure 8). SlMYC2-like-1, SlMYC6, and SlMYC12 exhibited a similar expression pattern, suggesting that they might have similar functions in the response to abiotic stress. In our study, we used the CRISPR/Cas 9 technique to knock out the function of SlMYC1. In comparison to WT, the slmyc1 had a shorter root length and higher ROS after NaCl and mannitol treatments (Figure 9). Our findings indicate that slmyc1 reduces NaCl and mannitol stress tolerance and has beneficial effects in NaCl and mannitol treatments.

5. Conclusions

In conclusion, this study offers a genome-wide analysis of MYC genes in tomatoes. In total, 14 SlMYCs were identified and divided into four classes. The expression patterns of SlMYCs provide information about their various physiological functions in tomato growth and development, particularly in MeJA, NaCl, and mannitol regulation. Moreover, the slmyc1 mutant exhibited decreased tolerance to NaCl and mannitol stress.

Supplementary Materials

The following supporting information can be downloaded at: https://www.mdpi.com/article/10.3390/agronomy13030757/s1. Figure S1: Identification of the SlMYC gene family in tomato; Table S1: Specific primers of qRT-PCR amplification of MYC genes. Table S2: Specific primers of CRISPR-Cas9 amplification of SlMYC1 gene.

Author Contributions

Y.F. and S.Z. performed the experiments and analyzed the data. Y.F. wrote the manuscript. J.Y. and K.L. helped in the revision of the manuscript. H.X. designed the research and revised the manuscript. All authors have read and agreed to the published version of the manuscript.

Funding

This research was funded by the National Natural Science Foundation of China (grant no. 32260753) and the Yunnan Ten Thousand Talents Plan: Young and Elite Talents Project.

Data Availability Statement

The data presented in this study are available on request from the corresponding author.

Conflicts of Interest

The authors declare no competing interest.

References

  1. Ferré-D’Amaré, A.R.; Pognonec, P.; Roeder, R.G.; Burley, S.K.J.E.J. Structure and function of the b/HLH/Z domain of USF. EMBO J. 1994, 13, 180–189. [Google Scholar] [CrossRef] [PubMed]
  2. Massari, M.E.; Murre, C. Helix-Loop-Helix Proteins: Regulators of Transcription in Eucaryotic Organisms. Mol. Cell. Biol. 2000, 20, 429–440. [Google Scholar] [CrossRef] [PubMed] [Green Version]
  3. Atchley, W.R.; Terhalle, W.; Dress, A. Positional Dependence, Cliques, and Predictive Motifs in the bHLH Protein Domain. J. Mol. Evol. 1999, 48, 501–516. [Google Scholar] [CrossRef] [PubMed]
  4. Penuelas, M.; Monte, I.; Schweizer, F.; Vallat, A.; Reymond, P.; Garcia-Casado, G.; Franco-Zorrilla, J.M.; Solano, R. Jasmonate-Related MYC Transcription Factors Are Functionally Conserved in Marchantia polymorpha. Plant Cell 2019, 31, 2491–2509. [Google Scholar] [CrossRef]
  5. Reinbothe, C.; Springer, A.; Samol, I.; Reinbothe, S. Plant oxylipins: Role of jasmonic acid during programmed cell death, defence and leaf senescence. FEBS J. 2009, 276, 4666–4681. [Google Scholar] [CrossRef]
  6. Zheng, Y. Roles of jasmonate signalling in plant inflorescence and flower development. Curr. Opin. Plant Biol. 2015, 27, 44–51. [Google Scholar]
  7. Kazan, K. Diverse roles of jasmonates and ethylene in abiotic stress tolerance. Trends Plant Sci. 2015, 20, 219–229. [Google Scholar] [CrossRef]
  8. Chen, S.; Zhao, H.; Luo, T.; Liu, Y.; Li, H. Characteristics and Expression Pattern of MYC Genes in Triticum aestivum, Oryza sativa, and Brachypodium distachyon. Plants 2019, 8, 274. [Google Scholar] [CrossRef] [Green Version]
  9. Cai, Q.; Yuan, Z.; Chen, M.; Yin, C.; Luo, Z.; Zhao, X.; Liang, W.; Hu, J.; Zhang, D.J.N.C. Jasmonic acid regulates spikelet development in rice. Nat. Commun. 2014, 5, 3476. [Google Scholar] [CrossRef] [Green Version]
  10. Uji, Y.; Taniguchi, S.; Tamaoki, D.; Shishido, H.; Akimitsu, K.; Gomi, K.J.P.; Physiology, C. Overexpression ofOsMYC2Results in the Up-Regulation of Early JA-Rresponsive Genes and Bacterial Blight Resistance in Rice. Plant Cell Physiol. 2016, 57, 1814–1827. [Google Scholar] [CrossRef]
  11. Qi, T.; Wang, J.; Huang, H.; Liu, B.; Xie, D.J.P.C. Regulation of Jasmonate-Induced Leaf Senescence by Antagonism between bHLH Subgroup IIIe and IIId Factors in Arabidopsis. Plant Cell 2015, 27, 1634–1649. [Google Scholar] [CrossRef] [PubMed] [Green Version]
  12. Debora, G.; Aurore, C.; Acosta, I.F.; Jonas, G.; Laurens, P.; Alain, G.; René, D.; Esteban, A.; Farmer, E.E.; Hao, Y.J.P.G. Multilayered Organization of Jasmonate Signalling in the Regulation of Root Growth. PLoS Genet. 2015, 11, e1005300. [Google Scholar]
  13. Qi, T.; Huang, H.; Song, S.; Xie, D.J.P.C. Regulation of Jasmonate-Mediated Stamen Development and Seed Production by a bHLH-MYB Complex in Arabidopsis. Plant Cell 2015, 27, 1620–1633. [Google Scholar] [CrossRef] [PubMed] [Green Version]
  14. Gao, C.; Qi, S.; Liu, K.; Li, D.; Jin, C.; Li, Z.; Huang, G.; Hai, J.; Zhang, M.; Chen, M.; et al. MYC2, MYC3, and MYC4 function redundantly in seed storage protein accumulation in Arabidopsis. Plant Physiol. Biochem. 2016, 108, 63–70. [Google Scholar] [CrossRef]
  15. Zhu, X.; Chen, J.; Xie, Z.; Gao, J.; Ren, G.; Gao, S.; Zhou, X.; Kuai, B. Jasmonic acid promotes degreening via MYC2/3/4- and ANAC019/055/072-mediated regulation of major chlorophyll catabolic genes. Plant J. 2015, 84, 597–610. [Google Scholar] [CrossRef]
  16. Niu, Y.; Figueroa, P.; Browse, J. Characterization of JAZ-interacting bHLH transcription factors that regulate jasmonate responses in Arabidopsis. J. Exp. Bot. 2011, 62, 2143–2154. [Google Scholar] [CrossRef] [Green Version]
  17. Schweizer, F.; Fernández-Calvo, P.; Zander, M.; Diez-Diaz, M.; Fonseca, S.; Glauser, G.; Lewsey, M.G.; Ecker, J.R.; Reymond, S.; Reymond, P. Arabidopsis Basic Helix-Loop-Helix Transcription Factors MYC2, MYC3, and MYC4 Regulate Glucosinolate Biosynthesis, Insect Performance, and Feeding Behavior. Plant Cell 2013, 25, 3117–3132. [Google Scholar] [CrossRef] [Green Version]
  18. Yuan, Z.; Xinyuan, X.; Shiming, L.; Wenjie, C.; Bo, Z.; Dengcai, L.; Baolong, L.; Daowen, W.; Huaigang, Z. Allelic Variation and Transcriptional Isoforms of Wheat TaMYC1 Gene Regulating Anthocyanin Synthesis in Pericarp. Front. Plant Sci. 2017, 8, 1645. [Google Scholar]
  19. Yu, S.O.; Hans-Peter, M.; Kukoeva, T.V.; Andreas, B.; Khlestkina, E.K. Regulation of the Flavonoid Biosynthesis Pathway Genes in Purple and Black Grains of Hordeum vulgare. PLoS ONE 2016, 11, e0163782. [Google Scholar]
  20. Abe, H.; Yamaguchi-Shinozaki, K.; Urao, T.; Iwasaki, T.; Hosokawa, D.; Shinozaki, K. Role of Arabidopsis MYC and MYB Homologs in Drought and Abscisic Acid-Regulated Gene Expression. Plant Cell 1997, 9, 1859–1868. [Google Scholar]
  21. Yamaguchi-Shinozaki, S. Gene networks involved in drought stress response and tolerance. J. Exp. Bot. 2007, 58, 221. [Google Scholar] [CrossRef] [PubMed] [Green Version]
  22. Shyu, C.; Figueroa, P.; Depew, C.L.; Cooke, T.F.; Sheard, L.B.; Moreno, J.E.; Katsir, L.; Zheng, N.; Browse, J.; Howe, G.A. JAZ8 lacks a canonical degron and has an EAR motif that mediates transcriptional repression of jasmonate responses in Arabidopsis. Plant Cell 2012, 24, 536–550. [Google Scholar] [CrossRef] [PubMed] [Green Version]
  23. Pauwels, L.; Barbero, G.F.; Geerinck, J.; Tilleman, S.; Grunewald, W.; Perez, A.C.; Chico, J.M.; Bossche, R.V.; Sewell, J.; Gil, E.; et al. NINJA connects the co-repressor TOPLESS to jasmonate signalling. Nature 2010, 464, 788–791. [Google Scholar] [CrossRef] [PubMed] [Green Version]
  24. Ke, J.; Ma, H.; Gu, X.; Thelen, A.; Brunzelle, J.S.; Li, J.; Xu, H.E.; Melcher, K.J.S.A. Structural basis for recognition of diverse transcriptional repressors by the TOPLESS family of corepressors. Sci. Adv. 2015, 1, e1500107. [Google Scholar] [CrossRef] [PubMed] [Green Version]
  25. Du, M.; Chen, Q.; Zhai, Q.; Fang, M.; Li, C.; Shen, J.; Lu, Y.; Deng, L.; Wang, Q.; Liu, Y. MYC2 Regulates the Termination of Jasmonate Signaling via an Autoregulatory Negative Feedback Loop. Plant Cell 2019, 31, 106–127. [Google Scholar]
  26. Chini, A.; Fonseca, S.; Fernandez, G.; Adie, B.; Chico, J.M.; Lorenzo, O.; Garcia-Casado, G.; Lopez-Vidriero, I.; Lozano, F.M.; Ponce, M.R.; et al. The JAZ family of repressors is the missing link in jasmonate signalling. Nature 2007, 448, 666–671. [Google Scholar] [CrossRef]
  27. Boter, M.; Ruiz-Rivero, O.; Abdeen, A.; Prat, S. Conserved MYC transcription factors play a key role in jasmonate signaling both in tomato and Arabidopsis. Gene Dev. 2004, 18, 1577–1591. [Google Scholar] [CrossRef] [Green Version]
  28. Panda, S.; Jozwiak, A.; Sonawane, P.D.; Szymanski, J.; Kazachkova, Y.; Vainer, A.; Kilambi, H.V.; Almekias-Siegl, E.; Dikaya, V.; Bocobza, S.; et al. Steroidal alkaloids defence metabolism and plant growth are modulated by the joint action of gibberellin and jasmonate signalling. New Phytol. 2022, 233, 1220–1237. [Google Scholar] [CrossRef]
  29. Hua, B.; Chang, J.; Wu, M.L.; Xu, Z.J.; Zhang, F.Y.; Yang, M.N.; Xu, H.M.; Wang, L.J.; Chen, X.Y.; Wu, S. Mediation of JA signalling in glandular trichomes by thewoolly/SlMYC1regulatory module improves pest resistance in tomato. Plant Biotechnol. J. 2021, 19, 375–393. [Google Scholar] [CrossRef]
  30. Xu, J.S.; van Herwijnen, Z.O.; Drager, D.B.; Sui, C.; Haring, M.A.; Schuurink, R.C. SlMYC1 Regulates Type VI Glandular Trichome Formation and Terpene Biosynthesis in Tomato Glandular Cells. Plant Cell 2018, 30, 2988–3005. [Google Scholar] [CrossRef] [Green Version]
  31. Swinnen, G.; De Meyer, M.; Pollier, J.; Molina-Hidalgo, F.J.; Ceulemans, E.; Venegas-Molina, J.; De Milde, L.; Fernandez-Calvo, P.; Ron, M.; Pauwels, L.; et al. The basic helix-loop-helix transcription factors MYC1 and MYC2 have a dual role in the regulation of constitutive and stress-inducible specialized metabolism in tomato. New Phytol. 2022, 236, 911–928. [Google Scholar] [CrossRef] [PubMed]
  32. Chen, C.; Rui, X.; Hao, C.; He, Y. TBtools, a Toolkit for Biologists integrating various HTS-data handling tools with a user-friendly interface. bioRxiv 2018, 10, 289660. [Google Scholar]
  33. Kim, W.-N.; Kim, H.-J.; Chung, Y.-S.; Kim, H.-U. Construction of Multiple Guide RNAs in CRISPR/Cas9 Vector Using Stepwise or Simultaneous Golden Gate Cloning: Case Study for Targeting the FAD2 and FATB Multigene in Soybean. Plants 2021, 10, 2542. [Google Scholar] [CrossRef] [PubMed]
  34. Porebski, S.; Bailey, L.G.; Baum, B.R. Modification of a CTAB DNA extraction protocol for plants containing high polysaccharide and polyphenol components. Plant Mol. Biol. Report. 1997, 15, 8–15. [Google Scholar] [CrossRef]
  35. Qi, Q.; Yanyan, D.; Yuanlin, L.; Kunzhi, L.; Huini, X.; Xudong, S. Overexpression of SlMDHAR in transgenic tobacco increased salt stress tolerance involving S-nitrosylation regulation. Plant Sci. 2020, 299, 110609. [Google Scholar] [CrossRef]
  36. Nakashima, K.; Ito, Y.; Yamaguchi-Shinozaki, K.J.P.P. Transcriptional regulatory networks in response to abiotic stresses in Arabidopsis and grasses. Plant Physiol. 2009, 149, 88. [Google Scholar] [CrossRef] [PubMed] [Green Version]
  37. Wang, Y.; Qiao, L.; Bai, J.; Wang, P.; Duan, W.; Yuan, S.; Yuan, G.; Zhang, F.; Zhang, L.; Zhao, C. Genome-wide characterization of JASMONATE-ZIM DOMAIN transcription repressors in wheat (Triticum aestivum L.). BMC Genom. 2017, 18, 152. [Google Scholar] [CrossRef] [PubMed] [Green Version]
  38. Abe, H.; Urao, T.; Ito, T.; Seki, M.; Yamaguchi-Shinozaki, S.K.J.P.C. Arabidopsis AtMYC2 (bHLH) and AtMYB2 (MYB) Function as Transcriptional Activators in Abscisic Acid Signaling. Plant Cell 2003, 15, 63–78. [Google Scholar] [CrossRef] [Green Version]
  39. Fernández-Calvo, P.; Chini, A.; Fernández-Barbero, G.; Chico, J.M.; Gimenez-Ibanez, S.; Geerinck, J.; Eeckhout, D.; Schweizer, F.; Godoy, M.; Franco-Zorrilla, J. The Arabidopsis bHLH Transcription Factors MYC3 and MYC4 Are Targets of JAZ Repressors and Act Additively with MYC2 in the Activation of Jasmonate Responses. Plant Cell 2011, 23, 701–715. [Google Scholar] [CrossRef] [Green Version]
  40. Figueroa, B. The Arabidopsis JAZ2 promoter contains a G-box and thymidine-rich module that are necessary and sufficient for jasmonate-dependent activation by MYC transcription factors and repression by JAZ proteins. In Proceedings of the Society for Advancement of Hispanics/Chicanos & Native Americans in Science National Conference, Kansas, MO, USA, 28–30 October 2021. [Google Scholar]
  41. Iwamoto, M.; Maekawa, M.; Saito, A.; Higo, H.; Higo, K. Evolutionary relationship of plant catalase genes inferred from exon-intron structures: Isozyme divergence after the separation of monocots and dicots. Theor. Appl. Genet. 1998, 97, 9–19. [Google Scholar] [CrossRef]
  42. Kazan, K.; Manners, J.M. MYC2: The master in action. Mol. Plant 2013, 6, 686–703. [Google Scholar] [CrossRef] [PubMed] [Green Version]
  43. Song, S.; Huang, H.; Wang, J.; Liu, B.; Qi, T.; Xie, D.J.P.; Physiology, C. MYC5 Is Involved in Jasmonate-regulated Plant Growth, Leaf Senescence and Defense Responses. Plant Cell Physiol. 2017, 58, 1752. [Google Scholar] [CrossRef] [PubMed] [Green Version]
  44. Bai, J.F.; Wang, Y.K.; Guo, L.P.; Guo, X.M.; Guo, H.Y.; Yuan, S.H.; Duan, W.J.; Liu, Z.; Zhao, C.P.; Zhang, F.T.; et al. Genomic identification and characterization of MYC family genes in wheat (Triticum aestivum L.). BMC Genom. 2019, 20, 1032. [Google Scholar] [CrossRef] [PubMed] [Green Version]
  45. Adrián, G.-B.; Figueroa, N.E.; Figueroa, P.M.; Figueroa, C.R.; Blazquez, M.A.J.P.O. Jasmonate signalling pathway in strawberry: Genome-wide identification, molecular characterization and expression of JAZs and MYCs during fruit development and ripening. PLoS ONE 2018, 13, e0197118. [Google Scholar]
  46. Strygina, K.V.; Khlestkina, E.K. Myc-like transcriptional factors in wheat: Structural and functional organization of the subfamily I members. BMC Plant Biol. 2019, 19, 50. [Google Scholar] [CrossRef]
  47. Wei, K.; Chen, H. Comparative functional genomics analysis of bHLH gene family in rice, maize and wheat. BMC Plant Biol. 2018, 18, 309. [Google Scholar] [CrossRef]
  48. Yanfang, Y.; Kaikai, Z.; Liying, Y.; Xing, L.; Ying, W.; Hongwei, L.; Qiang, L.; Duanfen, C.; Deyou, Q. Identification and characterization of MYC transcription factors in Taxus sp. Gene 2018, 675, 1–8. [Google Scholar] [CrossRef]
Figure 1. Genome distribution and synteny relationship of SlMYC genes in Solanum lycopersicum. Different chromosomes were used different colors. Colored lines represent the syntenic pairs of SlMYC.
Agronomy 13 00757 g001
Figure 2. Phylogenetic tree of MYC proteins. The phylogenetic tree was carried out based on protein alignments. SlMYC of Solanum lycopersicum, TaMYC of Triticum aestivum, NtMYC of Nicotiana tabacum, and AtMYC of Arabidopsis were used. The neighbor-joining method is used with 1000 bootstrap trials.
Agronomy 13 00757 g002
Figure 3. Phylogenetic and conserved motifs of MYC proteins in tomato. (A) Phylogenetic and conserved motif distribution of 14 tomato MYCs. The tree is rooted. (B) Logo sequences for 14 SlMYC conserved motifs. (C) Multiple alignments of MYC and two conserved domains (bHLH_MYC_N and bHLH) of tomato MYC protein. The conservative amino acids were used different colours.
Agronomy 13 00757 g003
Figure 4. Analysis of exon–intron structures and cis-regulatory elements of SlMYC genes. (A) Exon–intron organization of MYC genes in Solanum lycopersicum (Sl) grouped according to their gene orthology. Blue and yellow bars indicate untranslated (UTR) regions and exons. Black interrupted lines indicate introns. The tree is rooted. (B) The number and composition of cis-acting regulatory elements in the promotor region of SlMYC genes. The 2000 base pair promoter region of each gene copy is displayed. Different colorful shapes show different elements.
Agronomy 13 00757 g004
Figure 5. Response analysis of SlMYC genes in the roots, stems, leaves, flowers, immature fruit, and mature fruit by qRT−PCR. RNA samples were extracted from different tissues of tomato.
Agronomy 13 00757 g005
Figure 6. Response analysis of SlMYC genes in leaves under MeJA treatment by qRT-PCR. The expression patterns of SlMYC in response to 100 µM MeJA treatment for 3 h, 6 h, 12 h. Data represent the means of three biological replicates ±SD. Different colors were used to indicate different treatment times (p-values less than 0.05 are summarized with one asterisk, p-values less than 0.01 are summarized with two asterisks and p-values less than 0.0003 are summarized with three asterisk).
Agronomy 13 00757 g006
Figure 7. Response analysis of SlMYC genes in tomato leaves under NaCl stress by qRT-PCR. The expression patterns of SlMYC in response to 150 mM NaCl treatment for 3 h, 6 h, and 12 h. Data represent the means of three biological replicates ±SD. Different colors were used to indicate different treatment times (p-values less than 0.05 are summarized with one asterisk, and p-values less than 0.01 are summarized with two asterisks).
Agronomy 13 00757 g007
Figure 8. Response analysis of SlMYC genes in tomato leaves under mannitol by qRT-PCR. The expression patterns of SlMYC in response to 100 mM mannitol treatment for 3 h, 6 h, and 12 h. Data represent the means of three biological replicates ±SD. Different colors were used to indicate different treatment times (p-values less than 0.05 are summarized with one asterisk, and p-values less than 0.01 are summarized with two asterisks).
Agronomy 13 00757 g008
Figure 9. CRISPR/Cas9-mediated mutation of the SlMYC gene and the response of slmyc1 to NaCl and mannitol stress. (A) The size of DNA fragments amplified by PCR with genomic DNA. M: DNA marker. (B) Schematic diagram of the sgRNA target sites on the SlMYC1 gene and the sequencing results of the sequence near the mutation site of the SlMYC1 gene. M: marker. (C) Growth of the slmyc1 mutant and wild-type (WT) seeds after 96 h of NaCl and mannitol treatment. The tomato nutrient solution treatment was employed as a control (CK). (D) Statistical analysis of the root length of the slmyc1 mutant and the WT at 96 h after NaCl and mannitol treatment (p-values less than 0.05 are summarized with one asterisk). (E) Determination of ROS content in root tips of the slmyc1 mutant after 96 h of NaCl and mannitol treatment.
Agronomy 13 00757 g009
Table 1. Characteristics of the MYC gene family in Solanum lycopersicum. The bioinformatics online software ExPASy (https://web.expasy.org/protparam/) (accessed on 21 September 2021). was used to predict the physical and chemical properties of 14 tomato MYC family genes at the chromosomal positions and their corresponding protein sizes, molecular weights, and isoelectric and subcellular localization prediction points.
GeneAccession NumberChr. LocationNo. of Amino
Acids (aa)
Length of Gene (bp)Length of
CDS (bp)
Molecular
Weight (Da)
Predicted
Isoelectric Point (PI)
Subcellular Localization PredictionGRAVY
MYC1NM_001301178.2Chromosome 8: 33,463–35,2956302174189369,346.515.78Nucleus−0.564
MYC2NM_001324483.1Chromosome 8: 60,990,466–60,992,5356892485207075,041.115.51Nucleus−0.598
MYC2-like-1XM_004244608.3Chromosome 8: 2,993,511–2,996,7474521556135951,296.036.47Nucleus−0.431
MYC2-like-2XM_004248047.4Chromosome 10: 3,248,348–3,250,8303931608118245,112.045.85Nucleus−0.454
MYC3-likeXM_004248044.4Chromosome 10: 3,273,458–3,274,8134511769135650,463.805.98Nucleus−0.435
MYC4XM_004229943.4Chromosome 1: 87,017,635–87,020,6646053030181867,261.916.83Nucleus−0.528
MYC5XM_004229974.4 Chromosome 1: 87,325,345–87,327,2524501665135349,496.805.44Nucleus−0.348
MYC6XM_010322267.3Chromosome 5: 240,028–243,1784822143144954,013.275.84Nucleus−0.394
MYC7XM_010323205.3Chromosome 5: 61,560,052–61,562,6175792556174064,271.007.59Nucleus−0.425
MYC8XM_004242307.4 Chromosome 6: 49,306,848–49,309,6304772182143452,944.896.59Nucleus−0.472
MYC9XM_019215077.2 Chromosome 8: 51,962,518–51,966,9496022432180968,432.785.61Nucleus−0.874
MYC10NM_001347001.1Chromosome 8: 64,341,490–64,346,2976262353188170,053.835.49Nucleus−0.546
MYC11XM_004246037.4 Chromosome 8: 65,832,927–65,835,0494132123124246,922.748.41Nucleus−0.234
MYC12XM_010328066.3 Chromosome 9: 63,177,650–63,185,5256862425206175,694.235.10Nucleus−0.407
Disclaimer/Publisher’s Note: The statements, opinions and data contained in all publications are solely those of the individual author(s) and contributor(s) and not of MDPI and/or the editor(s). MDPI and/or the editor(s) disclaim responsibility for any injury to people or property resulting from any ideas, methods, instructions or products referred to in the content.

