Article

Irrigation Zone Delineation and Management with a Field-Scale Variable Rate Irrigation System in Winter Wheat

1
Department of Plant Soils Climate, Utah State University, Logan, UT 84322, USA
2
Plant and Wildlife Sciences, Brigham Young University, Provo, UT 84602, USA
3
Soil, Environmental and Atmospheric Sciences, University of Missouri, Columbia, MO 65211, USA
4
Department of Geography, Brigham Young University, Provo, UT 84602, USA
5
Department of Statistics, Brigham Young University, Provo, UT 84602, USA
6
Department of Crop and Soil Sciences, University of Washington, Pullman, WA 98195, USA
7
METER Group, Inc., Pullman, WA 99163, USA
*
Author to whom correspondence should be addressed.
Agronomy 2023, 13(4), 1125; https://doi.org/10.3390/agronomy13041125
Submission received: 16 March 2023 / Revised: 8 April 2023 / Accepted: 10 April 2023 / Published: 15 April 2023
(This article belongs to the Special Issue The Importance of Soil Spatial Variability in Precision Agriculture)

Abstract

:
Understanding spatial and temporal dynamics of soil water within fields is critical for effective variable rate irrigation (VRI) management. The objectives of this study were to develop VRI zones, manage irrigation rates within VRI zones, and examine temporal differences in soil volumetric water content (VWC) from irrigation events via soil sensors across zones. Five irrigation zones were delineated after two years (2016 and 2017) of yield and evapotranspiration (ET) data collection. Soil sensors were placed within each zone to give real time data of VWC values and assist in irrigation decisions within a 23 ha field of winter wheat (Triticum aestivum ‘UI Magic’) near Grace, Idaho, USA (2019). Cumulative irrigation rates among zones ranged from 236 to 298 mm. Although a statistical comparison could not be made, the irrigation rates were 0.6 to 21% less than an estimated uniform grower standard practice (GSP) irrigation approach. Based on soil sensor data, crop water stress was avoided with VRI management in all but Zone 3. Thus, this simple approach to VRI zone delineation and VWC monitoring has the potential to reduce irrigation, such as this study, on average by 12% and should be evaluated in other site-years to assess its viability.

1. Introduction

1.1. Yield and Crop Water Needs Are Spatially and Temporally Variable

Variation of crop yields are often related to factors, such as topographical changes, soil texture and property differences, compaction, nutrient variability, and pest distribution differences [1]. Significant within-field variation in yield has been observed even in fields that appear somewhat uniform. Some areas of a field may consistently produce lower or higher yields, while other areas are variable from year-to-year due to many interacting factors [2]. For example, Svedin (2018) [3] and Svedin et al. (2019) [4] found that wheat (Triticum aestivum spp.) yields ranged from 2.3 to 10.6 Mg ha−1 in a field with minimal topographic variation. One underlying cause of within-field yield variation of irrigated crops is spatiotemporal variation of soil water content, which varies significantly in seemingly uniform fields [5]. Understanding within-field and temporal variation of soil water can improve understanding of yield variation and inform precision management practices to improve resource use efficiency.
Agricultural irrigators using pressurized water delivery systems typically apply uniform irrigation as they seek to ensure that no area of the field is visibly water stressed [6]. However, uniform irrigation ignores variations in soil properties, nutrient availability, topographic features, microclimates, pest and pathogen pressure, and other factors that affect crop water use [3,4,7]. As a result, a field that is irrigated uniformly with an application of the average amount of water use would create water deficits in some areas within a field and surpluses in others [8].
Spatial variation of yield and crop water use have been linked to the variability of a wide variety of soil physical and chemical properties, such as texture, depth, water holding capacity, and apparent soil electrical conductivity (ECa) [5,9,10], as well as organic matter, topography, compaction, hydrophobicity, subsurface layers, nutrient deficiencies, pH, salinity/sodicity, and soil borne pathogens, nematodes, and insects [11]. The most visually obvious spatial differences are often related to topography. However, high within-field variability in soil water properties has been observed in mechanically leveled fields with minimal topographical undulations [5,12]. Svedin (2018) [3] and Svedin et al. (2019) [4] found surprisingly large differences in soil water holding capacity (SWHC) in a field with minimal apparent variation in many soil properties and topographical features.

1.2. Delineating and Managing Zones for VRI

Relatively new technology allows for a variable rate irrigation (VRI) in an effort to more precisely apply the water that is needed by a crop to potentially improve yields and reduce waste. The effectiveness of VRI is determined by accurately predicting variable water needs in zones within a field. Developing these zones can be performed by determining various static properties but are complicated by dynamic events that change year to year.
Soil properties are among the static conditions that are generally used to delineate VRI zones [6,13,14,15]. Many of these static soil properties impact the spatial variability of SWHC, which has been shown to influence yield and crop water use [10,16], including within-field variations of these properties [5,9]. As such, variation in SWHC is utilized to delineate zones [6,8,14,17,18] and inform VRI to help maximize crop production per unit of land and water [11].
While within-field variability of soil properties is important for characterizing VRI zones, topographical features also play a role in zone delineation. General topographic features used to describe within-field variability are elevation, slope, aspect, and curvature [2,19,20]. Water tends to move within fields from areas of higher elevation to lower areas of the field and often results in yield variation related to deficient, optimum, or excessive levels of water availability [2,3,4,21,22]. Combining topographical features with historical yield patterns, explained below, has been useful in delineating irrigation management zones for VRI [3,4,19].
While VRI zone delineation based on static soil properties or topographical features is common, some research has indicated that considering dynamic soil or crop factors could improve VRI management [5,7,23]. Examples of dynamic factors impacting crop water stress include variable precipitation and other weather conditions, snow accumulation impacting depth of soil water in spring, disease or pest pressure, and nutrient deficiencies [3,4,5,7,23]. These dynamic factors combine with the static variation of soil properties to make complex and variable spatial patterns of crop yields and evapotranspiration (ET).
Modeling daily ET for estimating crop water demand utilizing soil water sensors and remote sensing of the crop canopy are approaches that have been used to describe these spatially variable patterns [14,24,25,26]. Svedin (2018) [3] and Svedin et al. (2019) [4] found variable soil water dynamics throughout a field of winter wheat, such as spring soil volumetric water content (VWC). These have been effective variables in predicting late season crop water stress in arid regions [27].
Although irrigation zones have been characterized with soil and topographical properties, other dynamic field data, especially historical yield and ET, may improve the delineation of zones. Utilizing these other dynamic factors are not common within zone delineation for VRI management [17,28]. However, Svedin (2018) [3] and Svedin et al. (2019) [4] collected multiple years of yield data in a field with a wheat–wheat–potato cropping system and found consistency in yield patterns were apparent. These yield patterns likely have an impact on irrigation needs. Svedin (2018) [3] and Svedin et al. (2019) [4] combined yield data with ET to delineate zones based on productivity. This method could inform growers on how to delineate zones to irrigate their fields most efficiently.
In-season VRI management can be achieved with buried soil water matric potential (MP) or VWC sensors measuring temporal variation. [29,30]. Sensor costs and installation time generally prevent their use for high density spatial coverage within production fields, and selecting locations for sensors within a field presents an important challenge [29,31,32].
Delineating VRI zones has been performed using variables, such as topography and static soil properties, but experiments using dynamic variables, such as historical yield and ET patterns to create zones, and then irrigated with soil sensors require more examination. The objectives of this study were to: (i) develop VRI zones using observations of within-field variation in crop yield and ET; (ii) manage spatially and temporally unique irrigation rates within VRI zones for a winter wheat crop; and (iii) assess whether VRI was effective at maintaining VWC within zone-specific soil bands of readily available water.

2. Materials and Methods

2.1. Study Site

This study was conducted on three years (2016, 2017, and 2019) of spatial and temporal data collected from a winter wheat (Triticum aestivum ‘UI Magic’) field (23 ha) near Grace, ID, USA (elevation 1706 m above sea level; 42.60904 latitude and −111.788 longitude; ArcGIS Pro 2.7.1, Redlands, CA, USA). The previous crop in 2015 and 2018 was potato (Solanum tuberosum L.) with the historic cropping system of wheat–wheat–potato. The field is in a semi-arid region with a climate typified with relatively hot days and cool nights during the summer growing season with an average air temperature of 15 °C and about 80 to 110 frost-free days. Average annual precipitation is 0.39 m [33] with most of the precipitation occurring during winter as snowfall. The growing season precipitation (May–August) was below average (0.15 m) [33] during the time of this trial, with precipitation between spring soil sampling and harvest totaling to 0.099, 0.090, and 0.092 m in 2016, 2017, and 2019, respectively. The soil is a silty clay loam Rexburg-Ririe complex, with 1 to 4 % slopes, described as coarse-silty, mixed, superactive, frigid Calcic Haploxerolls that derive from alluvial influenced loess [34]. The field has a 6 m difference between the lowest and highest elevation (Figure 1).
Soil texture was measured at four 0.3 m depth increments from the surface level down to 1.2 m at 46 spatially distributed sites (70 m grid) across the field. The silty clay loam texture was confirmed at 42 of the sample sites, and the remaining four sites were classified as silty clay.
Irrigation was applied using a 380 m center pivot with a 5 m nozzle spacing equipped with a zone-control VRI system (GrowSmart Precision VRI, Lindsay Corporation, Omaha, NE, USA). Irrigation events occurred every 5–7 days in spring and every 3–5 days during summer at peak ET. There are 0.3 ha of shallow and emerged bedrock that are not farmed or irrigated, and these water savings are not included in the results of this study but are certainly part of the overall savings experienced by the grower. The cooperating grower managed all aspects of wheat production.

2.2. Soil Volumetric Water Content (VWC)

The soil sampling grid (70 m) was determined from the range (140 m) of a fitted semi-variogram determined using the approach of Kerry and Oliver [35], which recommends using a grid interval of half the variogram range for a variogram of ancillary data that are related to the property of interest. The semi-variogram for this sampling grid was calculated from the 1 m resolution normalized difference vegetation index (NDVI) from a color-infrared National Agriculture Imagery Program (NAIP) of bare soil imagery from winter of 2015, https://www.usgs.gov/centers/eros/science/usgs-eros-archive-aerial-photography-national-agriculture-imagery-program-naip (accessed on 3 April 2023). In 2016 and 2017, 46 gridded samples were collected on the 70 m grid, with an additional 39 random sample points (85 total). These additional random samples at shorter intervals mean that when interpolating data for any measured variable, the nugget variance of the variogram is more accurately estimated, and this will give more accurate kriged estimates. Beginning in 2019, 56 nested sample sites were collected as well as the 46 gridded sample points (102 total). This sampling scheme was used to calculate the spatial variation of soil VWC and soil water depletion over time. Soil samples were collected on 18 April and 20 August 2016, 4 May and 1 September 2017, and 23 April, 30 May, 25 June, and 5 September 2019. These samples were used within each year to calculate ET from a season-long water balance equation, calculate crop water productivity (CWP), initialize a daily soil water depletion model, and compute reliable variograms for kriging [36]. Mid-season soil samples were collected at all locations on 30 May, and half of the sampling locations on 25 June in 2019 to provide further in-depth, in-season validation calculations for the soil water depletion model used. Soil samples were collected using a 0.051 m diameter soil probe in 2016 and 2017. In 2019, soil probes with a diameter of 0.019 m were driven into the profile with a modified gas-powered post driver (AMS, Inc. American Falls, ID, USA). At each sampling point, a soil core was taken to approximate the final depth of rooting at increments of 0–0.3, 0.3–0.6, 0.6–0.9, and 0.9–1.2 m. Samples were sealed for transport to the laboratory where gravimetric soil water content was determined by drying in a forced-air oven at 105 °C until consistent weights were reached. Soil gravimetric water content was converted to VWC using soil bulk density values determined in 2016 from previous samples [3,4]. Prior to geostatistical analysis of soil VWC, yield, ET, and CWP, summary statistics were calculated and histograms plotted. If the skewness of the dataset was outside the bounds of ±1, then the data were transformed to logarithms for variogram computation and backtransformed to the original scale following kriging [37]. Following variogram computation, each variable was ordinary kriged to a 5 m grid. All variograms and kriging was completed using SpaceStat (BioMedware, SpaceStat 4, Ann Arbor, MI, USA), and ArcGIS desktop: Release 10 (Redlands, CA, USA). JMP Pro 14 (SAS Institute, Cary, NC, USA) was used for distribution statistics.

2.3. Evapotranspiration

The ET for the wheat growing season (18 April–20 August 2016, 4 May–1 September 2017, and 23 April–5 September 2019) was calculated for each sampling location within the field using the following water balance equation:
E T = P + I + S R O D
where “P” is total season-long precipitation (m), “I” is total season-long irrigation (m), “ΔS” is the change in the depth of soil water in a 1.2 m deep profile between sampling events at spring green-up and harvest, “RO” is surface water runoff (m), and “D” is soil water drainage (m) below the sampling depth. Drainage was calculated from a separate daily soil water balance as any amount of water (P + I) that exceeded site specific field capacity (FC) values for the 1.2 m deep profile. Reference ET and crop coefficients from the cooperative agricultural weather network AgriMet [33] were used to determine the daily soil water balance. Seasonal RO was assumed negligible because the greatest daily precipitation event was 0.0086 m, and soil infiltration rates exceeded this amount, and there were no visible indications of surface water movement. The season-long ET water balance calculation began at the date of spring soil sampling and ended at the date of the fall soil sampling.

2.4. Yield and Crop Water Productivity

Grain was harvested with a commercial combine equipped with a calibrated yield monitor (New Holland IntelliView 4, Turin, Italy) using a mass flow sensor collecting yield data every 10 m2. The yield data were processed as described by Kerry and Oliver [35]. Erroneous data points were defined as outside the limits of ±75% of the median. In addition, points where the wheat combine did not harvest the full header width were removed. Wheat yield data were calibrated using a weigh cart and validated with wheat bin storage showing an overall accuracy of ±1%.
Season-long ET at each sample location was used to calculate CWP. Crop water productivity was calculated as follows:
C W P = Y / E T
where Y is yield (kg ha−1) and ET is season-long evapotranspiration (mm) assessed at each sample point from pre-planting to harvest.

2.5. Irrigation Management Zones

Irrigation zones for 2019 were created from yield and ET data collected from 2016 and 2017 [3,4,38]. In 2016, yield and ET were evaluated under the grower standard practice (GSP) of uniform irrigation. In 2017, yield and ET were evaluated under VRI with irrigation treatments created based on three years (2013, 2014, 2016) of yield data and CWP in 2016 [3,4]. The 2017 irrigation included low (0.7 × GSP) and high (1.3 × GSP) irrigation treatments and two control strips (GSP) for within-year comparisons. Irrigation differences among treatments were created to give plus-or-minus 15% difference in season-long ET. The observed reactions of the field to 2017 irrigation treatments were used to create and manage spatially variable irrigation zones for the 2019 growing season. This was accomplished by using a regression where yield was the response variable and ET was the explanatory variable. Then, a k-means clustering algorithm was conducted based on the slope of the regression and with constraints for spatial contiguity to map out the five irrigation zones (Figure 1) [17]. During the 2019 growing season, irrigation rates for each zone were derived by comparing VWC measured by sensors in each zone to the zone average FC values and applied to bring the upper 0.3 m soil depth to a soil water content approximately equal to FC [38]. Irrigations were timed to keep water depletion from decreasing below readily available water (RAW). Cumulative irrigation amounts in each zone were compared with a cumulative estimated GSP irrigation amount. The 2019 GSP rates were estimated from a combination of historical GSP rates from the same crop under uniform irrigation and considering rates from a neighboring field with a similar crop during that same year.
The FC values were approximated within each zone by averaging the greatest of the three green-up (wheat at early spring) observed VWC values for each soil sample within their given zones between 2016 and 2018. The FC was assumed based on the soil being recently saturated from melting snow and spring precipitation but having at least three days for drainage with minimal ET losses during this time. Wilting point (WP) was assumed from fall soil samples because the soils had been dried down for harvest with 15, 7.1, and 1.3 mm of rainfall 18, 25, and 16 d after the last irrigation event for 2016, 2017, and 2019, respectively. The WP values were chosen from the lowest VWC values between these three years of sampling at the post-harvest sampling dates. The WP assumption was validated on 39 samples using a Decagon WP4C (WP4C Dewpoint Potentiometer, METER Group, Inc.—formally Decagon Devices, Pullman, WA, USA) to estimate the relationship between VWC and water potential. For each validation sample, 4–5 known volumetric moisture values were analyzed on the WP4C to calculate water potential. Using a logarithmic fitted line, VWC was estimated at −1500 kPa for each sample and compared to the field estimated WP. All measured volumetric WP values were within ±10% of the fall VWC values for individual depths, and within a 5% error when averaged for the whole soil profile, verifying the assumption that fall soil samples were at or very near WP.
The soil water retained between FC and WP was calculated as total available water (TAW, mm), which is the water available to the plant, using the following equation:
TAW = 1000 (FC − WP) Zr
where “FC” is field capacity (m), “WP” is wilting point (m), and “Zr” is the rooting depth (m). Readily available water (RAW) is the portion of water within the TAW that can be taken up by plants before the plant develops crop stress. The equation to calculate RAW is as follows:
R A W = p T A W
where “ p ” is the average fraction of TAW that can be depleted from the root zone before the crop experiences stress and yields are limited. The p value of 0.55 was assigned to the winter wheat crop [39].

2.6. VWC Data Collection through Soil Sensors in 2019

During the 2019 growing season, soil sensors were installed to measure VWC (TEROS 12, METER Group, Inc., Pullman, WA, USA) and soil MP (TEROS 21, Meter, Pullman, WA, USA) with data loggers (ZL6, METER Group, Inc., Pullman, WA, USA) in each of the five irrigation zones. The location of the sensors placed within each zone was chosen to reflect the average measured VWC for that zone. One of each sensor type was installed 0.03–0.05 m apart at 0.15 and 0.45 m below the soil surface with an additional VWC sensor at 0.75 m depth at each of the five locations (Figure 1). The sensors logged data every 15 min. The loggers and sensors were installed on April 23 and removed just prior to harvest on August 20.

3. Results

3.1. Zone Delineation by Observed CWP

Under uniform irrigation in 2016, the field average yield was 7.5 Mg ha−1 with a range of 2.3–10.6 Mg ha−1 and a field average ET of 520 mm with a range of 315–571 mm (Figure 2).
Under spatially variable irrigation in 2017, a similar yield range was observed (1.8–8.4 Mg ha−1), but the field average yield decreased to 5.8 Mg ha−1 (Figure 2). This phenomenon is common in second-year wheat grown in wheat–wheat–potato crop rotations as disease and pest pressure increase within the second wheat year [40,41,42], and it is assumed that the observed differences are not because of the change in irrigation practice. The irrigation treatments did influence yield within 2017 with the low and high irrigation treatments averaging 4.9 and 6.4 Mg ha−1, respectively. Average ET was 497 mm with a range of 255–620 mm (Figure 2). The low and high zones had an average ET of 435 and 573 mm, respectively. Although the range of yield was less in 2017 than 2016, it is notable that the range of ET was 109 mm greater in 2017. The spatial pattern of ET was largely dictated by irrigation treatments while the spatial pattern in the yield was similar to that observed under uniform irrigation in 2016. These comparisons were made to evaluate crop water response under variable conditions, and no statistical comparisons of yield across years were performed.
In these years, CWP patterns were more closely related to yield than ET. In 2016, average CWP was 14 kg ha−1 mm−1 with a range of 4.7–21 kg ha−1 mm−1 (Figure 2). In 2017, average CWP was 11 kg ha−1 mm−1 with a range of 4.1–19 kg ha−1 mm−1 (Figure 2). In 2016, CWP generally increased in areas where ET was lower. Similarly, in 2017, yields improved but CWP decreased in the high irrigation treatment areas where 30% more irrigation was applied. For the low treatment where irrigation was decreased by 30%, yields decreased and CWP increased.

3.2. 2019 Variable Rate Irrigation

A five-zone VRI map for 2019 was generated based on the CWP from both uniform and variable irrigation seasons in 2016 and 2017 (Figure 1). Irrigation rates were unique for each zone and irrigation event. The total area in each zone was 2.5, 7.7, 3.6, 7.2, and 1.8 ha for Zones 1, 2, 3, 4, and 5, respectively.
Variable irrigation rates in 2019 were determined from observed VWC values from installed soil sensors and zone-specific average FC values. Temporal changes in soil-sensor VWC for each zone are depicted in Figure 3.
The VRI irrigation scheduling approach was successful in maintaining VWC between FC and RAW during critical growth stages in each zone, except for a short time in Zone 3 (Figure 3). The distinctive VWC patterns between irrigation zones provide evidence for value from VRI.
There was a total of 14 irrigation events, beginning at 131 d after planting (May 11) and ending at 199 d (July 18). Applied irrigation rates for individual events and zones ranged from 5 to 28 mm, with an average application of 15 mm per event (Table 1).
Total season-long irrigation averaged 262 mm for the entire field, with 285, 236, 298, 237, and 254 mm in Zones 1, 2, 3, 4, and 5, respectively (Figure 4 and Table 1).
Although the study was not designed to statistically compare VRI to a control, it is useful to compare to the 2019 estimated GSP. The GSP for this field would have had 17 irrigation events of 18 mm each for a total of 300 mm (Table 1). Compared to the estimated GSP, these season-long irrigation amounts represent 5, 21, 0.6, 21, and 14% (2–64 mm) less water for Zones 1 through 5, respectively, with an overall average of a 12% reduction.

4. Discussion

4.1. Zone Delineation

Commonly employed methods of delineating VRI zones include TAW, electrical conductivity data, yield data, and others [14,17,28]. Utilizing a combination of yield and ET from historical data is a relatively simple approach that has not been widely considered. Widespread adoption of on-the-go yield sensors provides easily accessible yield information. Implementation of measuring the same number of spring and fall soil samples as collected in this study to estimate ET is not practical for growers and their agronomists, although a few samples are reasonable [15]. Other methods of obtaining ET at the requisite spatial density are possible through remote sensing estimates, modeling, or the use of ancillary variables to delineate zones that reflect CWP variability [25,28,43]. The method of using CWP (yield and ET) did not capture all the variation within the field but coupling the zones created from CWP while utilizing the variation of VWC and FC from soil sensors to make in-season irrigation management decisions did play an important role in the entirety of the VRI process of irrigation management. This approach can improve spatial precision and accuracy of irrigation—potentially improving the crop and conserving water.

4.2. Cumulative Irrigation Events

While irrigation rates within the zones may have been similar to each other at the beginning of the season, rates changed as plants matured, weather changed, and water levels decreased in soil profiles (Figure 4). This showed that less water was needed at different times of the season, and it was assumed that potential drainage or runoff was avoided within the irrigation zones. In addition to the difference in FC values among zones, the difference in water needs across zones could be described by areas that are more productive than others, resulting in higher water needs because ET increased in productive areas. The differences could also be from topography changes, even if they are slight within this field, and zones with slopes may see a dry down sooner than those with no slopes. For example, Zone 3 is situated on a ridge with a slope that moves toward Zone 2 (Figure 1). The VWC in Zone 3 did not reach FC after the irrigation events (Figure 4), and although there was no visible runoff, subterranean lateral water movement within the soil profile toward Zone 2 could have occurred. Zone 3 also shows historically lower yields compared to other parts of the field, which could affect the water needs as the plants are not as productive in this zone as other zones. Considering these aspects throughout each zone could be beneficial in understanding the individual water needs. Utilizing a sensor-based VRI management scheme resulted in a reduction in the number of irrigation events and the total water applied in each zone with no measurable negative impacts on yield.
When the field was irrigated to FC within each zone, total water applied was reduced. Although the zones were irrigated at rates greater than the estimated GSP at different times within the growing season, this was performed (Figure 4) to avoid bringing the plants into a state of crop stress where yield is negatively affected. All zones showed lower cumulative irrigation compared to total estimated GSP, which resulted in water savings that are similar to other studies [11,14]. Managing VRI with zones that address the natural spatial variation of soil properties, such as FC, can result in water savings and has been noted to be valuable [18,25].
The project results suggest that using sensors to carefully monitor VWC and ensuring each zone was maintained at FC was successful at avoiding crop stress (Figure 3). The onset of crop water stress did occur in 21% of field locations in 2019; however, 79% did not reach that level of stress until the end of the season [44]. Indeed, by using this approach, stress was delayed well beyond the GST, starting around Day 174 (24 July) [4]. Although methodology for an exact sensor location is still in process [32,45], using irrigation zones can increase water use efficiency and delay the onset of crop water stress leading to higher yield and water savings [11].

4.3. Temporal Differences of VWC

The VWC is affected by permanent soil properties, such as soil texture, SWHC, FC, and WP [7,9,18]. However, Baroni et al. [46] showed that soil properties alone do not account for all the spatiotemporal VWC variation. Topography, dynamic climate factors, variation in crop growth and ET, and other factors affect the variation of VWC throughout a field. This suggests that irrigation decisions should include input beyond VWC, such as leaf area index. Research has found that irrigating based on sensors placed in each VRI zone has resulted in water savings [11]. This study showed that irrigating unique rates, which varied on average by 10.8 mm among watering events, according to differences in soil properties among zones coupled with VWC sensors were valuable resources to apply the right amount of water in each zone. The water savings generated by a reduced application by an average of 12% due to VWC values gave the cooperating grower more water to apply to historically underwatered areas. Further, in the past, the area just west of the ridgeline (mainly in Zone 2) would be overwatered under uniform irrigation. This was a problem, especially during a potato crop, because the excess moisture would cause disease in that part of the field and decrease yields.
The VWC sensor curves did not reach FC at each irrigation event potentially due to the buffering effect of the lower soil profile. The deeper depths of the soil profiles still contained water at the beginning of the season, but as the season progressed, and plants continued to grow and mature, those deeper profiles depleted more water throughout the season. This buffering effect is evident in the different zones. For example, the VWC in Zone 1 increased each time irrigation was applied, but Zone 2 did not respond in the same manner as the VWC would continue to decrease with irrigation events. Only after large amounts of irrigation were applied in July did the VWC in Zone 2 finally increase. The reasoning for this could have been that the lower soil profiles were eventually filled enough for the 0.30 m depth to also retain water. As irrigation events were watered to only the first soil’s depth (0.30 m) of FC, water continued to move downward and could have been taken up by deeper roots. This could explain why FC was not always reached after irrigation events. Although it would seem beneficial to water to multiple depths of FC values, these rates became too high for the center pivot to water as the growers’ pivot had a maximum rate of 29 mm per pass.
In situ sensors provide temporal water status at static locations but do not provide information at spatial scales required for developing VRI zones [11]. Installing multiple sensors per field is cost prohibitive and increases VRI implementation costs [11]. Utilizing sensors in combination with satellite imagery may be an effective strategy to reduce the need for multiple sensors per field. For example, Landsat and Sentinel 2 imagery was used to estimate soil moisture throughout the growing season [44], and Landsat satellite imagery was used to detect spatial variability of crop water stress [31]. These strategies could be used to assist in making sensor placement decisions. Understanding the spatial variability within each zone can assist growers not only in making sensor placement decisions and irrigation rate decisions but also in delineating VRI zones as they are cost efficient and provide spatially dense data.

5. Conclusions

Delineating five VRI zones from historic yield and ET observations effectively reduced irrigation requirements in the field utilized in this study. Irrigation was further refined by implementing in situ VWC soil moisture sensors to inform spatially precise irrigation rates to conserve irrigation water. Utilizing the natural variation in soil properties among zones incorporated with zone-specific VWC soil sensors is a useful irrigation management practice to maintain VWC below FC and above RAW values in each zone, thus saving water and protecting the crop from the early onset of crop water stress. Although a statistical comparison could not be made, these methods presented the ability to conserve water and improve water use efficiency. Further work is required to find more accurate ways of delineating zones, identifying optimal sensor placement, and measuring spatial FC values in a cost-effective manner. Refining VRI zone delineation and decision support systems will improve water usage and conserve increasingly scarce water resources.

Author Contributions

Conceptualization, E.A.F., B.G.H., J.D.S. and N.C.H.; methodology, E.A.F., B.G.H., R.K., M.J.H., R.R.J. and N.C.H.; software, R.K.; validation, E.A.F., B.G.H., R.K. and N.C.H.; formal analysis, E.A.F., B.G.H., R.K., M.J.H., R.R.J. and N.C.H.; investigation, E.A.F., B.G.H., J.D.S. and N.C.H.; resources, C.S.C. and R.K.; data curation, E.A.F., B.G.H., J.D.S., R.K., R.R.J., C.S.C. and N.C.H.; writing—original draft preparation, E.A.F., B.G.H., R.K., R.R.J. and N.C.H.; writing—review and editing, E.A.F., B.G.H., J.D.S., R.K., M.J.H., R.R.J., C.S.C., M.A.Y. and N.C.H.; visualization, E.A.F., B.G.H., R.K. and N.C.H.; supervision, E.A.F., B.G.H., R.R.J. and N.C.H.; project administration, E.A.F., B.G.H., R.R.J. and N.C.H.; funding acquisition, B.G.H., M.A.Y. and N.C.H. All authors have read and agreed to the published version of the manuscript.

Funding

This research was funded by United States-Israel Binational Agricultural Research and Development Fund, grant number IS-5218-10, and USDA Western Sustainable Agricultural Research and Education Program, grant number SW19-909. The APC was funded by Brigham Young University.

Data Availability Statement

Interested parties can contact the corresponding author regarding data availability.

Acknowledgments

We would like to acknowledge BKR Farms as they provided the field site equipped with the variable rate irrigation system required for this project’s success. Many students from Brigham Young University research labs not listed as authors assisted in field work associated with data on which this paper is based.

Conflicts of Interest

The authors declare no conflict of interest. The funders had no role in the design of the study; in the collection, analyses, or interpretation of data; in the writing of the manuscript; or in the decision to publish the results.

References

  1. Zhu, X.; Chikangaise, P.; Shi, W.; Chen, W.H.; Yuan, S. Review of Intelligent Sprinkler Irrigation Technologies for Remote Autonomous System. Int. J. Agric. Biol. Eng. 2018, 11, 23–30. [Google Scholar] [CrossRef]
  2. Maestrini, B.; Basso, B. Drivers of Within-Field Spatial and Temporal Variability of Crop Yield across the US Midwest. Sci. Rep. 2018, 8, 1–9. [Google Scholar] [CrossRef]
  3. Svedin, J.D. Characterizing the Spatial Variation of Crop Water Productivity for Variable-Rate Irrigation Management, Brigham Young University, Provo. 2018. Available online: https://scholarsarchive.byu.edu/cgi/viewcontent.cgi?article=7878&context=etd (accessed on 6 December 2022).
  4. Svedin, J.D.; Hansen, N.C.; Kerry, R.; Hopkins, B.G. Modeling Spatio-Temporal Variations in Crop Water Stress for Variable-Rate Irrigation. In Proceedings of the Precision Agriculture ’19—Papers Presented at the 12th European Conference on Precision Agriculture, Montpellier, France, 8–11 July 2019; Wageningen Academic Publishers: Wageningen, The Netherlands, 2019; pp. 687–693. [Google Scholar] [CrossRef]
  5. Longchamps, L.; Khosla, R.; Reich, R.; Gui, D.W. Spatial and Temporal Variability of Soil Water Content in Leveled Fields. Soil Sci. Soc. Am. J. 2015, 79, 1446–1454. [Google Scholar] [CrossRef]
  6. De Lara, A.; Khosla, R.; Longchamps, L. Characterizing Spatial Variability in Soil Water Content for Precision Irrigation Management. Adv. Anim. Biosci. 2017, 8, 418–422. [Google Scholar] [CrossRef]
  7. Evans, R.G.; King, B.A. Site-Specific Sprinkler Irrigation in a Water-Limited Future. Trans. ASABE 2012, 55, 493–504. [Google Scholar] [CrossRef]
  8. King, B.A.; Stark, J.C.; Wall, R.W. Comparison of Site-Specific and Conventional Uniform Irrigation Management for Potatoes. Appl. Eng. Agric. 2006, 22, 677–688. [Google Scholar] [CrossRef]
  9. Haghverdi, A.; Leib, B.G.; Washington-Allen, R.A.; Ayers, P.D.; Buschermohle, M.J. High-Resolution Prediction of Soil Available Water Content within the Crop Root Zone. J. Hydrol. 2015, 530, 167–179. [Google Scholar] [CrossRef]
  10. Sadler, E.J.; Evans, R.G.; Stone, K.C.; Camp, C.R. Opportunities for Conservation with Precision Irrigation. J. Soil Water Conserv. 2005, 60, 371–378. [Google Scholar]
  11. O’Shaughnessy, S.A.; Evett, S.R.; Colaizzi, P.D.; Andrade, M.A.; Marek, T.H.; Heeren, D.M.; Lamm, F.R.; LaRue, J.L. Identifying Advantages and Disadvantages of Variable Rate Irrigation: An Updated Review. Appl. Eng. Agric. 2019, 35, 837–852. [Google Scholar] [CrossRef]
  12. Daccache, A.; Knox, J.W.; Weatherhead, E.K.; Daneshkhah, A.; Hess, T.M. Implementing Precision Irrigation in a Humid Climate—Recent Experiences and on-Going Challenges. Agric. Water Manag. 2015, 147, 135–143. [Google Scholar] [CrossRef]
  13. Hedley, C.B.; Yule, I.J.; Tuohy, M.P.; Vogeler, I. Key Performance Indicators for Simulated Variable-Rate Irrigation of Variable Soils in Humid Regions. Trans. ASABE 2009, 52, 1575–1584. [Google Scholar] [CrossRef]
  14. Hedley, C.B.; Yule, I.J. Soil Water Status Mapping and Two Variable-Rate Irrigation Scenarios. Precis. Agric. 2009, 10, 342–355. [Google Scholar] [CrossRef]
  15. Messick, R.M.; Heaton, M.J.; Hansen, N. Multivariate Spatial Mapping of Soil Water Holding Capacity with Spatially Varying Cross-Correlations. Ann. Appl. Stat. 2017, 11, 69–92. [Google Scholar] [CrossRef]
  16. Zhao, W.X.; Li, J.; Yang, R.M.; Li, Y.F. Crop Yield and Water Productivity Responses in Management Zones for Variable-Rate Irrigation Based on Available Soil Water Holding Capacity. Trans. ASABE 2017, 60, 1659–1667. [Google Scholar] [CrossRef]
  17. Haghverdi, A.; Leib, B.G.; Washington-Allen, R.A.; Ayers, P.D.; Buschermohle, M.J. Perspectives on Delineating Management Zones for Variable Rate Irrigation. Comput. Electron. Agric. 2015, 117, 154–167. [Google Scholar] [CrossRef]
  18. Lo, T.; Heeren, D.M.; Mateos, L.; Luck, J.D.; Martin, D.L.; Miller, K.A.; Barker, J.B.; Shaver, T.M. Field Characterization of Field Capacity and Root Zone Available Water Capacity for Variable Rate Irrigation. Appl. Eng. Agric. 2017, 33, 559–572. [Google Scholar] [CrossRef]
  19. Huang, X. Analysis of Effects of Soil Properties, Topographical Variables and Management Practices on Spatial-Temporal Variability of Crop Yields. Ph.D. Thesis, Michigan State University, East Lansing, MI, USA, 2008. [Google Scholar] [CrossRef]
  20. Moore, I.D.; Gessler, P.E.; Nielsen, G.A.; Peterson, G.A. Soil Attribute Prediction Using Terrain Analysis. Soil Sci. Soc. Am. J. 1993, 57, 443–452. [Google Scholar] [CrossRef]
  21. Maestrini, B.; Basso, B. Predicting Spatial Patterns of Within-Field Crop Yield Variability. Field. Crops. Res. 2018, 219, 106–112. [Google Scholar] [CrossRef]
  22. Kravchenko, A.N.; Bullock, D.G.; Boast, C.W. Joint Multifractal Analysis of Crop Yield and Terrain Slope. Agron. J. 2000, 92, 1279–1290. [Google Scholar] [CrossRef]
  23. Evans, R.G.; LaRue, J.; Stone, K.C.; King, B.A. Adoption of Site-Specific Variable Rate Sprinkler Irrigation Systems. Irrig. Sci. 2013, 31, 871–887. [Google Scholar] [CrossRef]
  24. Jimenez, A.F.; Ortiz, B.V.; Bondesan, L.; Morata, G.; Damianidis, D. Long Short-Term Memory Neural Network for Irrigation Management: A Case Study from Southern Alabama, USA. Precis. Agric. 2021, 22, 475–492. [Google Scholar] [CrossRef]
  25. Hedley, C.B.; Yule, I.J. A Method for Spatial Prediction of Daily Soil Water Status for Precise Irrigation Scheduling. Agric. Water Manag. 2009, 96, 1737–1745. [Google Scholar] [CrossRef]
  26. Vories, E.; O’Shaughnessy, S.; Andrade, M. Comparison of Precision and Conventional Irrigation Management of Cotton. In Proceedings of thePrecision Agriculture ’19—Papers Presented at the 12th European Conference on Precision Agriculture, Montpellier, France, 8–11 July 2019; Wageningen Academic Publishers: Wageningen, The Netherlands, 2019; pp. 695–702. [Google Scholar] [CrossRef]
  27. O’Shaughnessy, S.A.; Evett, S.R.; Colaizzi, P.D.; Howell, T.A. A Crop Water Stress Index and Time Threshold for Automatic Irrigation Scheduling of Grain Sorghum. Agric. Water Manag. 2012, 107, 122–132. [Google Scholar] [CrossRef]
  28. King, B.A.; Brady, R.A.; McCann, I.R.; Stark, J.C. Variable Rate Water Application through Sprinkler Irrigation. In Site-Specific Management for Agricultural Systems; American Society of Agronomy: Madison, WI, USA, 1995; pp. 485–493. [Google Scholar] [CrossRef]
  29. Bianchi, A.; Masseroni, D.; Thalheimer, M.; de Medici, L.O.; Facchi, A. Field Irrigation Management through Soil Water Potential Measurements: A Review. Ital. J. Agrometeorol. 2017, 22, 25–38. [Google Scholar] [CrossRef]
  30. López-Riquelme, J.A.; Pavón-Pulido, N.; Navarro-Hellín, H.; Soto-Valles, F.; Torres-Sánchez, R. A Software Architecture Based on FIWARE Cloud for Precision Agriculture. Agric. Water Manag. 2017, 183, 123–135. [Google Scholar] [CrossRef]
  31. Smith, R.; Oyler, L.; Campbell, C.; Woolley, E.A.; Hopkins, B.G.; Kerry, R.; Hansen, N.C. A New Approach for Estimating and Delineating Within-Field Crop Water Stress Zones with Satellite Imagery. Int. J. Remote. Sens. 2021, 42, 6005–6024. [Google Scholar] [CrossRef]
  32. Zhao, W.; Li, J.; Yang, R.; Li, Y. Determining Placement Criteria of Moisture Sensors through Temporal Stability Analysis of Soil Water Contents for a Variable Rate Irrigation System. Precis. Agric. 2018, 19, 648–665. [Google Scholar] [CrossRef]
  33. AgriMet Columbia-Pacific Northwest Region|Bureau of Reclamation. Available online: https://www.usbr.gov/pn/agrimet/wxdata.html (accessed on 13 March 2023).
  34. Soil Survey Staff. Web Soil Survey. USDA-NRCS. Available online: https://websoilsurvey.sc.egov.usda.gov/App/WebSoilSurvey.aspx (accessed on 6 December 2022).
  35. Kerry, R.; Oliver, M.A. Variograms of Ancillary Data to Aid Sampling for Soil Surveys. Precis. Agric. 2003, 4, 261–278. [Google Scholar] [CrossRef]
  36. Webster, R.; Oliver, M.A. Geostatistics for Environmental Scientists; Wiley: Hoboken, NJ, USA, 2007. [Google Scholar]
  37. Kerry, R.; Oliver, M.A. Determining Nugget:Sill Ratios of Standardized Variograms from Aerial Photographs to Krige Sparse Soil Data. Precis. Agric. 2008, 9, 33–56. [Google Scholar] [CrossRef]
  38. Woolley, E.A. Soil Water Dynamics within Variable Rate Irrigation Zones of Winter Wheat. Masters Thesis, Brigham Young University, Provo, UT, USA, 2020. Available online: https://scholarsarchive.byu.edu/etd (accessed on 15 February 2023).
  39. Allen, R.G.; Pereira, L.S.; Raes, D.; Smith, M. Crop Evapotranspiration—Guidelines for Computing Crop Water Requirements—FAO Irrigation and Drainage Paper 56; Food and Agriculture Organization of the United Nations: Rome, Italy, 1998; Available online: https://www.fao.org/3/x0490e/x0490e00.htm (accessed on 6 December 2022).
  40. Myers, P.; McIntosh, C.S.; Patterson, P.E.; Taylor, R.G.; Hopkins, B.G. Optimal Crop Rotation of Idaho Potatoes. Am. J. Potato. Res. 2008, 85, 183–197. [Google Scholar] [CrossRef]
  41. Agricultural Experiment & UI Extension Publications. Irrigated Spring Wheat Production Guide for Southern Idaho. Available online: https://www.lib.uidaho.edu/digital/uiext/items/uiext23590.html (accessed on 5 April 2023).
  42. Bockus, W.W.; Bowden, R.L.; Hunger, R.M.; Morrill, W.L.; Murray, T.D.; Smiley, R.W. Compendium of Wheat Diseases and Pests, 3rd ed.; The American Phytopathological Society: St. Paul, MN, USA, 2010. [Google Scholar] [CrossRef]
  43. Hawley, M.E.; Jackson, T.J.; Mccuen, R.H. Surface Soil Moisture Variation on Small Agricultural Watersheds. J. Hydrol. 1983, 62, 179. [Google Scholar] [CrossRef]
  44. Woolley, E.A.; Kerry, R.; Hansen, N.C.; Hopkins, B.G. Variable Rate Irrigation: Investigating within-Zone Variability. In Precision Agriculture ’21, Proceedings of the 13th European Conference on Precision Agriculture, Budapest, Hungary, 18–22 July 2021; Wageningen Academic Publishers: Wageningen, The Netherlands, 2021; pp. 635–641. [Google Scholar] [CrossRef]
  45. Kaleita, A.L.; Hirschi, M.C.; Tian, L.F. Field-Scale Surface Soil Moisture Patterns and Their Relationship to Topographic Indices. Trans. ASABE 2007, 50, 557–564. [Google Scholar] [CrossRef]
  46. Baroni, G.; Ortuani, B.; Facchi, A.; Gandolfi, C. The Role of Vegetation and Soil Properties on the Spatio-Temporal Variability of the Surface Soil Moisture in a Maize-Cropped Field. J. Hydrol. 2013, 489, 148–159. [Google Scholar] [CrossRef]
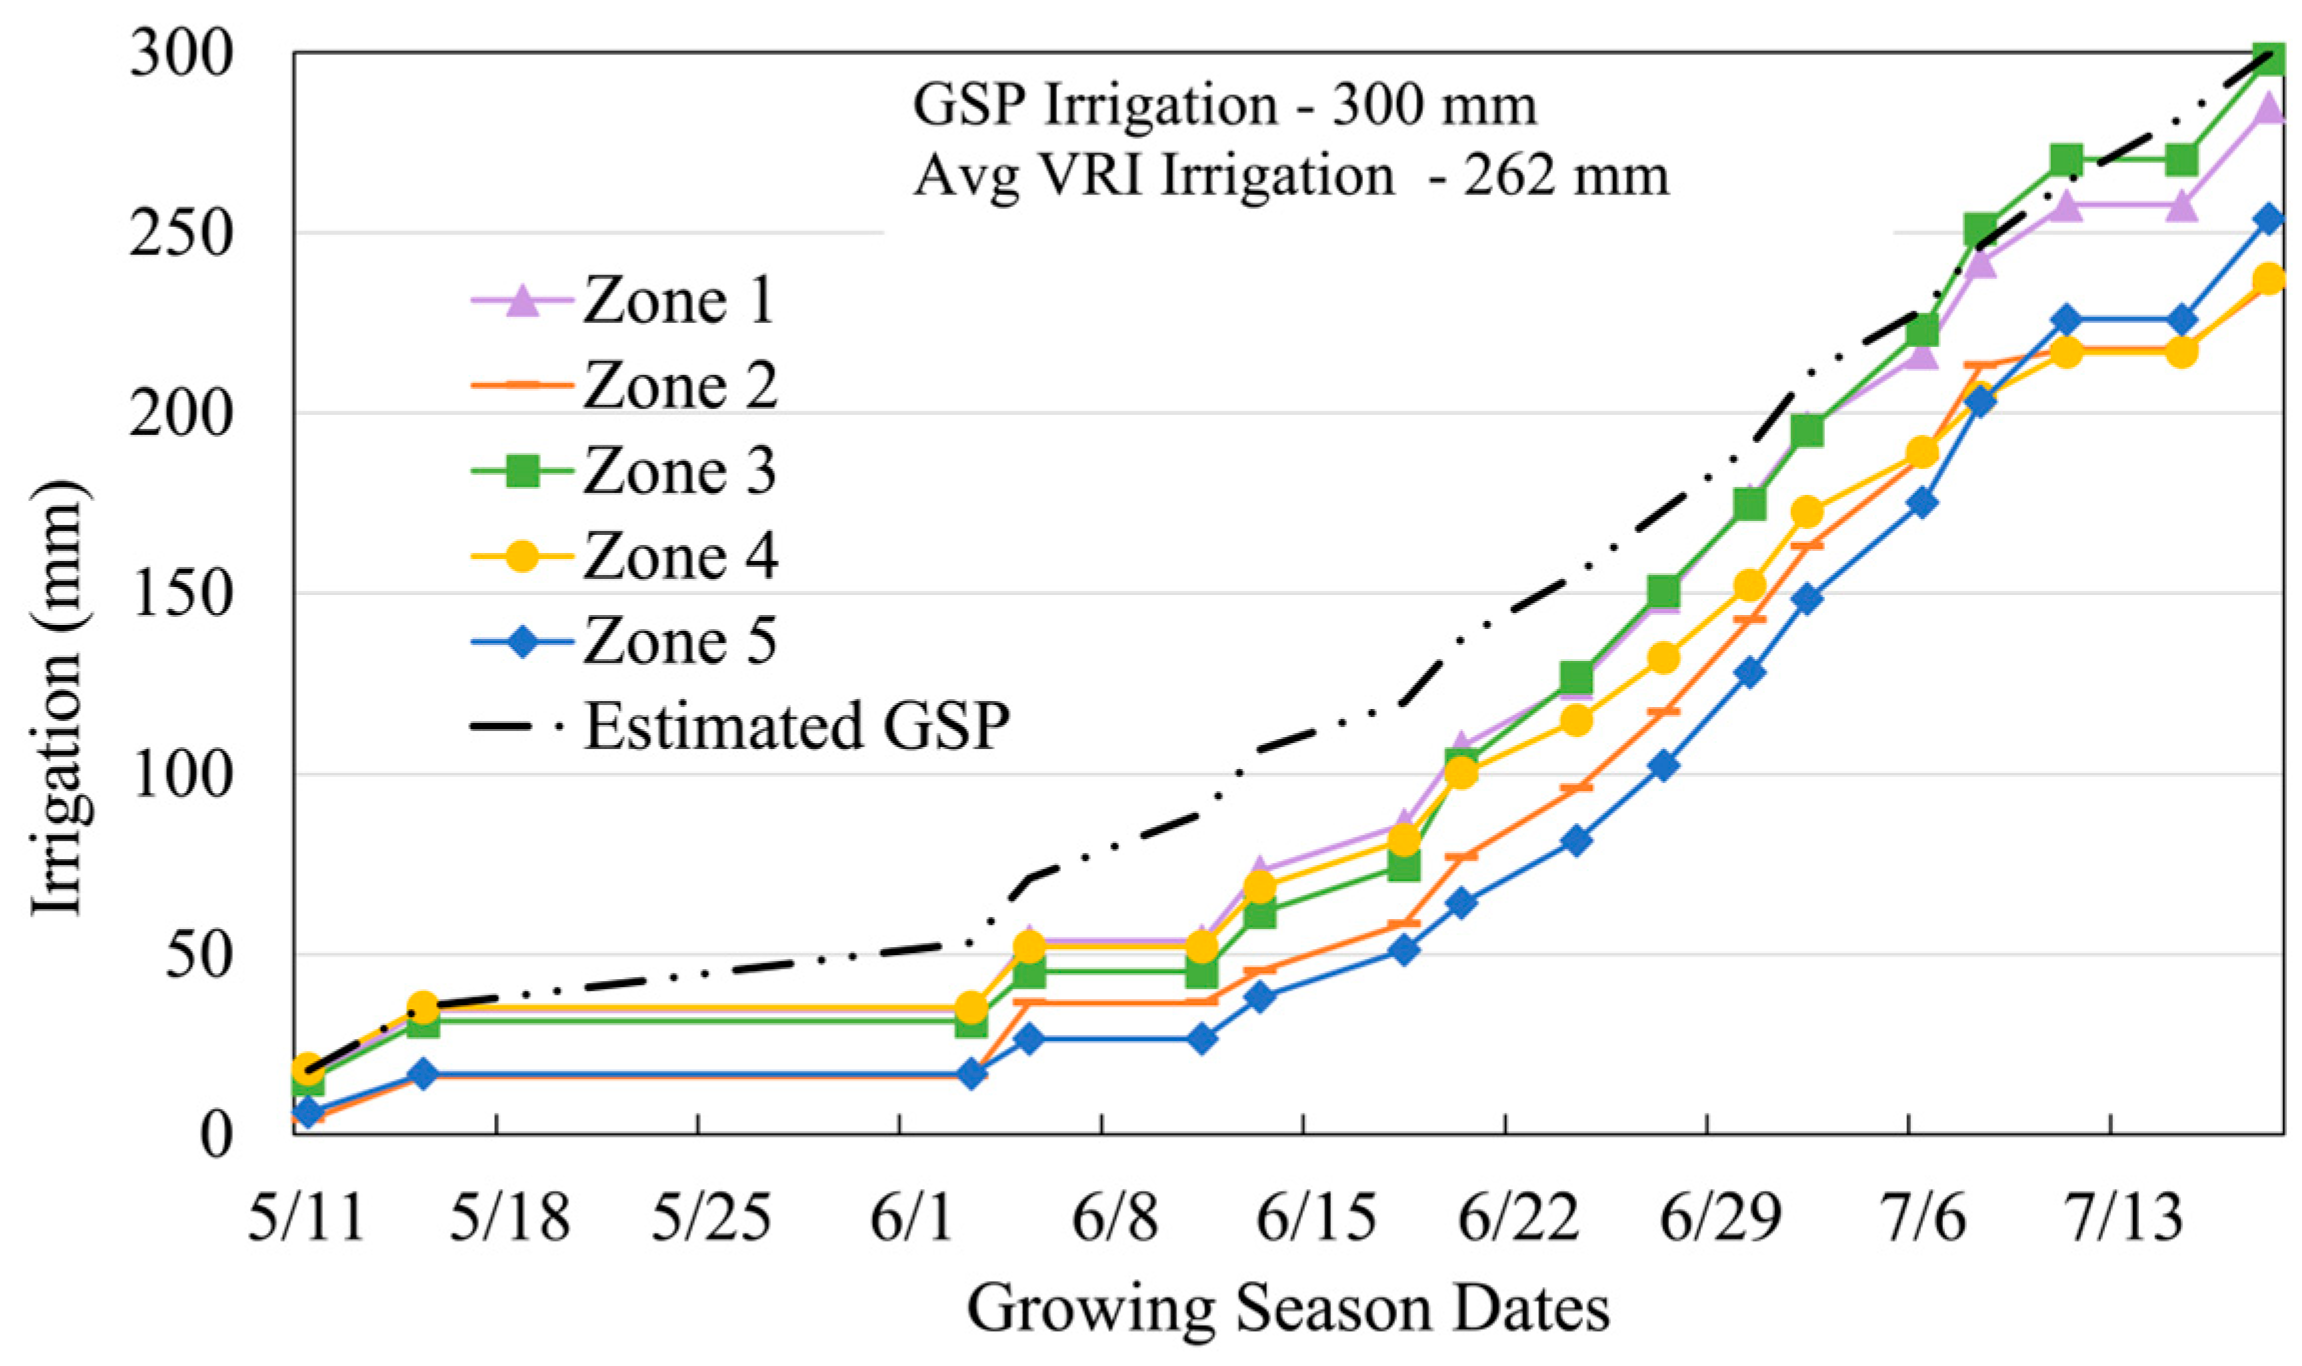
Figure 1. Image of field research site near Grace, ID, USA, with elevation contour lines (m), 2019 VRI management zones, soil sample points, and soil volumetric water content (VWC) sensor locations.
Agronomy 13 01125 g001
Figure 2. Variable rate irrigation (VRI) zones (first row), spatially variable wheat yield (second row), evapotranspiration (ET) (third row), and crop water productivity (CWP) (fourth row) for 2016 and 2017. These data were used to create the irrigation management zones for 2019.
Agronomy 13 01125 g002
Figure 3. Temporal change in volumetric water content (VWC) at a depth of 0.0–0.3 m for a wheat crop in 2019 under variable rate irrigation (VRI) with five irrigation zones. Precipitation and zone-specific VRI events are also shown. Zone average field capacity (FC) and readily available water (RAW) are identified with blue and red lines, respectively.
Agronomy 13 01125 g003
Figure 4. Cumulative irrigation for winter wheat in 2019 under variable rate irrigation (VRI) with five irrigation zones compared to the estimated cumulative grower standard practice (GSP) from 11 May to 18 July with irrigation events represented by the unique shapes for each zone.
Agronomy 13 01125 g004
Table 1. Date of application and irrigation amounts within each of the five delineated irrigation zones throughout the 2019 growing season. Estimated grower standard practice (GSP) rates are compared to the rates of the other irrigation zones throughout the season. Uniform rates were applied on 6/18 and 7/2 for fertigation purposes.
DateZone 1Zone 2Zone 3Zone 4Zone 5GSP Est
mm
5/111541518618
5/15191216171118
6/30000018
6/5192014171018
6/110000018
6/1319917171218
6/18131313131313
6/20221828191318
6/24171924151718
6/27242124172118
6/30272624202618
7/2202020202020
7/6202528172718
7/8252528152818
7/1116519122318
7/150000018
7/18271828202818
Total285236298237254300
Disclaimer/Publisher’s Note: The statements, opinions and data contained in all publications are solely those of the individual author(s) and contributor(s) and not of MDPI and/or the editor(s). MDPI and/or the editor(s) disclaim responsibility for any injury to people or property resulting from any ideas, methods, instructions or products referred to in the content.

