Article

Spatiotemporal Variations of Reference Evapotranspiration and Its Climatic Driving Factors in Guangdong, a Humid Subtropical Province of South China

1
South Subtropical Crops Research Institute, Chinese Academy of Tropical Agricultural Sciences, Zhanjiang Experimental and Observation Station for National Long-Term Agricultural Green Development, Zhanjiang 524013, China
2
Research Center of Fluid Machinery Engineering and Technology, Jiangsu University, Zhenjiang 212013, China
*
Author to whom correspondence should be addressed.
These authors contributed equally to this work.
Agronomy 2023, 13(6), 1446; https://doi.org/10.3390/agronomy13061446
Submission received: 30 April 2023 / Revised: 18 May 2023 / Accepted: 22 May 2023 / Published: 24 May 2023

Abstract

:
It is of great importance to study the changes in reference evapotranspiration (ET0) and the factors that influence it to ensure sustainable and efficient water resource utilization. Daily ET0 data calculated using the Penman–Monteith method from 37 meteorological stations located within Guangdong Province in the humid zone of southern China from 1960 to 2020 were analyzed. The trend analysis and Mann–Kendall test were used to analyze the time series changes in ET0 and major climatic factors (air temperature (T), relative humidity (RH), sunshine duration (SD), and wind speed (u2)) for over 61 years. Sensitivity and contribution analyses were used to evaluate the driving factors of ET0. The main findings of the study are as follows: (1) the trend in average annual ET0 time series in Guangdong slightly increased at a trend rate of 1.61 mm/10a over the past 61 years, with most stations experiencing an increase in ET0. During the same period, air temperature significantly increased, while RH and SD decreased; u2 also decreased. (2) Sensitivity analysis showed that ET0 was more sensitive to RH and T than SD and u2, with ET0 being most sensitive to RH in spring and winter and T in summer and autumn. (3) The contribution analysis showed that T was the dominant factor for ET0 variation in Guangdong, followed by SD. SD was found to be the dominant factor in ET0 changes in areas where the “evaporation paradox” occurred, as well as in spring and summer. The study concludes that the climate in Guangdong became warmer and drier over the past 61 years, and if the current global warming trend continues, it will lead to higher evapotranspiration and drought occurrence in the future.

1. Introduction

Climate change characterized by global warming profoundly impacted agriculture, ecosystems, and human survival and development over the past few decades [1,2,3]. As a result, changes in the hydrological cycle and its other component processes can be expected worldwide, leading to a series of water resource-related problems [1,4].
Evapotranspiration (ET) is one of the most important components of the hydrological cycle and a key parameter in hydrological models and agricultural irrigation management [5,6]. It is a complex process that is not only controlled by climate variables but also influenced by underlying surface conditions, human activities, and other environmental conditions [7]. Therefore, estimating actual ET can be challenging [8]. As an alternative method, reference evapotranspiration (ET0), also known as potential evapotranspiration in hydrometeorology, is used to assess the effects of climate change on evapotranspiration and the hydrological cycle. ET0 is only affected by climatic factors and can reflect the evaporation capacity of the surface atmosphere under specific meteorological conditions in an integrated manner, while excluding the interference of other environmental conditions [9,10].
ET0 is a basic parameter for regional water balance, irrigation scheduling, and water resource management [9,11]. Many past studies investigated the temporal and spatial patterns of ET0, most of which focused on its response to the combined effects of climate change and human activities in different regions [12,13,14,15,16,17,18,19]. Additional studies showed an increasing trend in ET0 in most parts of the world in recent decades, including in the United States [12], China [13,14], India [15,16], and Iran [17]. Some studies reported increasing trends in ET0 (e.g., Ghafouri-Azar et al. [18] in the Korean Peninsula and Liu et al. [19] in the Tibetan Plateau). According to the definition of ET0, the only factors that affect ET0 are climatic variables [9]. Therefore, some studies focused on the relationship between ET0 and influencing climatic variables [20,21,22,23,24]. On a global scale, a decrease in sunshine duration (SD) (or solar radiation) was the main cause of evaporation changes at the end of the 20th century [20]. However, due to the non-uniformity of the spatial and temporal distributions of climatic variables, the importance of climatic variables affecting ET0 varies significantly from region to region. Vicente-Serrano et al. [21] analyzed changes in the annual ET0 from 46 stations in Spain and reported increased values of ET0 in the period 1961–2011. They also demonstrated that relative humidity (RH), wind speed (u2), and maximum temperature (Tmax) had stronger effects on ET0 than SD and minimum temperature (Tmin). Patle et al. [22] reported that the most sensitive parameter affecting ET0 estimation in the eastern Himalayan region of Sikkim, India, was Tmax, followed by SD, whereas u2, Tmin, and RH had a fluctuating effect on mean ET0. Chu et al. [23] studied the effects of climate change on ET0 in Jiangsu, eastern China, finding that u2 contributed the most to ET0, followed by SD. Liu et al. [19] reported that changes in ET0 on the Qinghai–Tibet Plateau in the period 1961–2017 mainly depended on air temperature (T), followed by u2 and SD, whereas RH had a negative effect. There is currently no consensus on the underlying causes of ET0 variation. This issue exists because ET0 is influenced by a combination of changes in climate variables, such as T, RH, u2, and SD, and there is a complex non-linear relationship between ET0 and these parameters, with significant variability existing between these meteorological factors [13,24].
Guangdong, which is located in the south of mainland China, was one of the first regions in China to undergo reform and opening up and has the most outward-looking economy. Due to rapid socio-economic development and human activities, coupled with its proximity to the South China Sea and significant maritime climatic features, both the ocean and the continent have a significant influence on the climate of the region, and changes in ET0 in the region are likely to be complex. In addition, seasonal droughts and urban water shortages were commonly reported in the region in recent years [25,26]. However, there is a lack of study on the spatial and temporal variability and drivers of ET0 in Guangdong.
In this study, the objectives were to analyze the change trends of annual and seasonal ET0 and major climatic factors through collecting meteorological data and calculating ET0 for Guangdong from 1960 to 2020, and to identify the major climatic driving factors of ET0 through quantifying the effects of meteorological variables on ET0. The results of this study can improve our understanding of the factors contributing to ET0 changes and the impact of climate change on the hydrological cycle in Guangdong Province. It is anticipated that the outcomes of this study will improve guidance for agricultural production and economic development in this vitally important region.

2. Materials and Methods

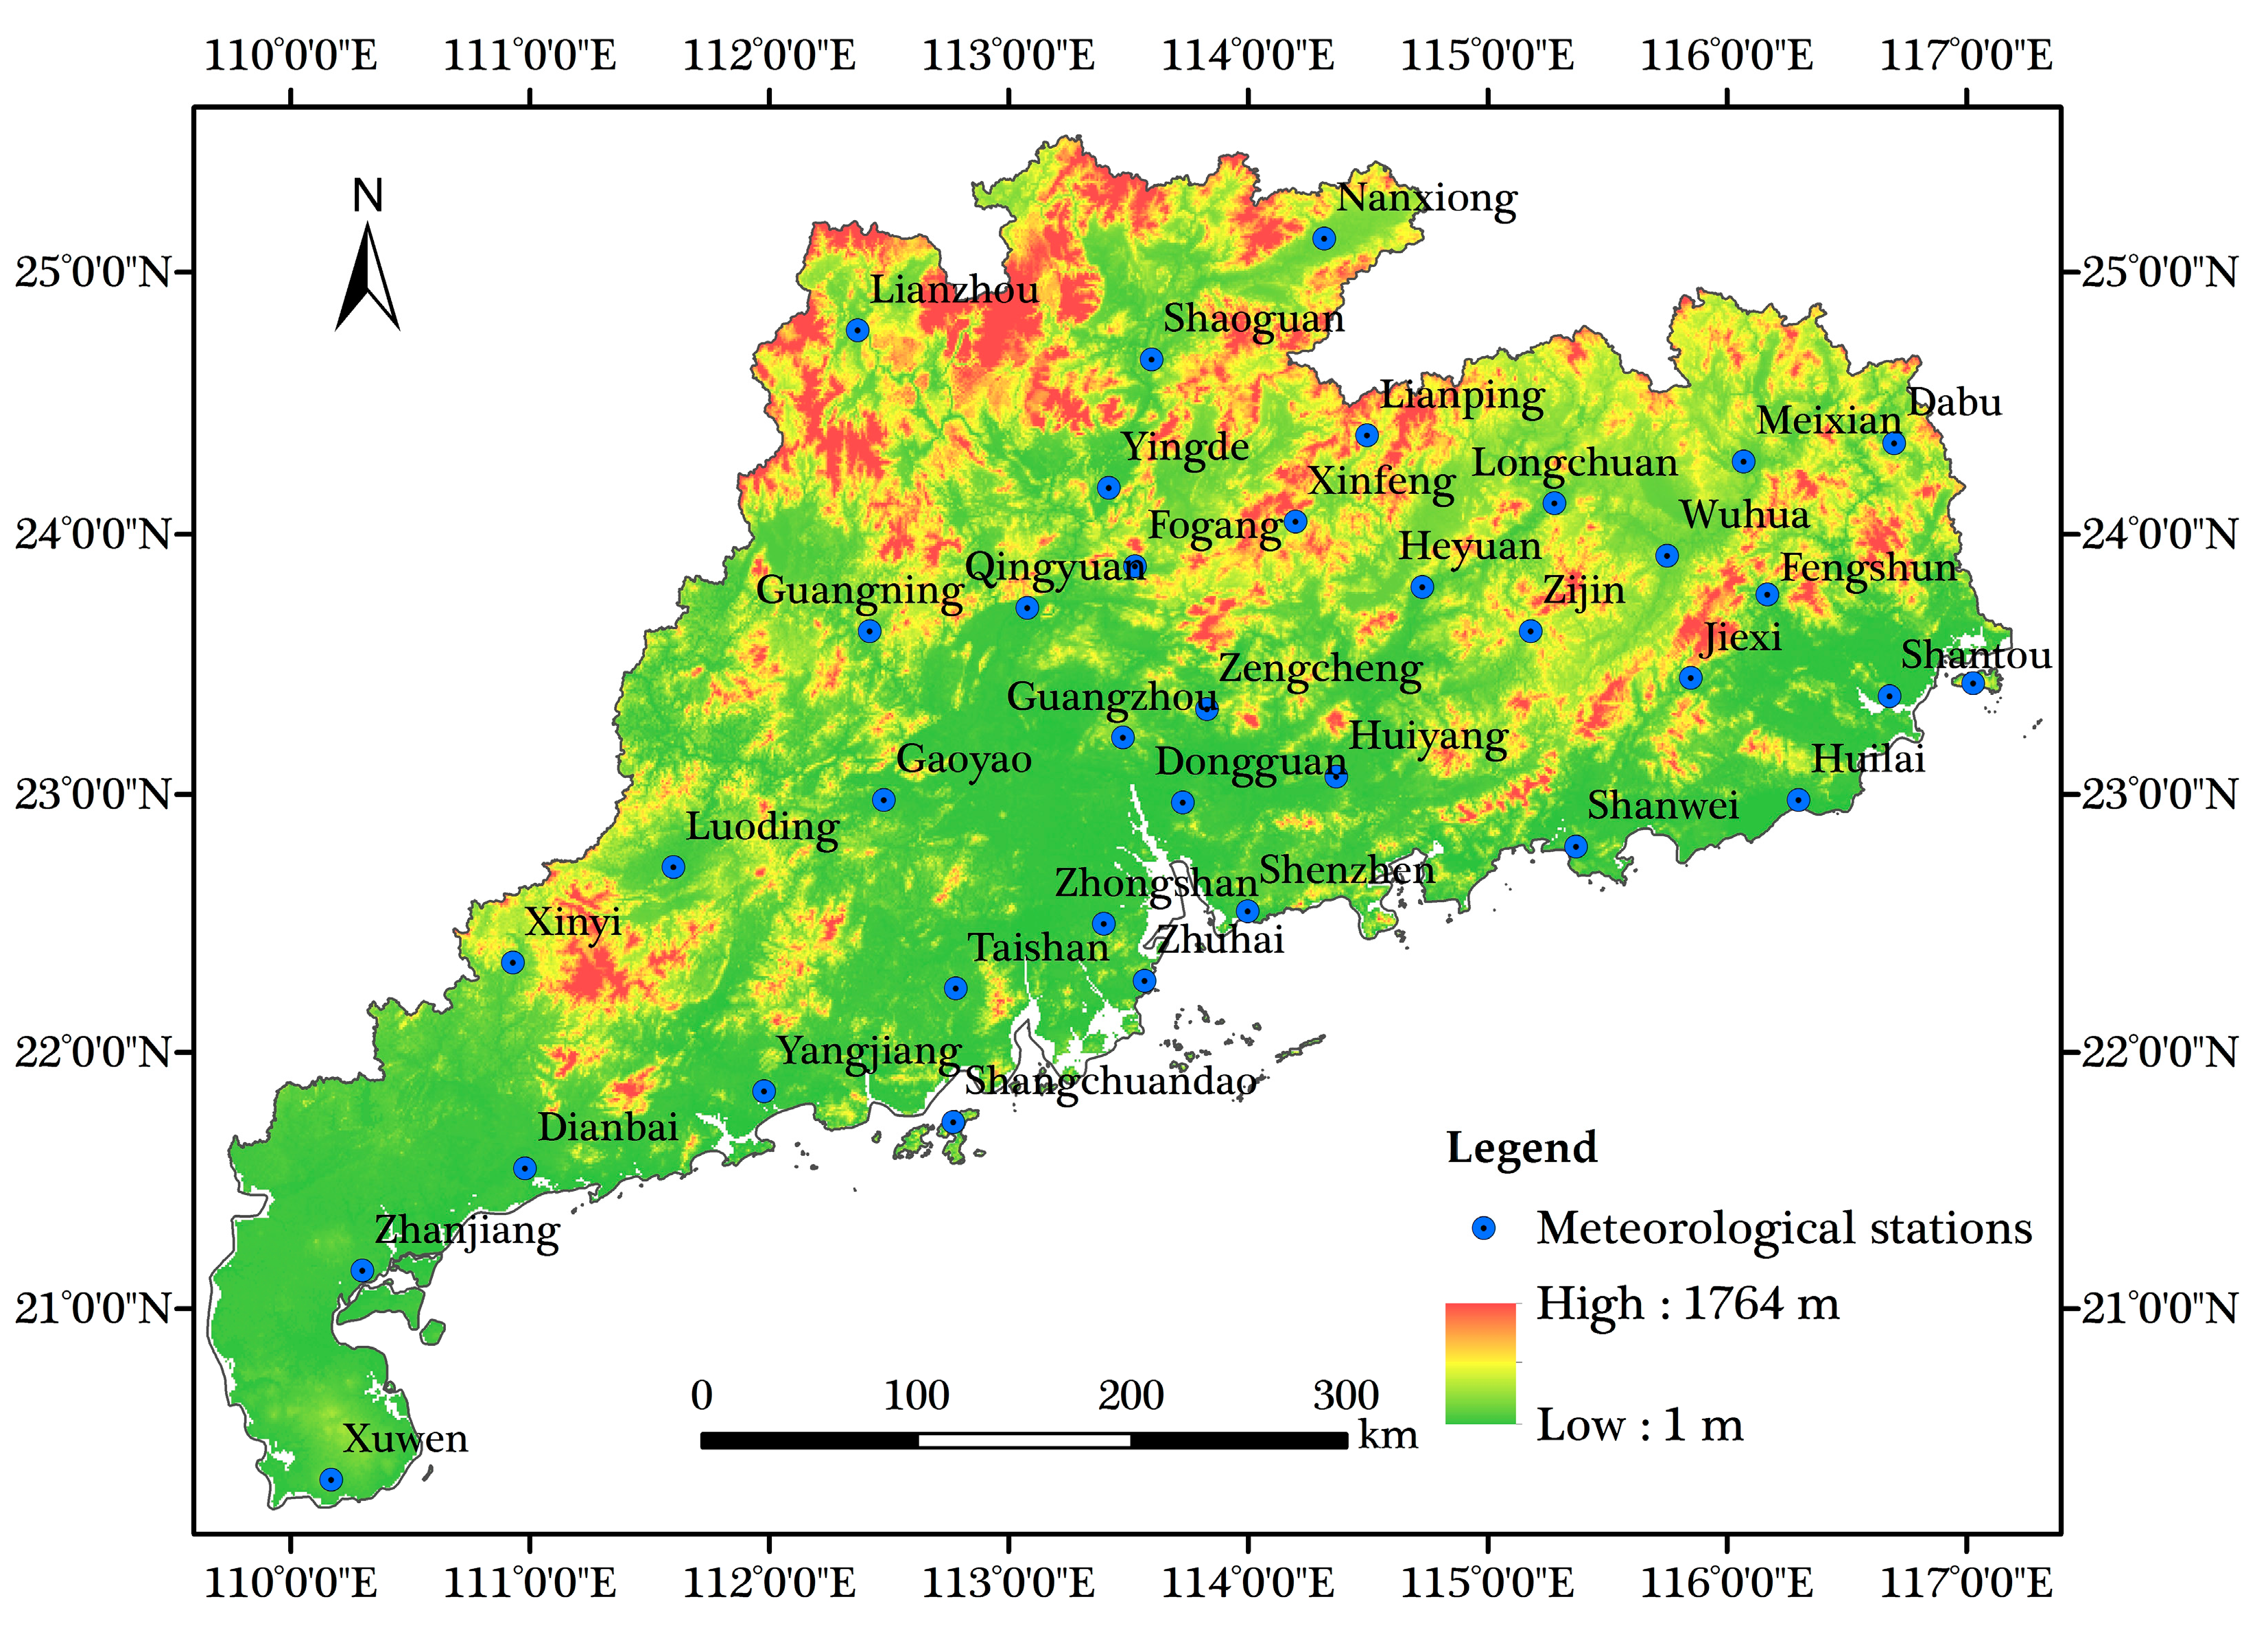
2.1. Study Area and Meteorological Data

This study was conducted in Guangdong Province (20°09′ N~25°31′ N, 109°45′ E~117°20′ E), which is located in the humid south of China and has a tropical and subtropical monsoon climate; the province covers an area of approximately 179,700 km2. The region has abundant sunshine, heat, and water resources, with an annual mean temperature of 22.3 °C; annual sunshine duration of 1745.8 h; and annual precipitation of 1789.3 mm, which varies between 1300 and 2500 mm. However, the region has unevenly distributed water resources, with frequent floods in summer and autumn, and droughts in winter and spring. In addition, the region experiences water shortages caused by population growth, climate change, and water pollution [27]. Understanding climate change and its impact on the hydrological cycle is crucial, as the area has strong evapotranspiration (more than half of the total precipitation) [28].
This study used daily meteorological data from 37 stations (Figure 1) located in Guangdong, including average temperature (Tmean, °C), maximum temperature (Tmax, °C), minimum temperature (Tmin, °C), relative humidity (RH, %), wind speed at 10m height (u10, m/s), and sunshine duration (SD, h); these data were obtained from the China Meteorological Administration (CMA). The analysis period ranged from 1960 to 2020. Table 1 provides basic characteristics of the meteorological stations, such as latitude, longitude, and altitude. The FAO Penman–Monteith equation was used to calculate the daily ET0 for each station. Some years were excluded from the analysis due to the missing data from several stations, including Station Zhuhai (years 1960 to 1964), Station Fengshun (years 2016 to 2020), and Station Jiexi (years 1965 to 1969). Furthermore, routine quality checks and error correction were performed on the meteorological data according to the methodology of Peterson et al. [29]. The four seasons were divided into spring (March–May), summer (June–August), autumn (September–November), and winter (December–February of the following year).

2.2. Reference Evapotranspiration Computation

As measured ET0 values were unavailable, we calculated daily ET0 using the FAO56 Penman-Monteith (PM) method, which is the most widely used and accurate method for estimating ET0 across various climatic regions. The equation is expressed as follows [9]:
ET 0 = 0 . 408 Δ R n G   +   γ 900 T + 273 u 2 ( e s e a ) Δ + γ ( 1 + 0 . 34 u 2 )
where Rn is the net radiation (MJ m−2 d−1), G is the soil heat flux (MJ m−2 d−1), T is the mean daily air temperature at 2 m height (°C), es is the saturation vapor pressure (kPa), ea is the actual vapor pressure (kPa), Δ is the slope of the vapor pressure curve (kPa °C−1), and γ is the psychrometric constant (kPa °C−1).
To convert the wind speed data observed at the meteorological station, which were measured at 10 m above ground level, to the corresponding value at 2 m height, we used Equation (2) [9]:
u 2 = u z 4 . 87 ln ( 68 . 7 z 5 . 42 )
where uz is the wind speed at a height of z m above ground level (m s−1).

2.3. Climatic Trend

Climate tendency refers to the changing trend of meteorological variables over time, which can be estimated using an ordinary linear regression equation, as given using the following equation [30,31]:
y ( t ) = at + b
where t represents the long-time series (year), y(t) is the ET0 and other meteorological variables corresponding to t, a is the linear slope, and b is the intercept. In general, the climatic tendency rate (β) is equal to 10a with a unit of value per decade [30].
The significance of the trends in climatic series is evaluated using the Mann–Kendall trend test technique (MK test). The MK test is a rank-based non-parametric method that is widely applied for trend detection in hydro-climatic time series [32,33]. The MK test is described as follows:
S = i = 1 n 1 j = i + 1 n sgn x j     x i
where
sgn x j x i = + 1         x j   >   x i 0         x j = x i 1         x j < x i
where xi and xj are the sequential data values, and n is the length of the data set. The mean and variance of the statistic S are given as:
E ( S ) = 0
V ( S ) = n n 1 2 n + 5 i = 1 n t i i i 1 2 i + 5
where t is the extent of any given time.
The standardized statistic Z for a one-tailed test is formulated as follows:
Z = S 1 / var S S > 0 0                                                       S = 0 S + 1 / var S S < 0
where a positive value of Z denotes an increasing trend, and a negative value indicates a decreasing trend. |Z|>1.96 and 2.32 indicate passing the significance level test of 0.05 and 0.01, respectively.

2.4. Assessing the Impact of Climate Variables on ET0

In this study, the impact of meteorological factors on ET0 was assessed through combining the sensitivity analysis with the contribution rate of a single climate factor to ET0.
Sensitivity analysis is a widely used method to identify the changes in the dependent variable (ET0) caused by the change in an independent meteorological variable [13,14,32], and the sensitivity coefficient is defined by [34]:
S x = lim Δ x 0 Δ ET 0 / ET 0 Δ x / x = ET 0 x · x ET 0
where Δx is the relative change in the model input value x, x is the meteorological factors, ΔET0 is the relative change in ET0 induced by Δx, and Sx is the dimensionless sensitivity coefficient. A positive (negative) Sx means that ET0 increases (decreases) with the increase in meteorological factors. Larger |Sx| means higher sensitivity of ET0 to meteorological factors. In order to quantitatively assess the sensitivity of ET0 to different meteorological factors, the Sx was divided into four levels, as shown in Table 2 [35].
Sensitivity analysis cannot determine the actual contribution of each variable change to ET0. In order to quantify the contributions of meteorological variables to the change trend in ET0, we calculated the contribution rate (Cx) through multiplying the multi-year relative change rate of meteorological factors by its sensitivity coefficient, as shown in the following equation [36,37]:
C x = S x · R c
R c = n · a   x ¯
where Rc is the relative change rate of certain meteorological factors and ET0 (%); a is the linear slope, as mentioned in Equation (3); and   x ¯ is the mean of the meteorological factor time series.
In this study, ArcGIS 10.8 was used to map the distribution of meteorological stations and spatial variation in ET0 in the study area, Matlab 2018a was used for MK testing, IBM SPSS Statistics 26 was used for significance analysis, and Origin 2021 was used for other plots.

3. Results

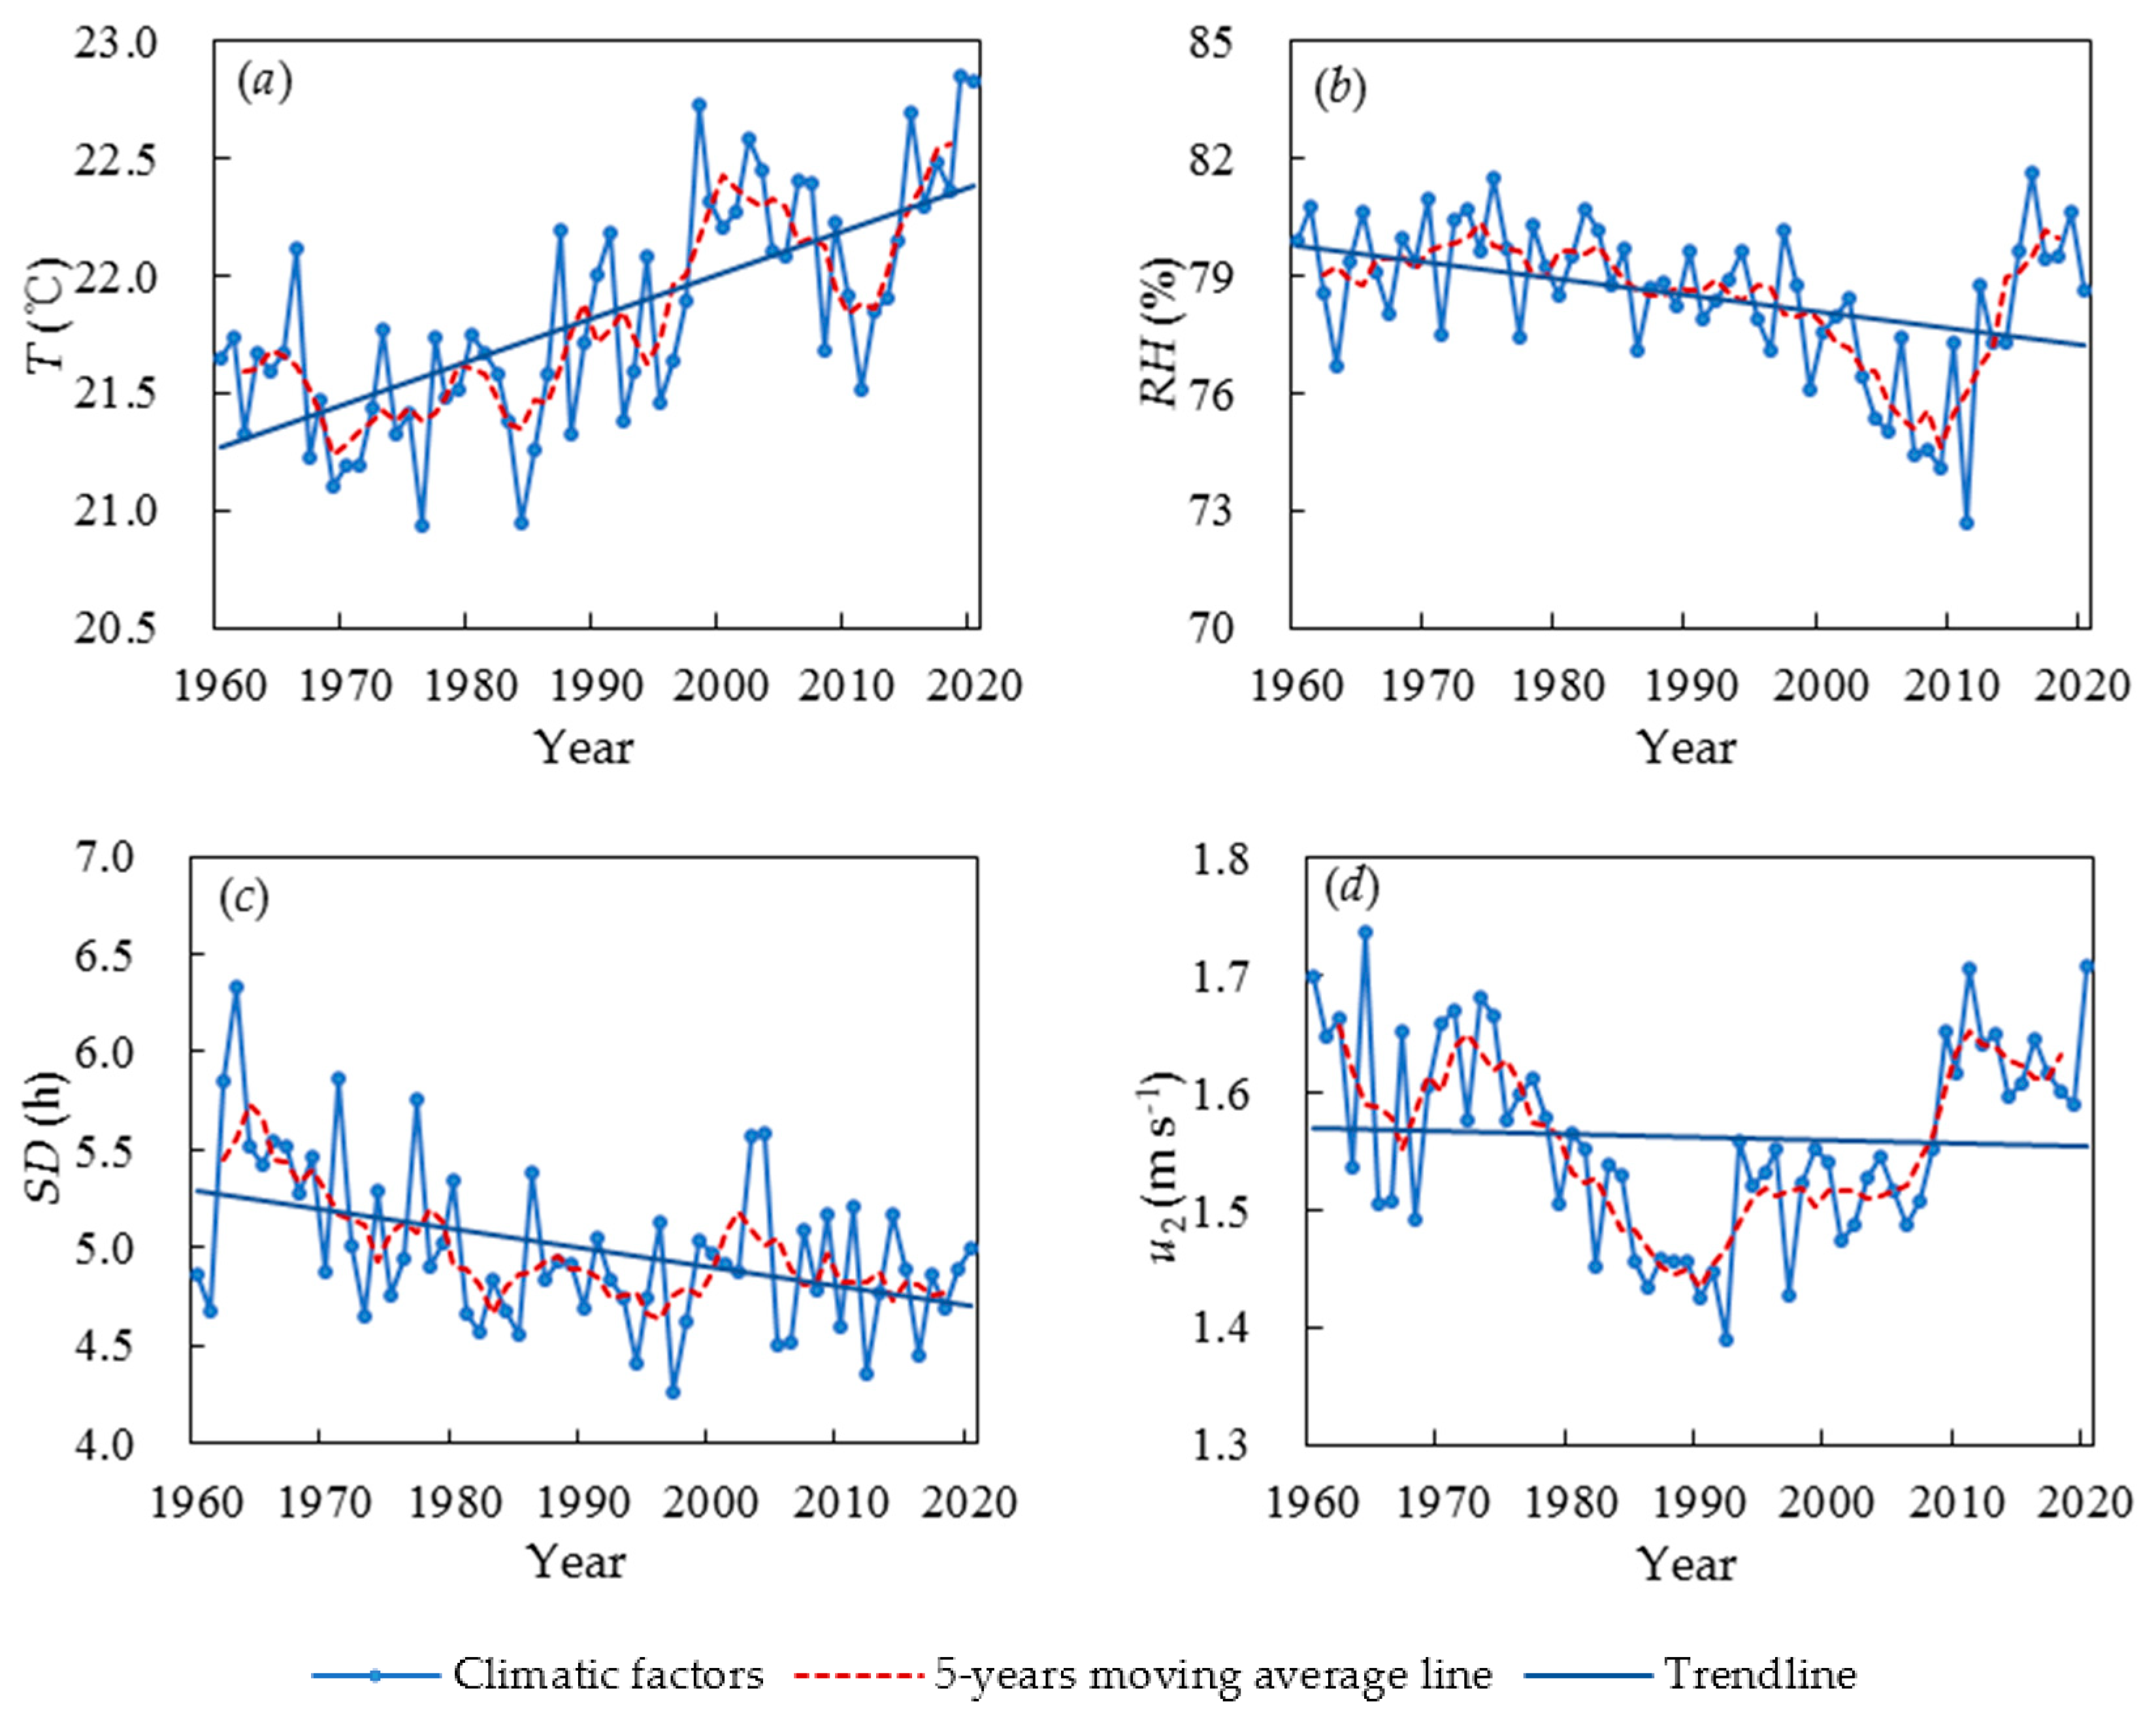
3.1. Change Trends of Climatic Factors

The variations in climatic factors, which were averaged based on the 37 meteorological stations in Guangdong from 1960 to 2020, are shown in Figure 2 and Table 3. In line with the global warming trend, the T in the region exhibited a significant increase (p < 0.01) with a climate tendency rate of 0.19 °C/10a. The average annual RH was 78.51%, which declined significantly at a rate of −0.42%/10a, indicating a trend of drought in the atmosphere, with the most significant reduction occurring around 2010. Sunshine, which directly reflects solar radiation, is the energy source driving changes in other factors, such as T, RH, u2, and ET0. SD in Guangdong ranged from 4.26 to 6.34 h, with a multi-year average of 4.99 h, and showed a significant decreasing trend (p < 0.01) with a climate trend rate of −0.10 h/10a (Figure 2c). The decline in SD could be related to human activities and urbanization, which cause air pollution and an increase in aerosols in the air. In contrast, the multi-year average value of u2 was 1.56 m/s, with a variation range of 1.39 m/s to 1.74 m/s, and showed a non-significant decreasing trend in spring, autumn, and winter (Figure 2d).
On the seasonal scale, T displayed a significant declining trend (p < 0.01) in all four seasons, and the increasing trend was stronger in cooler seasons than in warmer seasons. Autumn and winter warming rates were 0.24 °C/10a and 0.26 °C/10a, respectively, which were higher than the respective spring and summer warming rates of 0.15 °C/10a and 0.16 °C/10a. RH showed a decreasing trend in all seasons, with significant decreases in summer (p < 0.01), spring, and autumn (p < 0.05). Similarly, SD showed a decreasing trend in all seasons, with significant decreases in summer and winter (p < 0.05). u2 showed a non-significant decreasing trend in spring, autumn, and winter and a significant increasing trend in summer (p < 0.01), with a tendency rate of 0.02 m/(s·10a).

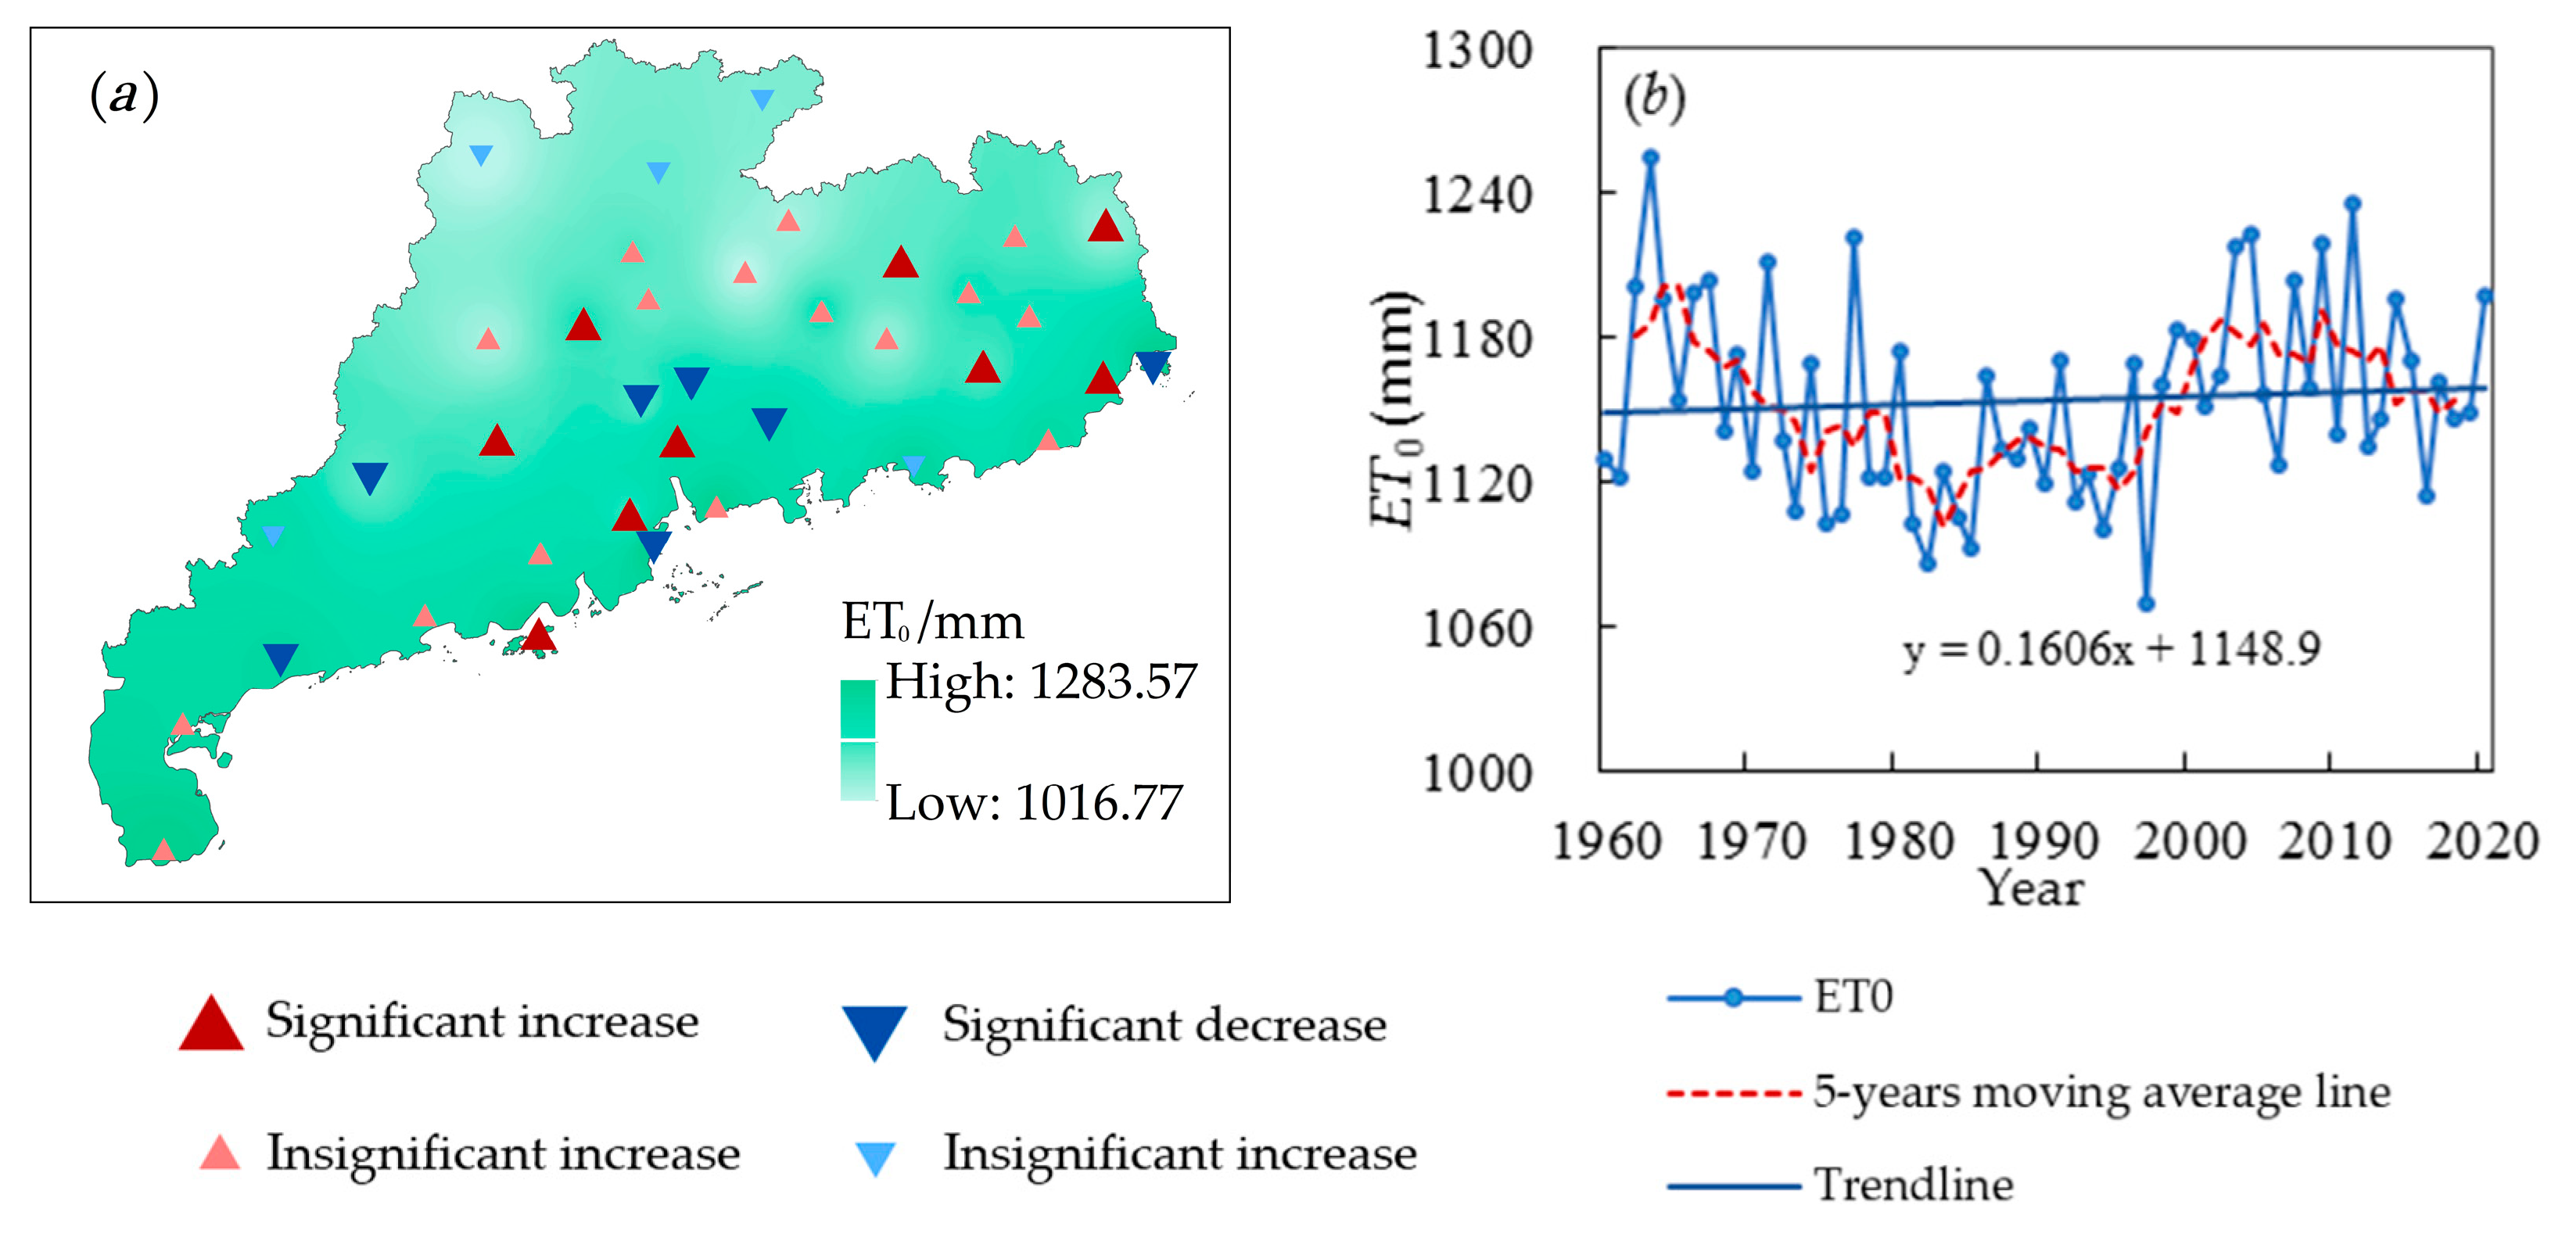
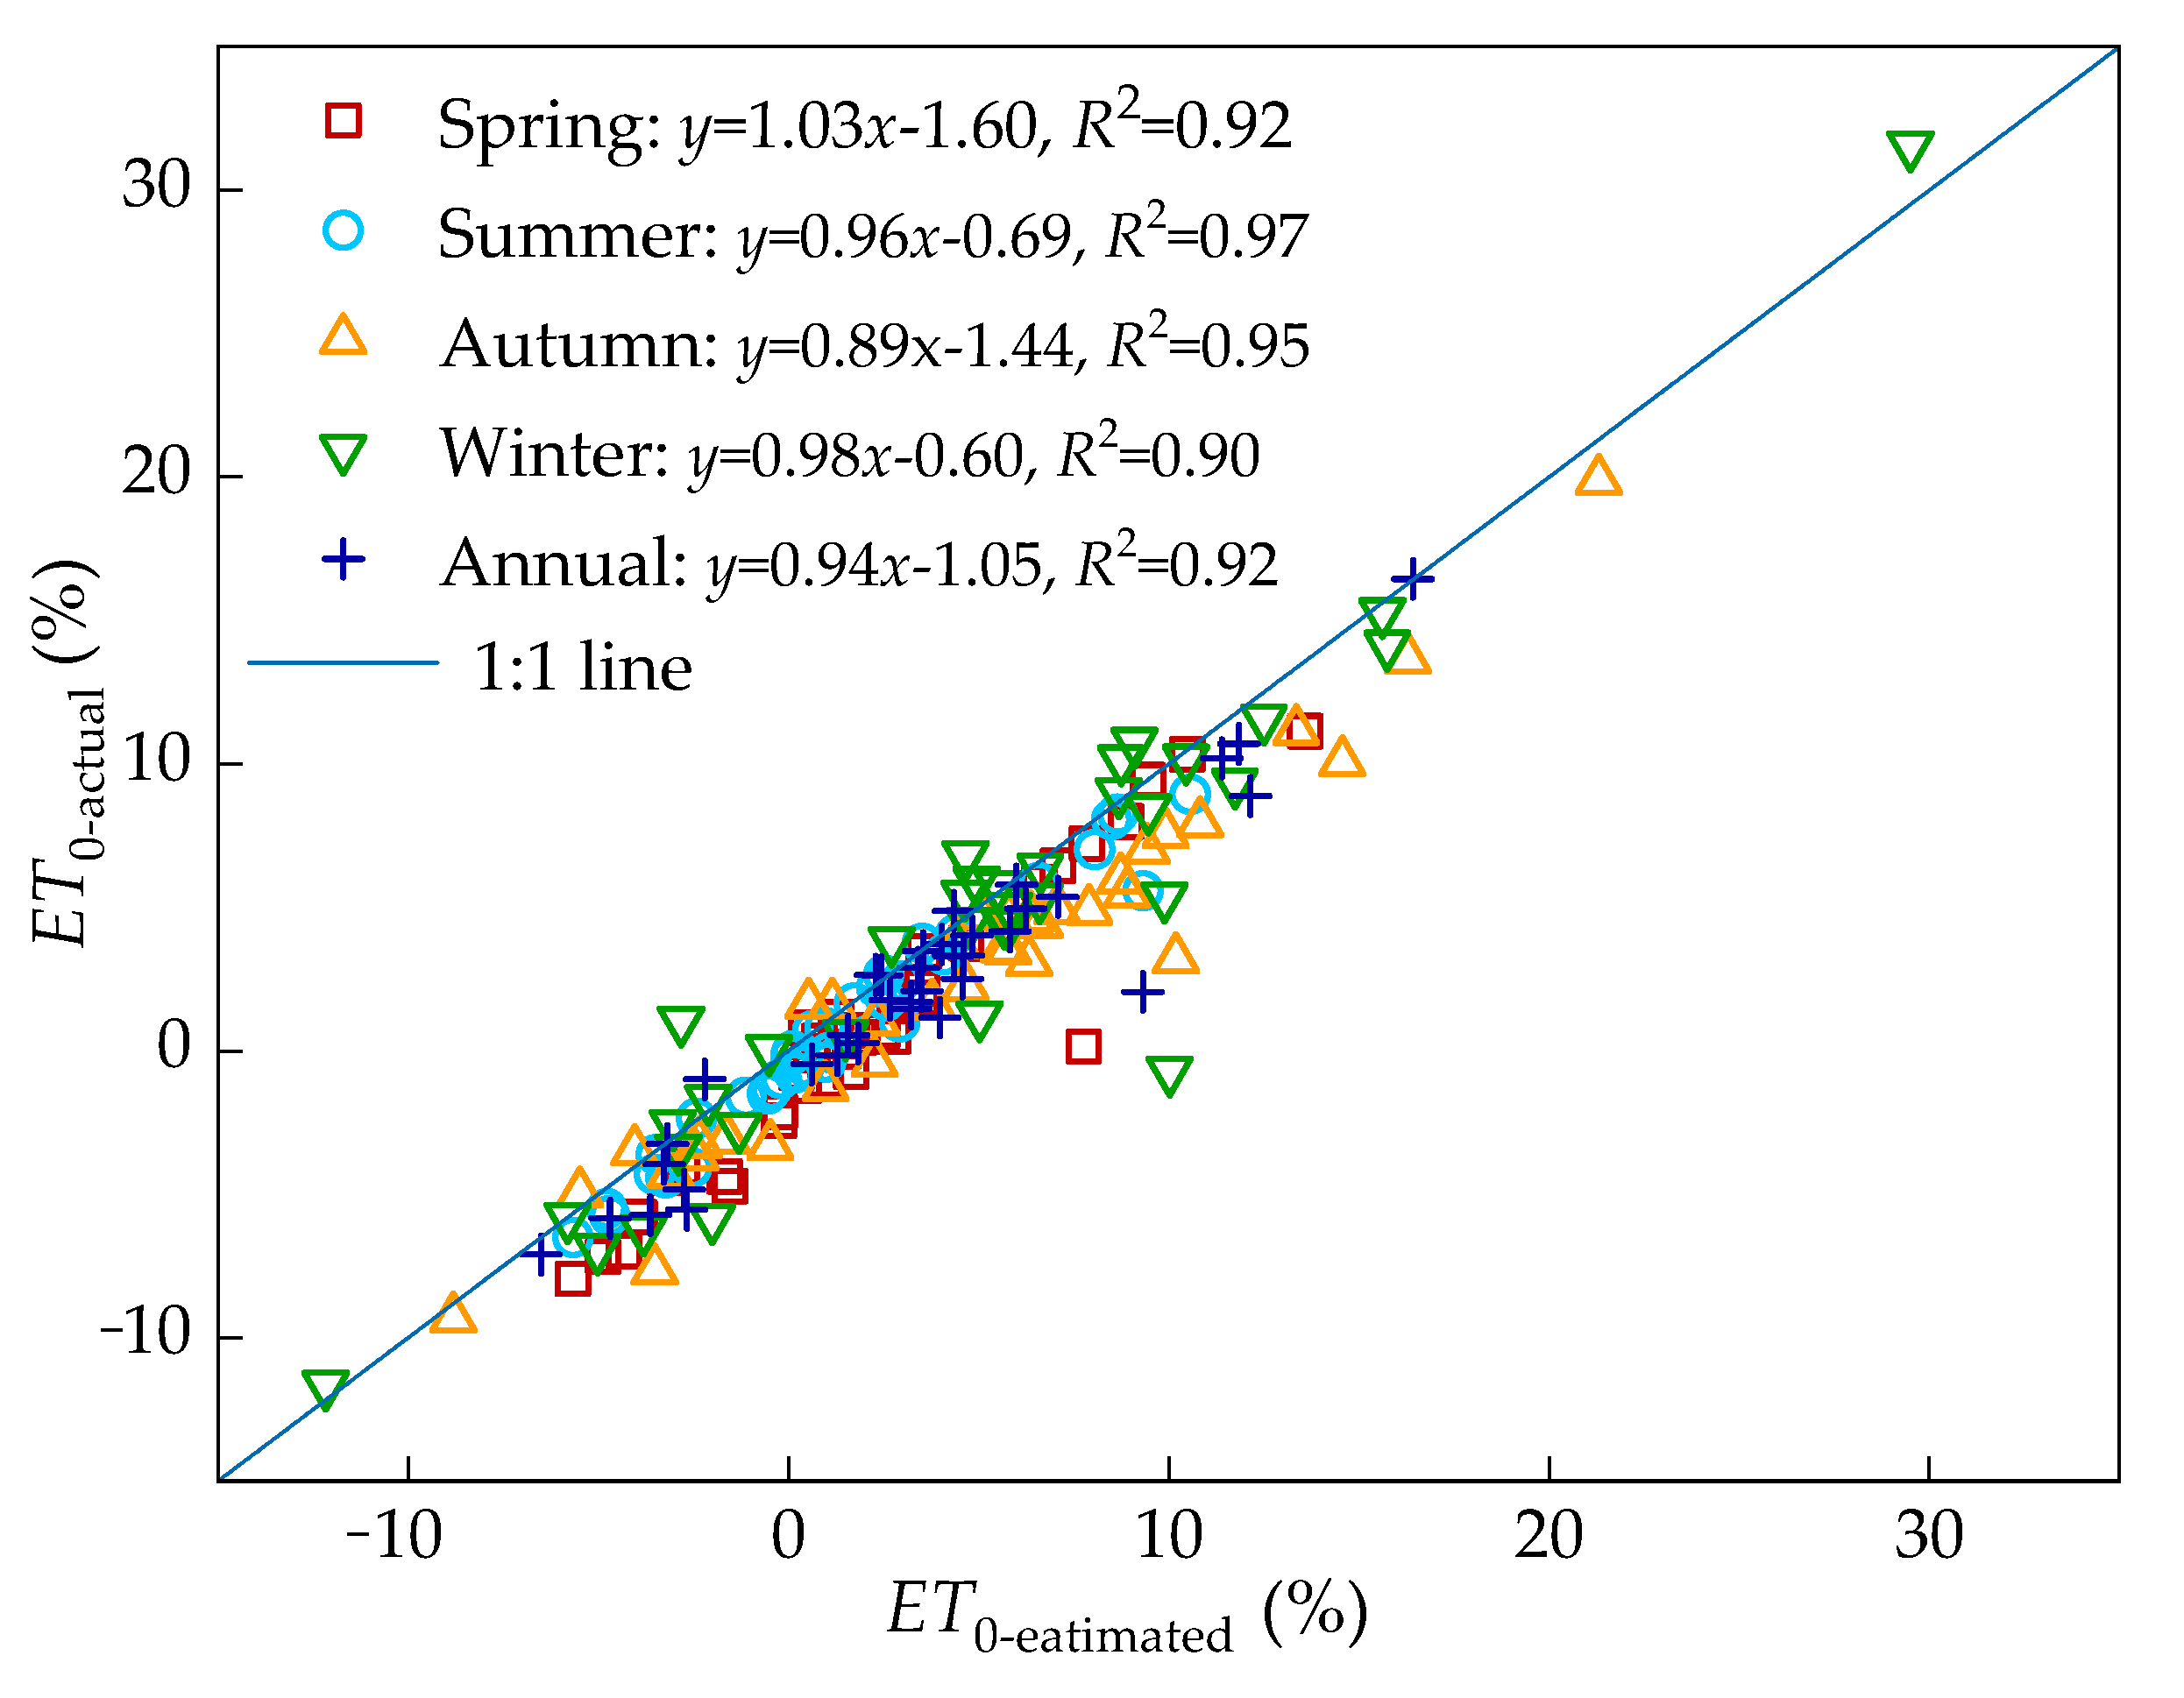
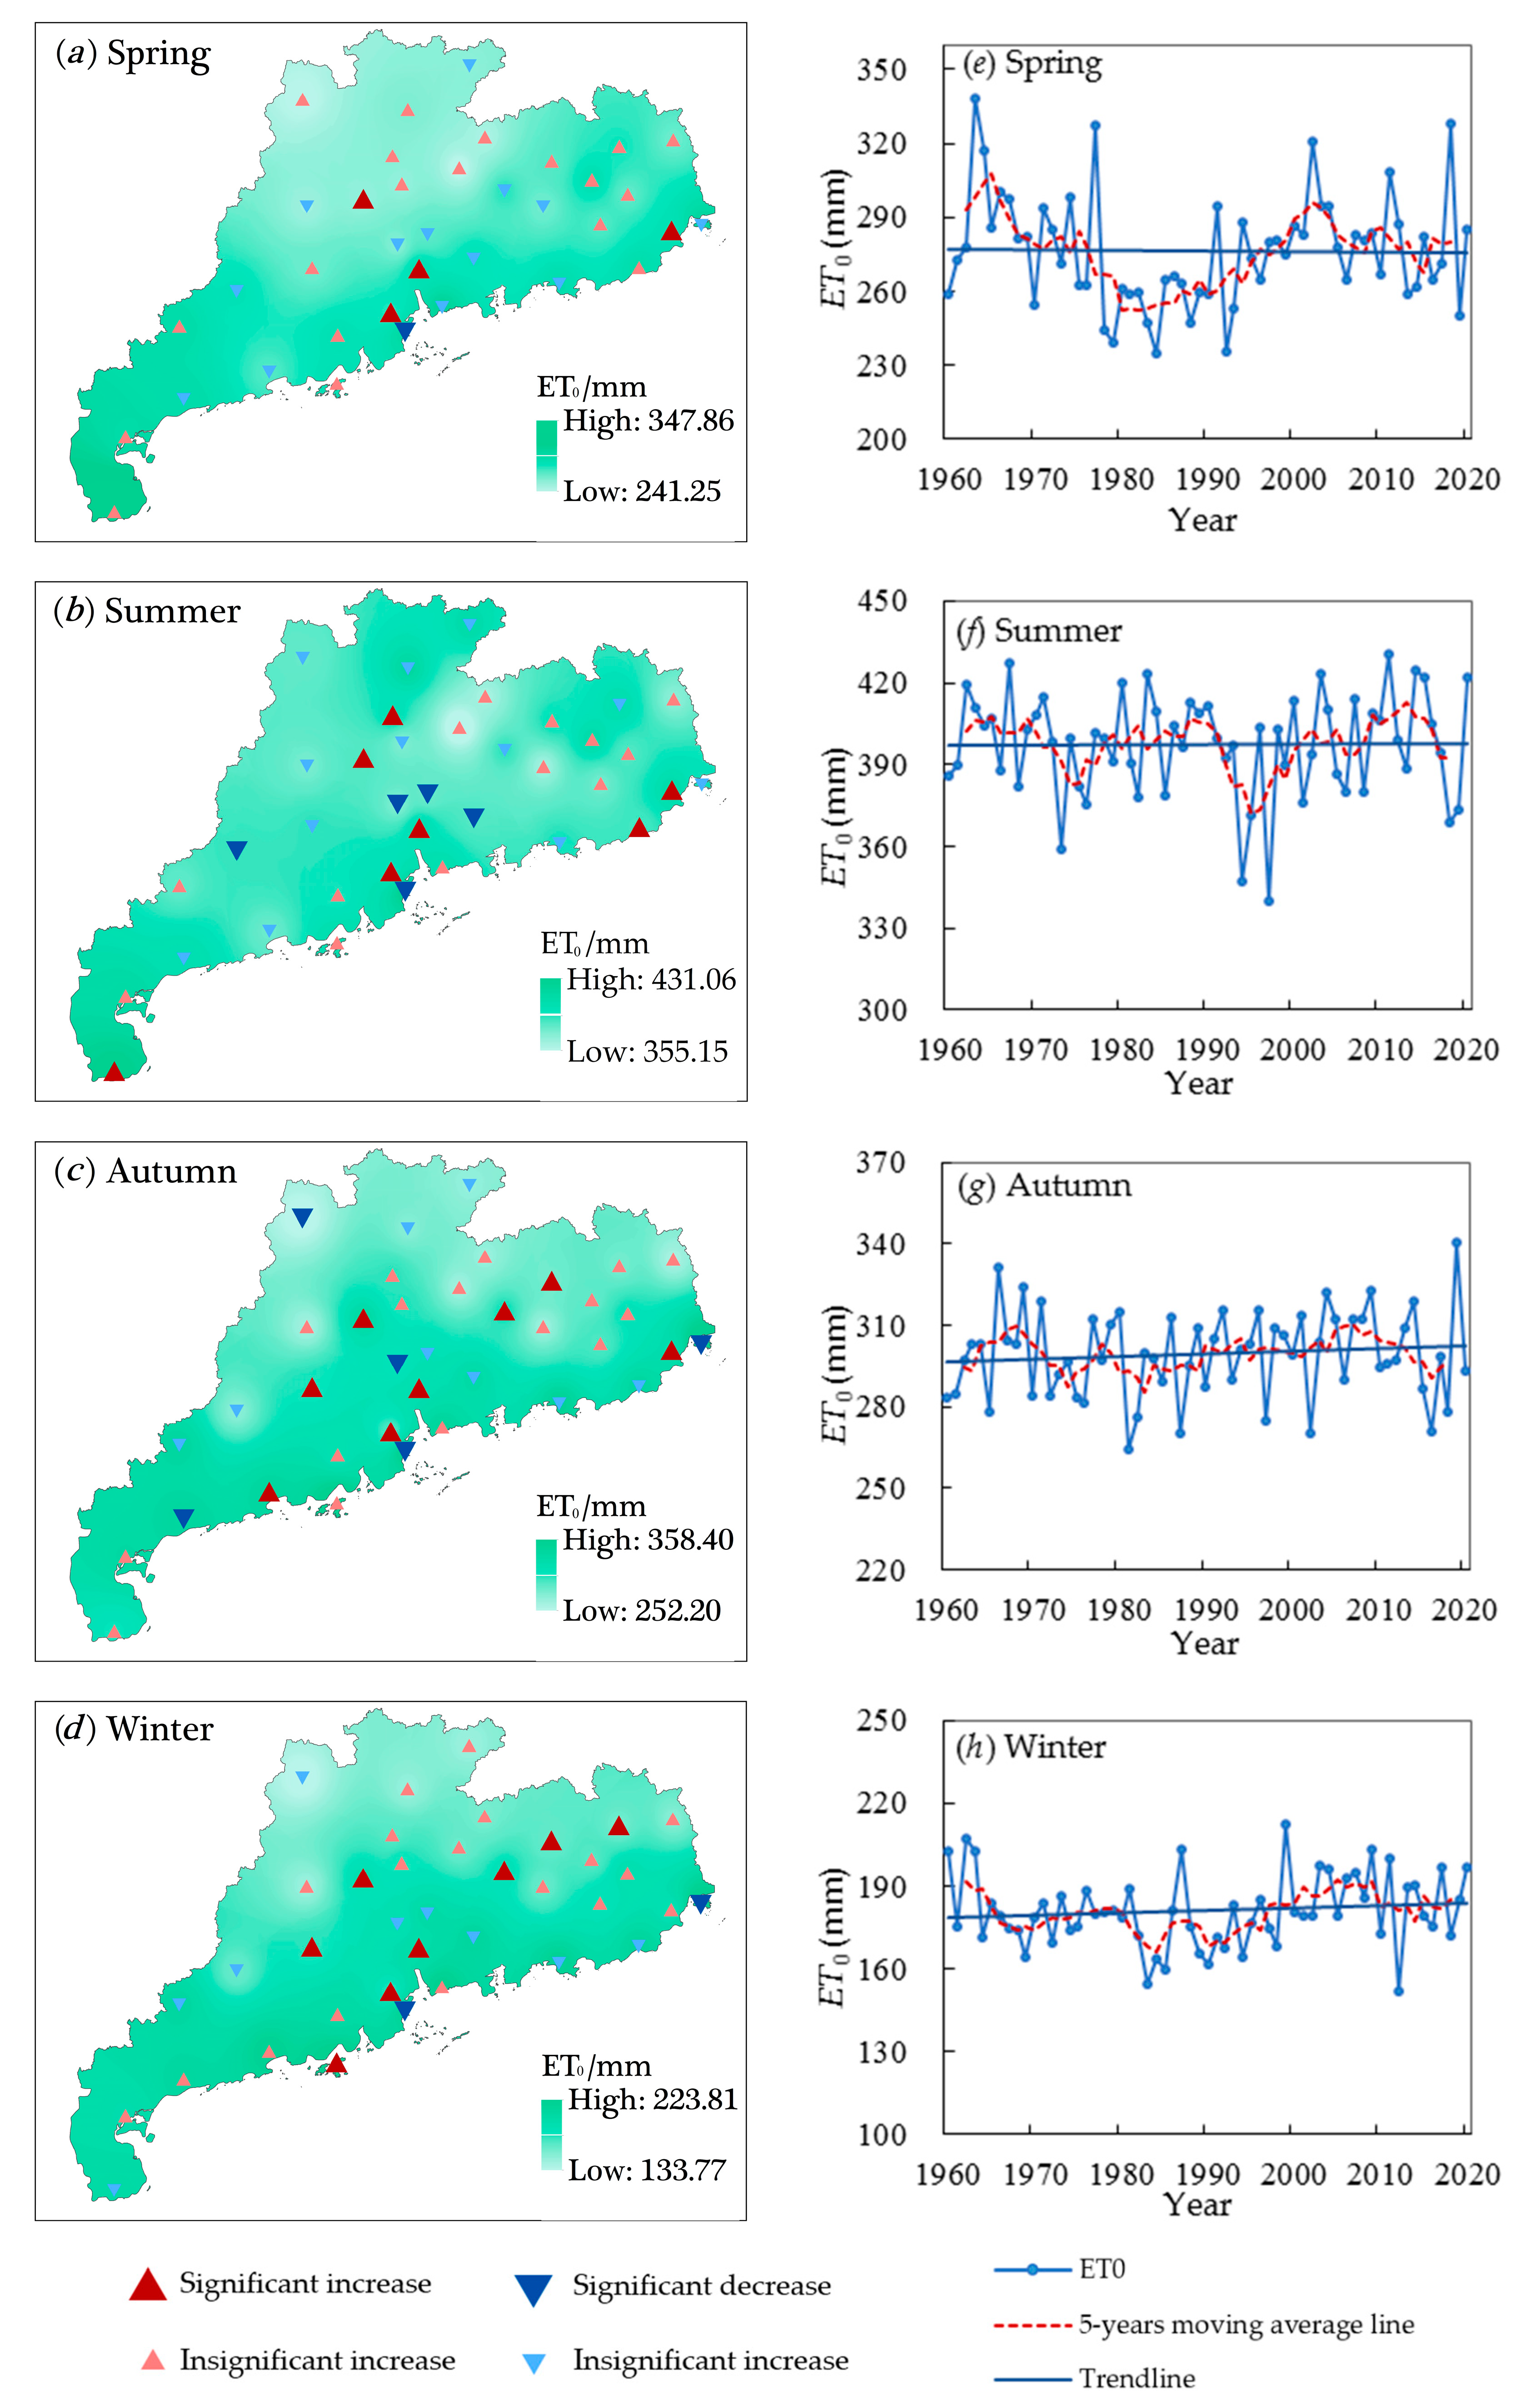
3.2. Spatial and Temporal Variation Characteristics of ET0

Due to the non-uniformity of the distribution of climatic factors, the spatial and temporal distribution of ET0 in the study area is uneven. Figure 3a shows the spatial distribution and trend of annual average ET0 in the study area, which shows that ET0 gradually increased from north to south in spatial distribution. The differences in ET0 among meteorological stations were evident, with higher ET0 values found in coastal areas, such as western Guangdong and the Pearl River Delta (PRD). The three stations with the highest ET0 values were Nan’ao (1284.52 mm), Zhuhai (1271.63 mm), and Xuwen (1271.18 mm), while the lowest three stations were Lianzhou (1017.50 mm), Xinfeng (1021.50 mm), and Lianping (1045.66 mm).
Of the 37 meteorological stations in the study area, 25 stations showed an increasing trend in ET0, of which 9 stations showed a increasing trend with a selected significance level of 0.05. The stations with significant increases in ET0 were found in Qingyuan, Gaoyao, Dongguan, Zhongshan, and Shangchuan Island in the PRD, as well as in Dabu, Jiexi, Shantou, and Longchuan in the east. On the other hand, 12 stations showed a decreasing trend in ET0, with 7 stations showing a significant decrease, including Luoding and Dianbai in the west; Guangzhou, Zengcheng, Zhuhai, and Huiyang in the PRD; and Nan’ao in the east.
In terms of interannual variations, the overall annual ET0 in the study area showed a slightly increasing trend (Figure 3b), with a climatic tendency rate of 1.61 mm/10a and an insignificant decreasing trend (Table 4). The interannual ET0 was unevenly distributed, with a variation range between 1069.27 and 1254.56 mm and a multi-year average of 1142.45 mm.
The spatial and temporal distribution of ET0 in the study area varies across different seasons. Figure 4a–d show the spatial distribution characteristics and trends of multi-year average ET0 at each station during the four seasons. During spring, the variation range of ET0 is between 241.25 and 347.86 mm, and the highest ET0 values are observed in Xuwen. Among the 37 stations in the study area, 23 stations show an increasing trend in ET0, with 4 stations, such as Shantou and Dongguan, showing a significant increase; only 1 of the remaining 14 stations showing a significant decrease. During summer, ET0 variation range is 355.14–431.06 mm, with high ET0 values occurring in regions such as Zhanjiang and Zhuhai. Within the study area, 20 stations have an increasing trend in ET0, while 17 stations have a decreasing trend. Among them, seven stations show a significant increase, while five stations show a significant decrease. The variation ranges of ET0 in autumn and winter are 252.20 to 358.41 mm and 133.40 to 223.20 mm, respectively. The high ET0 values are mainly concentrated in coastal areas, such as Zhuhai, Shenzhen, and Shanwei. In autumn, 24 stations show an increasing trend in ET0, while 13 stations show a decreasing trend, with 8 stations showing a significant increase and 5 stations showing a significant decrease. During winter, ET0 at 26 stations show an increasing trend, with 8 stations showing a significant increase; however, 11 stations show a decreasing trend, and 2 stations showing a significant decrease. The trend in ET0 changes in different seasons also show that the study area has the most stations with increasing ET0 in winter, while there are relatively more stations with decreasing ET0 trends in summer.
The annual ET0 tends to increase in all seasons except spring, albeit not significantly. The climatic tendency rate of ET0 is highest in autumn and winter, being 1.00 mm/10a and 0.83 mm/10a, respectively, and lowest in spring and summer, being −0.24 mm/10a and 0.01 mm/10a, respectively. ET0 is unevenly distributed throughout the year in the study area, with the highest ET0 in summer (34.5% of the year), followed by autumn (299.27 mm), which accounts for 25.9% of the year, and spring (276.10 mm), which accounts for 23.9% of the year. However, in some years, spring ET0 is higher than autumn. Winter ET0 is the smallest (80.87 mm), accounting for only 15.7% of the year.

3.3. Sensitivity Analysis of ET0 to Climatic Factors

The spatial distributions of the sensitivity coefficients (Sx) of annual ET0 for each climatic factor were analyzed and visualized in Figure 5. The Sx of ET0 to T ranged from 0.49 to 0.75, with an average of 0.65, as well as an increasing trend from north to south. Moreover, the Sx values were higher in the southern coastal areas, with most regions having values greater than 0.70. The Sx of ET0 to RH ranged from −1.53 to −0.36, with an average value of −0.74. The spatial distribution of |Sx| showed an increasing trend from north to south, with |Sx| in the southern coastal areas having values greater than 1.00. However, the spatial distribution difference of the Sx of ET0 to SD and u2 was not significant, ranging from 0.23 to 0.30 and 0.06 to 0.13, with an average of 0.26 and 0.09, respectively. The sensitivity coefficients of ET0 were positive for T, SD, and u2 and negative for RH. Therefore, this result indicates that ET0 in the study area increases with T, SD, and u2 and decreases with RH. The analysis of the sensitivity of ET0 to climatic factors showed that ET0 was highly sensitive to T, RH, and SD and moderately sensitive to u2.
On the seasonal scale (Figure 6), ET0 showed positive Sx for T, SD, and u2 and negative Sx for RH in all seasons. The Sx of ET0 to T was highest in summer and autumn, with an average of 0.73. The same measure was smaller in spring and winter, with values of 0.60 and 0.54, respectively. The Sx of ET0 to RH varied significantly among different regions in all seasons, and the spatial distribution of |Sx| increased from north to south. The Sx to RH was relatively high in winter and spring, with |Sx| averages of 0.94 and 0.83, respectively, and smaller in autumn and summer, with |Sx| averages of 0.63 and 0.55, respectively. The Sx of ET0 to RH in different regions differed little between seasons, and the ranking of the Sx to SD was as follows: summer (0.35) > autumn (0.31) > spring (0.20) > winter (0.19). The Sx for u2 were ranked as follows: winter (0.15) > autumn (0.13) > spring (0.05) > summer (0.04). Overall, ET0 was highly sensitive to T and RH in different seasons, while being sensitive to SD in spring, summer, and autumn and moderately sensitive in winter. ET0 was moderately sensitive to u2 in winter, autumn, and spring, but negligibly sensitive in summer.

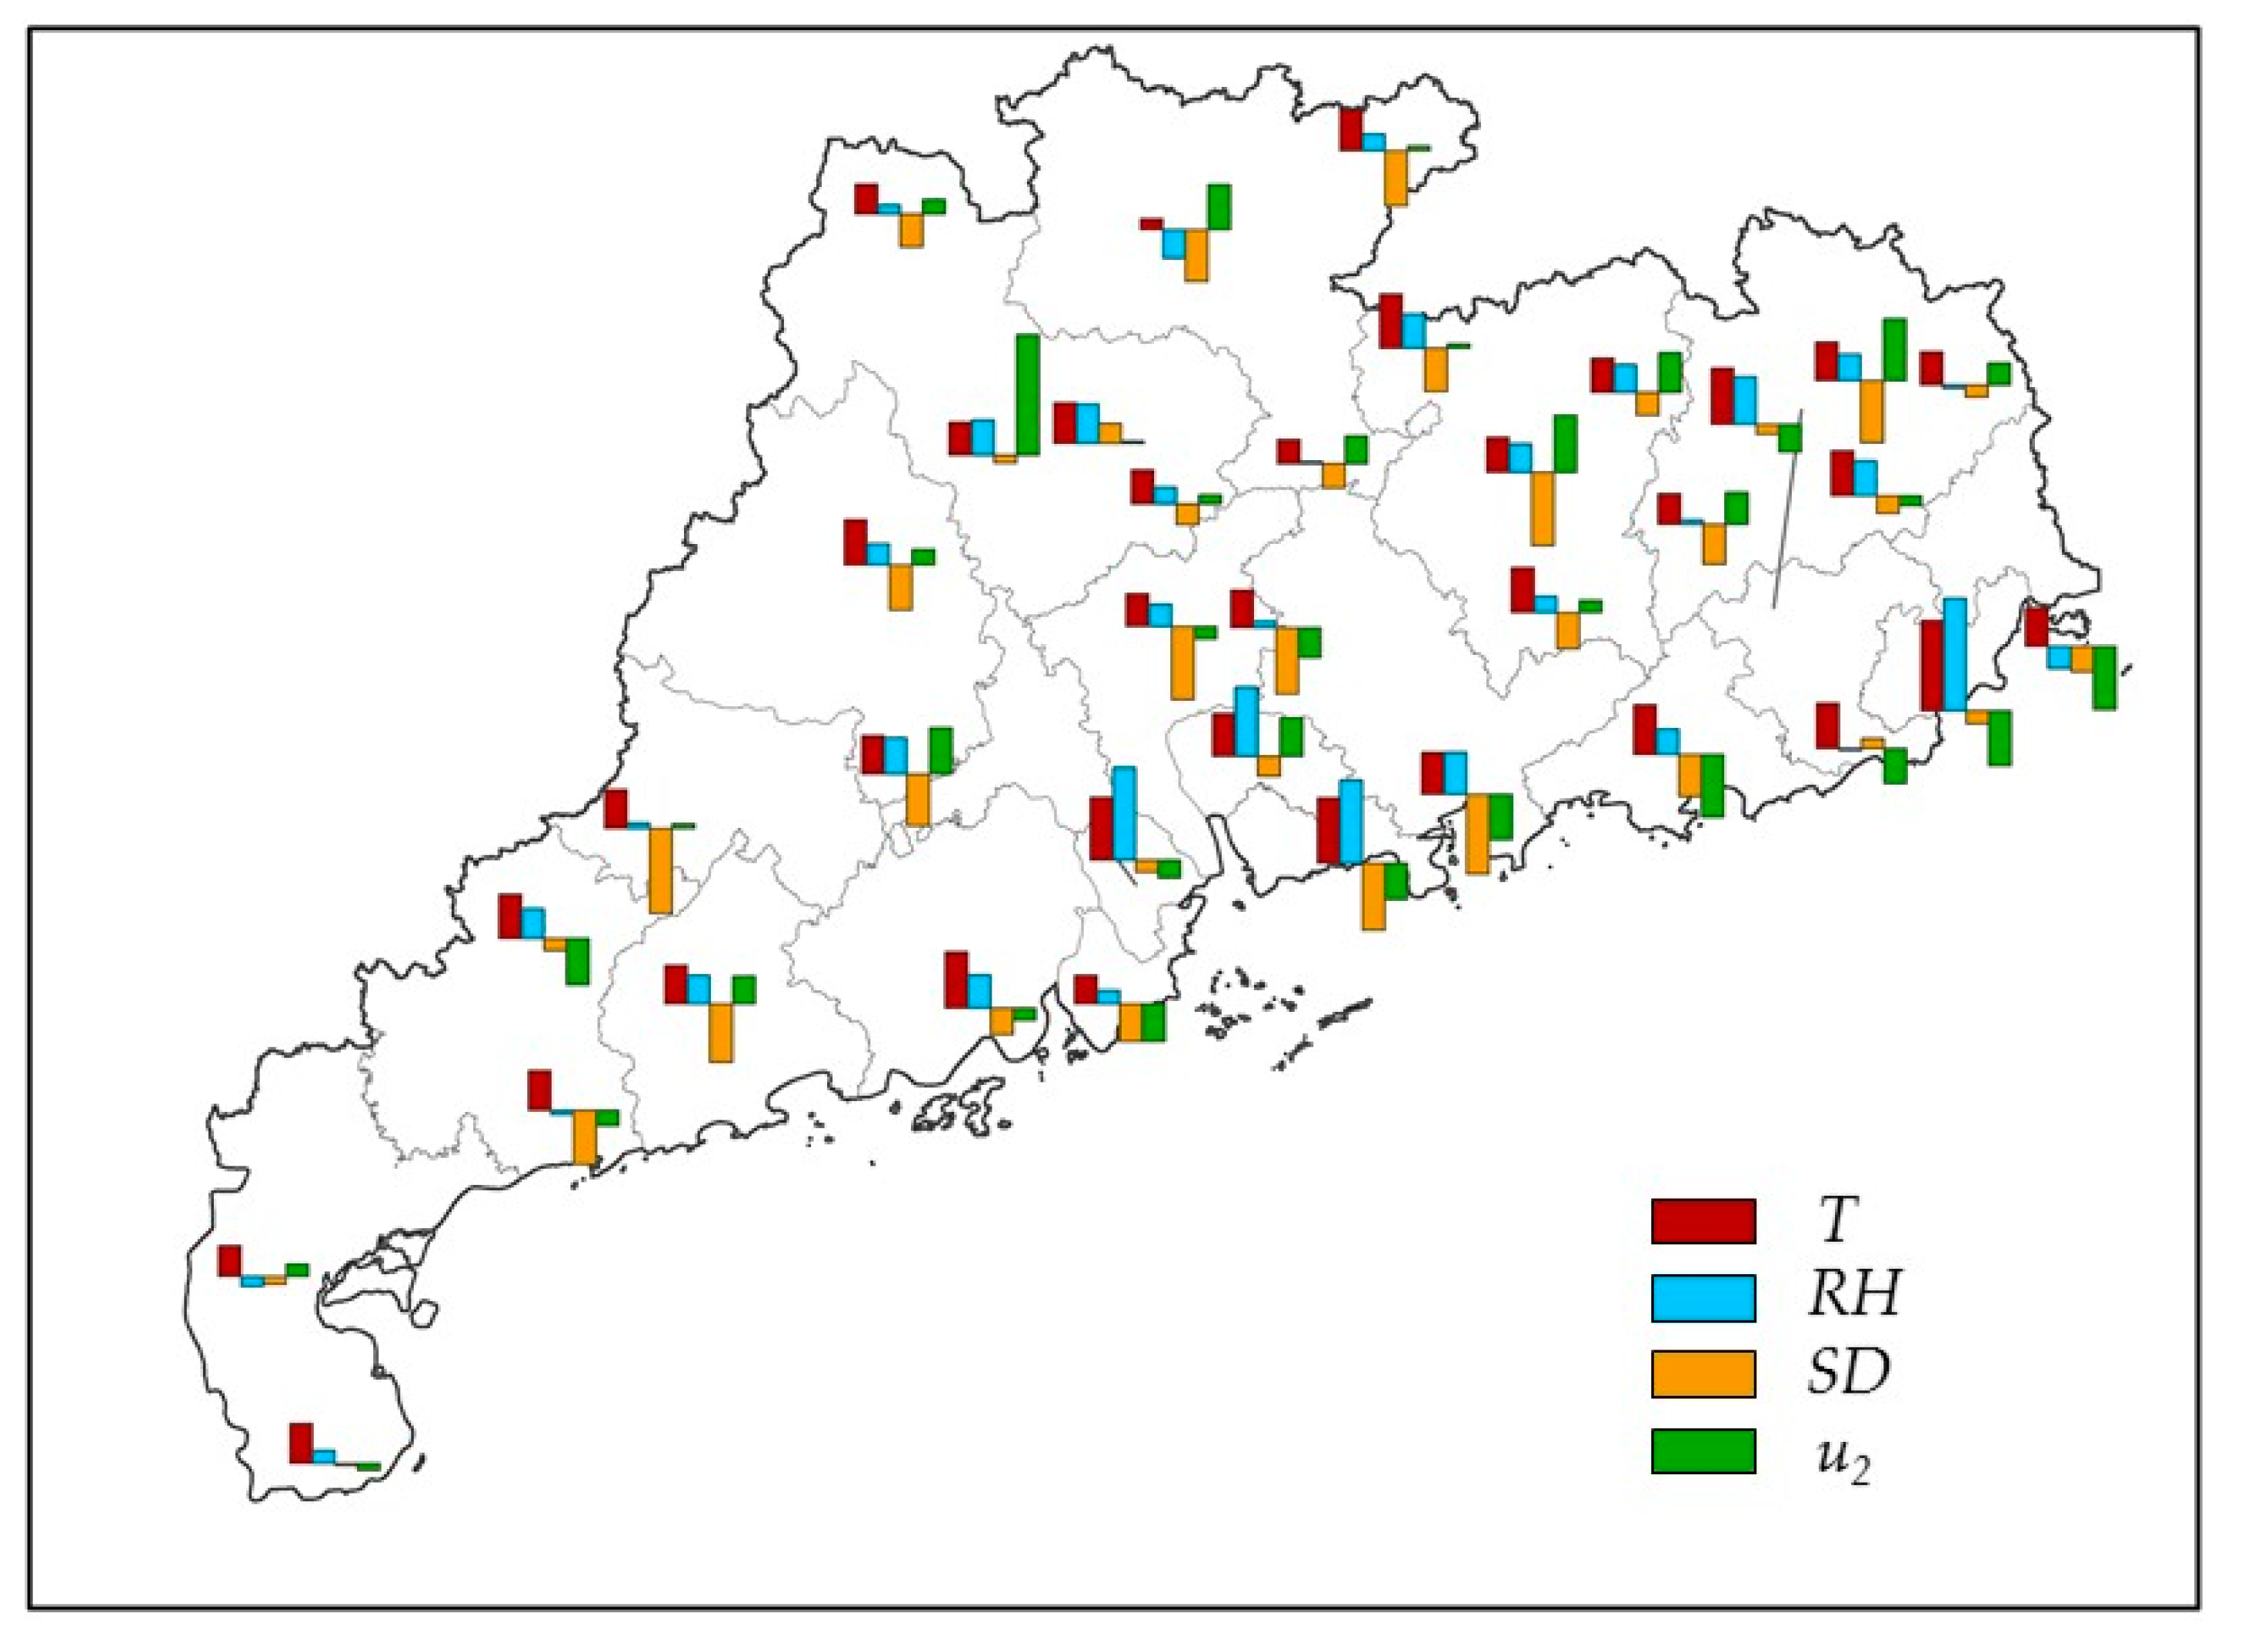
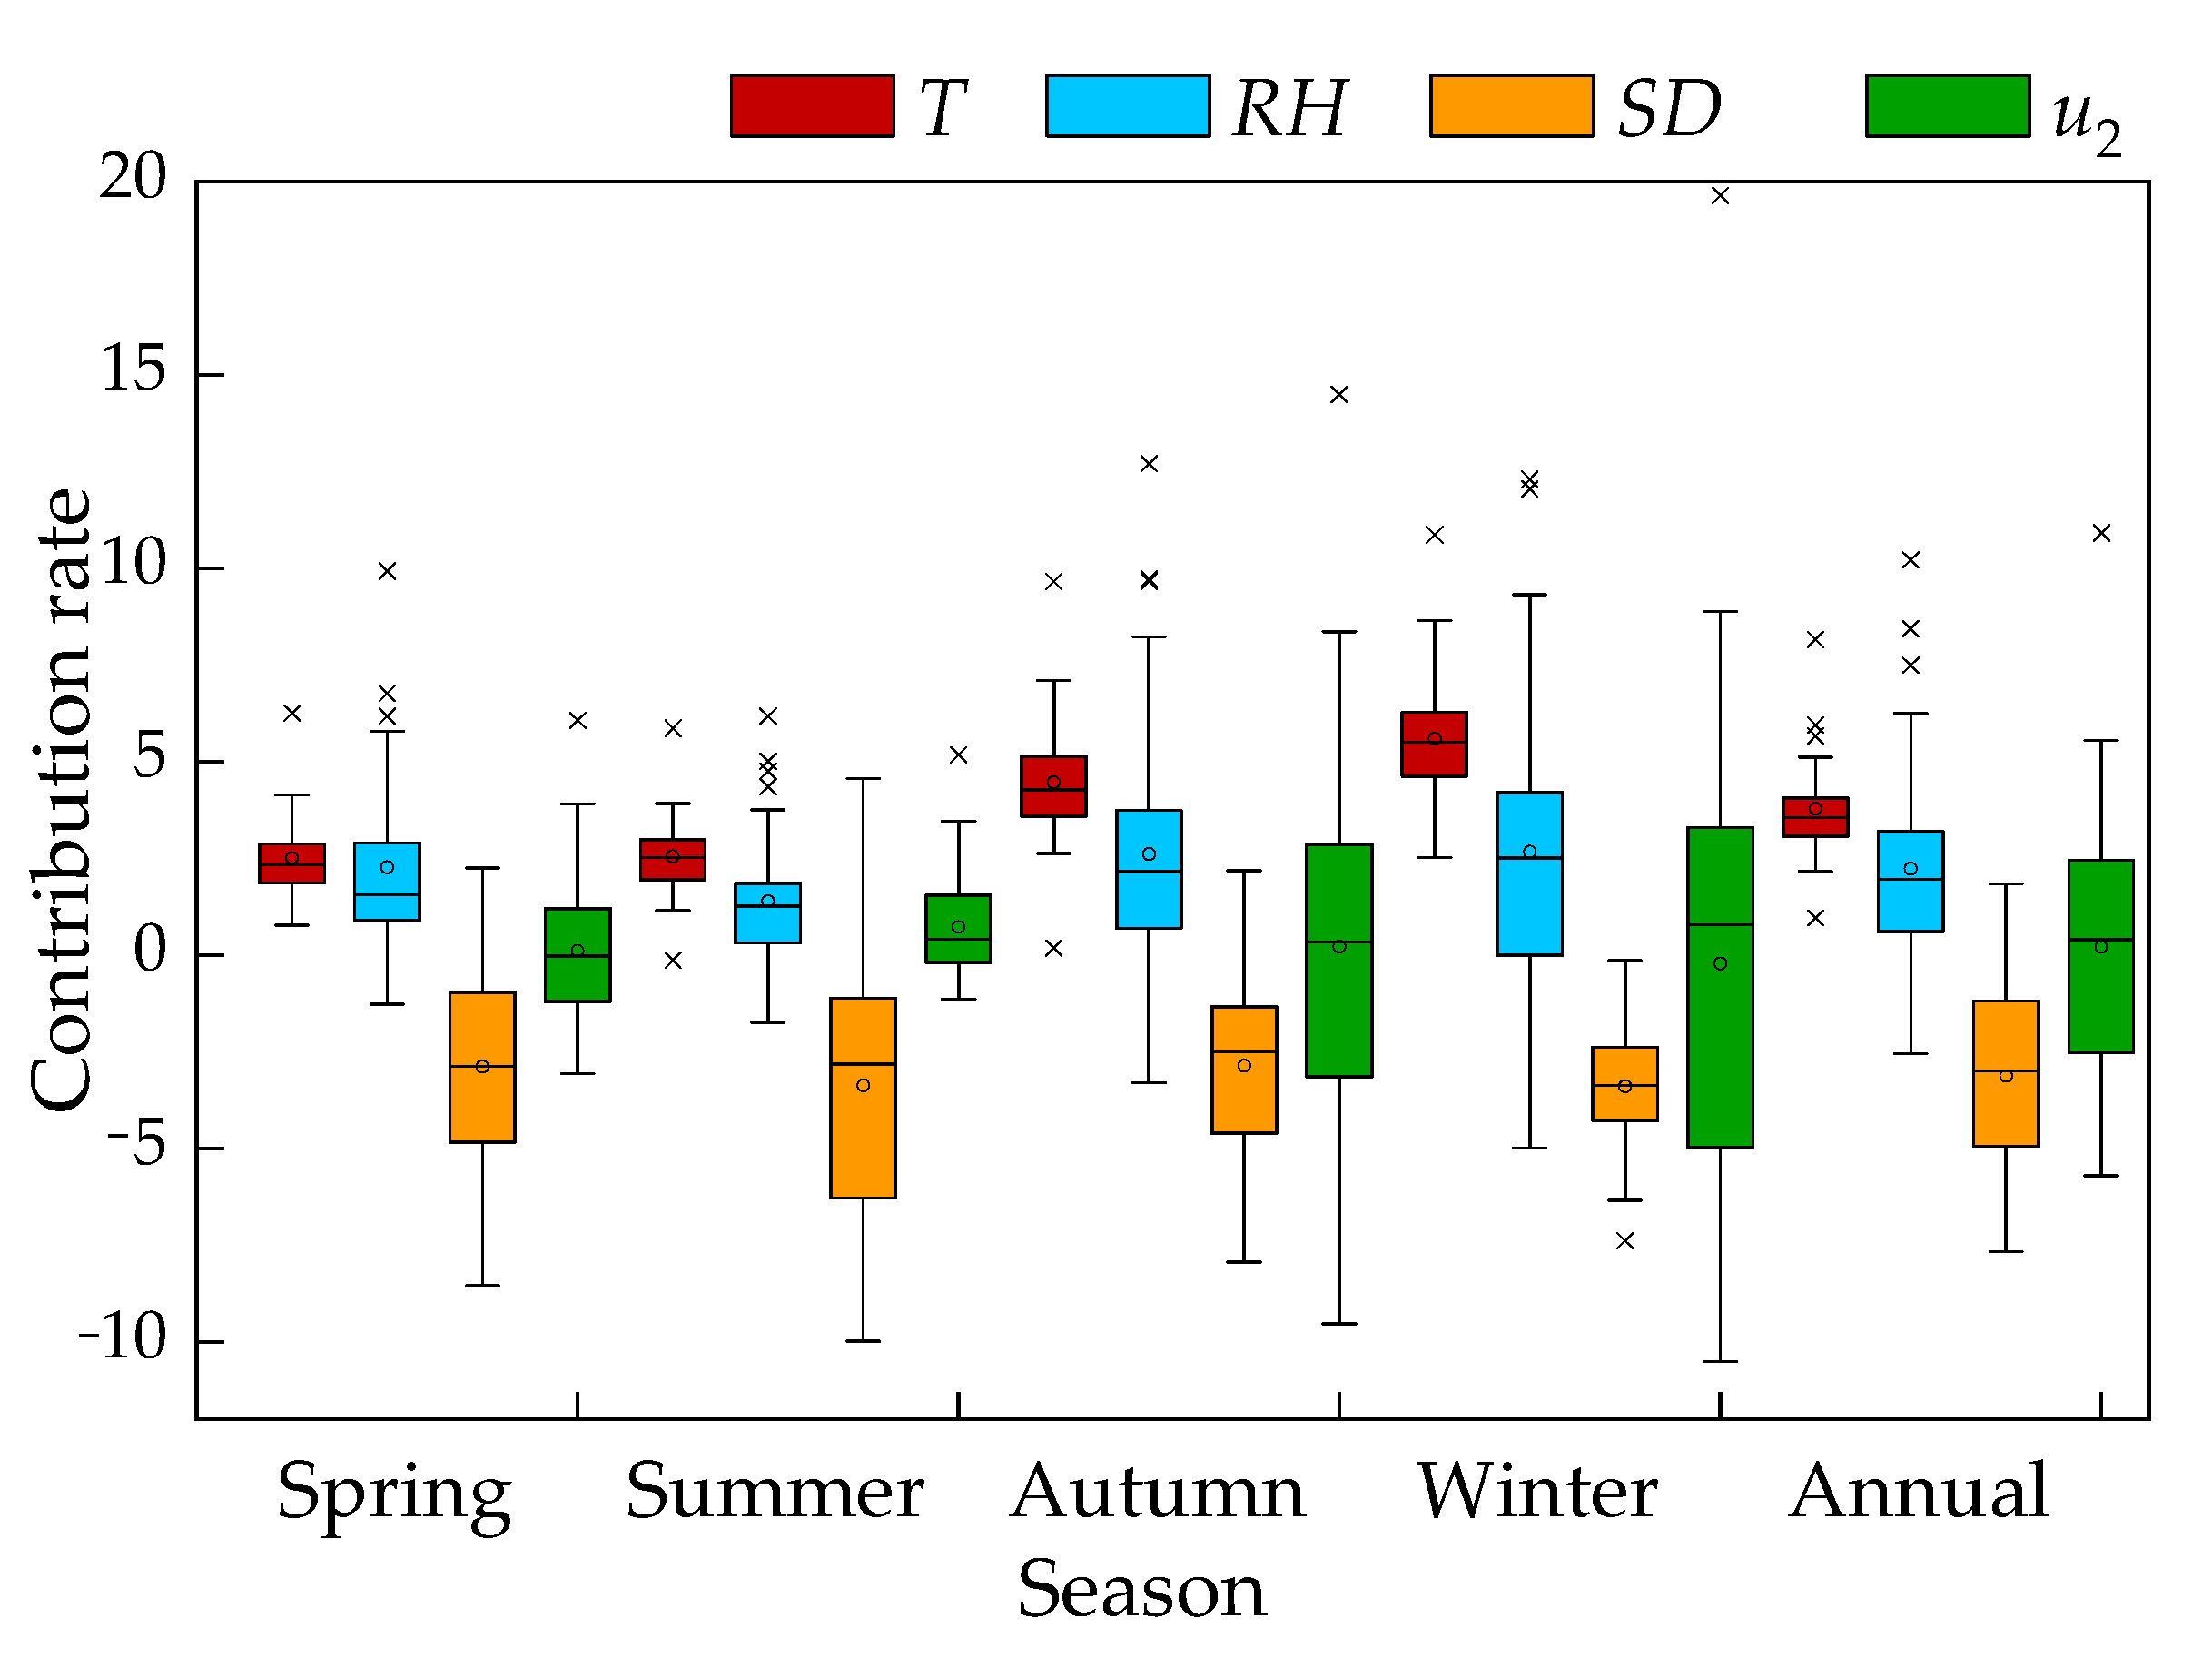
3.4. Contributions of Climatic Factors to the Trends in ET0

We calculated the contribution rates of T, SD, RH, and u2 to ET0 using Equation (10), before adding them to obtain the total contribution rate of climatic factor changes to ET0, which were noted as ET0-estimated. Next, the actual relative rate of change in ET0 was calculated using Equation (11), which was noted as a ET0-actual. A correlation analysis between ET0-estimated and ET0-actual for all stations showed that ET0-estimated was relatively close to ET0-actual (Figure 7). The fitting points were concentrated around the 1:1 line, and the R2 values were greater than 0.90 in different seasons and annually. Therefore, it could be considered reliable to quantify ET0 changes based on the contributions of T, SD, RH, and u2.
The spatial distribution of the contribution rate (Cx) of T, RH, SD, and u2 to ET0 variation in the study area is shown in Figure 8. The results indicate that the Cx of T to ET0 variation is positive at all stations, with an average of 3.78% and a range in variation from 0.96% to 8.16% (Table 5), with high values occurring in the PRD and eastern coastal areas, while Cx is relatively small in the north and west. The Cx of RH to ET0 variation ranged from −2.55% to 10.22%, with 31 stations having positive Cx and 6 stations having negative Cx. Negative values were found in stations such as Zhanjiang, Shaoguan, and Nan’ao, where RH showed an increasing trend during the study period. High values of Cx were found in the PRD, and low values were mainly found in the north and west. The Cx of SD to ET0 change ranged from −7.67% to 1.84%. |Cx| high values were mainly found in the PRD, Luoding, and Heyuan. Cx was negative in most regions and positive only in Huilai and Yingde, where Cx was 0.90% and 1.84%, respectively. SD showed an increasing trend in these two regions. The Cx of u2 to ET0 variation at different stations ranged from −5.70% to 10.91%, with 21 stations having positive Cx and 16 stations having negative Cx. Negative values were mainly found in coastal areas where u2 decreased; however, in the remaining 21 stations, u2 showed an increasing trend, resulting in an overall positive Cx on average.
Overall, the ranking of the contribution of each meteorological factor to ET0 in the study area was T (3.78%) > SD (3.27%) > u2 (2.73%) > RH (2.58%). The Cx of T, RH, and u2 to ET0 was positive on average, indicating that the temperature changes, RH, and u2 in Guangdong over the last 61 years caused an increase in ET0. In contrast, the Cx of SD to ET0 was negative on average, indicating that the changes in SD in Guangdong decreased ET0 during the study period.
On the seasonal scale (Figure 9), the Cx of T to ET0 change was positive in all seasons, with high Cx mainly found in the PRD and the eastern coastal region. The mean Cx gradually increased from spring (2.51%) to winter (5.59%) (Table 5), which is consistent with the ranking of T tendency rate in different seasons. The Cx of RH to ET0 variation was the smallest in summer (1.40%) and the highest in winter (2.67%), mainly due to the negative tendency rate and negative Sx of RH in different seasons. High Cx was observed in the PRD in all seasons. The average Cx of RH to ET0 changes in all seasons was negative, with the highest |Sx| observed in winter (3.39%), followed by summer (3.37%), while the lowest was observed in autumn (2.86%). High |Sx| values were mainly found in the PRD, Luoding, and Heyuan. The high value area of |Sx| in winter was relatively lower than in other seasons. In conclusion, the contribution rate of T and SD to ET0 change was higher in different seasons, followed by RH, while u2 was very small. The Cx of SD was higher than T in spring and summer and was the dominant factor influencing ET0 variation. However, in autumn and winter, the Cx of T was higher than SD, and T became the dominant factor of ET0 change in the study area.

4. Discussion

4.1. Changing Trends of Meteorological Factors and ET0

Over the past few decades, the air temperatures in most regions showed an unprecedented increasing trend, making global warming is indisputable. The overall T in Guangdong increased at a rate of 0.17 °C/10a during the study period, and the main reason explaining the regional warming is the increase in greenhouse gas emissions due to global population growth and economic development. The decreasing trend of RH in the study area and the increase in T indicate that the climate became drier to some extent over the 61 years studied. SD in Guangdong is on a downward trend; in fact, most of the world, such as Asia and Europe, is experiencing a decrease in sunshine hours to varying degrees, i.e., global dimming [38,39,40]. It was previously reported that human activities can cause a reduction in SD because atmospheric pollution from human activities leads to an increase in aerosols in the air. The aerosols increase the reflection and absorption of sunlight by the atmosphere, which, in turn, reduces the solar radiation reaching the ground, causing the reduction in SD [41]. Moreover, the decrease in wind speed makes the pollutants in the atmosphere less diffusible, which increases the near-surface aerosol concentration and contributes to the decrease in SD to some extent. u2 in the study area decreases along with the trend in global wind speeds [42]. In this study, the distribution of u2 changes was irregular, with stronger declines in Nan’ao, Shanwei, Shantou, and Shenzhen; these declines were concentrated in the central–eastern coastal region. Changes in meteorological factors also showed different seasonal characteristics variation. For example, T increased in all seasons, and RH and SD decreased in different seasons. Meanwhile, u2 increased only in summer and decreased in other seasons.
Annual ET0 in Guangdong is slightly increasing at a rate of 2.76 mm/10a; it appears that many regions around the globe significantly influenced by oceanic climate recorded an increasing trend in ET0, such as the Korean Peninsula, which is in a subtropical monsoon climate zone [43]; Paraíba, Brazil, and Madagascar, which are in tropical high-temperature climate zones [44]; and Austria, which is in a maritime temperate broad-leaved forest climate zone [45]. This trend is different from those recorded in other regions in China, such as the Yellow River Basin [46], North China Plain [47], Northwest China [36], and Beijing–Tianjin–Hebei regions [48], where ET0 decreased since the 1960s, creating an “evaporation paradox”. This paradox exists at about 62% of the stations across China, where ET0 decreases at a rate of 5.2 mm/10a despite an increase in temperature [14]. However, this study showed some subtle differences in the spatial distribution in Guangdong: due to the influence of topography and geomorphology, ET0 is higher in the southern low-elevation coastal areas than in the northern high-elevation areas. The evaporation paradox phenomenon was found at 12 of 37 stations in the study area, where ET0 decreased with increasing temperature. Among these stations, Luoding and Dianbai in western Guangdong, Guangzhou, Zhuhai, Zengcheng, and Huiyang in the PRD, as well as 6 stations in Nan’ao in eastern Guangdong, showed significant decreasing trends in ET0. The study also revealed seasonal variations in ET0, with a decreasing trend in spring and an increasing trend in the other seasons, particularly autumn and winter. These results show that various factors affect ET0, with each factor having a different weight.

4.2. Climatic Factors Affecting the Variation in ET0

Climate change is the key factor driving ET0 variation; however, there are differences and uncertainties in the factors influencing ET0 variation between global regions, mainly due to the interactions between meteorological elements. It is generally accepted that ET0 is positively correlated with u2, T, and SD and negatively correlated with RH [49]. The sensitivity analysis conducted in this study shows that ET0 in Guangdong is highly sensitive to RH, T, and SD and moderately sensitive to u2, which is consistent with the results recorded for the Poyang Lake catchment, China [32], and for the Korean Peninsula [43]. However, the sensitivity of ET0 to climatic factors varies across different regions, and ET0 was most sensitive to RH in Guizhou Province [50], Jiangsu Province [23], the Beijing–Tianjin–Hebei region [48], and the Huai River Basin [51]. In contrast, ET0 was most sensitive to u2 in the northwest inland region, followed by RH, T, and SD [36]. Although ET0 was more sensitive to RH than to T, the contribution analysis showed that RH contributed less to the increase in ET0 than T and SD. In the tropical high-temperature climate zone in Brazil, the main climatic factor driving ET0 changes is temperature, while the most critical impact factor alternates between temperature and sunshine hours in the rainy and dry seasons. In Austria, which is located in a temperate broad-leaved forest climate zone, the main reason for ET0 rise is the increase in solar radiation [45]. In this study, T was the main cause of ET0 changes in Guangdong, and SD was the second main cause of ET0 changes, while in spring and summer, SD was the dominant factor of ET0 changes because SD decreased more significantly. It was reported that the drier the climate in China, the greater the contribution of wind speed to ET0, especially in the arid northwest, where u2 is the main cause of ET0 decrease [26,36]. The results of this study showed a relatively large contribution of u2 to ET0 variation in summer, and the same low RH and strong u2 rise were found at these stations.
Overall, the increasing effect of rising T and falling RH on ET0 in Guangdong during the study period exceeded the decreasing effect of falling SD on ET0, ultimately leading to an overall increasing trend of ET0. However, in regions where the evaporation paradox exists, i.e., T rise is accompanied by ET0 decline, the contribution of SD to ET0 is usually more significant than that of T. Moreover, in inland areas of Guangdong, such as Guangzhou, Zengcheng, Huiyang, and Luoding, the strong decreasing effect of SD on ET0 masks the increasing effect of T and RH, while in coastal regions, such as Dianbai and Nan’ao, the decrease in SD and rise in RH offset the increase in ET0, suggesting that there are spatial differences and uncertainties in the weights of each factor affecting the variation in ET0.

4.3. Impact of Climate and ET0 Changes on Agricultural Production

Guangdong belongs to the tropical and subtropical monsoon climate zone, with a humid climate, abundant heat, and abundant but unevenly distributed precipitation. This region is a significant producer of grain crops (e.g., rice, corn, and tubers) and tropical crops (e.g., sugarcane, rubber trees) in China [52,53]. Climate change may complexly impact agricultural production and water resource management in this region. In fact, an increasing drought trend was consistently observed in recent years, which was both global and regional in scale, including in the Guangdong [54,55]. Climate warming will result in a richer agro-climatic heat resource, a longer crop growing season, and more heat in the growing season in Guangdong. This change, in turn, will push the existing agro-climatic zone and crop maturity boundaries northward and to higher elevations, which favors the cultivation of tropical crops in the region, while the northern boundary of the second and third maturity zones of crops also moves northward and the area is expanded. However, the increase in temperature may also lead to drought and summer heat disasters, which could reduce agricultural yield or affect the quality of crops. The decrease in sunshine duration will negatively impact the high and stable yield factors of tropical fruits in the region, such as fruit enlargement and sugar accumulation in sugarcane, as well as increase the late rice seed setting rate [53]. In addition, ET0 increased in the province, particularly in eastern Guangdong and the Leizhou Peninsula. Crops’ evapotranspiration water consumption in these agricultural areas increased, leading to an increase in demand for irrigation water. The contradiction between the supply of and demand for water resources in the future is prominent, which may aggravate the drought and water shortage situation in water-restricted areas, especially in spring and winter, when precipitation is at the lowest annual level. Corrective and preventive measures should be considered in water resources planning and agricultural production.
For a complete understanding of the mechanism driving changes in regional evapotranspiration responses to climate change, further attention should be paid to the feedback and quantitative relationship between actual evapotranspiration and ET0, as well as how this relationship affects regional hydrological cycles.

5. Conclusions

In this study, we conducted a comprehensive analysis of the trends of ET0 and major climatic factors (T, RH, SD, and u2) in Guangdong from 1960 to 2020. Our findings provide important insights into the factors driving variations in ET0 and implications for future regional water management. Based on the results, the following conclusions can be made:
(1)
The annual ET0 in Guangdong increased at a rate of 1.61 mm/10a. ET0 increased at most stations; only 6 stations had a decreasing trend for all 37 analyzed samples. ET0 decreased in spring and increased in the other seasons, though these trends were not statistically significant. Meanwhile, T significantly increased during the study period, while RH and SD significantly decreased.
(2)
Sensitivity analysis showed that ET0 was more sensitive to RH and T than SD and u2 in Guangdong. ET0 was most sensitive to RH in spring and winter and T in summer and autumn. Through considering the variation in variables and their sensitivity to ET0, the results showed that T was the dominant factor for ET0 variation in Guangdong, followed by SD. In the areas where the “evaporation paradox” occurs, as well as in spring and summer, SD was the dominant factor in ET0 variation. Therefore, the trend of climatic factors plays a critical role in analyzing the variation in ET0.
(3)
The increasing effect of rising T and decreasing RH on ET0 masked the decreasing effect of SD on ET0, resulting in an overall increase in ET0 in Guangdong. This result suggests that a potential future increase in SD combined with a decrease in RH may lead to higher evapotranspiration rates and drought events in Guangdong. Therefore, we recommend adopting long-term water management strategies for sustainable development to cope with regional climate change.

Author Contributions

Conceptualization, Formal analysis, B.Z. and D.A.; Data Curation, B.Z. and C.Y.; Validation, R.K.; supervision, J.S.; writing—original draft preparation, B.Z.; writing—review and editing, H.Y. project administration, J.S. All authors have read and agreed to the published version of the manuscript.

Funding

This research was funded by the Hainan Provincial Natural Science Foundation of China (grant number 322QN415), and the Central Public-Interest Scientific Institution Basal Research Fund (grant number 1630062023008, 1630102022002, 1630102022004).

Data Availability Statement

The data presented in this study are available upon request from the corresponding authors.

Acknowledgments

The authors would like to thank the editors and anonymous reviewers for their constructive comments and suggestions that helped us to improve the quality of this manuscript.

Conflicts of Interest

The authors declare no conflict of interest.

Nomenclature

ΔSlope of the vapor pressure curve (kPa °C−1)
γPsychrometric constant (kPa °C−1).
βClimatic tendency rate
aLinear slope
bIntercept
CxContribution rate (%)
eaActual vapor pressure (kPa)
esSaturation vapor pressure (kPa)
FAO56 PM methodFAO56 Penman–Monteith method
PRDPearl River Delta
ETEvapotranspiration (mm d−1)
ET0Reference evapotranspiration (mm d−1)
GSoil heat flux (MJ m−2 d−1)
nLength of the data set
pSignificance test value
RcRelative change rate of certain meteorological factors (%)
RHRelative humidity
RnNet radiation (MJ m−2 d−1)
STest statistic
SDSunshine duration (h)
SxSensitivity coefficient
TAir temperature (°C)
TmaxMaximum temperature (°C)
TminMinimum temperature (°C)
u2Wind speed at 2 m (m s−1)
uzWind speed at z m (m s−1)
xMeteorological factors
  x ¯ Mean of the meteorological factor time series.
ZStandardized test statistic

References

  1. IPCC. Climate Change 2021: The Physical Science Basis. Contribution of Working Group to the Sixth Assessment Report of the Intergovernmental Panel on Climate Change; Cambridge University Press: Cambridge, UK; New York, NY, USA, 2021. [Google Scholar]
  2. Camilo, M.; Tristan, M.; Isabella, M.G. Over half of known human pathogenic diseases can be aggravated by climate change. Nat. Clim. Chang. 2022, 12, 869–875. [Google Scholar]
  3. Tiago, N.S.; Marcelo, S.S.; Manuela, M. Climate change and economic growth: A heterogeneous panel data approach. Environ. Sci. Pollut. Res. 2018, 25, 22725–22735. [Google Scholar]
  4. Barnett, T.P.; Adam, J.C.; Lettenmaier, D.P. Potential impacts of a warming climate on water availability in snow-dominated regions. Nature 2005, 438, 303–309. [Google Scholar] [CrossRef] [PubMed]
  5. Seo, K.W.; Waliser, D.E.; Tian, B.; Kim, B.M.; Park, S.C.; Cocke, S.; Sohn, B.J.; Ishii, M. Evidence of the recent decade change in global fresh water discharge and evapotranspiration revealed by reanalysis and satellite observations. Asia-Pac. J. Atmos. Sci. 2012, 48, 153–158. [Google Scholar] [CrossRef]
  6. Vadeboncoeur, M.A.; Green, M.B.; Asbjornsen, H.; Campbell, J.L.; Adams, M.B.; Boyer, E.W. Systematic variation in evapotranspiration trends and drivers across the northeastern United States. Hydrol. Process. 2018, 32, 3547–3560. [Google Scholar] [CrossRef]
  7. Oki, T.; Kanae, S. Global hydrological cycles and world water resources. Science 2006, 313, 1068–1072. [Google Scholar] [CrossRef]
  8. Liu, X.; Zhang, D. Trend analysis of reference evapotranspiration in Northwest China: The roles of changing wind speed and surface air temperature. Hydrol. Process. 2013, 27, 3941–3948. [Google Scholar] [CrossRef]
  9. Allen, R.G.; Pereira, L.S.; Raes, D.; Smith, M. Crop Evapotranspiration-Guidelines for computing crop water requirements-FAO Irrigation and drainage paper 56. FAO Rome 1998, 300, D05109. [Google Scholar]
  10. Urška, M.; Nejc, B.; Mojca, Š. Reference evapotranspiration changes in Slovenia, Europe. Agric. For. Meteorol. 2018, 260–261, 183–192. [Google Scholar]
  11. Yong, S.L.S.; Ng, J.L.; Huang, Y.F.; Ang, C.K. Estimation of Reference Crop Evapotranspiration with Three Different Machine Learning Models and Limited Meteorological Variables. Agronomy 2023, 13, 1048. [Google Scholar] [CrossRef]
  12. Feng, G.; Cobb, S.; Abdo, Z.; Fisher, D.K.; Ouyang, Y.; Adeli, A.; Jenkins, J.N. Trend analysis and forecast of precipitation, reference evapotranspiration, and rainfall deficit in the blackland prairie of Eastern Mississippi. J. Appl. Meteorol. Climatol. 2016, 55, 1425–1439. [Google Scholar] [CrossRef]
  13. Yin, Y.; Wu, S.; Gang, C.; Dai, E. Attribution analyses of potential evapotranspiration changes in China since the 1960s. Theor. Appl. Climatol. 2010, 101, 19–28. [Google Scholar] [CrossRef]
  14. Hu, Q.; Dong, B.; Pan, X.; Jiang, H.; Pan, Z.; Qiao, Y.; Shao, C.; Ding, M.; Yin, Z.; Hu, L. Spatiotemporal variation and causes analysis of dry-wet climate over period of 1961–2014 in China. Trans. Chin. Soc. Agric. Eng. (Trans. CSAE) 2017, 33, 124–132. [Google Scholar]
  15. Bandyopadhyay, A.; Bhadra, A.; Raghuwanshi, N.S.; Singh, R. Temporal trends in estimates of reference evapotranspiration over India. J. Hydrol. Eng. 2009, 14, 508–515. [Google Scholar] [CrossRef]
  16. Jhajharia, D.; Dinpashoh, Y.; Kahya, E.; Singh, V.P.; Fakheri-Fard, A. Trends in reference evapotranspiration in the humid region of northeast India. Hydrol. Process. 2012, 26, 421–435. [Google Scholar] [CrossRef]
  17. Mosaedi, A.; Ghabaei Sough, M.; Sadeghi, S.H.; Mooshakhian, Y.; Bannayan, M. Sensitivity analysis of monthly reference crop evapotranspiration trends in Iran: A qualitative approach. Theor. Appl. Climatol. 2016, 128, 857–873. [Google Scholar] [CrossRef]
  18. Ghafouri-Azar, M.; Bae, D.; Kang, S. Trend Analysis of Long-Term Reference Evapotranspiration and Its Components over the Korean Peninsula. Water 2018, 10, 1373. [Google Scholar] [CrossRef]
  19. Liu, Y.; Wang, Q.; Yao, X.; Jiang, W. Variation in Reference Evapotranspiration over the Tibetan Plateau during 1961–2017: Spatiotemporal Variations, Future Trends and Links to Other Climatic Factors. Water 2020, 12, 3178. [Google Scholar] [CrossRef]
  20. Roderick, M.L.; Farquhar, G.D. The cause of decreased pan evaporation over the past 50 years. Science 2002, 298, 1410–1411. [Google Scholar] [CrossRef]
  21. Vicente-Serrano, S.M.; Azorin-Molina, C.; Sanchez-Lorenzo, A.; Revuelto, J.; Morán-Tejeda, E.; López-Moreno, J.; Espejo, F. Sensitivity of Reference Evapotranspiration to Changes in Meteorological Parameters in Spain (1961–2011); John Wiley & Sons, Ltd.: Hoboken, NJ, USA, 2014. [Google Scholar]
  22. Patle, G.T. Trends in major climatic parameters and sensitivity of evapotranspiration to climatic parameters in the eastern Himalayan region of Sikkim, India. J. Water Clim. Chang. 2019, 11, 491–502. [Google Scholar] [CrossRef]
  23. Chu, R.; Li, M.; Shen, S.; Abu, R.M.; Towfiqul, I.; Cao, W.; Tao, S.; Gao, P. Changes in Reference Evapotranspiration and Its Contributing Factors in Jiangsu, a Major Economic and Agricultural Province of Eastern China. Water 2017, 9, 486. [Google Scholar] [CrossRef]
  24. Liu, T.; Li, L.; Lai, J.; Liu, C.; Zhuang, W. Reference evapotranspiration change and its sensitivity to climate variables in southwest China. Theor. Appl. Climatol. 2016, 125, 499–508. [Google Scholar] [CrossRef]
  25. An, D.; Dou, M. Progress and prospect of the application of water saving agriculture in seasonal drought in South China. Guangdong Agric. Sci. 2015, 42, 130–135. [Google Scholar]
  26. Wang, C.; Zou, J.; Mai, B.; Chen, H.; Tang, L.; Duan, H. Temporal-spatial characteristics and its variation trend of meteorological drought in recent 50 years, South China. Acta Ecol. Sin. 2015, 35, 595–602. [Google Scholar]
  27. Wang, H.; Zheng, J. Assessing the effects of surface conditions on potential evapotranspiration in a humid subtropical region of China. Front. Clim. 2022, 4, 813787. [Google Scholar] [CrossRef]
  28. Liu, Y.; Tang, G.; Wu, L.; Wu, Y.; Yang, M. Variations in reference evapotranspiration and associated driving forces in the Pearl River Delta of China during 1960–2016. J. Meteorol. Soc. Jpn. 2019, 97, 467–479. [Google Scholar] [CrossRef]
  29. Peterson, T.C.; Easterling, D.R.; Karl, T.R.; Groisman, P.; Nicholls, N.; Plummer, N.; Torok, S.; Auer, I.; Boehm, R.; Gullett, D.; et al. Homogeneity adjustments of in situ atmospheric climate data: A review. Int. J. Climatol. 1998, 18, 1493–1517. [Google Scholar] [CrossRef]
  30. Hu, Q.; Pan, F.; Pan, X. Dry-wet variations and cause analysis in Northeast China at multi-time scales. Theor. Appl. Climatol. 2018, 133, 775–786. [Google Scholar] [CrossRef]
  31. Zhang, F.; Liu, Z.; Zhang, Z.; Yu, J.; Shi, K.; Yao, L. Spatiotemporal Distribution Characteristics of Reference Evapotranspiration in Shandong Province from 1980 to 2019. Water 2020, 12, 3495. [Google Scholar] [CrossRef]
  32. Ye, X.; Li, X.; Liu, J.; Xu, C.; Zhang, Q. Variation of reference evapotranspiration and its contributing climatic factors in the Poyang Lake catchment, China. Hydrol. Process. 2014, 28, 6151–6162. [Google Scholar] [CrossRef]
  33. Nouri, M.; Bannayan, M. Spatiotemporal changes in aridity index and reference evapotranspiration over semi-arid and humid regions of Iran: Trend, cause, and sensitivity analyses. Theor. Appl. Climatol. 2019, 136, 1073–1084. [Google Scholar] [CrossRef]
  34. McCuen, R.H. A sensitivity and error analysis of procedures used for estimating evapotranspiration. Water Res. Bull. 1974, 10, 486–498. [Google Scholar] [CrossRef]
  35. Lenhart, T.; Eckhardt, K.; Fohrer, N.; Frede, H.G. Comparison of two different approaches of sensitivity analysis. Phys. Chem. Earth 2002, 27, 645–654. [Google Scholar] [CrossRef]
  36. Huo, Z.; Dai, X.; Feng, S.; Kang, S.; Huang, G. Effect of climate change on reference evapotranspiration and aridity index in arid region of China. J. Hydrol. 2013, 492, 24–34. [Google Scholar] [CrossRef]
  37. Zhao, Z.; Wang, H.; Wang, C.; Li, W.; Chen, H.; Deng, C. Changes in reference evapotranspiration over Northwest China from 1957 to 2018: Variation characteristics, cause analysis and relationships with atmospheric circulation. Agric. Water Manag. 2020, 231, 105958. [Google Scholar] [CrossRef]
  38. Urban, G.; Migała, K.; Pawliczek. Sunshine duration and its variability in the main ridge of the Karkonosze Mountains in relation to with atmospheric circulation. Theor. Appl. Climatol. 2018, 131, 1173. [Google Scholar] [CrossRef]
  39. Kitsara, G.; Georgia, P. Dimming brightening in Athens: Trends in sunshine duration, cloud cover and reference evapotranspiration. Water Resour. Manag. 2013, 27, 1623–1633. [Google Scholar]
  40. Matzarakis, A.; Katsoulis, V. Sunshine duration hours over the Greek region. Theor. Appl. Climatol. 2006, 83, 107–120. [Google Scholar] [CrossRef]
  41. Yang, Y.; Zhao, N.; Hao, X.; Li, C. Decreasing trend of sunshine hours and related driving forces in North China. Theor. Appl. Climatol. 2009, 97, 91. [Google Scholar] [CrossRef]
  42. McVicar, T.R.; Roderick, M.L.; Donohue, R.J.; Li, L.T.; Niel, T.G.V.; Thomas, A.; Grieser, J.; Jhajharia, D.; Himri, Y.; Mahowald, N.M.; et al. Global review and synthesis of trends in observed terrestrial near-surface wind speeds: Implications for evaporation. J. Hydrol. 2012, 416, 182–205. [Google Scholar] [CrossRef]
  43. Ghafouri-Azar, M.; Lee, S.-I. Meteorological Influences on reference evapotranspiration in different geographical Regions. Water 2023, 15, 454. [Google Scholar] [CrossRef]
  44. Nascimento, R.; Brito, J.; Borges, V.P.; Farias, P.B.D.; Araújo, L.D.S. Reference Evapotranspiration in the State of Paraíba, Brazil: Climatic Trends and Influencing Factors. Rev. Bras. Geogr. Física 2020, 13, 1024. [Google Scholar] [CrossRef]
  45. Duethmann, D.; Blschl, G. Why has catchment evaporation increased in the past 40 years? A data-based study in Austria. Hydrol. Earth Syst. Sci. 2018, 22, 5143–5158. [Google Scholar] [CrossRef]
  46. Liu, Q.; Yan, C.; Zhao, C.; Yang, J.; Zhen, W. Changes of daily potential evapotranspiration and analysis of its sensitivity coefficients to key climatic variables in Yellow River basin. Trans. Chin. Soc. Agric. Eng. (Trans. CSAE) 2014, 30, 157–166. [Google Scholar]
  47. Wang, P.; Yan, J.; Jiang, C.; Liu, X. Spatial and temporal variations of reference crop evapotranspiration and its influencing factors in the North China Plain. Acta Ecol. Sin. 2014, 34, 5589–5599. [Google Scholar]
  48. Bi, Y.; Zhao, J.; Zhao, Y.; Xiao, W.; Meng, F. Spatial-temporal variation characteristics and attribution analysis of potential evapotranspiration in Beijing-Tianjin-Hebei region. Trans. Chin. Soc. Agric. Eng. (Trans. CSAE) 2020, 36, 130–140. [Google Scholar]
  49. Oliveira, R.D.; Junior, L.V.C.; Silva, J.B.; Espíndola, D.A.L.F.; Rodrigues, R.D.; Nogueira, J.S.; Curado, L.F.A.; Rodrigues, T.R. Temporal trend changes in reference evapotranspiration contrasting different land uses in southern Amazon basin. Agric. Water Manag. 2021, 250, 106815. [Google Scholar] [CrossRef]
  50. Gao, X.; Peng, S.; Wang, W.; Xu, J.; Yang, S. Spatial and temporal distribution characteristics of reference evapotranspiration trends in Karst area: A case study in Guizhou province, China. Meteorol. Atmos. Phys. 2016, 128, 677–688. [Google Scholar] [CrossRef]
  51. Li, M.; Chu, R.; Shen, S.; Islam, A.R.M.T. Quantifying Climatic Impact on Reference Evapotranspiration Trends in the Huai River Basin of Eastern China. Water 2018, 10, 144. [Google Scholar] [CrossRef]
  52. Li, Y.; Yang, X.; Wang, W.; Liu, Z. Changes of China agricultural climate resources under the background of climate change. I. Spatiotemporal change characteristics of agricultural climate resources in South China. Chin. J. Appl. Ecol. 2010, 21, 2605–2614. [Google Scholar]
  53. Dai, S.; Li, H.; Liu, H.; Liu, E. The spatio-temporal change characteristics of agriculture climate resources in southern china under the background of global warming. Chin. J. Agric. Resour. Reg. Plan. 2014, 35, 52–60. [Google Scholar]
  54. Venkataraman, K.; Tummuri, S.; Medina, A.; Perry, J. 21st century drought outlook for major climate divisions of Texas based on CMIP5 multimodel ensemble: Implications for water resource management. J. Hydrol. 2016, 534, 300–316. [Google Scholar] [CrossRef]
  55. Wang, Z.L.; Zhong, R.D.; Lai, C.G.; Zeng, Z.Y.; Lian, Y.Q.; Bai, X.Y. Climate change enhances the severity and variability of drought in the Pearl River Basin in South China in the 21st century. Agric. For. Meteorol. 2018, 249, 149–162. [Google Scholar] [CrossRef]
Figure 1. Distribution of meteorological stations and altitude map in Guangdong.
Agronomy 13 01446 g001
Figure 2. Annual variations and linear trends of meteorological variables in Guangdong in period 1960–2020: (a) temperature (T), (b) relative humidity (RH), (c) sunshine duration (SD), and (d) wind speed (u2).
Agronomy 13 01446 g002
Figure 3. Spatial distribution and trend of annual ET0 in study area. (a) Spatial variations, (b) Temporal variations.
Agronomy 13 01446 g003
Figure 4. Spatial distribution (ad) and trend (eh) of seasonal ET0 in study area.
Agronomy 13 01446 g004
Figure 5. Spatial distribution of annual sensitivity coefficient of ET0 to climatic factors in study area: temperature (T), relative humidity (RH), sunshine duration (SD), and wind speed (u2).
Agronomy 13 01446 g005
Figure 6. Box plots of sensitivity coefficient of ET0 to climatic factors in study area: temperature (T), relative humidity (RH), sunshine duration (SD), and wind speed (u2).
Agronomy 13 01446 g006
Figure 7. Relationship between estimated and actual relative variations in ET0 in study area.
Agronomy 13 01446 g007
Figure 8. Spatial distribution of contribution rate of meteorological factors to ET0 variations: temperature (T), relative humidity (RH), sunshine duration (SD), and wind speed (u2).
Agronomy 13 01446 g008
Figure 9. Contribution rate of meteorological factors to annual and seasonal ET0: temperature (T), relative humidity (RH), sunshine duration (SD), and wind speed (u2).
Agronomy 13 01446 g009
Table 1. Basic information of meteorological stations used in study area.
Station NameStation CodeLatitude
(°)
Longitude
(°)
Elevation (m)T
(°C)
P
(mm year−1)
ET0
(mm year−1)
Nanxiong5799625.08114.25149.720.601516.931086.92
Lianzhou5907224.82112.37131.720.591630.721017.50
Shaoguan5908224.67113.60121.321.241598.761102.62
Fogang5908723.88113.5297.221.872185.181110.86
Yingde5908824.18113.4274.421.861875.781125.04
Lianping5909624.38114.50283.921.061761.461045.66
Xinfeng5909724.03114.22269.321.291902.731021.50
Longchuan5910724.12115.28179.621.751676.191113.47
Dabu5911624.35116.7080.122.291504.851063.31
Meixian5911724.28116.07116.022.341497.091125.14
Guangning5927123.63112.4292.722.051721.331048.16
Gaoyao5927822.98112.4860.022.961641.141132.58
Qingyuan5928023.72113.0879.222.482125.331150.73
Guangzhou5928723.22113.4870.722.811809.361123.41
Dongguan5928922.97113.7356.023.141826.261195.20
Heyuan5929323.80114.7371.122.411922.631154.25
Zengcheng5929423.33113.8330.722.671965.491155.53
Huiyang5929823.07114.37108.522.871751.191191.59
Wuhua5930323.92115.75135.922.181499.911151.35
Zijin5930423.63115.18176.621.861706.801066.10
Jiexi5930623.45115.8580.922.422063.741123.96
Fengshun5931023.77116.1845.322.431830.541147.24
Shantou5931623.38116.682.322.391556.301186.02
Huilai5931722.98116.3042.022.681792.251210.90
Nan’ao5932423.43117.038.022.131357.391284.52
Xinyi5945622.35110.93141.423.471790.401201.36
Luoding5946222.72111.6060.023.121373.511114.67
Taishan5947822.25112.7833.122.891965.121183.24
Zhongshan5948522.50113.4033.722.971859.131134.09
Zhuhai5948822.28113.5751.423.172031.491271.63
Shenzhen5949322.55114.0063.023.361911.091252.23
Shanwei5950122.80115.3716.722.851899.261229.55
Zhanjiang5965821.15110.3053.423.841675.381214.12
Yangjiang5966321.85111.9890.323.112353.951189.67
Dianbai5966421.55110.9831.823.821550.611220.74
Shangchuan Island5967321.73112.7721.923.202244.921271.17
Xuwen5975420.25110.1711.424.541393.281271.18
Table 2. Sensitivity coefficient level classification.
|Sx|Sensitivity Level
|Sx| < 0.05Negligible
0.05 ≤ |Sx| < 0.20Moderate
0.20 ≤ |Sx| < 1.00High
|Sx| ≥ 1.00Very high
Table 3. Trend analysis results of climatic variable with linear regression, MK test.
Climatic FactorsMean ValueLinear RegressionMK Test
SlopeStdZp-ValueChange Point (Year)
Spring
T (°C)22.250.0150.742.410.0082000, 2011
RH (%)82.20−0.0382.51−2.380.0461963, 1994
SD (h)3.50−0.0080.74−0.940.1321968
u2 (m s−1)1.53−0.0010.09−1.600.0831964
Summer
T (°C)28.650.0160.305.630.0001993
RH (%)82.03−0.0371.61−3.300.0031983
SD (h)6.28−0.0100.60−2.300.0271979
u2 (m s−1)1.450.0020.083.180.0042010
Autumn
T (°C)23.990.0240.505.300.0001995
RH (%)75.27−0.0573.04−2.470.0141966
SD (h)6.01-0.0090.69−1.860.0862011
u2 (m s−1)1.58−0.00060.12−0.290.458-
Winter
T (°C)15.010.0260.943.580.0001991, 2011
RH (%)74.42−0.0363.31−1.600.1421997
SD (h)4.17−0.0120.74−1.300.032-
u2 (m s−1)1.69−0.0010.13−0.220.276-
Annual
T (°C)22.470.0190.355.410.0001999
RH (%)78.48−0.0421.73−3.330.0021987
SD (h)4.99−0.0100.37−2.730.0011973
u2 (m s−1)1.56−0.00020.08−0.380.702-
Note: T is temperature, RH is relative humidity, SD is sunshine duration, u2 is wind speed, slope is trend based on linear regression, Std is standard deviation of linear regression, and Z is Mann–Kendall test statistic.
Table 4. Temporal trend analysis of seasonal ET0 with linear regression and MK analysis.
SeasonMean ValueLinear RegressionMK Test
SlopeStdZp-ValueChange Point (Year)
Spring3.00−0.023922.290.240.8852000
Summer4.320.001318.830.030.9932003
Autumn3.290.100415.920.910.3971990
Winter2.010.082812.971.230.3922002
Annual3.150.160640.580.830.5942003
Note: Slope is trend based on linear regression, Std is standard deviation, and Z is Mann–Kendall test statistic.
Table 5. Relative changes in climate variables for different seasons and their contributions to ET0 change in study area.
SeasonRelative Change Rc (%)Sensitivity Coefficient SxContribution Rate Cx (%)
TRHSDu2ET0TRHSDu2TRHSDu2
Spring4.17−2.93−14.68 1.77−0.270.60−0.830.200.052.512.28−2.880.12
Summer3.49−2.78−9.7313.070.070.73−0.550.350.042.551.40−3.370.73
Autumn6.11−4.61−9.263.952.150.73−0.630.310.134.472.61−2.860.22
Winter10.40−3.15−17.580.923.220.54−0.940.190.155.592.67−3.39−0.22
Annual6.04−3.37−12.814.931.290.65−0.730.260.093.782.24−3.120.21
Disclaimer/Publisher’s Note: The statements, opinions and data contained in all publications are solely those of the individual author(s) and contributor(s) and not of MDPI and/or the editor(s). MDPI and/or the editor(s) disclaim responsibility for any injury to people or property resulting from any ideas, methods, instructions or products referred to in the content.

