
Vision-Based White Radish Phenotypic Trait Measurement with Smartphone Imagery
by
 , , and
L. Minh Dang
1, 
Kyungbok Min
2,
Tan N. Nguyen
3,
Han Yong Park
4,
O New Lee
4,
Hyoung-Kyu Song
1 and
Hyeonjoon Moon
2,* 1
Department of Information and Communication Engineering, and Convergence Engineering for Intelligent Drone, Sejong University, Seoul 05006, Republic of Korea
2
Department of Computer Science and Engineering, Sejong University, Seoul 05006, Republic of Korea
3
Department of Architectural Engineering, Sejong University, 209 Neungdong-ro, Gwangjin-gu, Seoul 05006, Republic of Korea
4
Department of Bioresource Engineering, Sejong University, Seoul 05006, Republic of Korea
*
Author to whom correspondence should be addressed.
Agronomy 2023, 13(6), 1630; https://doi.org/10.3390/agronomy13061630
Submission received: 20 May 2023
/
Revised: 15 June 2023
/
Accepted: 16 June 2023
/
Published: 18 June 2023
(This article belongs to the Section Precision and Digital Agriculture)
Abstract
:White radish is a nutritious and delectable vegetable that is enjoyed globally. Conventional techniques for monitoring radish growth are arduous and time-consuming, encouraging the development of novel methods for quicker measurements and greater sampling density. This research introduces a mathematical model working on high-resolution images to measure radish’s biophysical properties automatically. A color calibration was performed on the dataset using a color checker panel to minimize the impact of varying light conditions on the RGB images. Subsequently, a Mask-RCNN model was trained to effectively segment different components of the radishes. The observations of the segmented results included leaf length, leaf width, root width, root length, leaf length to width, root length to width, root shoulder color, and root peel color. The automated real-life measurements of these observations were then conducted and compared with actual results. The validation results, based on a set of white radish samples, demonstrated the models’ effectiveness in utilizing images for quantifying phenotypic traits. The average accuracy of the automated method was confirmed to be 96.2% when compared to the manual method.
1. Introduction
Radish or daikon (Raphanus sativus L.) is a widely cultivated vegetable across many regions, particularly in Asia, with Korea considering it as their national vegetable [1]. Radishes belong to the Brassicaceae family and are used worldwide for vegetable consumption, animal feed, and oil production. Radish roots, hypocotyl, and green leaves are consumed in various ways, such as raw, pickled, dried, simmered, salad, and even in the traditional Korean dish, kimchi [2]. The morphological and agronomic traits of radishes distinguish them into five main varieties: small European radish, black Spanish radish, East Asian big long radish, Chinese oil radish, and rat tail radish or feed radish [3].
The Korean radish is estimated to have originated from Chinese radish varieties, particularly those found in the southern and northern regions. Over time, Japanese radish varieties were also introduced to Korea, further enriching the radish diversity. Among the preferred radish types in Korea, white radishes with green shoulders, especially those with an egg-shaped appearance, have enjoyed long-standing popularity due to their perceived superior quality, sweetness, and crunchiness. While much of the research conducted in Korea regarding radish and Brassica spp. has focused on cultivation techniques and disease resistance [4], the country has also seen the development of numerous well-known landraces and F1 hybrid cultivars of radish to accommodate different cropping systems and satisfy consumer preferences. It is worth noting that radish seeds hold significant market value in Korea’s vegetable seed industry, with a substantial export volume [5].
Monitoring the progress of crop growth throughout the growing season is of paramount importance in agriculture. On-site observation allows for comprehensive assessment of overall crop conditions, optimal irrigation scheduling, crop growth modeling, and accurate yield predictions [6]. In the case of field-grown radish, regular monitoring of diverse phenotypic characteristics such as root height, leaf height, and root peel color provides valuable insights for farmers to fine-tune inputs such as fertilizers and herbicides, leading to precise yield estimations [7]. Furthermore, understanding genetic variability and heritability is crucial in evaluating the impact of selection. By studying phenotypic traits, researchers gain insights into genotypic variability, enabling them to discern whether observed variations arise from genetic factors or environmental influences. Consequently, it becomes imperative to separate the heritable and non-heritable components of phenotypic variation when making selection decisions [8].
The agricultural sector is increasingly leveraging big data and AI as promising solutions to address critical challenges such as climate change [9], food security, sustainable agriculture [10], and aging populations [11]. To boost the effectiveness of agricultural and breeding practices, there is a growing need to gather extensive phenotype and genotype information through digital breeding innovations. To remain up-to-date with the advancing technology in digital breeding, agriculture must evolve along with it. Digital breeding offers the potential to automate manual cross-breeding processes and replace paper-based record keeping, thereby promoting breeding sustainability [12].
In previous studies, plant monitoring has predominantly relied on either field measurements or airborne/satellite data to effectively cover large areas [13]. The use of airborne/satellite data is particularly important for applications such as disease control and automation, where efficient monitoring of extensive areas is crucial. For example, Dang et al. utilized RGB and near-infrared images collected from unmanned aerial vehicles (UAVs) to train a model for the early detection and treatment of Fusarium wilt in radish [14,15]. The UAV-based detection system, employing CNNs, achieved high accuracy, with a precision rate exceeding 90% and a recall rate surpassing 85%. This highlights the potential of employing UAVs and deep learning (DL) algorithms for automated plant disease detection, resulting in time and labor savings in agriculture. Kim et al. investigated the use of UAV-based RGB imagery to model and assess the growth status of cabbage and white radish. By utilizing a vegetation index derived from the RGB imagery, the study accurately predicted the crops’ growth status across four stages with a high degree of accuracy [6]. Additionally, Barbedo et al. conducted a comprehensive review of UAVs and imaging sensors in plant stress monitoring, emphasizing their advantages such as high-resolution imaging, rapid coverage of large areas, and real-time data capture [16]. The review also discussed challenges associated with UAVs and imaging sensors, including accurate sensor calibration, weather conditions, equipment costs, and other factors influencing data accuracy.
On the one hand, in-field measurements involve manual data collection on crops or soil directly in the field, including parameters such as plant height, leaf area index, and soil moisture [17]. In-field measurements are often considered more accurate than airborne/satellite measurements due to their ability to be tailored to specific needs and collected with high precision. While technologies such as light detection and ranging (LiDAR) or stereovision can measure plant traits without requiring additional tools, the use of a simple smartphone camera offers notable advantages. Smartphones, widely accessible and commonly used, serve as cost-effective and easily adoptable tools for plant monitoring. Leveraging a smartphone’s camera enables researchers to conveniently and swiftly capture images, facilitating the analysis of plant traits and advancing agricultural practices [18]. For example, Coelho et al. examined the resistance of different plant parts of radish to downy mildew, specifically cotyledons, leaves, and roots [19]. Results indicated that cotyledons were the most susceptible, while roots exhibited the highest resistance, with leaves displaying intermediate resistance. In another study, Lee et al. evaluated the genetic diversity of cultivated radishes using agronomic traits and Simple Sequence Repeat (SSR) molecular markers [20]. They collected 18 agronomic traits, such as root length, diameter, and weight, and utilized SSR markers to analyze the genetic diversity among 21 radish cultivars. The findings revealed significant variations in agronomic traits, indicating a high level of genetic diversity among the cultivars. SSR analysis also detected 64 alleles across all cultivars, further highlighting genetic diversity. Additionally, Kumar et al. assessed 40 radish germplasm accessions for various root yield and quality traits, including root weight, length, diameter, total soluble solids (TSS), and total ascorbic acid (TAA) content [21]. Cluster analysis based on these traits classified the germplasm accessions into distinct groups, representing specific genetic lineages. Another study by Kim et al. emphasized the evaluation of phenotypic traits and glucosinolate contents in radish germplasm accessions [7]. They examined 45 accessions, assessing phenotypic traits such as root weight, length, diameter, leaf length, leaf width, and petiole length, alongside glucosinolate contents in the roots. The results revealed significant variations in phenotypic traits and glucosinolate contents, indicating a high level of genetic variability among the accessions.
Taking inspiration from previous research, the primary objective of this research was to establish a framework for extracting phenotypic traits of Korean white radish using smartphone imagery. This framework was specifically designed to quantify several biophysical parameters of the white radish throughout its entire growth cycle. By implementing this approach, it becomes feasible to evaluate the growth status of white radish and incorporate complex traits that were previously unattainable with conventional breeding methods. Consequently, this framework facilitates the expedited and accurate development of new radish varieties. The specific objectives of this research were twofold: (i) to introduce a radish segmentation model trained on the collected images, enabling the differentiation of various parts of the radish, and (ii) to automatically quantify eight distinct phenotypic traits of white radish crops using the predicted masks.
The structure of this manuscript is presented as follows. In Section 2, the radish segmentation dataset collected during this study is introduced. Section 3 outlines the comprehensive framework used for extracting automated phenotypic traits. The individual components of the framework are described in detail in Section 4. The experimental outcomes of the proposed system are presented and evaluated in Section 5. Section 6 discusses the key findings and implications of this study. The paper concludes with Section 7, which provides a summary of the findings and suggests potential directions for future research.
2. Radish Segmentation Dataset
The main objective of this section is to gather and establish a comprehensive database of radish phenotype data to enable the prediction of phenotypic traits based on genetic makeup. The dataset used in this study was acquired using a Samsung Galaxy S22 smartphone, which is equipped with a rear camera featuring a high resolution of 50 megapixels, an aperture of f/1.8, and advanced autofocus capabilities (https://www.gsmarena.com/samsung_galaxy_s22_5g-11253.php, accessed on 19 May 2023). This high-resolution camera ensures accurate data collection during the entire duration of the study conducted in a radish field located in Kyonggi-do, Korea, between September 2022 and February 2023.
To achieve this objective, rigorous measures were implemented to maintain strict control over the radish fields. Drip irrigation was performed, delivering a nutrient solution consisting of nitrogen, potassium, phosphorus, and other essential compounds. These measures aim to minimize the occurrence of abiotic stresses such as nutrient deficiencies and drought, as well as reduce the risk of diseases and pests. Additionally, daily expert/farmer inspections were conducted to prevent the onset of diseases, pests, or other abiotic stresses. For data collection purposes, twenty-four fixed radish cultivars were planted, and the distance between rows of radishes was maintained at 0.4 m.
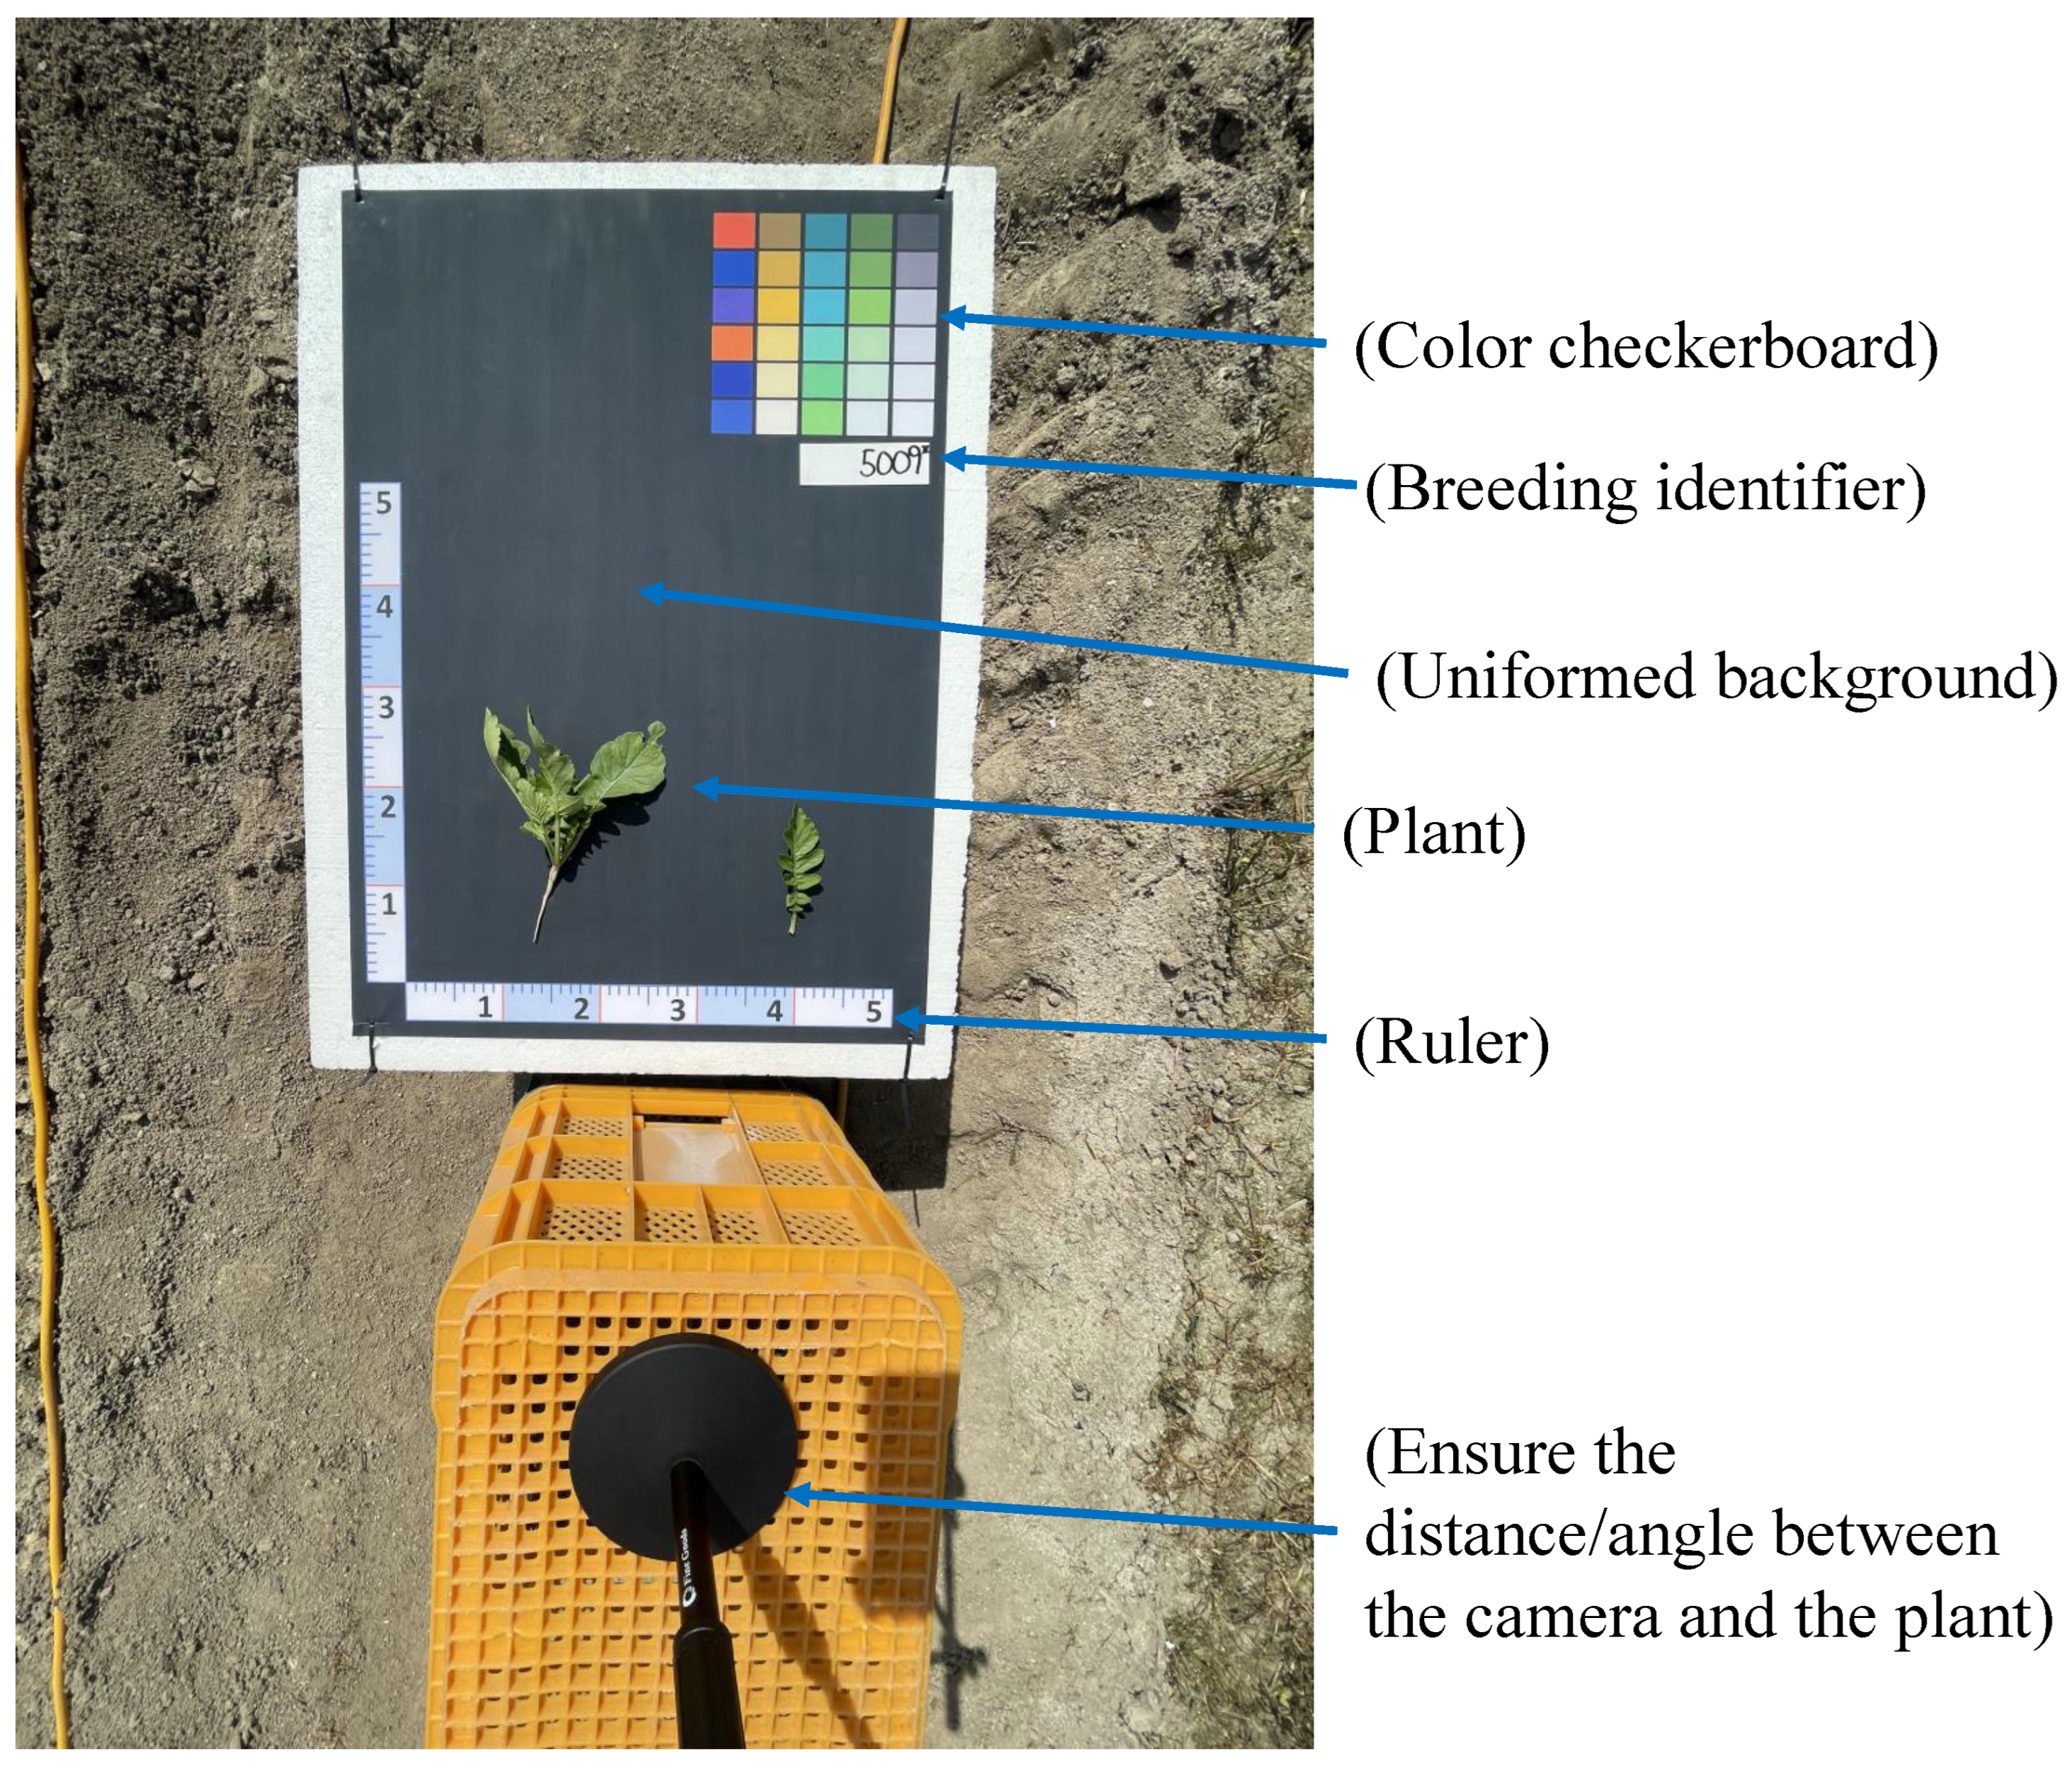
Data collection was conducted within a specific one-hour time frame from 11:30 A.M. to 12:30 P.M., which corresponds to the period of solar noon. To ensure consistent lighting conditions and minimize discrepancies between images, instances when clouds partially blocked the sun were actively avoided. Furthermore, for image calibration purposes, a color checkerboard (https://www.xrite.com/categories/calibration-profiling/colorchecker-classic, accessed on 19 May 2023) was affixed to the board each time an image was captured. This allowed for accurate color representation and calibration across the dataset. Sample images illustrating three stages of radish growth and the number of training and testing images in this study can be seen in Figure 1.
As illustrated in Figure 2, to ensure consistency in the image capture process using the smartphone, a tripod was used to maintain a steady distance and angle between the camera and the test bed. The tripod was positioned at the bottom of the test bed, securely holding the smartphone camera in place. By adhering to this setup throughout the image capture, a standing stick was utilized as a reference point for both distance and angle. This method facilitated standardized and reproducible photos, as the camera and test bed remained in consistent alignment. As a result, this approach minimized variability and enhanced the reliability of the analysis conducted on the captured images.
A total of 1100 high-resolution images were collected for this study. These images were manually annotated to enable the automatic segmentation of two radish components, namely the leaf and root. The dataset consists of two primary features: (i) radish field images captured by smartphones, with a resolution of 4K (), and (ii) the inclusion of a color checkerboard and two rulers placed next to the radish for precise measurement of phenotypic traits.
3. System Overview
The primary processes of the white radish phenotypic trait extraction framework are outlined in Figure 3.
Detailed explanations for each process are provided below.
- Data collection: A systematic approach to capture high-quality images of the radish samples using a smartphone was introduced. This involved securely positioning the smartphone, optimizing camera settings for optimal image quality, and carefully preparing the samples in a controlled environment. By following this systematic approach, we successfully obtained reliable and accurate images that were suitable for further analysis.
- Preprocessing: Since outdoor images can be affected by varying light conditions, causing inconsistency among images captured at different stages of radish development, color calibration was performed to ensure the quality of the collected dataset.
- Radish segmentation: Mask-RCNN, a standard DL-based semantic segmentation model, was trained to learn the radish’s abstract features to segment different components of the radish efficiently. Mask-RCNN extends Faster-RCNN by incorporating an additional branch that predicts the object mask in addition to the existing branches for bounding box and class label prediction. This enables an accurate calculation of the biophysical properties of radish.
- Real-life pixel density calculation: This process provides precise measurements of the radish’s phenotypic traits by detecting the ruler placed next to the radish.
- Phenotypic trait measurement: By leveraging the output masks generated through radish segmentation and the calculated real-life pixel density, the real-life measurements of various radish phenotypic traits, such as width and length, are obtained. The collected results are then imported into a database for future processing and analysis.
4. Methodology
4.1. Preprocessing
Color calibration was conducted on the collected images to mitigate the impact of varying lighting and atmospheric conditions encountered throughout the study. This process involves adjusting the colors on a device, such as a camera or monitor, to ensure accurate and consistent color representation across different devices. One method for achieving color calibration is by utilizing a color checker board, which contains a series of color patches with known color values. By capturing an image of the chart with the device, a comparison can be made between the device’s color response and the known color values of the patches, enabling adjustments to align the device’s colors accordingly.
The color checker equation is a mathematical formula used to calculate the color correction matrix required to adjust the device’s colors and match them with the known values of the color patches on the color checker board. This equation takes into account the device’s spectral sensitivity and the spectral reflectance of the color patches, utilizing linear algebra techniques to solve for the color correction matrix.
where C is the corrected color values, M is the color correction matrix, and R is the measured color values of the color patches on the color checker board. The color correction matrix M can be computed by solving the following equation:
where S is the matrix of the spectral sensitivities of the device, and T is the matrix of the spectral reflectance of the color patches on the color checker board.
4.2. Radish Segmentation
The Mask-RCNN is a DL model widely used for object detection and instance segmentation [22]. It is an extension of Faster-RCNN and includes an additional branch that predicts a pixel-level object mask alongside the existing branch for bounding box recognition. Additionally, Mask-RCNN is easy to train and can be applied to other computer vision tasks. The Mask-RCNN network in this study consists of three main stages, illustrated in Figure 4.
The first component of the network is the backbone, which utilizes a pre-trained ResNet101 model on the ImageNet dataset [23] to capture low-level features from the training images. To represent the target object at multiple scales, a feature pyramid network (FPN) is incorporated. The FPN’s top-level and extracted features are merged through an up-sampling process, enabling each layer to generate its own set of distinct feature maps.
Next, the extracted multi-scale feature maps were passed through a region proposal network (RPN) to generate object proposals. Given that the image size in the collected dataset is , three area-scale anchors (64, 128, and 256) are used, along with aspect ratios of 1:1, 1:2, and 2:1, based on the average radish root and leaf sizes in the dataset. The RPN employs cross-entropy loss to learn and validate the created anchors, while SmoothL1 loss is used to adjust the anchors’ coordinates. The RPN output consists of a set of regions of interest (ROIs) that potentially contain target objects. Each ROI proposed by the RPN includes a set of bounding box coordinates and a confidence score indicating the likelihood of an object being present at that location.
Once the ROIs are proposed, ROI alignment is applied to sample features from the ROIs, aligning them with the ROI’s spatial layout using bilinear interpolation. Finally, the mask head takes each ROI proposed by the RPN and predicts two outputs: a class label and an object mask. The class label is determined by a classification network that generates a probability distribution over a predefined set of classes. The object mask is generated by a segmentation network that predicts a binary mask for the object, indicating which pixels belong to the object and which do not.
4.3. Real-Life Pixel Density Conversion
The objective of this section is to determine the actual width and length of various radish components in real-life units. The accurate calculation of real-life pixel density is achieved by detecting the ruler positioned alongside the radish in the collected dataset. Figure 5 illustrates a series of image processing operations employed to detect the line (ruler) within an input image using the Hough line transform operation and subsequently convert it to pixel density.
To begin with, the images were converted from the RGB color space to the grayscale color space, simplifying the identification of edge features. Subsequently, a Gaussian blur was applied to the grayscale images to achieve image smoothing and eliminate unwanted details that could potentially interfere with line detection. Following this, the Canny edge algorithm, widely recognized for its effectiveness in edge detection, was implemented to extract edges from the blurred grayscale image. Finally, the Hough line transform method was employed to identify and represent the ruler within the edge-detected image as coordinates, indicating the starting and ending points of the detected lines in the image.
4.4. Radish Phenotypic Trait Measurement
The phenotypic traits of radish leaves and roots were assessed at full maturity in the field. A total of two qualitative and four quantitative traits were examined, utilizing modified descriptors sourced from the International Union for the Protection of New Varieties of Plants (UPOV, 2021) (https://www.upov.int/portal/index.html.en, accessed on 19 May 2023). Detailed descriptions for each phenotypic trait can be found in Figure 6a,b.
The six quantitative traits included root length (RL), root width (RW), root length-to-width ratio (RLW), leaf length (LL), leaf width (LW), and leaf length-to-width ratio (LLW). The two qualitative traits were radish root peel color (RPC) and root shoulder color (RSC). Segmented masks were utilized to compute each trait. During the testing process, ten independent biological samples were examined for each trait to characterize both the quantitative and qualitative phenotypic traits using the segmented masks. Most of the quantitative traits, such as RW, LL, and LW, could be calculated using the bounding box coordinates.
However, RL, which can exhibit various shapes due to genetic variation and environmental factors, posed a different challenge. While most radish roots typically follow a straight line, they can become elongated or acquire irregular shapes due to factors such as rocky soil, which causes the roots to grow around obstacles. As a result, Section 4.4.1 presents a novel approach to precisely measure the phenotypic traits of the radish root.
4.4.1. Root Length Measurement
Figure 7 depicts a radish root with a c-shape, exhibiting an irregularity that prevents the computation of RL using the bounding box method. To address this challenge, this study proposes the utilization of medial skeletonization on the segmented mask, enabling precise computation of the RL.
The skeletonization process involves iteratively thinning the object or shape until only a one-pixel-wide skeleton remains, thereby simplifying the representation while preserving the key features and structure [24]. One commonly used method is the medial axis transform, which computes the centerline of the object and generates a skeleton that represents its main axis of symmetry [25]. In Figure 7, the skeleton output of the medial axis skeletonization method is demonstrated for the c-shaped radish root input. The resulting output from the medial axis algorithm is a binary image where pixels on the skeleton are assigned a value of 1, while all other pixels are set to 0.
Based on prior research [26,27], once the root skeleton was extracted, the RL can be determined using the following formula.
where the finite length of is represented by , and C denotes the geometric calibration factor. Initially, C was introduced as a calibration parameter for the pixel displacements in the mask outputs. However, as the dataset used in this study exhibited no geometric distortion, C was set to 1. Therefore, the summation of the total pixels along the skeleton directly facilitated the calculation of .
4.4.2. Color Measurement
The establishment of the color ranges for radish root peel involved referencing the typical colors observed in radishes. According to [7], radish cultivars display a wide range of root shoulder colors, including green, with the green shoulder color being exclusive to certain cultivars. While most cultivars exhibit a white root peel color, a subset of cultivars display two additional colors: bronze-green and red. As a result, a total of four RPC categories, namely bronze-green, green, red, and white, were recommended based on the observed color ranges of radish root peel.
In this study, color identification was performed by analyzing radish images and selecting the color ranges that most accurately represented the root colors. These ranges were defined in the hue, saturation, and value (HSV) color space. The HSV color space was chosen over RGB for color detection tasks due to its ability to separate color information from brightness or luminance information, providing a more intuitive framework [28]. Further details on the root color recognition process can be found in Figure 8.
The assignment of radish RSC and RPC peel colors into one of four categories was accomplished by defining color ranges in the HSV color space. The specific ranges were determined as follows:
- Bronze-green: [25, 50, 50] to [45, 255, 255];
- Green: [45, 50, 50] to [90, 255, 255];
- Pink: [0, 50, 50] to [10, 255, 255];
- White: [0, 0, 150] to [180, 50, 255].
These ranges were applied to generate binary masks for each color category, enabling the identification of the largest contour within each mask. Subsequently, the mean hue value of the contour was calculated. This mean hue value served as the basis for categorize the radish RSC and RPC into one of the four color categories: bronze-green, green, red, or white.
4.4.3. Implementation Descriptions
The automated framework for phenotypic trait measurement was developed using MMdetection (https://mmdetection.readthedocs.io/en/latest/, accessed on 19 May 2023), an open-source object detection framework that is built on top of PyTorch. To ensure reliable experiments, a pre-trained ResNet-101 model on ImageNet was used as the backbone for the model. The training and testing processes were deployed on an Nvidia Tesla V100 GPU 32 GB. In addition, this study used PlantCV (https://plantcv.readthedocs.io/en/stable/, accessed on 19 May 2023), an open-source software package for plant image analysis that supports a range of tasks, including image processing, feature extraction, and data analysis.
The number of classes was set to 3, including radish root, leaf, and background classes. The ROI head used a two-layer multi-layer perceptron (MLP) with 1024 hidden units and a single-scale ROI pooling operation. Meanwhile, the mask head employed a two-layer MLP with 256 hidden units and a bilinear interpolation operation. The model utilized an Adam optimizer with a learning rate of 0.02, a momentum of 0.9, and a weight decay of 0.0001. During the testing process, a non-maximum suppression (NMS) with a mask threshold of 0.5 was applied to the model.
4.4.4. Evaluation Metrics
This study considers mean average precision (mAP) as the primary evaluation metric to assess the performance of the segmentation model. The mAP is calculated by averaging the average precision (AP) values, where AP is derived from plotting the precision–recall curve (PR curve) for each object class. The PR curve illustrates the trade-off between precision and recall, and the area under the curve corresponds to the AP value, ranging from 0 to 1. The mAP serves as a comprehensive metric that offers an overall evaluation of the model’s performance across all object classes. It can be mathematically expressed as
where K is the number of classes.
To evaluate the model’s ability to predict various phenotypic traits of the radish, mean absolute error (MAE) and mean absolute percentage error (MAPE) are utilized. MAE measures the average absolute difference between the predicted values and the actual values. It provides a numerical value that represents the magnitude of the errors made by the model. A lower MAE indicates better performance, as it signifies a smaller average discrepancy between the predicted and actual values.
On the other hand, MAPE calculates the average percentage difference between the predicted values and the actual values. It expresses the errors as a percentage of the actual values, providing a relative measure of the model’s performance. MAPE is particularly useful when the scale or magnitude of the data varies significantly across different samples. Like MAE, a lower MAPE indicates better performance, with smaller percentage errors between the predicted and actual values. The equations for MAE and MAPE are defined as follows.
where N represents the number of traits, indicates the GT trait value, and is the predicted trait value. The absolute value is used to ensure that the errors are positive values.
5. Experimental Results
This section presents a series of experiments conducted on the collected dataset to evaluate the effectiveness of different components within the phenotypic trait measurement framework. Section 5.1 highlights the impact of color correction on images captured by smartphones and demonstrates its effectiveness. Section 5.2 assesses the performance of the Mask-RCNN segmentation model on the preprocessed radish dataset. Lastly, Section 5.3 compares the performance of the phenotypic trait measurement with actual measurements, providing a comprehensive evaluation of the framework’s effectiveness.
5.1. Preprocessing
Color correction is an essential image processing method that plays a crucial role in enhancing the naturalness, accuracy, and visual appeal of colors in an image, particularly when extracting color phenotypic traits from radish roots. Its primary goal is to ensure that the captured colors align with their real-life counterparts. In an ideal scenario, the RGB values of color patches in both the target image (captured under controlled conditions) and the source image (captured outdoors) should exhibit a linear relationship. However, images taken outdoors can be influenced by ever-changing lighting conditions, causing deviations from this linear trend.
To illustrate this, Figure 9 presents a comparison of color check matrices between the source image and the target image. The matrices plot the average values for the red, green, and blue channels of each color patch in both images. As indicated by the red arrows, certain problematic patches in the source image deviate from the linear trend line across all color channels (R, G, and B). This observation underscores the importance of the color correction process in achieving accurate and reliable results.
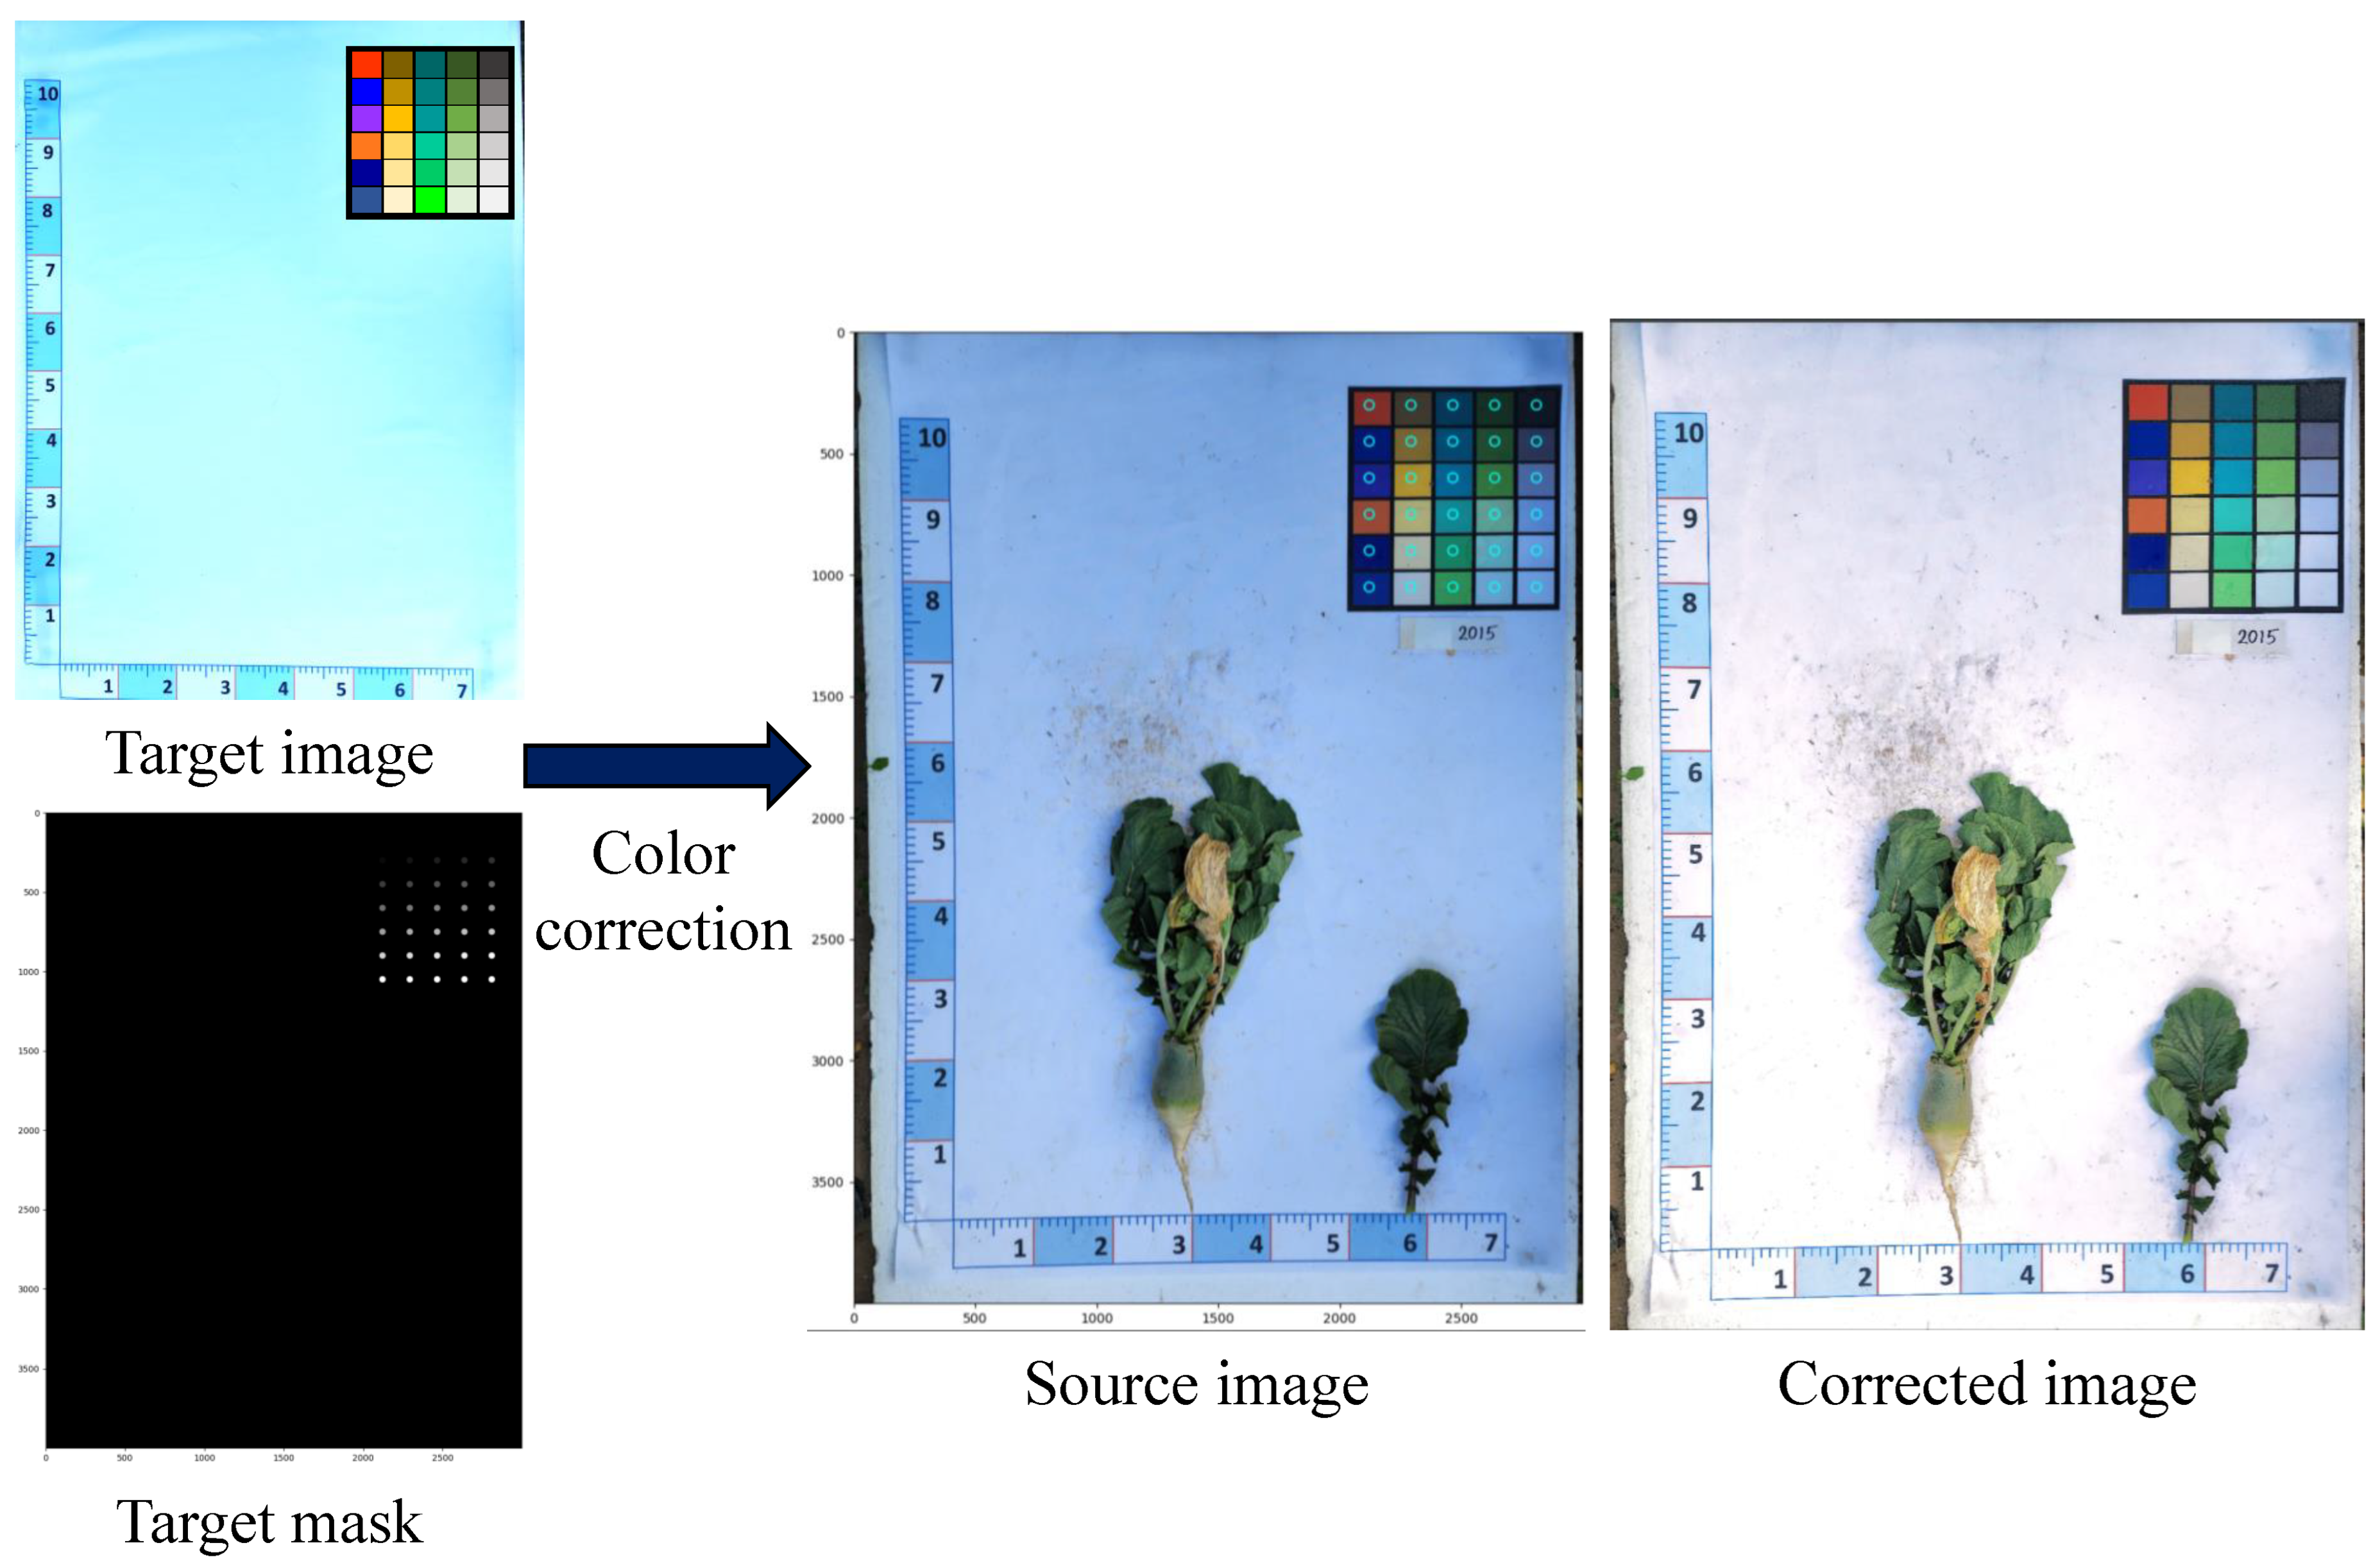
Figure 10 demonstrates a sample output of the color correction process applied to the source image. The process involved several steps. Firstly, the target mask and the source mask, which indicate the location of the color checker in the target and source images, respectively, were extracted. Next, the color space from both the target and source images was extracted using the detected color checker. Finally, the color space of the source image was converted to match the preferred color space of the target image.
The corrected image showcases noticeable improvements, displaying accurate and consistent colors in comparison to the original source image. The color correction process successfully aligns the colors with the target image, resulting in enhanced color fidelity and overall visual appeal.
5.2. Mask-RCNN Performance Evaluations
In this section, the Mask-RCNN model with the ResNet101 backbone was trained and evaluated using the proposed dataset after the implementation of the color correction process. The effectiveness of the training process and the convergence of the Mask-RCNN model can be observed in Figure 11, which presents the training loss mask and validation mAP results.
During training, the training loss mask steadily decreases and reaches a significant reduction to approximately 0.1 after 500 iterations. It continues to converge steadily, maintaining a loss of less than 0.1 by the end of the training process (iteration 3500). This reduction in training loss indicates the model’s ability to learn and adapt to the dataset. The validation mAP, which serves as an indicator of the model’s performance, shows promising results. It quickly increases to over 0.75 after only five epochs and continues to improve, reaching a peak value of 0.87 at epoch 25. This demonstrates the model’s ability to accurately segment radish images and its capacity for generalization across the dataset. Overall, the Mask-RCNN model exhibits strong generalization capabilities, consistently producing robust segmentation results for radish phenotypic traits.
To rigorously evaluate the segmentation performance of the Mask-RCNN model, three latest segmentation algorithms, namely BlendMask [29], BoxInst [30], and CondInst [31], were trained and compared with the Mask-RCNN model. Quantitative evaluation metrics including mask AP and inference speed were computed. The results are summarized in Table 1, with the optimal values for each metric on the collected radish dataset highlighted in bold font.
Table 1 highlights the segmentation performance of various algorithms, with Mask-RCNN and CondInst achieving the highest mask AP scores of 87% and 86%, respectively, demonstrating their superior performance in segmenting radish instances. In terms of inference time, BoxInst demonstrated the fastest speed, achieving 10 FPS, closely followed by Mask-RCNN and CondInst with 11 FPS. BlendMask exhibited a slightly longer inference time of 13 FPS. Overall, Mask-RCNN emerges as the top performer in terms of AP, while BoxInst showcases the best inference speed among the evaluated models. These results provide valuable insights into the strengths and capabilities of each algorithm in the context of radish segmentation.
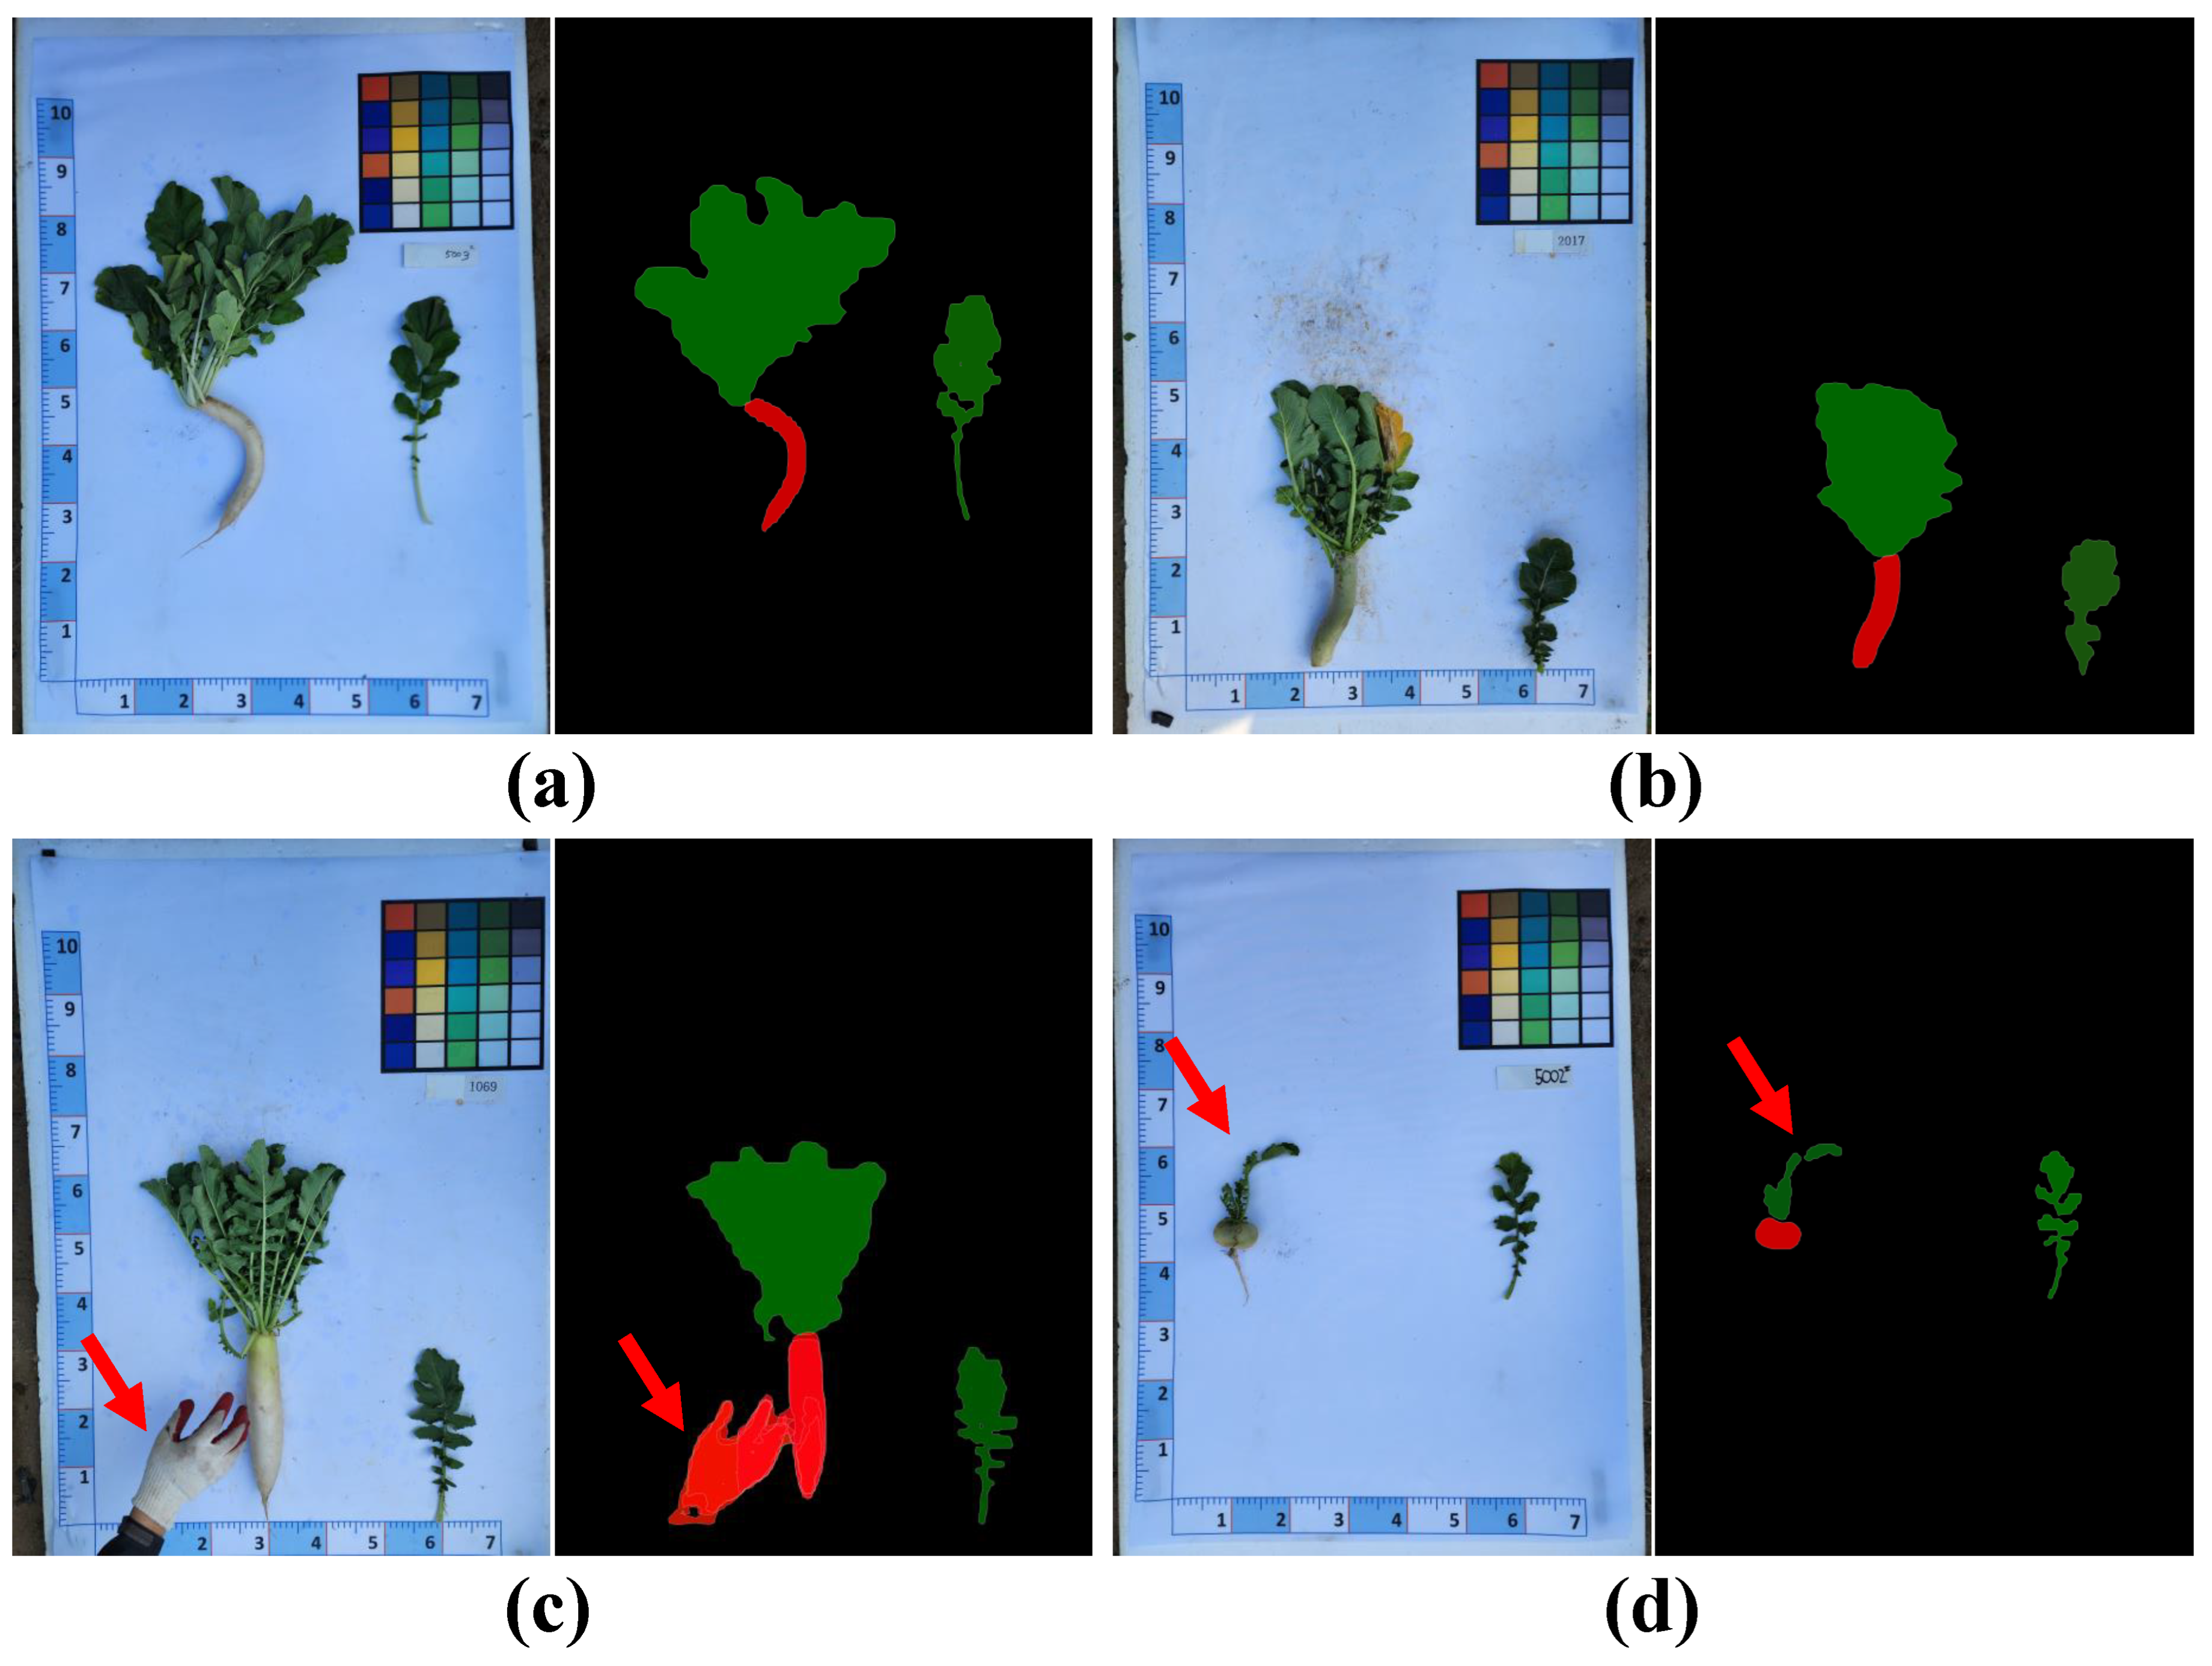
Figure 12 demonstrates the predicted masks generated by the Mask-RCNN model for four different scenarios. In general, Figure 12a,b demonstrate the model’s accurate localization of both the leaf and root parts, even in challenging cases. In Figure 12a, where the radish root is thin and exhibits a reverse C-shape, the model successfully captures the distinct features of the root region. Similarly, Figure 12b shows the model’s ability to differentiate between the radish root and the leaf region, despite the peel color of the root resembling that of the leaf. These results confirm the robustness of the proposed model in effectively detecting specific defects under diverse and challenging conditions.
However, there are instances, as depicted in Figure 12c,d, where the model encounters difficulties and incorrectly segments certain regions. For instance, in Figure 12c, the presence of a glove with a color similar to that of the radish root peel confuses the model, leading to its incorrect identification as part of the radish region. In Figure 12d, the small and thin radish leaf region results in the model generating two separate segments, affecting the accuracy of the overall segmentation. These examples highlight both the strengths and limitations of the proposed model, demonstrating its proficiency in challenging scenarios while acknowledging certain cases where further improvements are necessary.
5.3. Phenotypic Trait Measurement
Table 2 presents the results of the phenotypic trait measurement conducted on ten radish samples using the proposed framework. The measured traits include RL, RW, LL, LW, RLW, LLW, RPC, and RSC. For each sample, the table displays the ground truth (GT) values, which were obtained through accurate manual measurements using a tape measure. The tape measure ensured precise and consistent measurements across different parts of the radish. Additionally, the table showcases the predicted values (Pre) generated by the proposed framework. To evaluate the accuracy of the predictions, the RLW and LLW values were used as indicators. These ratios provide insights into the proportions and shape of the radish root and leaf, respectively. By comparing the predicted values to the GT values, the accuracy of the framework’s predictions for each sample can be determined.
The first section of the table provides the GT values for each phenotypic trait of every sample. For example, sample S1 has GT values of 24.5 mm for RL, 7 mm for RW, and 3.5 for RLW. The GT values for the remaining phenotypic traits are similarly listed for all samples. The second section of the table displays the predicted values for each phenotypic trait of each sample. It is evident that the predicted measurements align closely with the GT measurements. Notably, the framework accurately predicts the RSC and RPC traits, matching the GT values.
To evaluate the accuracy of the predictions, the following formula is applied: the absolute difference between the predicted and GT values is divided by the GT value, and the result is multiplied by 100. For instance, sample S1 achieves an accuracy of 99.7%, indicating a highly accurate prediction closely resembling the GT value. Overall, the accuracy of the predictions ranges from 82% to 100%, demonstrating the effectiveness of the proposed measurement approach in detecting phenotypic traits in radish samples. In addition, the small MAE and MAPE results demonstrate that the proposed framework achieves high accuracy and precise measurements of the phenotypic traits of radish samples. These results indicate the effectiveness and reliability of the framework in detecting and quantifying important traits for plant breeding programs and genetic studies.
6. Discussion
Previous studies have primarily relied on manual methods to measure phenotypic traits, which are prone to errors and time-consuming. This study aimed to address these limitations by developing a vision-based phenotypic trait measurement framework for radishes. Our main finding is that the proposed framework can automatically and accurately measure the phenotypic traits of radish roots and leaves.
To provide a broader context, we compared our results with relevant findings from other papers in the field. For example, Falk et al. reported phenotypic trait measurements in pixels, which can be challenging for end-users to comprehend [32]. In contrast, our study successfully addressed this issue by converting pixel measurements into real-world values through the detection of a ruler placed in the image (Section 4.3). This approach not only simplifies the interpretation of the results but also facilitates the construction of a phenotypic trait database for radishes [33].
In addition to addressing the measurement units, our study introduces several novel methodologies that contribute to the field of phenotyping. Firstly, we emphasized the importance of a pre-processing module (described in Section 4.1) for datasets captured outdoors. This module includes color calibration to correct the color variations, which is particularly critical as incorrect color representation can significantly impact traits such as RPC and RSC. Although this module requires additional computational power and time, it can be selectively enabled or disabled based on the specific application’s requirements.
Furthermore, we proposed a new approach for calculating RL based on the skeletonization method (Section 4.4.1). This approach addresses the challenge posed by radishes having various root shapes, making it difficult for experts to measure RL accurately using a standard ruler. By computing the RL based on the extracted skeleton of a root, our approach provides a robust solution applicable to fruits and plants with diverse shapes.
Regarding the impact of our proposed methodology on breeders, we envision several significant contributions. The automation and accuracy provided by our vision-based framework significantly reduce the reliance on manual measurements, which are not only prone to errors but also time-consuming. By streamlining the phenotypic trait measurement process, breeders can save valuable time and resources, enabling them to analyze larger populations of radishes more efficiently. The availability of accurate and comprehensive phenotypic data further empowers breeders in their selection and breeding processes, leading to improved crop yield, quality, and overall breeding progress.
7. Conclusions and Future Works
This study introduces an end-to-end radish phenotypic trait measurement framework tailored for automated breeding selection applications. A comprehensive dataset of 1100 high-resolution images, covering three stages of radish growth, was collected and utilized for accurate phenotypic trait analysis.
The framework incorporates several crucial steps. Firstly, a color calibration technique was applied to ensure consistent and accurate color representation across all images. Subsequently, four well-known segmentation models, namely CondIns, BoxIns, BlendMask, and Mask-RCNN, were trained on the dataset to evaluate their performance in segmenting radish components. The experimental results highlighted the robustness of the MaskRCNN-based model, which achieved an average validation mAP of 87% in accurately segmenting the two different radish components. Additionally, the study showcased the effectiveness of a skeletonization algorithm in addressing the challenge posed by the various shapes of radish roots by extracting their skeletons. Furthermore, the proposed framework successfully measured eight radish phenotypic traits with precision in real-life scenarios.
While the focus of this study was specifically on radish phenotypic trait measurement, the framework can be readily extended to other plant species such as cucumber and pumpkin, given appropriate adjustments in settings and sufficient segmentation data. It would also be worthwhile to propose a standardized measurement approach for radish phenotypic traits, facilitating consistent analysis of output measurements across studies. However, it is important to note that the current framework does not support real-time phenotypic trait measurement due to its complexity. Hence, future work should prioritize optimizing the framework for robustness and time efficiency to enable real-time measurement capabilities. In addition, methods, such as using a contour-based or boundary refinement technique, could be beneficial for accurately estimating radish root width in cases of irregular shapes. By capturing the root’s actual boundary and considering its curvature, a more precise measurement of root width can be obtained.
Author Contributions
Conceptualization, H.Y.P. and K.M.; methodology, L.M.D.; validation, K.M. and O.N.L.; data curation, L.M.D. and H.Y.P.; writing—original draft preparation, L.M.D.; writing—review and editing, T.N.N.; visualization, O.N.L.; supervision, H.M. and H.-K.S.; funding acquisition, H.Y.P. and H.M. All authors have read and agreed to the published version of the manuscript.
Funding
This work was supported by Basic Science Research Program through the National Research Foundation of Korea (NRF) funded by the Ministry of Education (2020R1A6A1A03038540) and by the Korean Institute of Planning and Evaluation for Technology in Food, Agriculture, Forestry and Fisheries(IPET) through Digital Breeding Transformation Technology Development Program, funded by Ministry of Agriculture, Food and Rural Affairs (MAFRA) (322063-03-1-SB010) and by the Institute of Information and Communications Technology Planning and Evaluation (IITP) grant funded by the Korea government (MSIT) (No. 2022-0-00106, Development of explainable AI-based diagnosis and analysis frame work using energy demand big data in multiple domains).
Data Availability Statement
Data available on request due to restrictions, e.g., privacy or ethical.
Conflicts of Interest
The authors declare no conflict of interest.
Abbreviations
The following abbreviations are used in this manuscript:
| RGB | Red green blue color channel |
| RCNN | Region-based Convolutional Neural Network |
| UAVs | Unmanned aerial vehicles |
| SSR | Simple sequence repeat |
| TSS | Total soluble solids |
| FPN | Feature pyramid network |
| RPN | Region proposal network |
| RL | Root length |
| RW | Root width |
| LLW | Leaf length-to-width ratio |
| RLW | Root length-to-width ratio |
| LL | Leaf length |
| LW | Leaf width |
| RSC | root shoulder color |
| RPC | root peel color |
| HSV | Hue, saturation, and value |
| PR curve | Precision–recall curve |
| MLP | Multi-layer perceptron |
| NMS | non-maximum suppression |
| ROIs | Regions of interest |
| TAA | Total ascorbic acid |
| CNNs | Convolutional neural networks |
References
- Ha, J.G.; Moon, H.; Kwak, J.T.; Hassan, S.I.; Dang, M.; Lee, O.N.; Park, H.Y. Deep convolutional neural network for classifying Fusarium wilt of radish from unmanned aerial vehicles. J. Appl. Remote Sens. 2017, 11, 042621. [Google Scholar] [CrossRef]
- Cho, W.K. A historical study of Korean traditional radish kimchi. J. Korean Soc. Food Cult. 2010, 25, 428–455. [Google Scholar]
- Curtis, I.S. Genetic engineering of radish: Current achievements and future goals. Plant Cell Rep. 2011, 30, 733–744. [Google Scholar] [CrossRef]
- Park, C.H.; Ki, W.; Kim, N.S.; Park, S.Y.; Kim, J.K.; Park, S.U. Metabolic profiling of white and green radish cultivars (Raphanus sativus). Horticulturae 2022, 8, 310. [Google Scholar] [CrossRef]
- Shin, W.S. Current status of global seed industry and role of golden seed project in Korea. J. Plant Biotechnol. 2015, 42, 71–76. [Google Scholar] [CrossRef]
- Kim, D.W.; Yun, H.S.; Jeong, S.J.; Kwon, Y.S.; Kim, S.G.; Lee, W.S.; Kim, H.J. Modeling and testing of growth status for Chinese cabbage and white radish with UAV-based RGB imagery. Remote Sens. 2018, 10, 563. [Google Scholar] [CrossRef] [Green Version]
- Kim, B.; Hur, O.; Lee, J.E.; Assefa, A.D.; Ko, H.C.; Chung, Y.J.; Rhee, J.h.; Hahn, B.S. Characterization of Phenotypic Traits and Evaluation of Glucosinolate Contents in Radish Germplasms (Raphanus sativus L.). Korean J. Plant Resour. 2021, 34, 575–599. [Google Scholar]
- Yu, X.; Choi, S.R.; Chhapekar, S.S.; Lu, L.; Ma, Y.; Lee, J.Y.; Hong, S.; Kim, Y.Y.; Oh, S.H.; Lim, Y.P. Genetic and physiological analyses of root cracking in radish (Raphanus sativus L.). Theor. Appl. Genet. 2019, 132, 3425–3437. [Google Scholar] [CrossRef] [PubMed]
- Dang, L.M.; Lee, S.; Li, Y.; Oh, C.; Nguyen, T.N.; Song, H.K.; Moon, H. Daily and seasonal heat usage patterns analysis in heat networks. Sci. Rep. 2022, 12, 9165. [Google Scholar] [CrossRef]
- Nguyen, T.K.; Dang, L.M.; Song, H.K.; Moon, H.; Lee, S.J.; Lim, J.H. Wild Chrysanthemums Core Collection: Studies on Leaf Identification. Horticulturae 2022, 8, 839. [Google Scholar] [CrossRef]
- Qazi, S.; Khawaja, B.A.; Farooq, Q.U. IoT-equipped and AI-enabled next generation smart agriculture: A critical review, current challenges and future trends. IEEE Access 2022, 10, 21219–21235. [Google Scholar] [CrossRef]
- Singh, B.K. Radish (Raphanus sativus L.): Breeding for higher yield, better quality and wider adaptability. Adv. Plant Breed. Strateg. Veg. Crop. 2021, 8, 275–304. [Google Scholar]
- Xie, C.; Yang, C. A review on plant high-throughput phenotyping traits using UAV-based sensors. Comput. Electron. Agric. 2020, 178, 105731. [Google Scholar] [CrossRef]
- Dang, L.M.; Wang, H.; Li, Y.; Min, K.; Kwak, J.T.; Lee, O.N.; Park, H.; Moon, H. Fusarium wilt of radish detection using RGB and near infrared images from Unmanned Aerial Vehicles. Remote Sens. 2020, 12, 2863. [Google Scholar] [CrossRef]
- Dang, L.M.; Hassan, S.I.; Suhyeon, I.; kumar Sangaiah, A.; Mehmood, I.; Rho, S.; Seo, S.; Moon, H. UAV based wilt detection system via convolutional neural networks. Sustain. Comput. Inform. Syst. 2020, 28, 100250. [Google Scholar] [CrossRef] [Green Version]
- Barbedo, J.G.A. A review on the use of unmanned aerial vehicles and imaging sensors for monitoring and assessing plant stresses. Drones 2019, 3, 40. [Google Scholar] [CrossRef] [Green Version]
- Kolhar, S.; Jagtap, J. Plant trait estimation and classification studies in plant phenotyping using machine vision–A review. Inf. Process. Agric. 2023, 10, 114–135. [Google Scholar] [CrossRef]
- Dalsgaard, B.; Maruyama, P.K.; Sonne, J.; Hansen, K.; Zanata, T.B.; Abrahamczyk, S.; Alarcón, R.; Araujo, A.C.; Araújo, F.P.; Buzato, S.; et al. The influence of biogeographical and evolutionary histories on morphological trait-matching and resource specialization in mutualistic hummingbird–plant networks. Funct. Ecol. 2021, 35, 1120–1133. [Google Scholar] [CrossRef]
- Coelho, P.S.; Valério, L.; Monteiro, A.A. Comparing cotyledon, leaf and root resistance to downy mildew in radish (Raphanus sativus L.). Euphytica 2022, 218, 84. [Google Scholar] [CrossRef]
- Lee, O.N.; Park, H.Y. Assessment of genetic diversity in cultivated radishes (Raphanus sativus) by agronomic traits and SSR markers. Sci. Hortic. 2017, 223, 19–30. [Google Scholar] [CrossRef]
- Kumar, R.; Sharma, R.; Gupta, R.; Singh, M. Determination of genetic variability and divergence for root yield and quality characters in temperate radishes. Int. J. Veg. Sci. 2012, 18, 307–318. [Google Scholar] [CrossRef]
- He, K.; Gkioxari, G.; Dollár, P.; Girshick, R. Mask r-cnn. In Proceedings of the IEEE International Conference on Computer Vision, Venice, Italy, 22–29 October 2017; pp. 2961–2969. [Google Scholar]
- Deng, J.; Dong, W.; Socher, R.; Li, L.J.; Li, K.; Fei-Fei, L. Imagenet: A large-scale hierarchical image database. In Proceedings of the 2009 IEEE Conference on Computer Vision and Pattern Recognition, Miami, FL, USA, 20–25 June 2009; pp. 248–255. [Google Scholar]
- Saha, P.K.; Borgefors, G.; di Baja, G.S. A survey on skeletonization algorithms and their applications. Pattern Recognit. Lett. 2016, 76, 3–12. [Google Scholar] [CrossRef]
- Cappetti, N.; Pierri, S.; Fontana, C. Skeleton and Medial Axis Functions Evaluation of Voxel Discretized Geometries. In Proceedings of the Advances on Mechanics, Design Engineering and Manufacturing IV: Proceedings of the International Joint Conference on Mechanics, Design Engineering & Advanced Manufacturing, JCM 2022, Ischia, Italy, 1–3 June 2022; Springer International Publishing: Berlin/Heidelberg, Germany, 2022; pp. 204–216. [Google Scholar]
- Dang, L.M.; Wang, H.; Li, Y.; Park, Y.; Oh, C.; Nguyen, T.N.; Moon, H. Automatic tunnel lining crack evaluation and measurement using deep learning. Tunn. Undergr. Space Technol. 2022, 124, 104472. [Google Scholar] [CrossRef]
- Yang, X.; Li, H.; Yu, Y.; Luo, X.; Huang, T.; Yang, X. Automatic pixel-level crack detection and measurement using fully convolutional network. Comput.-Aided Civ. Infrastruct. Eng. 2018, 33, 1090–1109. [Google Scholar] [CrossRef]
- Ajmal, A.; Hollitt, C.; Frean, M.; Al-Sahaf, H. A comparison of RGB and HSV colour spaces for visual attention models. In Proceedings of the 2018 International Conference on Image and Vision Computing New Zealand (IVCNZ), Auckland, New Zealand, 19–21 November 2018; pp. 1–6. [Google Scholar]
- Chen, H.; Sun, K.; Tian, Z.; Shen, C.; Huang, Y.; Yan, Y. Blendmask: Top-down meets bottom-up for instance segmentation. In Proceedings of the IEEE/CVF Conference on Computer Vision and Pattern Recognition, Seattle, WA, USA, 14–19 June 2020; pp. 8573–8581. [Google Scholar]
- Tian, Z.; Shen, C.; Wang, X.; Chen, H. Boxinst: High-performance instance segmentation with box annotations. In Proceedings of the IEEE/CVF Conference on Computer Vision and Pattern Recognition, Nashville, TN, USA, 19–25 June 2021; pp. 5443–5452. [Google Scholar]
- Tian, Z.; Shen, C.; Chen, H. Conditional convolutions for instance segmentation. In Proceedings of the Computer Vision–ECCV 2020: 16th European Conference, Glasgow, UK, 23–28 August 2020; Proceedings, Part I 16. Springer International Publishing: Berlin/Heidelberg, Germany, 2020; pp. 282–298. [Google Scholar]
- Falk, K.G.; Jubery, T.Z.; Mirnezami, S.V.; Parmley, K.A.; Sarkar, S.; Singh, A.; Ganapathysubramanian, B.; Singh, A.K. Computer vision and machine learning enabled soybean root phenotyping pipeline. Plant Methods 2020, 16, 1–19. [Google Scholar] [CrossRef] [Green Version]
- Tan, N.; Nguyen, H.; Lee, J. A novel data-driven nonlinear solver for solid mechanics using time series forecasting. Finite Elem. Anal. Des. 2022, 171, 103377. [Google Scholar]
Figure 1.
Sample images illustrating three different stages of radish growth, accompanied by a description of the number of training and testing images collected for each respective stage.
Figure 1.
Sample images illustrating three different stages of radish growth, accompanied by a description of the number of training and testing images collected for each respective stage.

Figure 2.
Illustration of the data collection process using a smartphone.

Figure 3.
Detailed description of the proposed phenotypic trait measurement framework for images collected by smartphones.
Figure 3.
Detailed description of the proposed phenotypic trait measurement framework for images collected by smartphones.

Figure 4.
Full architecture of the radish segmentation system based on the Mask-RCNN model.

Figure 5.
Four main steps of the real-pixel density conversion process based on ruler detection. Note: [XX] indicates any numerical value.
Figure 5.
Four main steps of the real-pixel density conversion process based on ruler detection. Note: [XX] indicates any numerical value.

Figure 6.
Depiction of the six phenotypic traits of radishes that are considered in this study.

Figure 7.
Root length measurement process based on the medial axis skeletonization algorithm.

Figure 8.
Root color recognition process based on the HSV color channel.

Figure 9.
Comparison of the R, G, B color channels between the source image and the target image.

Figure 10.
Example of the color correction process, which takes the source image and target image as input and outputs the color-corrected image.
Figure 10.
Example of the color correction process, which takes the source image and target image as input and outputs the color-corrected image.

Figure 11.
Training loss and validation mAP curves of the Mask-RCNN model using the ResNet101+FPN backbone network.
Figure 11.
Training loss and validation mAP curves of the Mask-RCNN model using the ResNet101+FPN backbone network.

Figure 12.
Radish segmentation outputs of the Mask-RCNN model for challenging cases. (a,b) demonstrate the model’s accurate segmentation of radish components in challenging scenarios, while (c,d) illustrate instances where the models incorrectly segmented certain regions of the radish due to noise.
Figure 12.
Radish segmentation outputs of the Mask-RCNN model for challenging cases. (a,b) demonstrate the model’s accurate segmentation of radish components in challenging scenarios, while (c,d) illustrate instances where the models incorrectly segmented certain regions of the radish due to noise.


Table 1.
Comparison of different segmentation algorithms on the collected radish dataset.
| Model | Mask AP (%) | Inference Time (FPS) |
|---|---|---|
| CondInst [31] | 86 | 11 |
| BoxInst [30] | 81 | 10 |
| BlendMask [29] | 85 | 13 |
| Mask-RCNN | 87 | 11 |
The optimal values for each metric are highlighted in bold font.
Table 2.
Comparison between the GT and the prediction phenotypic traits measurement for ten radish samples.
Table 2.
Comparison between the GT and the prediction phenotypic traits measurement for ten radish samples.
| Sample | |||||||||||
|---|---|---|---|---|---|---|---|---|---|---|---|
| S1 | S2 | S3 | S4 | S5 | S6 | S7 | S8 | S9 | S10 | ||
| GT | RL | 24.5 | 11.1 | 6 | 30 | 14 | 14 | 23 | 18.7 | 16.2 | 23 |
| RW | 7 | 7 | 8 | 6 | 7 | 4.3 | 8.9 | 8 | 8.3 | 8.8 | |
| RLW | 3.5 | 1.6 | 0.7 | 5 | 2 | 3.2 | 2.6 | 2.3 | 1.9 | 2.6 | |
| LL | 39.2 | 29 | 50.8 | 43 | 34.3 | 29.3 | 45 | 33.4 | 29.4 | 45 | |
| LW | 47 | 20.5 | 37.7 | 46 | 26 | 19 | 34 | 37.6 | 25.1 | 44 | |
| LLW | 0.8 | 1.4 | 1.3 | 0.9 | 1.3 | 1.5 | 1.3 | 0.8 | 1.1 | 1 | |
| RSC | BG | G | G | G | G | BG | BG | G | R | G | |
| RPC | W | W | W | W | BG | BG | W | W | R | W | |
| Pre | RL | 24 | 10 | 6 | 14 | 14.6 | 14 | 23 | 19 | 17 | 23 |
| RW | 7 | 7 | 8 | 5 | 7 | 4.9 | 9 | 8 | 8 | 8 | |
| RLW | 3.4 | 1.4 | 0.7 | 2.8 | 2 | 2.8 | 2.5 | 2.4 | 2.1 | 2.9 | |
| LL | 40 | 28 | 50 | 43 | 34 | 30 | 45 | 34 | 29 | 46 | |
| LW | 48 | 21 | 37 | 45 | 25 | 21 | 34 | 38 | 26 | 44 | |
| LLW | 0.8 | 1.3 | 1.3 | 0.9 | 1.3 | 1.4 | 1.3 | 0.8 | 1.1 | 1 | |
| RSC | BG | G | G | G | G | BG | BG | G | R | G | |
| RPC | W | W | W | W | BG | BG | W | W | R | W | |
| Accuracy (%) | 99.7 | 98.6 | 100 | 82 | 100 | 93.7 | 96.1 | 97.4 | 99 | 96.1 | |
| MAE | 0.57 | 0.65 | 0.37 | 4.5 | 0.47 | 0.82 | 0.02 | 0.32 | 0.6 | 0.45 | |
| MAPE (%) | 1.55 | 3.73 | 0.85 | 18.01 | 2.22 | 6.7 | 0.28 | 1.11 | 3.37 | 2.82 | |
Disclaimer/Publisher’s Note: The statements, opinions and data contained in all publications are solely those of the individual author(s) and contributor(s) and not of MDPI and/or the editor(s). MDPI and/or the editor(s) disclaim responsibility for any injury to people or property resulting from any ideas, methods, instructions or products referred to in the content. |
© 2023 by the authors. Licensee MDPI, Basel, Switzerland. This article is an open access article distributed under the terms and conditions of the Creative Commons Attribution (CC BY) license (https://creativecommons.org/licenses/by/4.0/).
Share and Cite
MDPI and ACS Style
Dang, L.M.; Min, K.; Nguyen, T.N.; Park, H.Y.; Lee, O.N.; Song, H.-K.; Moon, H. Vision-Based White Radish Phenotypic Trait Measurement with Smartphone Imagery. Agronomy 2023, 13, 1630. https://doi.org/10.3390/agronomy13061630
AMA Style
Dang LM, Min K, Nguyen TN, Park HY, Lee ON, Song H-K, Moon H. Vision-Based White Radish Phenotypic Trait Measurement with Smartphone Imagery. Agronomy. 2023; 13(6):1630. https://doi.org/10.3390/agronomy13061630
Chicago/Turabian StyleDang, L. Minh, Kyungbok Min, Tan N. Nguyen, Han Yong Park, O New Lee, Hyoung-Kyu Song, and Hyeonjoon Moon. 2023. "Vision-Based White Radish Phenotypic Trait Measurement with Smartphone Imagery" Agronomy 13, no. 6: 1630. https://doi.org/10.3390/agronomy13061630
Note that from the first issue of 2016, this journal uses article numbers instead of page numbers. See further details here.