Article

Application of Drone Surveillance for Advance Agriculture Monitoring by Android Application Using Convolution Neural Network

by
Sabab Ali Shah
1,2,*,
Ghulam Mustafa Lakho
3,
Hareef Ahmed Keerio
4,
Muhammad Nouman Sattar
5,
Gulzar Hussain
2,
Mujahid Mehdi
6,
Rahim Bux Vistro
7,
Eman A. Mahmoud
8 and
Hosam O. Elansary
9,*
1
Research Institute of Engineering and Technology, Hanyang University, Ansan 15588, Republic of Korea
2
Faculty of Architecture and Town Planning, Aror University of Art, Architecture, Design and Heritage, Sukkur 6500, Pakistan
3
Department of Computer Engineering, Sun Moon University, Asan 31461, Republic of Korea
4
Department of Environmental Engineering, Quaid-e-Awam University of Engineering, Science and Technology, Nawabshah 67210, Pakistan
5
Department of Civil Engineering, National University of Technology, Islamabad 44000, Pakistan
6
Faculty of Design, Aror University of Art, Architecture, Design and Heritage, Sukkur 6500, Pakistan
7
Department of Irrigation and Drainage, Faculty of Agricultural Engineering, Sindh Agriculture University, Tandojam 70060, Pakistan
8
Department of Food Industries, Faculty of Agriculture, Damietta University, Damietta 34511, Egypt
9
Department of Plant Production, College of Food Agriculture Sciences, King Saud University, P.O. Box 2460, Riyadh 11451, Saudi Arabia
*
Authors to whom correspondence should be addressed.
Agronomy 2023, 13(7), 1764; https://doi.org/10.3390/agronomy13071764
Submission received: 31 May 2023 / Revised: 25 June 2023 / Accepted: 27 June 2023 / Published: 29 June 2023
(This article belongs to the Special Issue Innovations in Agriculture for Sustainable Agro-Systems)

Abstract

:
Plant diseases are a significant threat to global food security, impacting crop yields and economic growth. Accurate identification of plant diseases is crucial to minimize crop loses and optimize plant health. Traditionally, plant classification is performed manually, relying on the expertise of the classifier. However, recent advancements in deep learning techniques have enabled the creation of efficient crop classification systems using computer technology. In this context, this paper proposes an automatic plant identification process based on a synthetic neural network with the ability to detect images of plant leaves. The trained model EfficientNet-B3 was used to achieve a high success rate of 98.80% in identifying the corresponding combination of plant and disease. To make the system user-friendly, an Android application and website were developed, which allowed farmers and users to easily detect diseases from the leaves. In addition, the paper discusses the transfer method for studying various plant diseases, and images were captured using a drone or a smartphone camera. The ultimate goal is to create a user-friendly leaf disease product that can work with mobile and drone cameras. The proposed system provides a powerful tool for rapid and efficient plant disease identification, which can aid farmers of all levels of experience in making informed decisions about the use of chemical pesticides and optimizing plant health.

1. Introduction

Agriculture, which is a substantial contributor to the world’s economy, is the key source of food, income, and employment. Agriculture in Pakistan makes up approximately 22.67% of the country’s GDP [1] and is vital to feed both rural and urban populations. Hence, the impact of plant disease and infections from pests on agriculture may affect the world’s economy by reducing the production quality of food. Prophylactic treatments are not effective in preventing epidemics and endemics. Early monitoring and proper diagnosis of crop disease using a proper crop protection system may prevent loses in production quality. Identifying types of plant disease is extremely important and is considered a crucial issue. Early diagnosis of plant disease may pave the way for better decision-making in managing agricultural production. Infected plants generally have obvious marks or spots on the stems, fruits, leaves, or flowers. Most specifically, each infection and pest condition leaves unique patterns that can be used to diagnose abnormalities. Identifying a plant disease requires expertise and manpower. Furthermore, manual examination when identifying the type of plant infection is subjective and time consuming, and sometimes the disease identified by farmers or experts may be misleading [2]. As a preventive approach, growers continue to follow traditional scouting methods throughout the field, monitoring disease symptoms with human eyes, and burning infected crops on the spot. However, this method requires a significant amount of time to watch the entire field to identify infected areas in large fields of sugarcane plantations. Thus, precision agriculture technologies aided with modern computational machine learning approaches may provide an effective way of detecting sugarcane WLD on-field, an alternative to human-based methods.
Precision agriculture is a modern method of farming that utilizes advanced technologies to analyze and manage changes within an agricultural field, with the aim of maximizing efficiency, reducing input costs, and promoting sustainability and environmental protection [3,4,5]. This technique has gained significant attention in recent years, and its importance in the agricultural industry cannot be overstated [6]. One of the latest and most critical advancements in precision agriculture is the application of unmanned aerial vehicles (UAVs) for remote sensing in crop production [7]. This technology has been instrumental in improving crop productivity by allowing farmers to monitor changes in plant health, water availability, and soil quality in real-time. The UAV-based remote-sensing approach relies on the indirect detection of soil- and crop-reflected radiation in the field, providing multitemporal and multispectral data, making it suitable for monitoring plant stress and disease [8]. In recent years, there has been a surge in the use of UAVs for agriculture, particularly for collecting high-resolution images and videos for post-processing. Artificial intelligence (AI) techniques are used to process these images for planning, navigation, and geo-referencing as well as for various agricultural applications [9]. These techniques have been utilized to forecast and enhance yield in several farming industries, including sugarcane, by utilizing advanced computational machine learning algorithms [7]. These advancements have helped to improve the overall efficiency and productivity of the farming industry while minimizing environmental impact. Therefore, UAV-based remote sensing is a critical tool for modern agriculture, and its significance is expected to increase in the future.
In recent years, unmanned aerial vehicles (UAVs) equipped with multispectral cameras have been increasingly used for precision agriculture, particularly for disease management. Leon-Rueda et al. [10] conducted a study on the use of UAV-mounted multispectral cameras for classifying commercial potato vascular wilt using a supervised random forest classification technique. Su et al. [11] investigated the yellow rust disease in winter wheat using a multispectral camera by selecting spectral bands and spectral vegetation indices (SVI) with high-discrimination capability. Another study by Albetis et al. [12] evaluated the potential of UAV multispectral imaging to distinguish Flavescence dorée symptoms. Furthermore, Gomez Selvaraj et al. [13] explored the use of aerial imagery and machine learning approaches for disease identification in bananas by classifying and localizing bananas in mixed-complex African environments using pixel-based classifications and machine learning models. Lan et al. [14] assessed the feasibility of large-area identification of citrus Huanglongbing using remote sensing and committed to improving the accuracy of detection using various ML techniques such as support vector machine (SVM), K-nearest neighbor (KNN), and logistic regression (LR). To summarize the application of UAVs for disease management in precision agriculture, Table 1 is presented in this paper.
Machine learning (ML) algorithms have become increasingly popular in monitoring crop status using remote-sensing applications in agriculture [24,25,26,27]. The main objective of using ML methods in agriculture is to establish a relationship between crop parameters and forecast crop production [28]. Different types of ML algorithms, such as artificial neural networks (ANN), random forests (RF), support vector machine (SVM), and decision trees (DT), have been widely used in remote-sensing applications for agricultural purposes [29]. These algorithms have been applied to various remote-sensing data, including hyperspectral, multispectral, and radar, to analyze crop growth, predict crop yield, and detect crop stress. SVM is a popular algorithm for crop classification, while RF has been commonly used for crop yield prediction. DTs and ANN have been utilized for crop stress detection and analysis. The use of these algorithms has resulted in significant improvements in agricultural production, including enhanced crop yield, reduced crop loss, and efficient use of resources.
The main contributions of this paper can be summarized as follows:
  • Firstly, we conducted a comprehensive analysis of crop diseases in Sukkur, which has not been previously done in the Sindh region. This analysis included the detection of leaf diseases, which is a crucial step towards improving crop yields and reducing economic loses for farmers in the area.
  • Secondly, we developed a user-friendly website using the Flask framework, which allows farmers to easily access information about crop diseases and identify potential solutions to manage them. The website is designed to be accessible to users with varying levels of technical expertise, making it a valuable tool for a wide range of farmers.
  • Finally, we developed a mobile application that includes a lightweight version of a deep convolutional neural network (CNN) model (EfficientNet-B3) using TensorFlow. The mobile app allows farmers to quickly and easily detect crop diseases using their smartphones. By making this technology more accessible and user-friendly, we hope to empower farmers to make more informed decisions and improve crop yields in the region.
The remainder of this paper is structured as follows: Section 2 provides a review of related work in the field of plant disease detection using deep learning, highlighting existing methodologies, datasets, and performance metrics. In Section 3, the process of data collection and preprocessing is described, including the criteria for plant selection, acquisition of diseased samples, and techniques applied to ensure data quality and consistency. Section 4 outlines the methodology used for developing a plant disease prediction model, focusing on the architecture, incorporation of convolutional neural networks (CNNs) and transfer learning, hyperparameters, optimization algorithms, and training process. Section 5 presents comprehensive results, including precision, recall, and F1 score. Finally, Section 6 provides concluding remarks, emphasizing the contributions of the study, suggesting future research directions, and summarizing the significance of the research in the field of plant disease detection.

2. Related Works

An artificial neural network (ANN) is a prominent field in artificial intelligence (AI) that imitates the problem-solving mechanism of biological nerve cells or neurons [30,31]. With the advent of technology, convolutional neural networks (CNNs) have emerged as a powerful subset of ANNs, particularly for image classification tasks [32]. Typically, a CNN consists of multiple layers that extract, process, and classify the features of input images. The first layer in a CNN is known as the “convolution layer”, which performs the convolution operation to identify patterns in images. It consists of neurons that learn to apply specific filters to images, detecting features such as edges, textures, and shapes. The second layer, known as the “rectified linear unit layer”, applies a non-linear activation function to the outputs of the convolution layer, thereby improving the detected features. In the third layer of the CNN, known as the “pooling layer”, the spatial size of the features is reduced, while preserving their vital information. This layer is typically used to reduce the computational complexity of the network and prevent overfitting. The final layer of the CNN is the “fully connected layer”, which maps the extracted features to their respective labels or categories. The graphical representation of the CNN is depicted in Figure 1.
Detecting and diagnosing plant diseases is a complex task that has received significant attention in recent years due to its impact on crop production and food security. Various techniques and models have been proposed to address this problem. For example, several studies have explored the use of deep learning models such as computational neural networks (CNN) to detect and classify plant diseases. In one such study, Atila et al. [33] proposed an efficient CNN model called EfficientNet, which achieved high accuracy in detecting various plant diseases when compared with other models. Specifically, the accuracy achieved with this model is 96.18% compared to different architectures. Similarly, Ji et al. [34] developed a united convolutional neural network that fused high-level features to identify grape leaf diseases, outperforming other models. Another approach was presented by Kaur and Kaur [35], who developed F-CNN and S-CNN models to detect and classify plant diseases using full and segmented images. Their findings showed that using segmented images resulted in higher accuracy than using full images. Furthermore, Azimi et al. [36] compared the performance of a 23-layer deep CNN model with other machine learning models to identify nitrogen stress characteristics in plant leaves. Their results demonstrated that the proposed CNN model outperformed other models in terms of accuracy. Specifically, the nitrogen stress characteristics can easily be classified using the proposed CNN model when compared with other characteristics.
One approach is to use feature extraction techniques to analyze plant images and detect disease patterns. For example, Gadekallu et al. [37] proposed a hybrid PCA technique combined with an optimized algorithm called whale optimization for feature extraction and evaluated the data in terms of precision and superiority. Another example is the work of Sinha et al. [38], who used the k-means and threshold segmentation algorithm to extract texture characteristics from olive plant images and identify the relationship between infected and healthy parts. Meanwhile, Sorte et al. [39] developed a texture-based pattern recognition algorithm to detect leaf lesions in coffee plants, using attributes such as local binary and statistical attributes and comparing them with the CNN identification rate. In addition to feature extraction techniques, deep learning models such as convolutional neural networks (CNNs) have also been employed for plant disease detection. Kallam et al. [40] evaluated the performance of different deep learning models for the classification of okra plant disease, exploring the effects of learning rate, batch size, activation function type, and regularization rate on the precision of the models. They found that the number of hidden layers affects the loss of test and training and that CNNs outperformed traditional machine learning techniques. Similarly, Franczyk et al. [41] developed a CNN model with eight hidden layers that outperformed other machine learning techniques for the detection of plant disease. They noted that traditional techniques for detecting plant diseases can be costly and require significant human intervention and maintenance, while an intelligent and automated data collector and classifier can offer a more cost-effective and efficient solution. Finally, Kundu et al. [42] highlighted the benefits of using drones for the detection and visualization of plant diseases. With an intelligent and automated data collector and classifier, the scope of disease detection becomes easier and more cost-effective. They noted that this approach has the potential to significantly improve the accuracy and efficiency of plant disease detection and monitoring.
Using color characteristic techniques, the characteristic vector extracts the characteristics of common diseases and passes the values to the proposed classifier for the detection and classification of leaf disease [43]. For color stretching, gamma correction and decorrelation are applied to balance the number of unbalanced images for training and testing. Oyewola et al. [44] used deep learning techniques and preprocessing to achieve this. Abayomi-Alli et al. [45] used the image histogram transformation technique to recognize diseases using the color space transformation technique. Basavaiah et al. [46] discussed a model for the identification of a number of lesions that cause damage to crops Sensors that led to a shortage of cultivation. Using PlantVillage datasets of different classes, the datasets are classified using different techniques and achieve a maximum precision of 98%. Abdu et al. [47] worked with machine learning models for comparative analysis with SVM for the image-based fungal disease prediction to detect the occurrence and quantify the severity of variability in crops. Both models were implemented in a large-scale horticultural leaf lesion picture dataset using conventional surroundings and considering the critical elements of architecture, processing capacity, and training data. CNN Network covers different techniques for the classification of diseases using images from all fields, such as medical ages [48], hand gesture images, disease images, and diabetic images [49]. Techniques such as VGG16, VGG19, ResNet, Inception, MobileNet, and EfficientNet are predefined models for better classification of the segmented part. Convolutional neural networks offers better accuracy results as given in the TTA algorithm with feature extraction and classification technique.

3. Data Collection and Data Preprocessing

In this research study, the collection of accurate and reliable data is crucial for the effective analysis and evaluation of plant disease detection techniques. To ensure the quality of our data, we employed a two-pronged approach to collect data on defective leaves. Firstly, we used a drone to capture images of defective leaves in the study area. This approach allowed us to collect data from various locations within the study area, providing a comprehensive dataset for analysis. Secondly, we used the publicly available PlantVillage dataset, which is a rich and diverse dataset containing various images of plant diseases. To analyze leaf disease detection in multiple ways, we designed a pipeline consisting of several stages. The pipeline begins with data collection, followed by preprocessing, training, and testing of the model. In this section, we describe the data collection process in detail. Specifically, we elaborate on the study area from which we collected the data, providing a comprehensive understanding of the geographical location and its characteristics. We also discuss the preprocessing steps that we undertook to ensure the accuracy and reliability of the collected data. These steps included cleaning and normalizing the data to eliminate inconsistencies and ensure uniformity in the dataset.

3.1. Description of Study Area

The study area selected for the present study is the Shaheed Benazirabad District, established by the British Government, having a latitude of 26°14′53.99″ N and a longitude of 68°24′34.38″ E, which is shown in Figure 2. It is also called Shaheed Benazir Abad district. Geographically, Shaheed Benazirabad (Shaheed Benazir Abad) is the center of the Sindh province of Pakistan with an area of 4239 square km and a population of 1,435,130. It is situated 50 km from the left bank of the River Indus. The city’s geographical location makes it a major railway and roadway transportation hub in the province. Being a nationwide hub of cotton manufacture and one of Pakistan’s largest producers of bananas, it is also famous for its sugarcane, mango, etc. Climatically, district Shaheed Benazirabad falls in tropical and semi-tropical regions with a maximum temperature of 52 °C. From the hydrological perspective, the study area belongs to the arid and semi-arid region types with an average precipitation of about 100 mm. The quality of underground water is brackish and saline. Western disturbances, dust storms, southeast monsoon, and continental air are the main factors influencing the weather of the district.

3.2. UAV Platform

In our research, we used the DJI Mini 2 Fly More Combo drone, shown in Figure 3, to collect high-resolution images of leaves and plants for further analysis. This drone is compact, lightweight, and equipped with advanced features and technologies, making it ideal for precision agriculture applications. It comes with a 12 MP camera capable of capturing 4 K/30 fps videos and 12 MP photos mounted on a three-axis motorized gimbal that ensures stable footage even during windy conditions or rapid movements. With a maximum flight time of 31 min and a range of up to 10 km, thanks to its powerful brushless motor, it is a reliable and efficient drone. Its portability is a significant advantage, weighing only 249 g, it can be easily transported in a backpack or carrying case, making it ideal for field research. Advanced features such as GPS, obstacle detection, and automated flight modes enhance its ease of use and accuracy in data collection. The high-resolution images were used for plant health assessment, crop yield estimation, and disease detection, demonstrating the potential of drones in precision agriculture to improve productivity, reduce costs, and minimize environmental impact.

3.3. Data Materials

Pennsylvania State University has released a plant disease dataset, named PlantVillage [50], which comprises 54,305 RGB images classified into 38 classes of plant diseases. The dataset includes images of 14 different types of plants, each having at least two classes of images representing healthy and diseased leaves with dimensions of 256 × 256. Figure 4 displays some sample images from the dataset. Since its release, several studies have been conducted on identifying plant diseases using this dataset [51,52,53,54]. The pre-trained models were trained with 80% of the PlantVillage dataset, and 20% was used for validation and testing. We used a dataset that contained 54,305 images of 38 diseases.

3.4. Data Preprocessing and Data Augmentation

This study used a dataset that contained 54,000 images of 26 diseases and 14 crops and organized into 38 classes. To ensure compatibility with various pre-trained network models, the color images from the PlantVillage dataset were downscaled to a standardized format of 256 × 256 pixels. Despite the dataset’s size, it closely reflects real-life images captured by farmers using a variety of image-acquisition techniques, such as Kinect sensors, high-definition cameras, and smartphones. Overfitting-regularization techniques were employed to mitigate concerns about overfitting, which can arise with datasets of this scale. Data augmentation techniques were implemented after preprocessing, involving clockwise and anticlockwise rotation, horizontal and vertical flipping, zoom intensity, and rescaling. During the training process, the images were temporarily augmented to improve the model’s performance, rather than duplicating them. This technique not only prevents overfitting and model loss but also enhances the model’s robustness, allowing it to classify real-life plant disease images with greater accuracy.

3.5. Image Enhancement

Various image processing methods are used to improve the quality of digitally stored images. One such method involves mapping the values of one improved distribution to the values of another improved distribution. Histogram equalization is commonly used to improve the contrast of the transformed input image. However, due to variations in lighting conditions during image capture, some images may contain bright regions, while others may contain dark regions, resulting in an unbalanced histogram. To address this issue, the enhanced image is normalized using the histogram normalization technique described by Equation (1).
H ( P ( x , y ) ) = R o u n d f cdf P x , y     f cd P min R   ×   C     f cdf   ×   L     1
In Equation (1), fcdf represents the cumulative frequency of the gray level, fcd Pmin represents the minimum value of the cumulative distribution function, R × C represents the total number of pixels in each row and column, L represents the total number of intensities, and fcdf P(x,y) is the current pixel intensity.

3.6. Some Common Diseases in the Leaves

  • Late Blight [55] (Figure 5): Late blight is a destructive disease that affects tomato and potato plants and is caused by the fungus Phytophthora infestans. This disease is widespread throughout the United States and can have devastating effects on crops if left uncontrolled. As its name suggests, late blight typically occurs later in the growing season, with symptoms often not appearing until after the plants have blossomed.
  • Early Blight [56] (Figure 6): Early blight is a common fungal disease that affects tomato and potato plants and is caused by the fungus Alternaria solani. This disease is widespread throughout the United States and can cause significant damage to crops if left untreated. One of the first signs of early blight is the appearance of small brown spots with concentric rings on the lower, older leaves of the plant. These spots may gradually enlarge and merge, forming a characteristic “bull’s eye” pattern. As the disease progresses, the affected leaves may turn yellow, wither, and eventually die. The fungus can also spread to other parts of the plant, such as the stem, fruit, and upper leaves, causing further damage. In severe cases, early blight can lead to significant crop loses and reduced yield. Proper management and prevention techniques, such as crop rotation, use of disease-resistant cultivars, and timely application of fungicides, can help to control the spread of this disease and protect crop production.
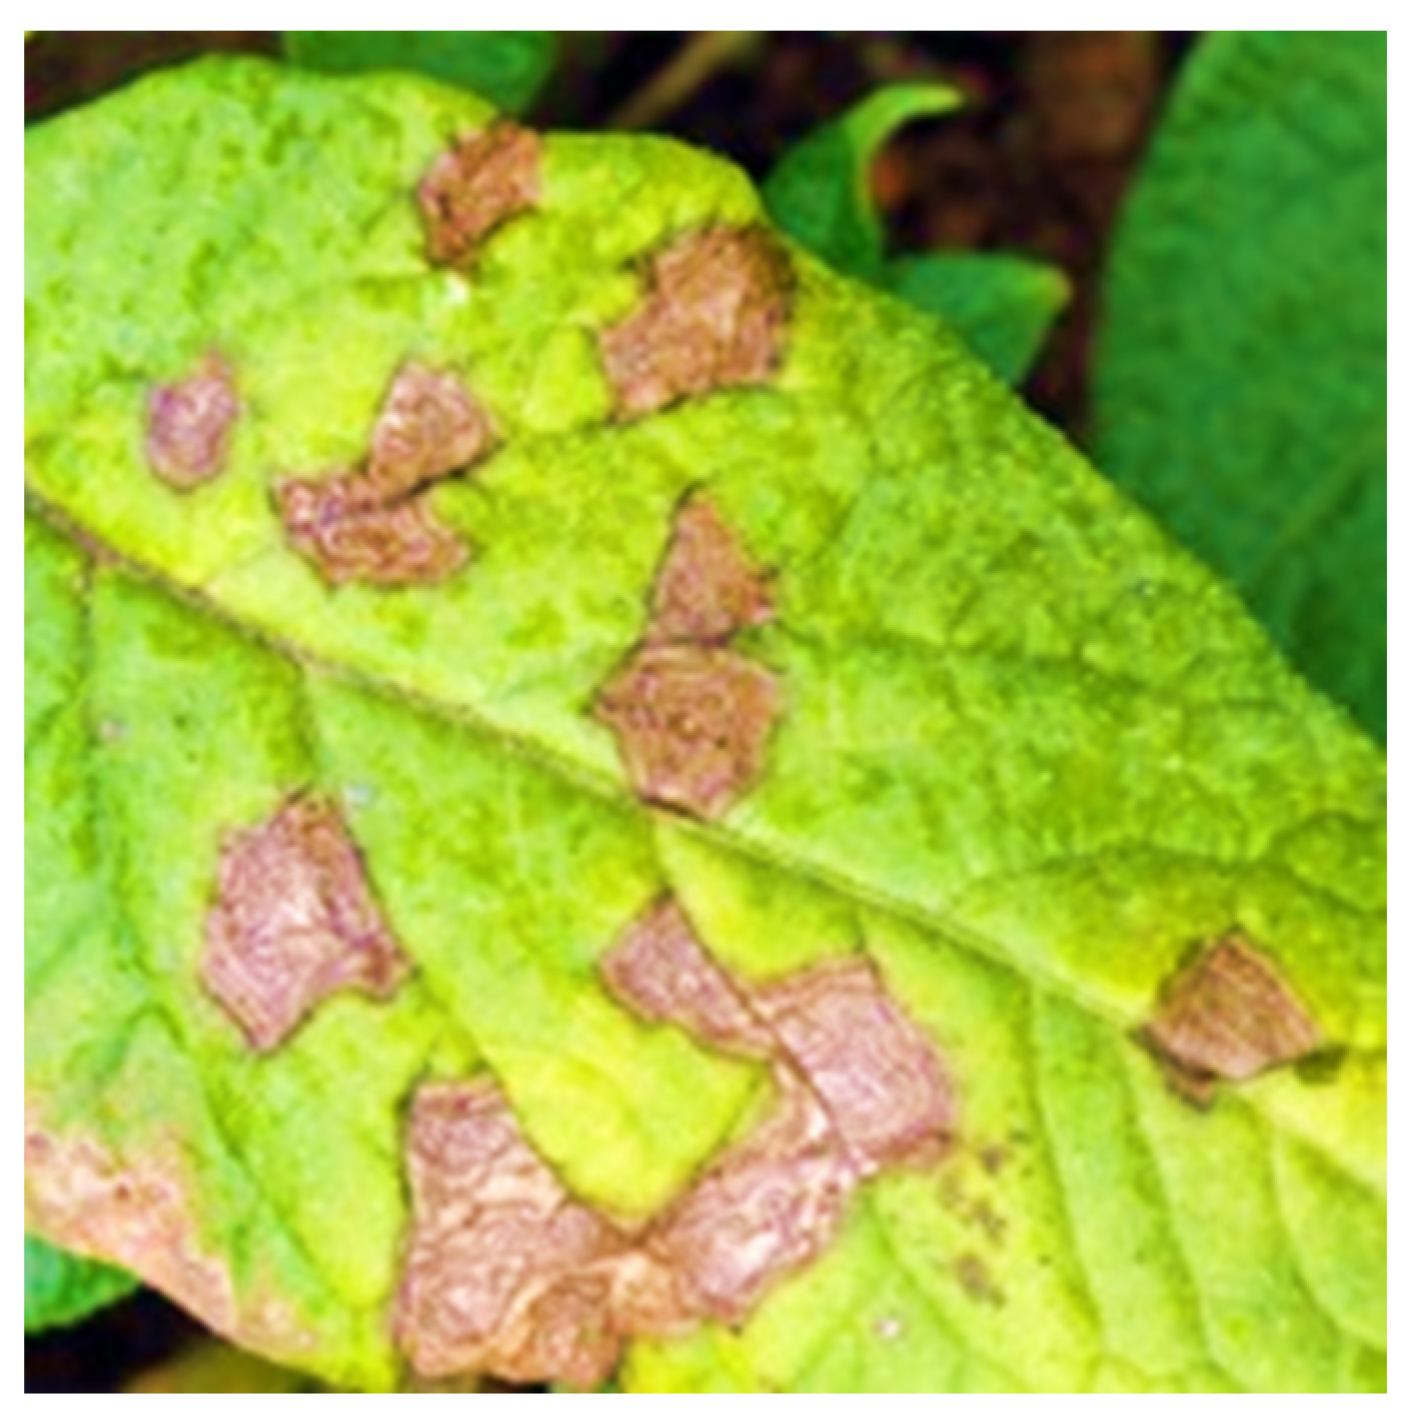
  • Leaf Spot [57] (Figure 7): Leaf spot diseases caused by pathogens are a common problem in many crops, including stone fruit trees and vegetables such as tomato, pepper, and lettuce. These diseases can be caused by either bacteria or fungi, and although the symptoms may vary slightly, they generally result in similar effects on the plant. Leaf spots caused by both types of pathogens are characterized by the appearance of small, dark-colored lesions on the leaves, which can gradually enlarge and merge, leading to defoliation and reduced plant vigor. In addition, these diseases can also affect fruit quality and yield, leading to economic loses for growers.

4. Methodology

In this methodology section, we elaborate on the transfer learning approach that we have adopted for the purpose of plant disease detection using deep learning. Specifically, we have utilized the EfficientNet-B3 model, which has proven to be highly effective in image classification tasks. We provide a detailed description of this model and how it has been fine-tuned to suit our requirements. In addition, we describe the process by which we have developed a mobile application and a user-friendly website for the detection of plant disease. Our aim was to create tools that would enable farmers and other stakeholders to easily and quickly detect plant diseases, using their smartphones or computers. We have described the design and implementation of these tools in detail, including their various features and functionalities. To assess the performance of our plant disease detection model, we have used various performance metrics such as precision, recall, and F1 score. These metrics provide valuable insights into the accuracy of our model, and how well it is able to distinguish between different disease classes. We provide a comprehensive analysis of these performance metrics, highlighting the strengths and weaknesses of our model, and suggesting possible areas for improvement.

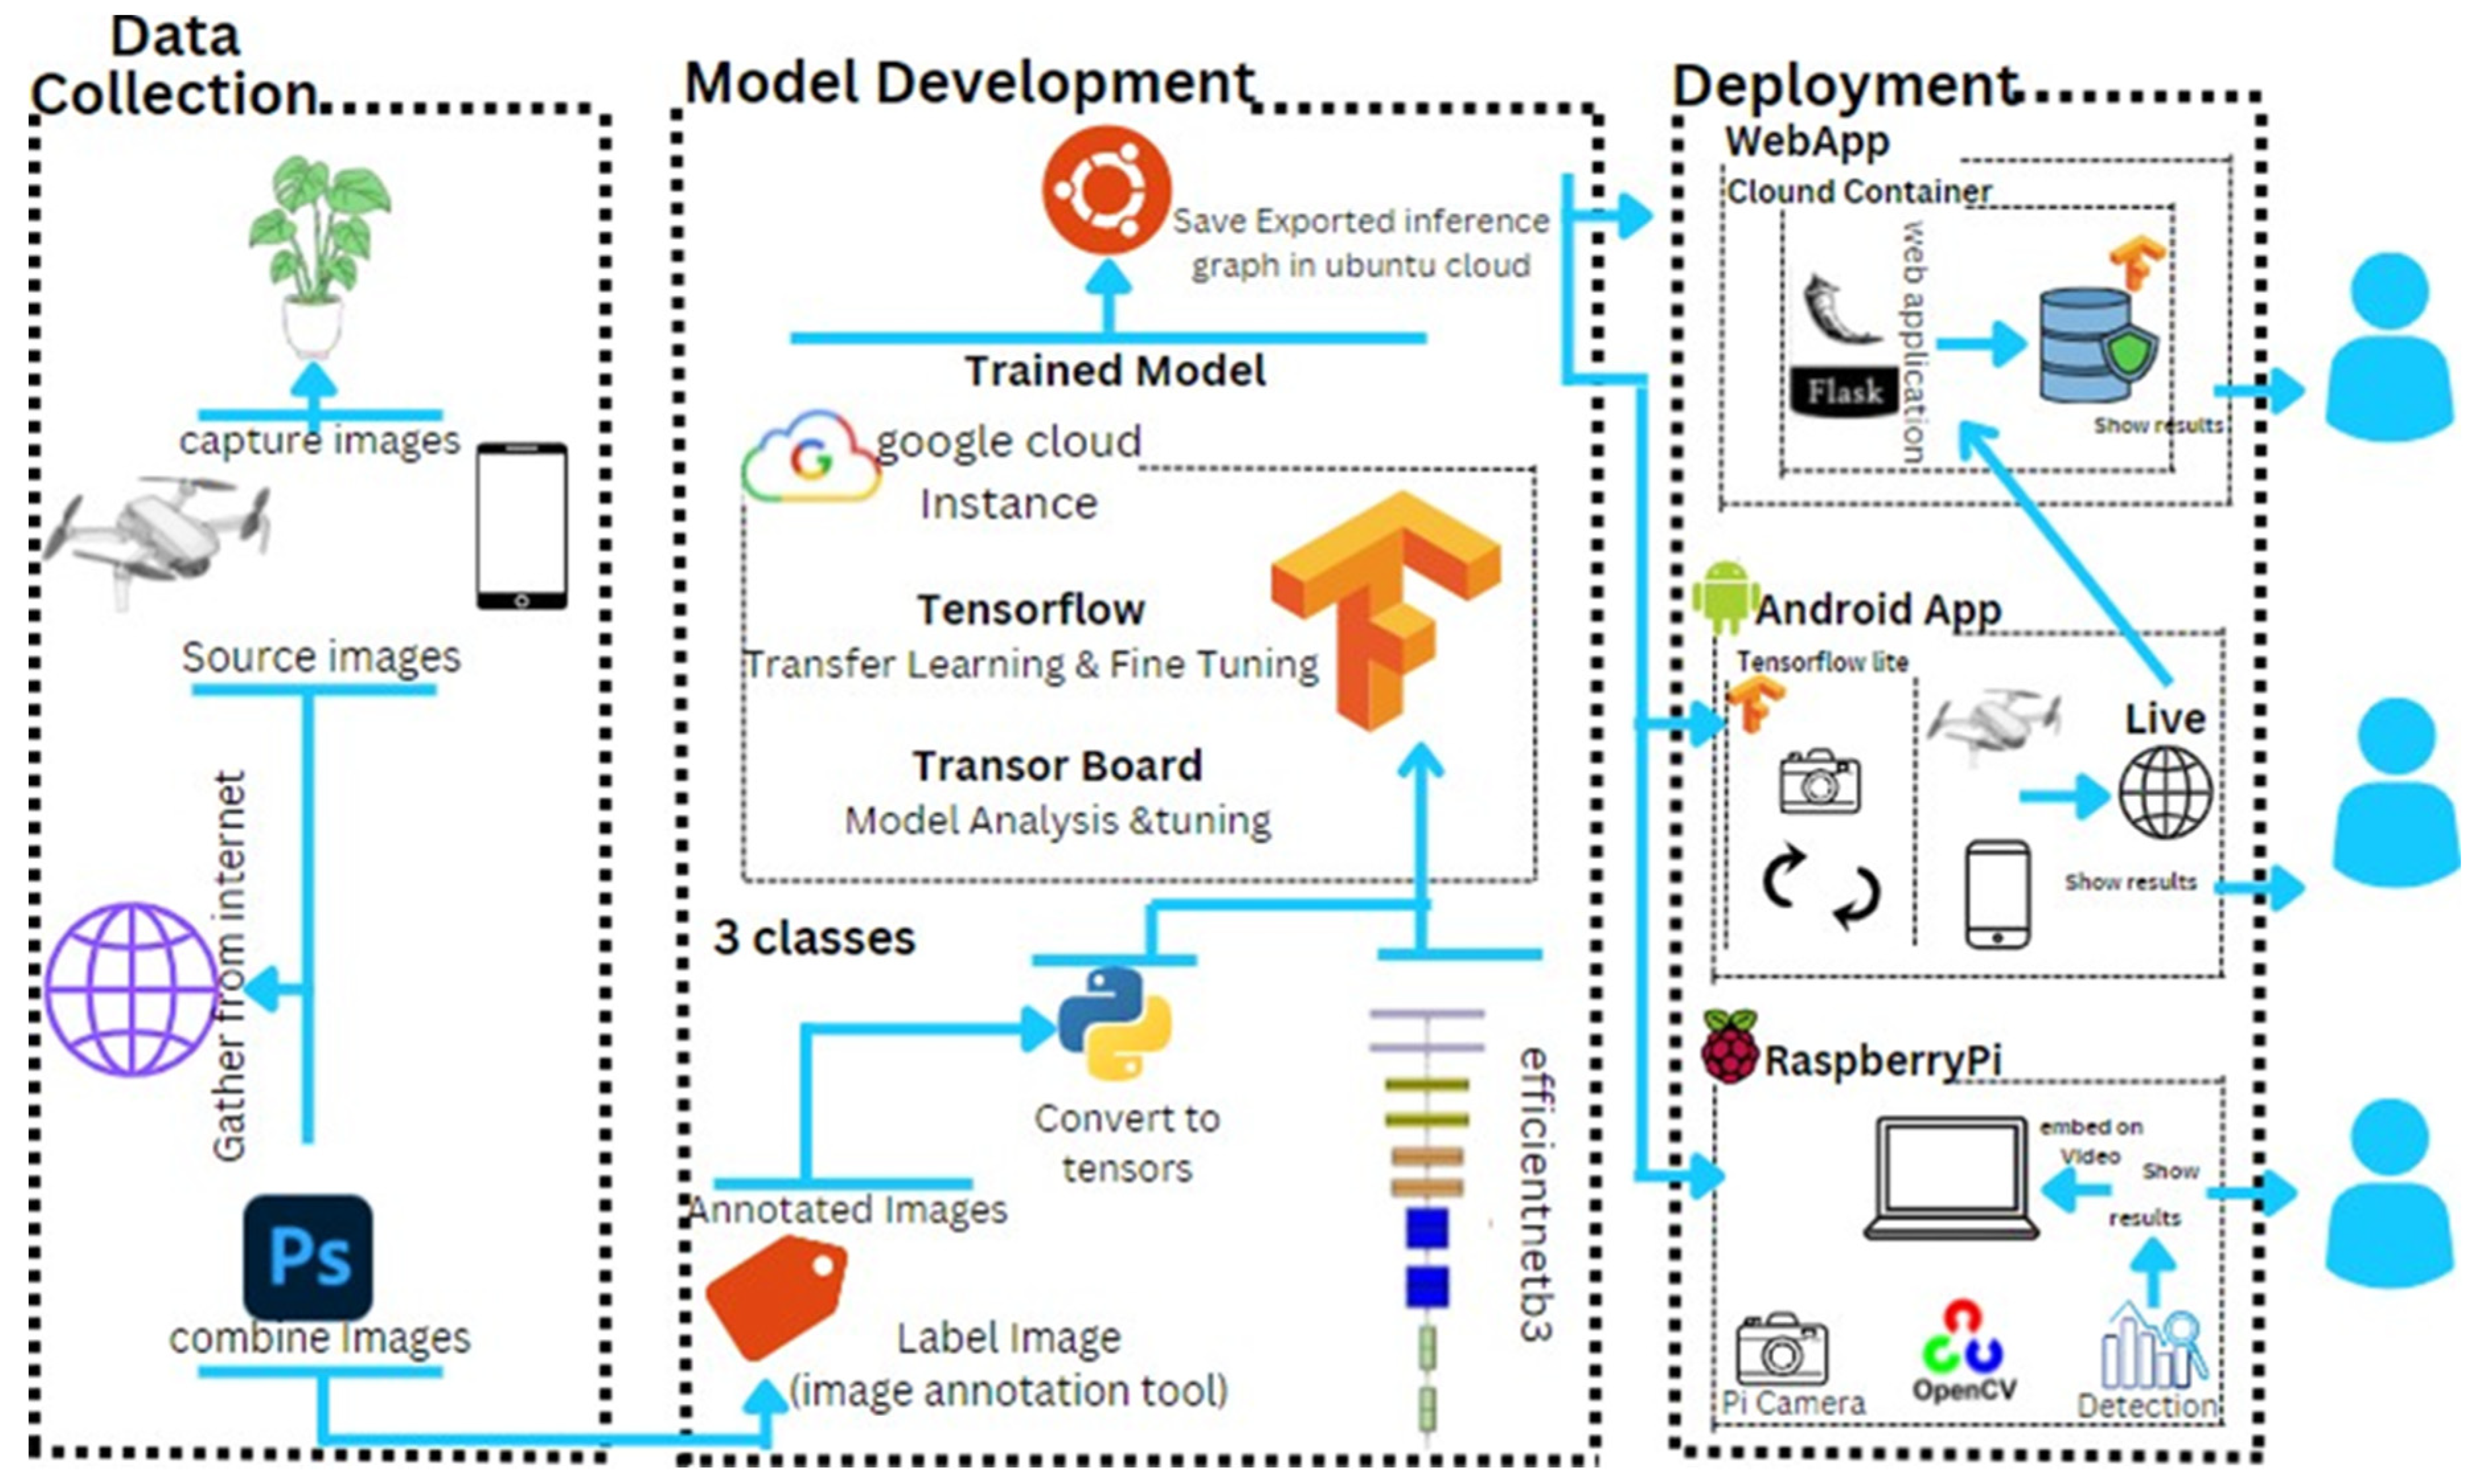
4.1. Process Pipeline

The presented research explores the possibilities of detecting plant disease through multiple avenues, as illustrated in Figure 8. The figure highlights various steps that are involved in the process, such as capturing an image of the plant through a drone or a cell phone, followed by performing mandatory preprocessing steps. Subsequently, the model is trained using the EfficientNetB3 architecture. One of the ways to check defective leaves is through a web application created using Flask, a Python framework, used to create a user-friendly website. Furthermore, the research team developed a mobile application using Android Studio software, where the already trained model (EfficientNetB3) was adapted to a light version for efficient use on mobile devices. The team also explored using drones to detect plant diseases. Moreover, the team will also install the model in the Raspberry Pi and utilized OpenCV to detect diseases in the leaves. These multiple approaches demonstrated the versatility of plant disease detection and the potential to use different technologies to achieve the same goal. The presented study highlights the importance of using multiple techniques and emphasizes the adaptability of machine learning models on different platforms for detecting plant diseases.

4.2. Transfer Learning Approach

The use of transfer learning in computer vision, especially in image classification, has revolutionized deep learning. Transfer learning allows for the use of pre-existing knowledge in the form of a pre-trained model, which can then be fine-tuned for a specific task using a smaller dataset. This results in faster convergence, higher accuracy, and reduced overfitting. The EfficientNet-B3 model pre-trained on the ImageNet dataset was utilized in the study to accurately classify plant diseases. By using this pre-trained model as a starting point, the study was able to reduce the amount of time required to train the model while achieving higher accuracy. Performance metrics such as precision, recall, and F1 score were used to analyze model performance. The combination of transfer learning, pre-trained models, and performance metrics can greatly enhance the accuracy and efficiency of plant disease detection using deep learning.

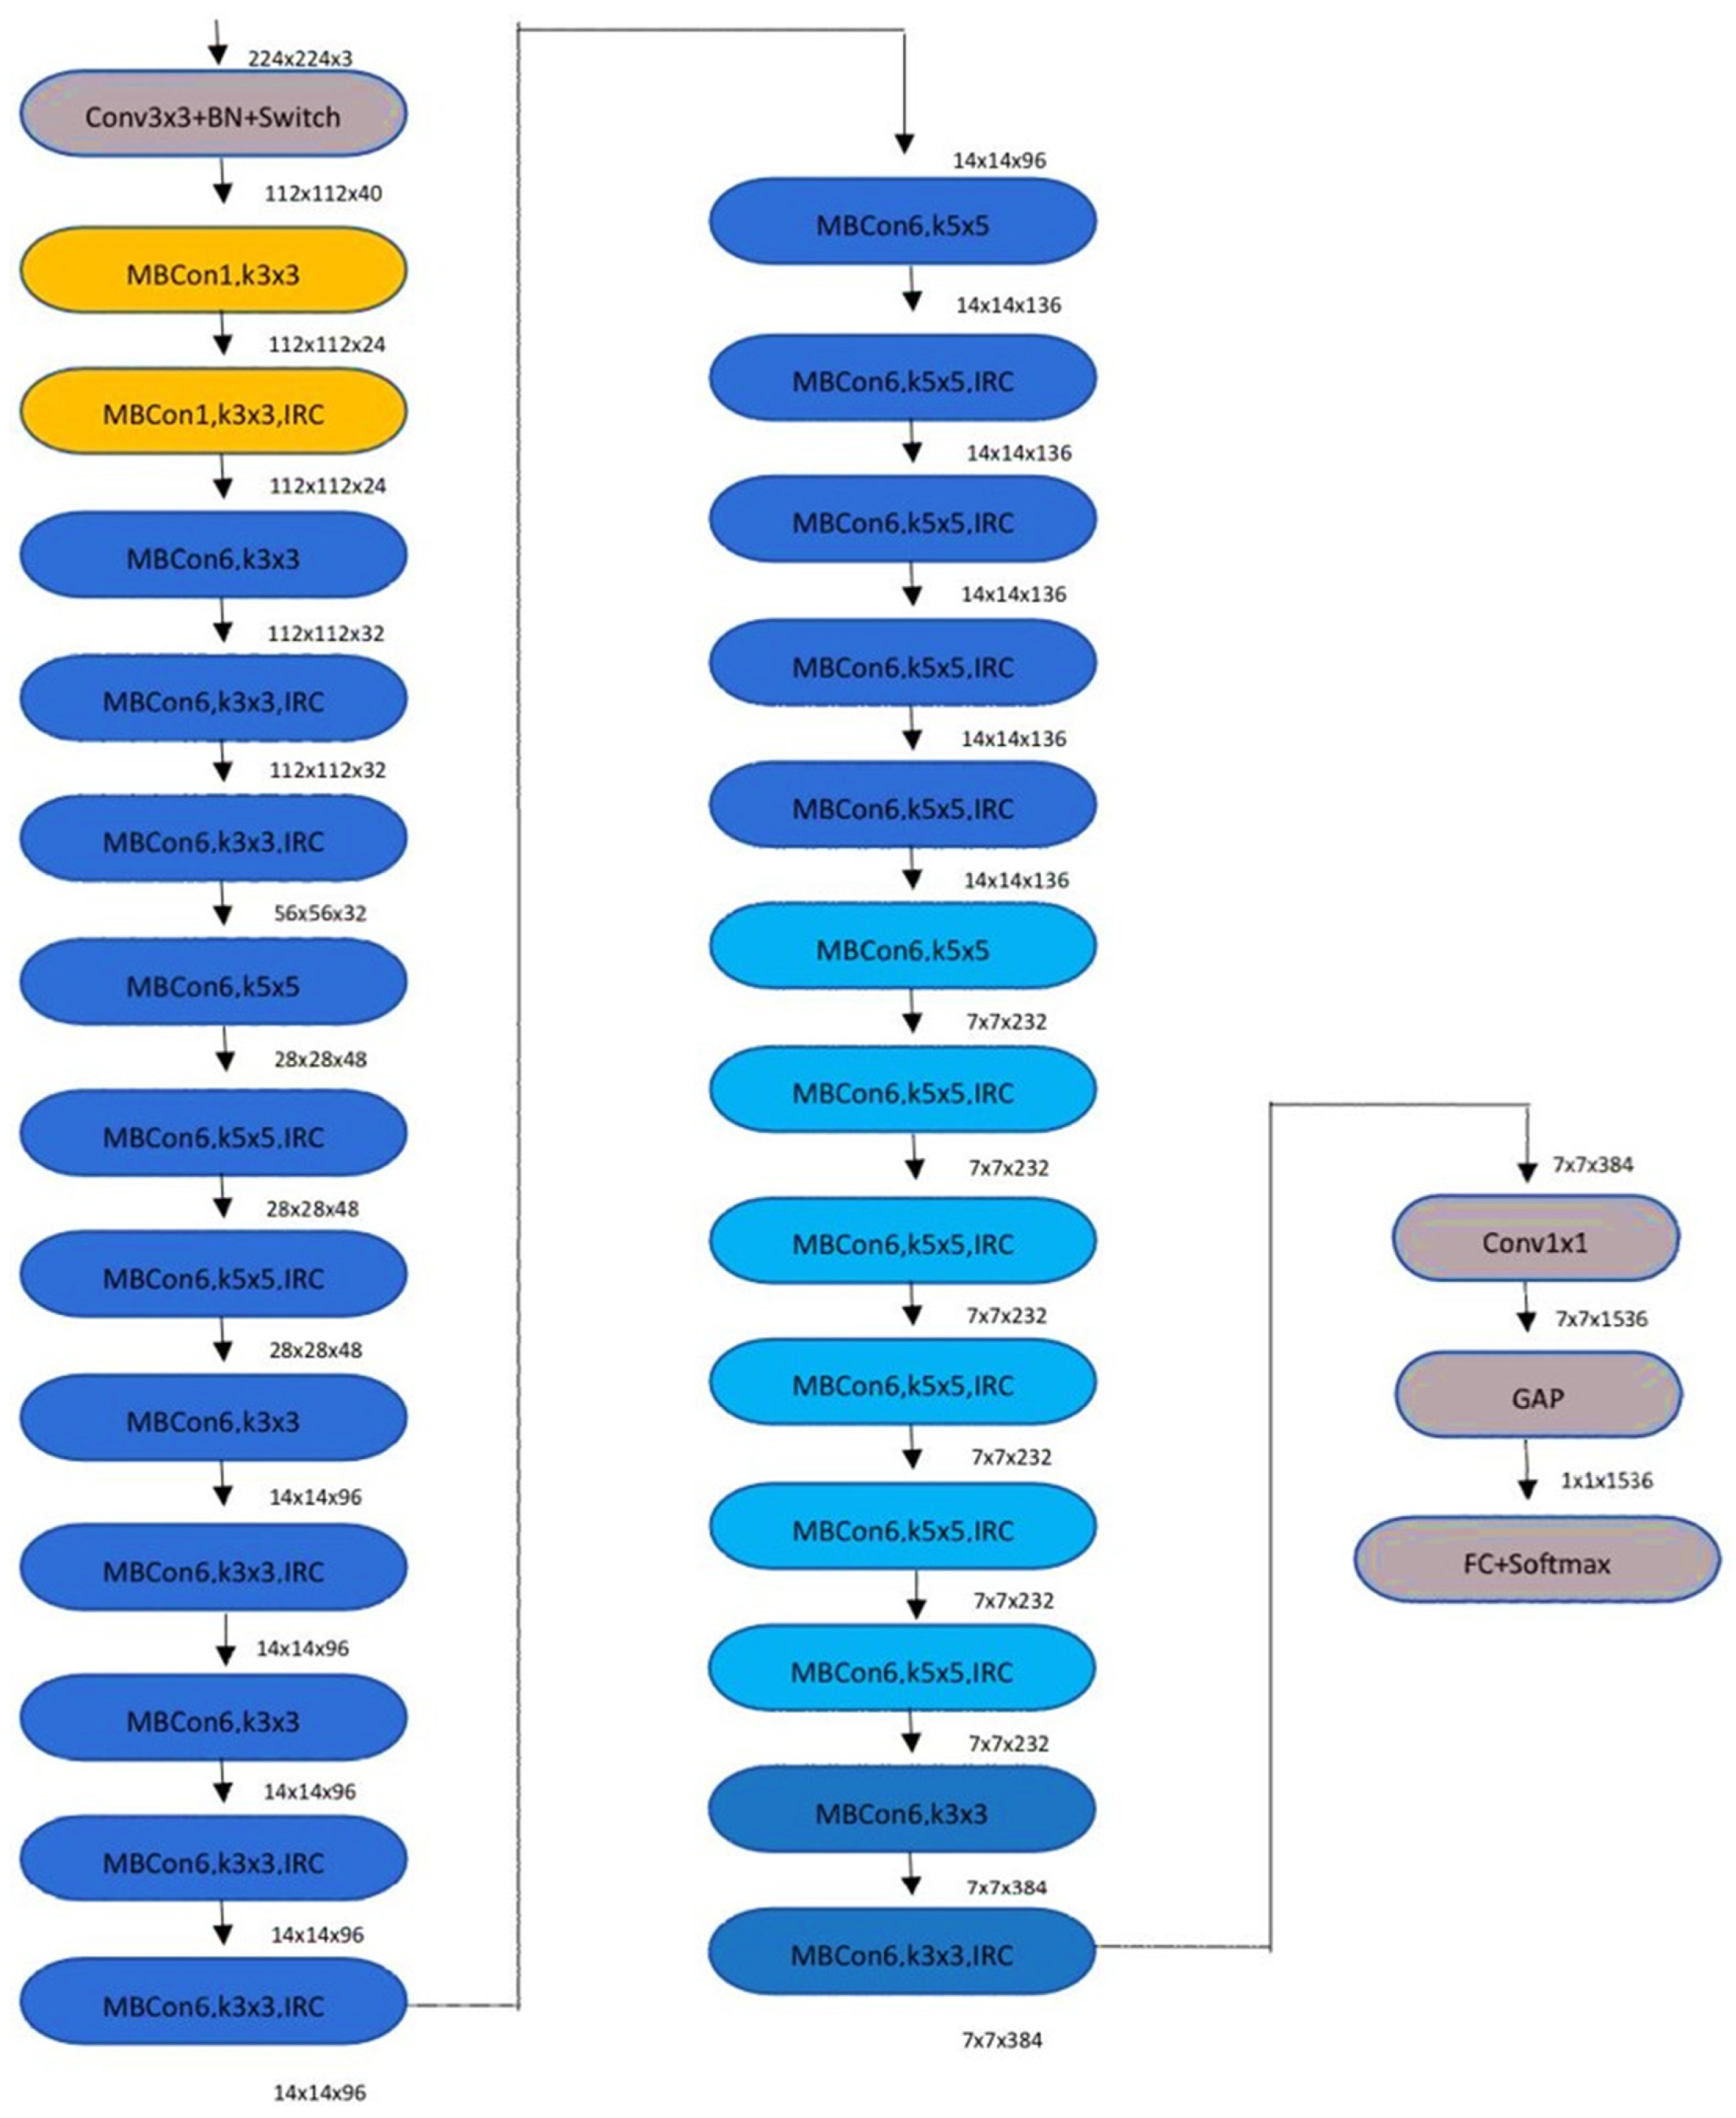
4.3. EfficientNet-B3

EfficientNet-B3 is a convolutional neural network architecture developed by researchers at Google that achieved state-of-the-art performance on the ImageNet classification task. The model is part of a family of EfficientNet models that are designed to achieve high accuracy while being computationally efficient. EfficientNet-B3 has 28 convolutional layers, with a total of 12.2 million parameters. It uses a combination of convolutional layers with different kernel sizes as well as squeeze-and-excitation modules that selectively amplify important features. The model also includes a global average pooling layer, followed by a fully connected layer and a softmax activation function to output the class probabilities, which is shown in Figure 9.
Leaf disease detection using deep learning typically involves training a model on a large dataset of labeled images of healthy and diseased leaves. The goal is to train the model to accurately distinguish between healthy and diseased leaves as well as between different types of diseases. To use EfficientNet-B3 for leaf disease detection, you would typically fine-tune the pre-trained model on your specific dataset. Fine-tuning involves freezing some of the early layers of the network and training the remaining layers on your dataset, using transfer learning. This approach can significantly reduce the amount of training data required and improve the performance of the model. After fine-tuning, you can use the model to classify new images of leaves as healthy or diseased and to identify the specific disease if present. This can be a valuable tool for farmers and other agriculture professionals as it can help to detect and manage diseases early, improving crop yield and reducing the use of pesticides.

4.4. Mobile App

To make our plant disease detection model accessible to farmers, we developed a user-friendly mobile application using Android Studio, a widely used software for mobile app development. This application allows farmers to easily analyze the diseases present in their crops by simply taking a photo of a leaf of the plant. The app then sends the photo to our deep learning model, which classifies the disease and returns the results to the user. We will provide a detailed description of the mobile application and its results in the Results section of our study. By making our model easily accessible through a mobile application, we hope to provide a practical solution for farmers to quickly detect and diagnose plant diseases, ultimately leading to more efficient and effective crop management.

4.5. Website

Our system utilizes the powerful Flask Python framework to detect leaf diseases. This allows us to take advantage of a wide range of advanced features and capabilities, such as robust security, seamless database integration, and flexible scalability. With Flask, we can build a sophisticated web application that is efficient and user-friendly. By leveraging the power of this powerful framework, we are able to provide a highly effective tool for detecting and diagnosing leaf diseases. In addition, Flask’s modular design enables us to easily add new features and functionality as needed, ensuring that our system remains up-to-date and relevant over time. In general, our use of the Flask framework plays a crucial role in the success and effectiveness of our leaf disease detection system.

4.6. Performance Metrics

Precision: Precision measures the proportion of true positive results among the total positive results predicted by the model. It is calculated as:
P r e c i s i o n = T r u e   P o s i t i v e T r u e   P o s i t i v e   +   F a l s e   P o s i t i v e
where T r u e   P o s i t i v e   ( T P ) is the number of correct positive predictions, and False Positive (FP) is the number of incorrect positive predictions.
Recall: Recall measures the proportion of true positive results among the total actual positive results. It is calculated as:
R e c a l l = T r u e   P o s i t i v e T r u e   P o s i t i v e   +   F a l s e   N e g a t i v e
where False Negative (FN) is the number of actual positive results that were incorrectly predicted as negative by the model.
F1 score: F1 score is a harmonic mean of Precision and Recall, which combines both measures to provide an overall evaluation metric for a model’s performance. It is calculated as:
F 1   s c o r e   =   2   ×   P e r c i s i o n   ×   R e c a l l P e r c i s i o n   +   R e c a l l
F1 score provides a balanced evaluation of Precision and Recall, where a high F1 score indicates that the model has both high Precision and Recall.
In the context of plant leaf disease detection, the Precision, Recall, and F1 score can be used to evaluate the performance of a model in identifying diseased leaves correctly. Precision measures the accuracy of positive predictions, Recall measures the completeness of the positive predictions, and the F1 score core provides an overall evaluation of the model’s performance.

5. Results and Discussions

In this section, we will provide an overview of the experimental system that we used to detect plant diseases using deep learning. We will describe the training and validation process of our model and provide insights into the training and validation loss and accuracy. Furthermore, we will discuss the results that we obtained from our user-friendly mobile application and website. The results of our experiments will be presented in the form of tables, which will provide detailed information on the diseases detected by our model for each plant. Overall, this section will provide a comprehensive understanding of the performance of our deep learning model and its practical applications in the field of plant disease detection. By analyzing the results obtained from our experimental system, we can make informed decisions about the future development of our model and improve its accuracy and efficiency.

5.1. Experimental Settings

In our study, we conducted experiments on a high-performance Windows 10 Pro machine equipped with a 12th-Gen Intel(R) Core(TM) i7-12700 processor, 32.0 GB of RAM, and a 500 GB WD Blue SN570 hard disk. We used the NVIDIA GeForce RTX 3060 graphics card with an impressive adapter RAM of 1,048,576 bytes to build and execute deep learning models. To construct and train our models, we used Python version 3.11.0 in combination with the TensorFlow framework and Keras version 2.7.0 as the high-level API. For the front-end activities of our user-friendly mobile application, we utilized the Kotlin Multiplatform Mobile Android SDK and XML and built a middleware between the application and the cloud server. Additionally, we develop a user-friendly website using the Flask Python framework. To evaluate the performance of our deep learning models, we used a dataset that contained 54,000 images of 26 diseases and 14 crops and organized into 38 classes. The dataset was divided into three subsets, with 70% used for training, 20% for validation, and 10% for testing purposes. These resources and tools helped us to effectively build and evaluate our models, providing valuable insights into the detection of plant diseases using deep learning.

5.2. Overall Results

In our study, we utilized the softmax activation function in the cross-entropy of the output layer as the loss function, which is a commonly used loss function in deep learning. To evaluate the performance of our model, we plotted the calculated training error and loss as well as the training and validation accuracy by the EfficientNet-B3 model on the training process for the detection of plant diseases. Figure 10 shows that error loss decreases with each epoch, while accuracy increases consistently. This indicates that our model was able to learn from the training data and perform better as the training progressed. We observed that our model converged after the 7th epoch, which means that our dataset and the fine-tuned parameters were a good fit for the model. The results of our experiments demonstrate the effectiveness of our approach in accurately detecting plant diseases using deep learning techniques.

5.3. Confusion Metrics

The performance of the CNN model used in this study can be evaluated using the confusion matrix, as shown in Figure 11. The confusion matrix provides a comprehensive analysis of how the model’s performance varies for different disease classes. Displays the true and predicted classes of disease images, with the diagonal cells indicating the correct predictions and the off-diagonal cells representing the prediction errors. The results demonstrate that the model can effectively differentiate between disease classes and achieve high levels of accuracy in most cases. In particular, for the three most common types of crop disease, corn blight, apple scab, and grape black rot, the model achieves precision above 96%, 98%, and 97%, respectively. However, we observed that the model had difficulty in identifying diseases caused by bacteria and viruses, such as blight, scab, mosaic, and leaf curl, compared to those caused by fungi, such as rust and rot. This is possibly due to the fact that fungal diseases cause more obvious symptoms on plant leaves, while bacterial and viral infections often exhibit mild symptoms that are more difficult to detect. Overall, the confusion matrix provides valuable insights into the strengths and weaknesses of the model’s performance and can aid in optimizing the model for more accurate disease detection.

5.4. Results from Mobile Application

The mobile app allows farmers to capture a photo of the infected plants with proper alignment and orientation. The orientation handler, which runs as a background service thread in the mobile app, is responsible for correcting the tilt and camera angle to capture the plant photo. Once the right image is captured, the app uploads it to a cloud server to detect the disease class(es) by applying our model. The captured image is transferred to the cloud side via a REST (Representational State Transfer) service in the form of a JSON (JavaScript Object Notation) image object. The results of our experiments, as shown in Figure 12 and Figure 13, indicate that our plant disease detection model performs with high precision, achieving a confidence score of 99% for both peach bacterial spot and potato late blight. This highlights the potential of our system to be utilized as a real-time plant disease detector at the edge, allowing for early detection and prevention of crop damage. In addition to evaluating our system’s classification accuracy, we also performed performance testing by measuring the processor time taken to perform various tasks in the mobile app. These tasks included photo capture, image preprocessing, and disease recognition processes. We performed ten trials for each experiment and took the average of the results. Our findings demonstrate that our system performs efficiently and effectively, even when plant images are captured from different distances, orientations, and illumination conditions. In general, our experimental results support the efficacy of our prototype implementation for plant disease detection. With its high accuracy and efficient performance, our system has the potential to significantly benefit the agricultural industry by enabling timely and accurate identification of crop diseases.

5.5. Results from Web Application

In Section 4.5, we provide details on the deployment of our website using the Flask framework, which aims to assist farmers in analyzing images of plant leaves. Our website application is equipped with an algorithm that processes images and detects accurately any signs of plant disease. It also identifies multiple diseases that the model has been trained to recognize. Our experimental results, as demonstrated in Figure 14 and Figure 15, indicate that our plant disease detection model exhibits a high degree of accuracy, producing excellent results for both Apple_scab and Grape Healthy. This underscores the potential of our system as a real-time plant disease detector that operates on the edge, enabling the early detection and prevention of crop damage. Apart from evaluating the classification accuracy of our system, we also conducted performance testing by measuring the processor time taken to perform various tasks on the website. We conducted ten trials for each experiment and recorded the average results. Our system has demonstrated high accuracy and efficient performance, making it a valuable tool for the agricultural industry. By facilitating timely and accurate identification of crop diseases, our system has the potential to significantly benefit the industry, helping farmers to minimize crop loses and enhance crop yields.

5.6. Classification Report

Table 2 represents the classification report for a leaf disease detection experiment. The report presents a summary of the performance of a classification model on different classes of leaves. The table shows precision, recall, F1 score, and support for each class. The details about the metrics are in Table 2, and we can see that the model achieved perfect precision, recall, and F1 score for most of the classes, such as Apple Apple scab, Apple Black rot, Apple Cedar apple rust, Apple healthy, Blueberry healthy, Brown spot in rice leaf, Cercospora leaf spot, Cherry (including sour) Powdery mildew, Cherry(including sour) healthy, Garlic, Grape Esca Black Measles, Grape Leaf blight Isariopsis Leaf Spot, Leaf smut in rice leaf, Orange Haunglongbing Citrus greening, Peach healthy, Pepper bell Bacterial spot, Pepper bell healthy, Raspberry healthy, Soybean healthy, Strawberry Leaf scorch, and Strawberry healthy. However, some classes have lower scores, such as Bacterial leaf blight in rice leaf, Blight in corn Leaf, Common Rust in corn Leaf, Gray Leaf Spot in corn Leaf, Potato Early blight, Potato Late blight, and Potato healthy, indicating that the model had some difficulty in distinguishing these classes from others. It is important to note that the number of samples in these classes is relatively small compared to other classes, which might affect the model’s performance. Overall, the classification report provides valuable information about the model’s performance, and it can help researchers to evaluate and compare different models for leaf disease detection.

6. Conclusions

The use of deep learning techniques in the field of agriculture has shown great potential in automatically detecting and classifying plant diseases from leaf images. With the current global population growth, it has become imperative to increase agricultural production and minimize crop loss due to plant diseases. The declining crop production is affecting the economy of the country, and innovative strategies need to be implemented to protect plants from diseases. In this research, we have demonstrated the effectiveness of deep learning techniques for predicting plant leaf disease using drones that farmers cannot reach. The trained model EfficientNet-B3 was used, and an Android application and website were developed, which allowed farmers and users to easily detect diseases from the leaves. We also discussed different techniques for segmenting plant parts affected by disease and proposed a highly accurate system, with an F1 score of 98.80% in detecting and classifying plant diseases. The system includes server-side components such as a trained model and a web application that displays identified plant diseases based on leaf images captured by the drone camera. This application will aid farmers of all levels of experience in rapidly and efficiently recognizing plant diseases and making informed decisions about the use of chemical pesticides.

7. Future Direction

In future work, it would be advantageous to train the deep learning model with real-time data to enhance its accuracy. By collecting data in real-time, we can ensure that the model is trained on the most up-to-date information and can adapt to new trends in plant diseases. This will lead to a more accurate and efficient model that can detect and classify plant diseases with greater precision. Moreover, the integration of drones in agriculture has opened new doors for plant disease detection. Drones can provide real-time aerial images of crops and help farmers detect plant diseases at an early stage. In the future, we plan to incorporate real-time data from drones into our deep learning model. This will allow for accurate and timely identification of plant diseases in crops and will help farmers take appropriate measures to prevent further spread of the disease. To achieve this goal, we will need to develop a system that can automatically collect and label real-time data from various sources, including drones, to create a comprehensive dataset for our model. We will also need to develop new algorithms that can process this data and improve the accuracy of our model. By doing so, we can create a more robust and effective plant disease detection system that can help farmers across the globe.
Additionally, we plan to explore the advanced model such as YOLOv5, and the use of other types of data, such as weather and soil data, to further improve the accuracy of our model. By incorporating these additional data sources, we can create a more holistic approach to plant disease detection and prevention. In conclusion, the future work of this research will focus on enhancing the accuracy and efficiency of the deep learning model by training it with real-time data and integrating data from drones into the system. This will lead to a more effective plant disease detection system that can help farmers make informed decisions about their crops and reduce the economic impact of plant diseases on the agriculture industry.

Author Contributions

Conceptualization, S.A.S. and G.M.L.; methodology, G.M.L., H.A.K. and M.M.; software, S.A.S. and G.H.; validation, M.N.S., R.B.V. and E.A.M.; formal analysis, S.A.S. and G.M.L.; investigation, R.B.V. and H.A.K.; resources, G.M.L.; data curation, G.H.; writing—original draft preparation, S.A.S., G.M.L. and H.O.E.; writing—review and editing, M.M. and H.A.K.; visualization, M.M. and G.M.L.; supervision, S.A.S. and M.N.S.; project administration, E.A.M. and R.B.V.; funding acquisition, H.O.E. All authors have read and agreed to the published version of the manuscript.

Funding

Deputyship for Research and Innovations “Ministry of Education” in Saudi Arabia (IFKSUR3-095-02).

Data Availability Statement

All the data set is available with the corresponding author.

Acknowledgments

The authors are grateful to Aror University of Art, Architecture, Design and Heritage, Sindh, Sukkur, Pakistan, and Research Center of Engineering and Technology, Hanyang University, Ansan, Republic of Korea. The authors extend their appreciation to the Deputyship for Research and Innovations “Ministry of Education” in Saudi Arabia for funding this research (IFKSUOR3-095-2).

Conflicts of Interest

The author declared no conflict of interest.

References

  1. Ministry of Finance, Government of Pakistan. Economic Survey of Pakistan 2020–2021; Ministry of Finance, Government of Pakistan: Islamabad, Pakistan, 2022.
  2. Dawod, R.G.; Dobre, C. Upper and Lower Leaf Side Detection with Machine Learning Methods. Sensors 2022, 22, 2696. [Google Scholar] [CrossRef]
  3. Narmilan, A.; Puvanitha, N. Mitigation Techniques for Agricultural Pollution by Precision Technologies with a Focus on the Internet of Things (IoTs): A Review. Agric. Rev. 2020, 41, 279–284. [Google Scholar] [CrossRef]
  4. Narmilan, A.; Niroash, G.; Sumangala, K. Assessment on Consequences and Benefits of the Smart Farming Techniques in Batticaloa District, Sri Lanka. Int. J. Res. Publ. 2020, 61, 14–20. [Google Scholar]
  5. Narmilan, A. E-Agricultural Concepts for Improving Productivity: A Review Sch. J. Eng. Technol. 2017, 5, 10–17. [Google Scholar]
  6. Mazzia, V.; Comba, L.; Khaliq, A.; Chiaberge, M.; Gay, P. UAV and Machine Learning Based Refinement of a Satellite-Driven Vegetation Index for Precision Agriculture. Sensors 2020, 20, 2530. [Google Scholar] [CrossRef] [PubMed]
  7. Amarasingam, N.; Salgadoe, A.S.A.; Powell, K.; Gonzalez, L.F.; Natarajan, S. A review of UAV platforms, sensors, and applications for monitoring of sugarcane crops. Remote Sens. Appl. Soc. Environ. 2022, 26, 100712. [Google Scholar] [CrossRef]
  8. Kim, H.; Kim, W.; Kim, S. Damage Assessment of Rice Crop after Toluene Exposure Based on the Vegetation Index (VI) and UAV Multispectral Imagery. Remote Sens. 2020, 13, 25. [Google Scholar] [CrossRef]
  9. García, L.; Parra, L.; Jimenez, J.; Lloret, J.; Mauri, P.; Lorenz, P. DronAway: A Proposal on the Use of Remote Sensing Drones as Mobile Gateway for WSN in Precision Agriculture. Appl. Sci. 2020, 10, 6668. [Google Scholar] [CrossRef]
  10. León-Rueda, W.A.; León, C.; Caro, S.G.; Ramírez-Gil, J.G. Identification of diseases and physiological disorders in potato via multispectral drone imagery using machine learning tools. Trop. Plant Pathol. 2021, 47, 152–167. [Google Scholar] [CrossRef]
  11. Su, J.; Liu, C.; Coombes, M.; Hu, X.; Wang, C.; Xu, X.; Li, Q.; Guo, L.; Chen, W.-H. Wheat yellow rust monitoring by learning from multispectral UAV aerial imagery. Comput. Electron. Agric. 2018, 155, 157–166. [Google Scholar] [CrossRef]
  12. Albetis, J.; Duthoit, S.; Guttler, F.; Jacquin, A.; Goulard, M.; Poilvé, H.; Féret, J.-B.; Dedieu, G. Detection of Flavescence dorée Grapevine Disease Using Unmanned Aerial Vehicle (UAV) Multispectral Imagery. Remote Sens. 2017, 9, 308. [Google Scholar] [CrossRef] [Green Version]
  13. Selvaraj, M.G.; Vergara, A.; Montenegro, F.; Ruiz, H.A.; Safari, N.; Raymaekers, D.; Ocimati, W.; Ntamwira, J.; Tits, L.; Omondi, A.B.; et al. Detection of banana plants and their major diseases through aerial images and machine learning methods: A case study in DR Congo and the Republic of Benin. ISPRS J. Photogramm. Remote Sens. 2020, 169, 110–124. [Google Scholar] [CrossRef]
  14. Lan, Y.; Huang, Z.; Deng, X.; Zhu, Z.; Huang, H.; Zheng, Z.; Lian, B.; Zeng, G.; Tong, Z. Comparison of machine learning methods for citrus greening detection on UAV multispectral images. Comput. Electron. Agric. 2020, 171, 105234. [Google Scholar] [CrossRef]
  15. DadrasJavan, F.; Samadzadegan, F.; Pourazar, S.H.S.; Fazeli, H. UAV-based multispectral imagery for fast Citrus Greening detection. J. Plant Dis. Prot. 2019, 126, 307–318. [Google Scholar] [CrossRef]
  16. Xavier, T.W.F.; Souto, R.N.V.; Statella, T.; Galbieri, R.; Santos, E.S.; Suli, G.S.; Zeilhofer, P. Identification of ramularia leaf blight cotton disease infection levels by multispectral, multiscale uav imagery. Drones 2019, 3, 33. [Google Scholar] [CrossRef] [Green Version]
  17. Chivasa, W.; Mutanga, O.; Biradar, C. UAV-based multispectral phenotyping for disease resistance to accelerate crop improvement under changing climate conditions. Remote Sens. 2020, 12, 2445. [Google Scholar] [CrossRef]
  18. Kerkech, M.; Hafiane, A.; Canals, R. Vine disease detection in UAV multispectral images using optimized image registration and deep learning segmentation approach. Comput. Electron. Agric. 2020, 174, 105446. [Google Scholar] [CrossRef]
  19. Wang, T.; Thomasson, J.A.; Yang, C.; Isakeit, T.; Nichols, R.L. Automatic classification of cotton root rot disease based on uav remote sensing. Remote Sens. 2020, 12, 1310. [Google Scholar] [CrossRef] [Green Version]
  20. Huang, H.; Deng, J.; Lan, Y.; Yang, A.; Zhang, L.; Wen, S.; Zhang, H.; Zhang, Y.; Deng, Y. Detection of helminthosporium leaf blotch disease based on UAV Imagery. Appl. Sci. 2019, 9, 558. [Google Scholar] [CrossRef] [Green Version]
  21. Tetila, E.C.; Machado, B.B.; Menezes, G.K.; Oliveira, A.D.S.; Alvarez, M.; Amorim, W.P.; Belete, N.A.; Da Silva, G.G.; Pistori, H. Automatic Recognition of Soybean Leaf Diseases Using UAV Images and Deep Convolutional Neural Networks. IEEE Geosci. Remote Sens. Lett. 2019, 17, 903–907. [Google Scholar] [CrossRef]
  22. Kerkech, M.; Hafiane, A.; Canals, R. Deep leaning approach with colorimetric spaces and vegetation indices for vine diseases detection in UAV images. Comput. Electron. Agric. 2018, 155, 237–243. [Google Scholar] [CrossRef]
  23. Xiao, Y.; Dong, Y.; Huang, W.; Liu, L.; Ma, P. Wheat fusarium head blight detection using uav-based spectral and texture features in optimal window size. Remote Sens. 2021, 13, 2437. [Google Scholar] [CrossRef]
  24. Tsouros, D.C.; Bibi, S.; Sarigiannidis, P.G. A review on UAV-based applications for precision agriculture. Information 2019, 10, 349. [Google Scholar] [CrossRef] [Green Version]
  25. Marin, D.B.; Ferraz, G.A.E.S.; Santana, L.S.; Barbosa, B.D.S.; Barata, R.A.P.; Osco, L.P.; Ramos, A.P.M.; Guimarães, P.H.S. Detecting coffee leaf rust with UAV-based vegetation indices and decision tree machine learning models. Comput. Electron. Agric. 2021, 190, 106476. [Google Scholar] [CrossRef]
  26. De Rosa, D.; Basso, B.; Fasiolo, M.; Friedl, J.; Fulkerson, B.; Grace, P.R.; Rowlings, D.W. Predicting pasture biomass using a statistical model and machine learning algorithm implemented with remotely sensed imagery. Comput. Electron. Agric. 2020, 180, 105880. [Google Scholar] [CrossRef]
  27. Puig Garcia, E.; Gonzalez, F.; Hamilton, G.; Grundy, P. Assessment of Crop Insect Damage Using Unmanned Aerial Systems: A Machine Learning Approach. In Proceedings of the MODSIM 2015, 21st International Congress on Modelling and Simulation, Gold Coast, Australia, 24 November–4 December 2015; Available online: http://www.mssanz.org.au/modsim2015/F12/puig.pdf (accessed on 4 December 2015).
  28. Feng, L.; Zhang, Z.; Ma, Y.; Du, Q.; Williams, P.; Drewry, J.; Luck, B. Alfalfa Yield prediction using uav-based hyperspectral imagery and ensemble learning. Remote Sens. 2020, 12, 2028. [Google Scholar] [CrossRef]
  29. Osco, L.P.; Ramos, A.P.M.; Pereira, D.R.; Moriya, A.S.; Imai, N.N.; Matsubara, E.T.; Estrabis, N.; de Souza, M.; Junior, J.M.; Gonçalves, W.N.; et al. Predicting canopy nitrogen content in citrus-trees using random forest algorithm associated to spectral vegetation indices from Uav-imagery. Remote Sens. 2019, 11, 2925. [Google Scholar] [CrossRef] [Green Version]
  30. Mrisho, L.M.; Mbilinyi, N.A.; Ndalahwa, M.; Ramcharan, A.M.; Kehs, A.K.; McCloskey, P.C.; Murithi, H.; Hughes, D.P.; Legg, J.P. Accuracy of a Smartphone-Based Object Detection Model, PlantVillage Nuru, in Identifying the Foliar Symptoms of the Viral Diseases of Cassava–CMD and CBSD. Front. Plant Sci. 2020, 11, 590889. [Google Scholar] [CrossRef]
  31. Hassan, M.; Hamada, M. A Neural Networks Approach for Improving the Accuracy of Multi-Criteria Recommender Systems. Appl. Sci. 2017, 7, 868. [Google Scholar] [CrossRef] [Green Version]
  32. Musa, A.; Aliyu, F. Performance Evaluation of Multi-Layer Perceptron (MLP) and Radial Basis Function (RBF). In Proceedings of the 2019 2nd International Conference of the IEEE Nigeria Computer Chapter (NigeriaComputConf), Zaria, Nigeria, 14–19 October 2019; pp. 1–5. [Google Scholar] [CrossRef]
  33. Atila, U.; Ucar, M.; Akyol, K.; Uçar, E. Plant leaf disease classification using Efficient Net deep learning model. Ecol. Inform. 2021, 61, 101182. [Google Scholar] [CrossRef]
  34. Ji, M.; Zhang, L.; Wu, Q. Automatic grape leaf diseases identification via United Model based on multiple convolutional neural networks. Inf. Process. Agric. 2019, 7, 418–426. [Google Scholar]
  35. Sharma, P.; Berwal, Y.P.S.; Ghai, W. Performance Analysis of Deep Learning CNN Models for Disease Detection in Plants using Image Segmentation. Inf. Process. Agric. 2019, 7, 566–574. [Google Scholar] [CrossRef]
  36. Azimi, S.; Kaur, T.; Gandhi, T.K. A deep learning approach to measure stress levels in plants due to Nitrogen deficiency. Measurement 2020, 173, 108650. [Google Scholar] [CrossRef]
  37. Gadekallu, T.R.; Rajput, D.S.; Reddy MP, K.; Lakshmanna, K.; Bhattacharya, S.; Singh, S.; Jolfaei, A.; Alazab, M. A novel PCA–whale optimization-based deep neural network model for classification of tomato plant diseases using GPU. J. Real-Time Image Process. 2021, 18, 1383–1396. [Google Scholar] [CrossRef]
  38. Sinha, A.; Shekhawat, R.S. Olive Spot Disease Detection and Classification using Analysis of Leaf Image Textures. Procedia Comput. Sci. 2020, 167, 2328–2336. [Google Scholar] [CrossRef]
  39. Ximenes, L.F.; Carolina Fambrini, F.G.; Roseli Saito, J. Coffee Leaf Disease Recognition Based on Deep Learning and Texture Attributes. Procedia Comput. Sci. 2019, 159, 135–144. [Google Scholar] [CrossRef]
  40. Kallam, S.; Basha, S.M.; Rajput, D.S.; Patan, R.; Balamurugan, B.; Basha, S.A.K. Evaluating the Performance of Deep Learning Techniques on Classification Using Tensor Flow Application. In Proceedings of the 2018 International Conference on Advances in Computing and Communication Engineering (ICACCE), Paris, France, 22–23 June 2018. [Google Scholar] [CrossRef]
  41. Franczyk, B.; Hernes, M.; Kozierkiewicz, A.; Kozina, A.; Pietranik, M.; Roemer, I.; Schieck, M. Deep learning for grape variety recognition. Procedia Comput. Sci. 2020, 176, 1211–1220. [Google Scholar] [CrossRef]
  42. Kundu, N.; Rani, G.; Dhaka, V.S.; Gupta, K.; Nayak, S.C.; Verma, S.; Ijaz, M.F.; Wozniak, M. IoT and Interpretable Machine Learning Based Framework for Disease Prediction in Pearl Millet. Sensors 2021, 21, 5386. [Google Scholar] [CrossRef] [PubMed]
  43. Almadhor, A.; Rauf, H.T.; Lali, M.I.U.; Damaševicius, R.; Alouffi, B.; Alharbi, A. AI-Driven Framework for Recognition of Guava Plant Diseases through Machine Learning from DSLR Camera Sensor Based High Resolution Imagery. Sensors 2021, 21, 3830. [Google Scholar] [CrossRef]
  44. Oyewola, D.O.; Dada, E.G.; Misra, S.; Damaševicius, R. Detecting cassava mosaic disease using a deep residual convolutional neural network with distinct block processing. PeerJ Comput. Sci. 2021, 7, e352. [Google Scholar] [CrossRef] [PubMed]
  45. Abayomi-Alli, O.O.; Damaševičius, R.; Misra, S.; Maskeliūnas, R. Cassava disease recognition from low-quality images using enhanced data augmentation model and deep learning. Expert Syst. 2021, 38, e12746. [Google Scholar] [CrossRef]
  46. Basavaiah, J.; Arlene Anthony, A. Tomato Leaf Disease Classification using Multiple Feature Extraction Techniques. Wirel. Pers. Commun. 2020, 115, 633–651. [Google Scholar] [CrossRef]
  47. Aliyu, M.A.; Mokji, M.M.; Sheikh, U.U.U. Machine learning for plant disease detection: An investigative comparison between support vector machine and deep learning. IAES Int. J. Artif. Intell. (IJ-AI) 2020, 9, 670. [Google Scholar] [CrossRef]
  48. Bhattacharya, S.; Reddy Maddikunta, P.K.; Pham, Q.V.; Gadekallu, T.R.; Krishnan, S.S.R.; Chowdhary, C.L.; Alazab, M.; Jalil Piran, M. Deep learning and medical image processing for coronavirus (COVID-19) pandemic: A survey. Sustain Cities Soc. 2021, 65, 102589. [Google Scholar] [CrossRef] [PubMed]
  49. Gadekallu, T.R.; Khare, N.; Bhattacharya, S.; Singh, S.; Maddikunta PK, R.; Srivastava, G. Deep neural networks to predict diabetic retinopathy. J. Ambient. Intell. Humaniz. Comput. 2020, 14, 5407–5420. [Google Scholar] [CrossRef]
  50. PlantVillage. Available online: https://plantvillage.psu.edu/ (accessed on 10 October 2022).
  51. Aldhyani, T.H.; Alkahtani, H.; Eunice, R.; Hemanth, D.J. Leaf Pathology Detection in Potato and Pepper Bell Plant using Convolutional Neural Networks. In Proceedings of the 2022 7th International Conference on Communication and Electronics Systems (ICCES), Coimbatore, India, 22–24 June 2022; pp. 1289–1294. [Google Scholar]
  52. Panigrahi, K.P.; Das, H.; Sahoo, A.K.; Moharana, S.C. Maize Leaf Disease Detection and Classification Using Machine Learning Algorithms. In Progress in Computing, Analytics and Networking: Proceedings of ICCAN 2019; Springer: Singapore, 2022. [Google Scholar] [CrossRef]
  53. Kabir, M.M.; Ohi, A.Q.; Mridha, M.F. A Multi-Plant Disease Diagnosis Method using Convolutional Neural Network. arXiv 2020, arXiv:2011.05151. [Google Scholar]
  54. Prodeep, A.R.; Hoque, A.M.; Kabir, M.M.; Rahman, M.S.; Mridha, M.F. Plant Disease Identification from Leaf Images using Deep CNN’s EfficientNet. In Proceedings of the 2022 International Conference on Decision Aid Sciences and Applications (DASA), Chiangrai, Thailand, 23–25 March 2022; pp. 523–527. [Google Scholar]
  55. Planet Natural Research Center. Late Blight. Available online: https://www.planetnatural.com/pest-problem-solver/plant-disease/late-blight/ (accessed on 14 May 2023).
  56. Planet Natural Research Center. Early Blight. Available online: https://www.planetnatural.com/pest-problem-solver/plant-disease/early-blight/ (accessed on 14 May 2023).
  57. Planet Natural Research Center. Bacterial Leaf Spot. Available online: https://www.planetnatural.com/pest-problem-solver/plant-disease/leaf-blight/ (accessed on 14 May 2023).
Figure 1. Architecture of Convolutional neural network.
Agronomy 13 01764 g001
Figure 2. Location of the study area in District Shaheed Benazirabad, Sindh, Pakistan.
Agronomy 13 01764 g002
Figure 3. Unmanned Aerial Vehicle (UAV) utilized in the study to capture aerial data of the study area.
Agronomy 13 01764 g003
Figure 4. Examples of leaf diseases in the PlantVillage dataset.
Agronomy 13 01764 g004
Figure 5. Tomato leaf infected with late blight disease.
Agronomy 13 01764 g005
Figure 6. Visual symptoms of early blight disease on a Potato leaf.
Agronomy 13 01764 g006
Figure 7. Fungal leaf spot disease affecting a plant leaf.
Agronomy 13 01764 g007
Figure 8. Proposed methodology framework.
Agronomy 13 01764 g008
Figure 9. EfficientNet-B3 model architecture.
Agronomy 13 01764 g009
Figure 10. Accuracy graph of EfficientNet-B3: (a)—Training and validation loss; (b)—Training and validation accuracy on the overall dataset.
Agronomy 13 01764 g010
Figure 11. Confusion matrix for plant leaf disease detection.
Agronomy 13 01764 g011
Figure 12. Potato late blight disease.
Agronomy 13 01764 g012
Figure 13. Peach bacterial spot disease.
Agronomy 13 01764 g013
Figure 14. Leaf Category: Grape and Disease: None (Healthy).
Agronomy 13 01764 g014
Figure 15. Leaf Category: Apple and Disease: Apple_scab.
Agronomy 13 01764 g015
Table 1. Application of UAVs for disease management in precision agriculture.
NoCropDiseaseLocationUAV SensorReference
01CitrusCitrus greeningIranMicasense RedEdge camera[15]
02CottonLeaf Blight DiseaseBrazilMultispectral TetraCam ADC camera[16]
03MaizeMaize streak virus diseaseZimbabweParrot Sequoia multispectral camera[17]
04VineyardVine diseaseFranceSurvey2 sensor[18]
05CottonRoot rot diseaseUSAMicasense RedEdge camera[19]
06WheatHelminthosporium leaf blotch (HLB)ChinaPhantom 4 RGB camera[20]
07SoybeanSoybean leaf diseasesBrazilPhantom 3 Sony EXMOR sensor[21]
08VineEsca diseaseFranceRGB camera[22]
09WheatFusarium Head BlightChinaHyperspectral camera[23]
Table 2. Classification report.
S: NoClassPrecisionRecallF1 ScoreSupport
1Tomato_Late_Blight1.00001.00001.0000101
2Tomato_Healthy1.00001.00001.000099
3Grape_Healthy1.00001.00001.000044
4Orange_Haunglongbing_(Citrus_greening)1.00001.00001.000066
5Soybean_Healthy0.94740.93100.939158
6Squash_Powdery_mildew_Powdery_mildew1.00001.00001.000060
7Potato_healthy1.00001.00001.000022
8Corn_(maize)_Northern_Leaf_Blight1.00001.00001.000043
9Tomato_Early_Blight1.00001.00001.000042
10Tomato_Septoria_leaf_spot1.00000.95450.976734
11Corn_(maize)_cercospora_leaf_spot_Gray_leaf_spot1.00000.98940.994766
12Strawberry_Leaf_scorch1.00000.97870.989247
13Peach_healthy1.00001.00001.000095
14Apple_Apple_scab1.00000.98940.9947189
15Tomato_Tomato_Yellow_Leaf_Curl_Virus1.00000.98940.9947183
16Tomato_Bacterial_spot0.99111.00000.9955222
17Apple_Black_rot1.00000.99420.9955248
18Blueberry_healthy1.00000.99420.9971172
19Cherry_(including_sour) _Powdery_mildew0.94441.00000.971417
20Peach_Bacterial_spot0.78120.89290.833328
21Apple_Cader_apple_rust1.00001.00001.000092
22Tomato_Target_Spot1.00001.00001.000082
23Papper bell_healthy1.00001.00001.000014
24Grape_Leaf_blight_(isariopsis_Leaf_Spot)1.00001.00001.000050
25Potato_Late_blight0.98041.00000.990159
26Tomato_Tomato_mosaic_virus0.96080.98000.970350
27Strawberry_healthy1.00001.00001.000050
28Apple_healthy0.99511.00001.0000115
29Grape_Black_rot1.00001.00001.0000203
30Potato_Early_blight1.00001.00001.000044
31Cherry_(including_sour)_healthy1.00000.97170.985619
32Corn_(maize)_Common_rust0.94120.96000.9505106
33Grape_Esca_(Black_Measles)0.95920.97920.969150
34Raspberry_healthy0.97920.97920.979296
35Tomato_Leaf_Mold0.98840.96590.977048
36Tomato_Spider_mites_Two_spotted_spider_mite1.00000.91670.956588
37Papper_bell_Bacterial_spot0.89610.98570.938884
38Corn_(maize)_healthy1.00001.00001.000070
Accuracy 0.98803265
Macro avg0.96500.96660.96453265
Weighted avg0.98860.95500.98813265
Disclaimer/Publisher’s Note: The statements, opinions and data contained in all publications are solely those of the individual author(s) and contributor(s) and not of MDPI and/or the editor(s). MDPI and/or the editor(s) disclaim responsibility for any injury to people or property resulting from any ideas, methods, instructions or products referred to in the content.

