
A Lightweight YOLOv8 Tomato Detection Algorithm Combining Feature Enhancement and Attention

School of Electrical Engineering and Automation, Jiangxi University of Science and Technology, Ganzhou 341000, China
*
Author to whom correspondence should be addressed.
Agronomy 2023, 13(7), 1824; https://doi.org/10.3390/agronomy13071824
Submission received: 18 June 2023
/
Revised: 6 July 2023
/
Accepted: 8 July 2023
/
Published: 9 July 2023
(This article belongs to the Section Precision and Digital Agriculture)
Abstract
:A tomato automatic detection method based on an improved YOLOv8s model is proposed to address the low automation level in tomato harvesting in agriculture. The proposed method provides technical support for the automatic harvesting and classification of tomatoes in agricultural production activities. The proposed method has three key components. Firstly, the depthwise separable convolution (DSConv) technique replaces the ordinary convolution, which reduces the computational complexity by generating a large number of feature maps with a small amount of calculation. Secondly, the dual-path attention gate module (DPAG) is designed to improve the model’s detection precision in complex environments by enhancing the network’s ability to distinguish between tomatoes and the background. Thirdly, the feature enhancement module (FEM) is added to highlight the target details, prevent the loss of effective features, and improve detection precision. We built, trained, and tested the tomato dataset, which included 3098 images and 3 classes. The proposed algorithm’s performance was evaluated by comparison with the SSD, faster R-CNN, YOLOv4, YOLOv5, and YOLOv7 algorithms. Precision, recall rate, and mAP (mean average precision) were used for evaluation. The test results show that the improved YOLOv8s network has a lower loss and 93.4% mAP on this dataset. This improvement is a 1.5% increase compared to before the improvement. The precision increased by 2%, and the recall rate increased by 0.8%. Moreover, the proposed algorithm significantly reduced the model size from 22 M to 16 M, while achieving a detection speed of 138.8 FPS, which satisfies the real-time detection requirement. The proposed method strikes a balance between model size and detection precision, enabling it to meet agriculture’s tomato detection requirements. The research model in this paper will provide technical support for a tomato picking robot to ensure the fast and accurate operation of the picking robot.
1. Introduction
Tomatoes are among the most commonly cultivated vegetable fruits worldwide, with an annual worldwide production of over 170 million tons, and are often ranked first among vegetable crops [1]. China holds the first rank worldwide in fresh tomato production, while processed tomato production usually ranks second or third across the world. Despite the aging population and labor difficulties in China, tomato picking—an essential step in the production and sales chain—is mainly done manually, resulting in increased labor intensity, worsening of working conditions, and high costs in time and labor. Similar to the tomato, the potato is one of the five most important products grown in the world. Ünal et al. [2] believed that the potato has high application potential in intelligent agriculture and discussed the potential of intelligent agriculture technology in potato production, which inspired the research on the application of the tomato in intelligent agriculture. Moreover, tomato fruits are susceptible to damage, resulting in damage rates of up to 10% [3]. To address these issues, tomato harvesting automation technology has emerged [4]. Both domestic and international research on automatic fruit and vegetable harvesting are primarily centered on image recognition, positioning, and picking mechanisms that rely on automation through execution devices [5]. Improving the detection of tomatoes is an essential factor in enhancing the efficiency of tomato picking and storage transportation.
The early recognition of fruits depended on machine learning, which necessitated the design of bespoke features from humans and was a highly intricate process. Malik et al. [6] applied an improved methodology for hue, saturation, and value (HSV) color space and an enhanced watershed segmentation algorithm to find mature tomatoes placed in intricate backgrounds. Lin et al. [7] utilized the Hough transform technique coupled with support vector machines (SVMs) that rely on the color and texture properties of fruits to recognize them, and tomatoes were one of the fruits in the study. Zhang et al. [8] proposed a pomegranate identification approach that combines multiple attributes and support vector machines (SVM). Owing to the prompt advancement of computer technology, deep learning founded on convolutional neural networks (CNNs) has experienced significant improvements, developing superiority over traditional machine learning with regard to efficiency and precision. For example, Gulzar [9] based his study on the improved model of MobileNetV2 and applied transfer learning to achieve fruit image classification, achieving 99% precision, and concluded that transfer learning plays an important role in obtaining better results. This has led to a considerable enhancement in object detection proficiency utilizing deep learning [10,11,12,13], which has found ample implementation in agricultural domains.
Object detection algorithms are categorized into two types: two-stage object detection algorithms that generate candidate boxes and classify objects within, and one-stage object detection algorithms that avoid generating candidate boxes. The former includes algorithms such as R-CNN [14], Fast-RCNN [15], and Faster-RCNN [16], which exhibit high robustness with low error rates but require a long run time, making them unsuitable for real-time production. For instance, Zhu et al. [17] identified the flowering and fruiting stages of wolfberry with 74% mAP using the Faster R-CNN algorithm. Meanwhile, Wang et al. [18] enhanced the mAP of tomato fruits by incorporating the CBAM attention module and feature pyramid network to improve the performance of Faster R-CNN. Chu et al. [19] suppressed non-apple features produced by an improved Mask R-CNN to enhance the detection of apples under varying lighting conditions. On the other hand, one-stage object detection algorithms, which include SSD [20] and YOLO [21], have faster recognition speed while maintaining the same precision as the two-stage object detection algorithms, thereby meeting real-time requirements. For example, Peng et al. [22] increased the average detection precision of four fruits by two percentage points by using ResNet-101 to replace the VGG16 network in SSD. Furthermore, Liu et al. [23] attained 96.4% mAP for tomato positioning by using YOLOv3 to replace circular boundary boxes with traditional rectangular boundary boxes. Yang et al. [24] used K-means++ and the mean denoising method to identify cotton residue after harvesting, improving the precision of YOLOv3. Gai et al. [25] enhanced the mAP of detecting cherries by 15% by modifying the labeled boxes with DenseNet in YOLOv4. Zhou et al. [26] introduced RepGhost and ECA attention to YOLOv7 to propose a dragon fruit detection approach. Li et al. [27] achieved higher mAP by optimizing the YOLOv5 network for recognizing small tomato targets using the focus and cross-stage network and the EIOU loss function. Mamat et al. [28] proposed an image annotation enhancement technology for fruit classification based on deep learning methods to perform automatic annotation for agricultural images, which greatly solved the difficulties caused by a large number of unlabeled images.
Despite having strong detection precision, current detection methods using deep learning techniques still face several limitations, such as complex network structures, a large number of parameters, slow system running speeds, and high demand for GPU hardware. Hence, it is difficult for current practical harvesting equipment to support and meet the actual production needs. Furthermore, there is still a lack of research in detecting mature, immature, and rotten tomatoes. Therefore, this paper proposes an improved tomato recognition method based on the YOLOv8s algorithm, which incorporates attention mechanisms and other operations. The deployment of mobile devices is still in the laboratory stage and has not been tested in the field. The main contributions of this paper are as follows.
- Three kinds of tomato data images were obtained through internet resources and mobile phone photography.
- DSConv is used to replace some common convolution in the original network, reducing the calculation cost and speeding up the inference speed.
- In order to balance detection rate and feature extraction capability, a new dual-path gated attention module is deployed at the connection layer, allowing more detail to be preserved as low-level features are fused to high-level features.
- A feature enhancement module is proposed to construct a multi-branch structure by using conventional convolution and expansive convolution with different scales and quantities on multiple branches and to splice multi-channel feature maps, so as to improve the feature extraction capability of the network.
- In this dataset, we tested tomato detection using improved YOLOv8. We achieved 93.4% mAP with a substantially reduced computational effort and a 138.8 FPS. The model is reduced to 16 M, which is better than most of the current classical detection algorithms, including SSD, Faster R-CNN,YOLOv4, YOLOv5,YOLOv7.
2. Materials and Methods
2.1. Materials
2.1.1. Data Collection and Annotation
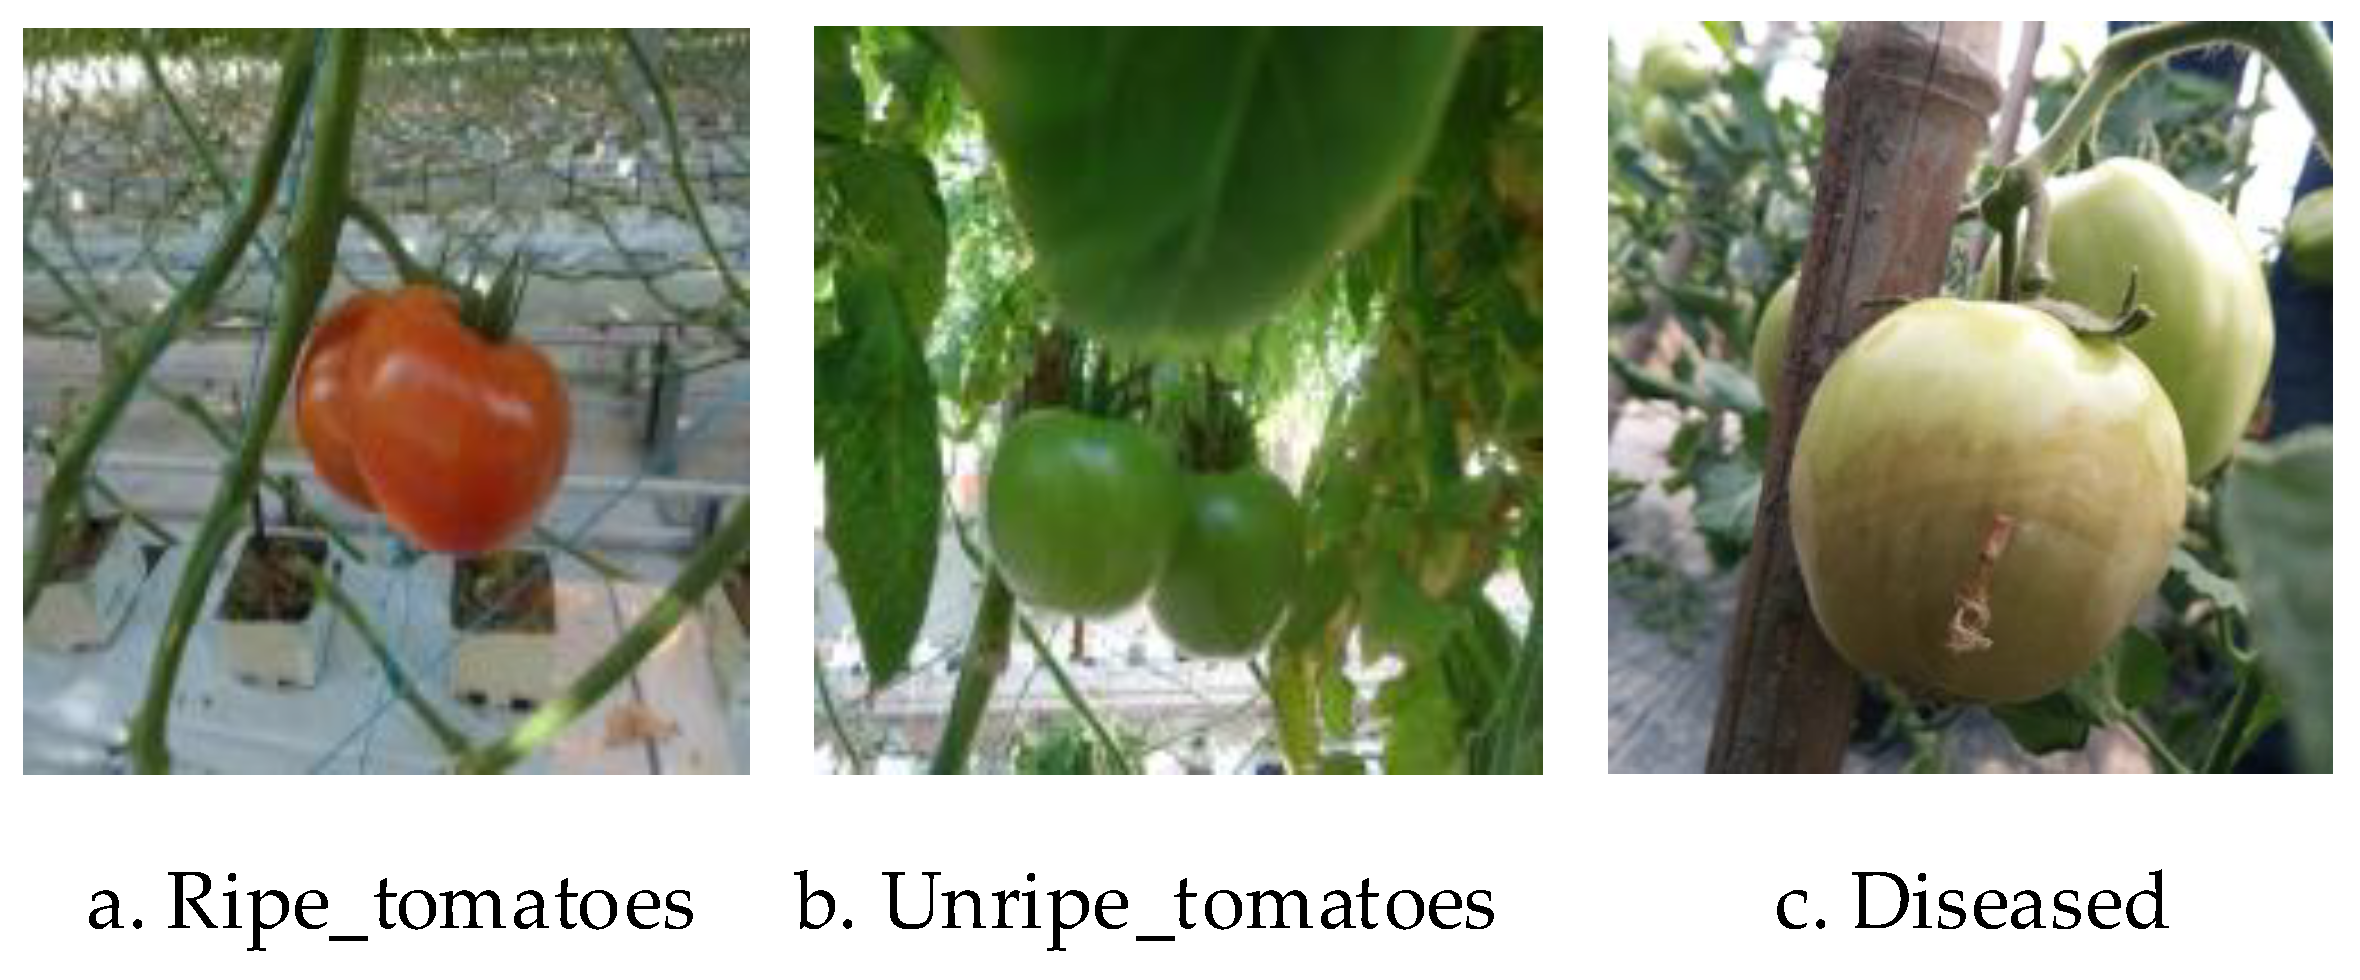
The dataset used in this study was divided into two parts: A portion of the tomato images consists of 722 photos captured in June 2022 within a tomato plantation located in Xin’an County, Luoyang City, Henan Province, using a Xiaomi 10 s smartphone. Another portion comprises 200 tomato images downloaded from the internet. Of the 922 images selected for this study, each image reflected various environmental conditions such as overlapping, occlusion, and adhesion. To annotate the tomato images, LabelImg image annotation software was used to manually label the rectangular regions. We categorized the target tomatoes into three categories: ripe_tomatoes, unripe_tomatoes, and diseased. The annotation files were saved in XML format and later converted to TXT format to use the YOLOv8 algorithm. Figure 1 shows a partial image of the dataset.
2.1.2. Offline Data Enhancement
Deep learning networks require a substantial amount of labeled data to extract features and learn. Noise and errors in the data set can negatively affect the performance of the model. If there is a large amount of mislabeled or inaccurate data in the data set, then the model may not be able to learn valid patterns. Overfitting can occur when the data set is limited, causing the network to focus excessively on noise and interference information in the image, leading to a decline in testing precision. This paper proposes offline data enhancement procedures, including the introduction of Gaussian noise, blurry images, randomly rotated images, and scaled images with differing mean and variance during training to enhance the model’s generalization capacity and robustness and thereby weaken the impact of overfitting. In this study, 500 annotated images were subjected to data augmentation, resulting in 2176 augmented images. The final dataset was divided into a training set, a validation set, and a testing set, with quantities of 2676, 200, and 222 images, respectively. Figure 2 includes examples of both original and enhanced pictures. Table 1 shows the change in the number of category labels before and after the enhancement.
2.2. Standard YOLOv8 Model
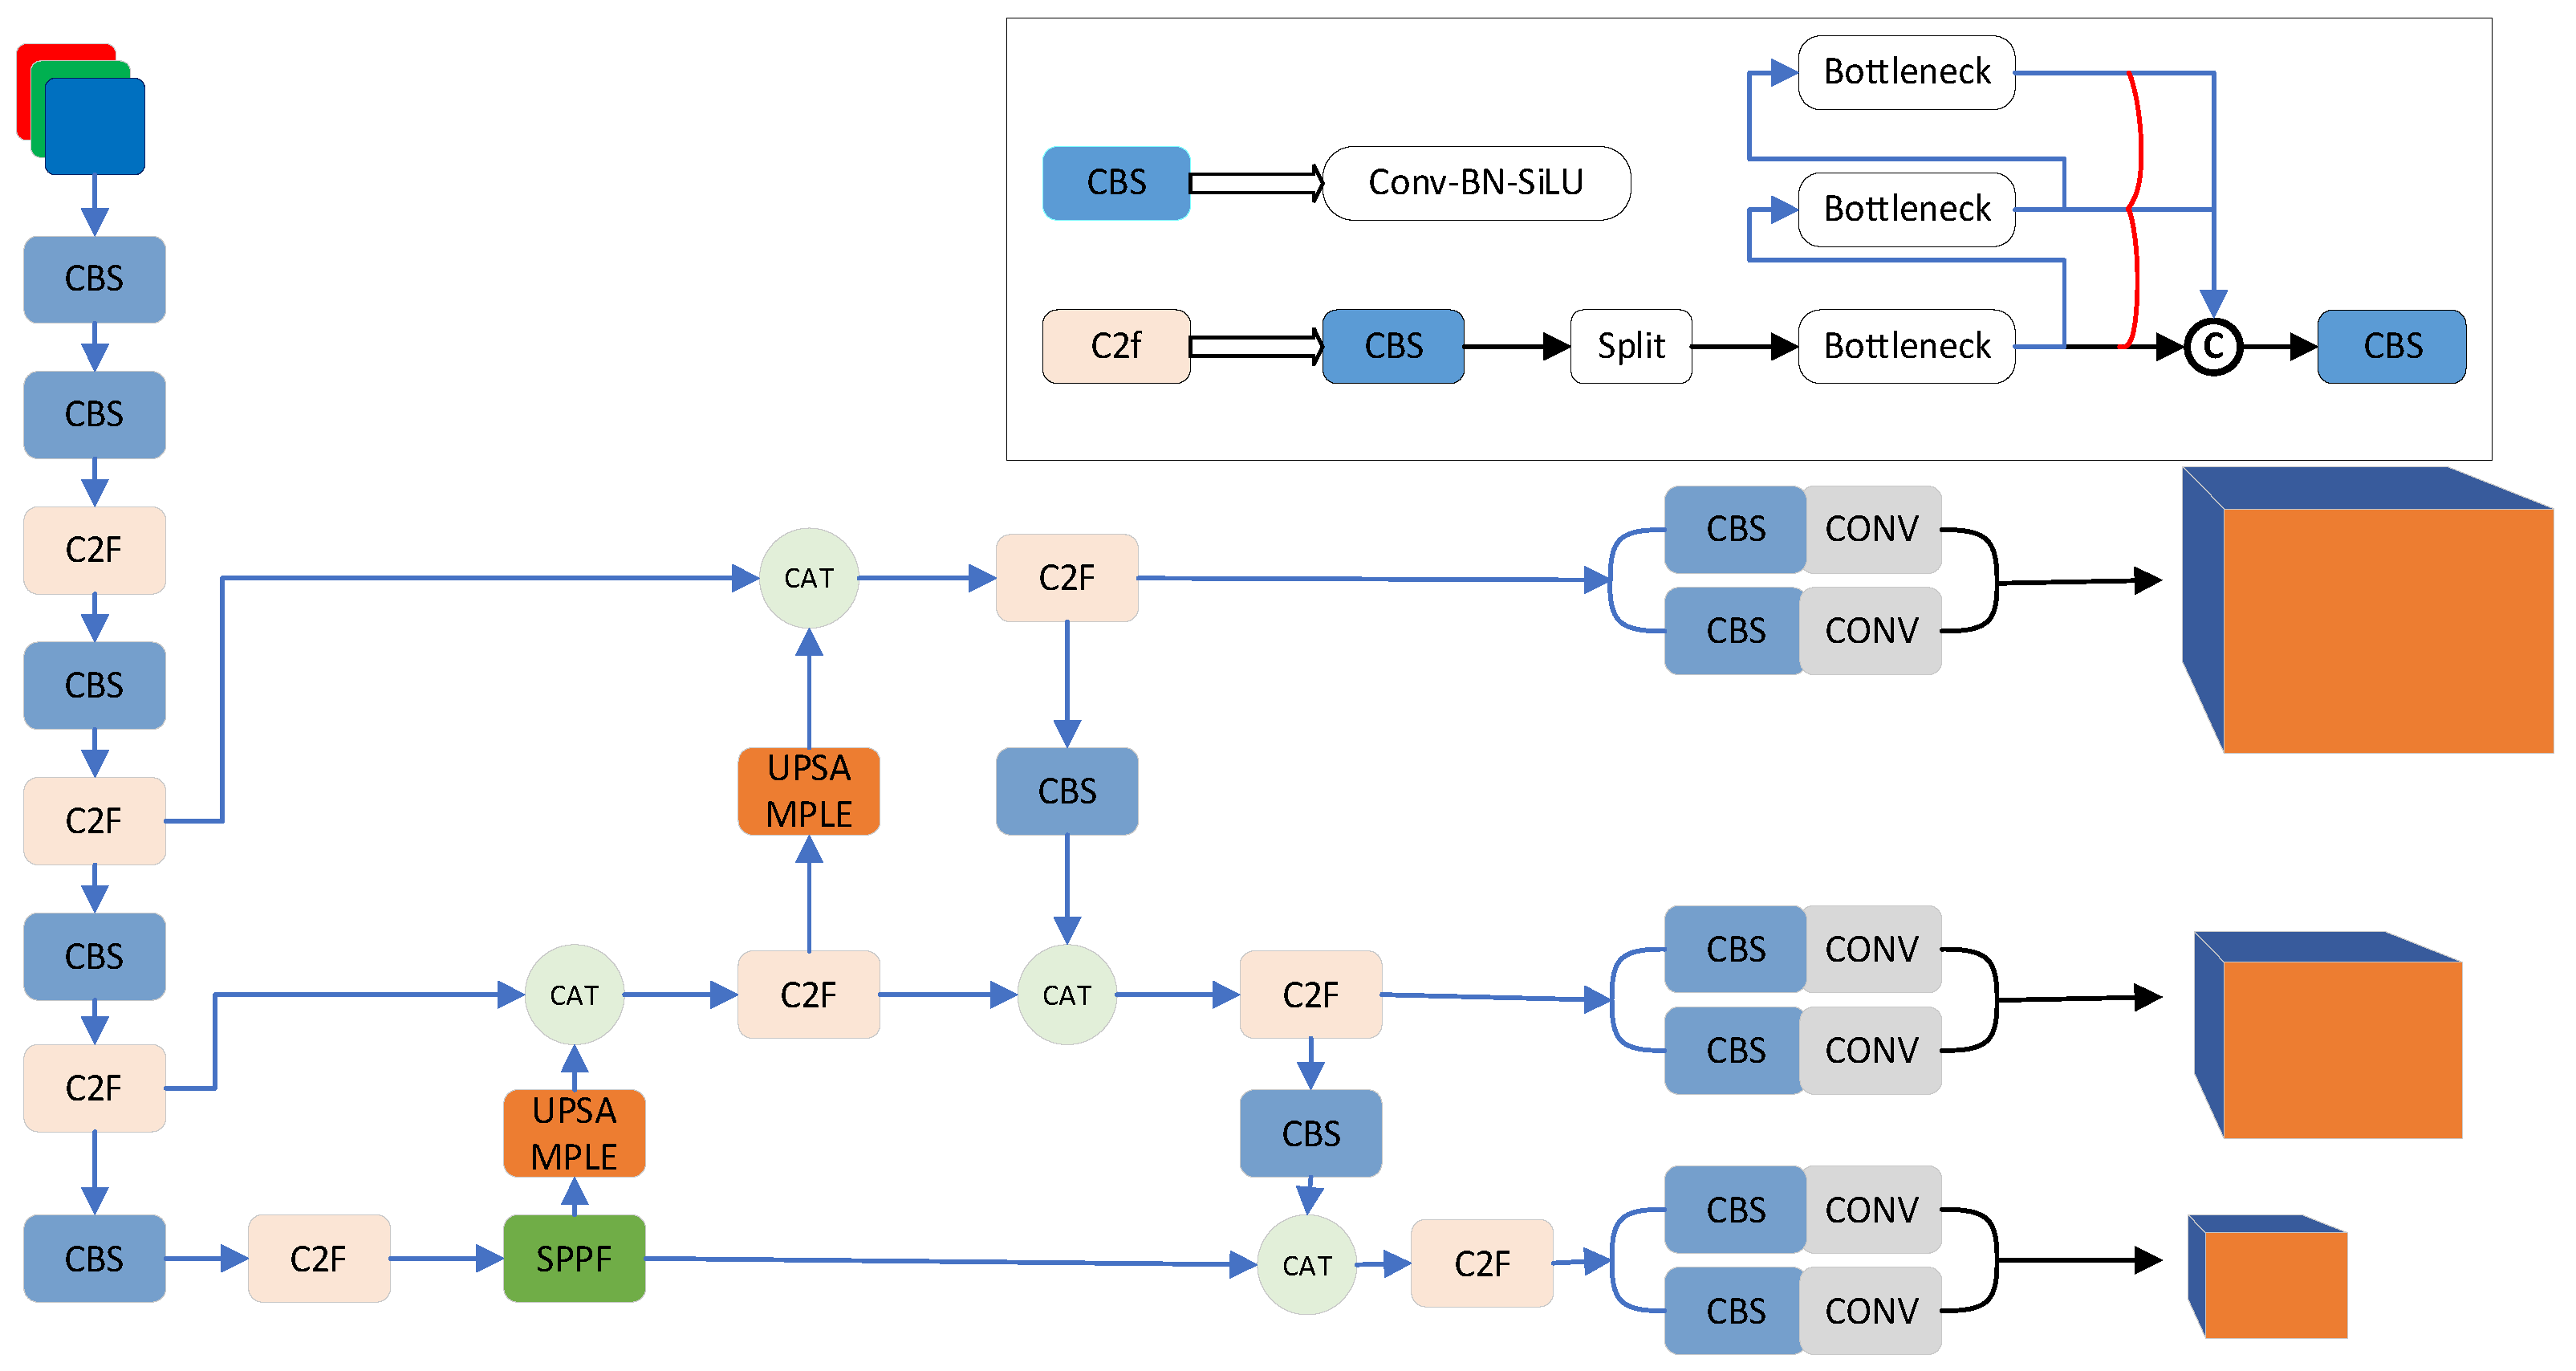
In this paper, lightweight YOLOv8s is selected. YOLOv8s is a lightweight parameter structure derived from the YOLOv8 algorithm. It comprises a backbone network, a neck network, and a prediction output head. The backbone network leverages convolutional operations to extract characteristics of various scales from RGB (Red Green Blue) color images. Meanwhile, the role of the neck network is to merge the features extracted by the backbone network. A feature pyramid structure (Feature Pyramid Networks, FPN) is typically implemented to aggregate low-level features into higher-level representations. The head layer is responsible for predicting the target category, and three sets of detection detectors with varying sizes are utilized for selecting and detecting the image contents. Figure 3 presents the structure of the standard YOLOv8 network.
2.3. Improved YOLOv8 Model
This paper proposes an improved object detection model (Figure 4) for fast and accurate tomato detection in natural environments. The depthwise separable convolution (DSConv) is used to replace the common convolution in backbone and neck parts of the original network, reducing the model size and improving the inference speed. The specific change information is shown in Figure 4, which is clearly different from Figure 3. In addition, a dual-path attention gate (DPAG) is introduced to the network to overcome the weakness of lightweight neural networks in feature extraction. Moreover, the model incorporates a feature enhancement module (FEM) to facilitate the network in extracting more delicate target features. All improvements are indicated in the red dashed box in Figure 4.
2.3.1. Depthwise Separable Convolutions
Traditional convolution applies a convolutional kernel to each channel of the input feature map and adds the convolution results for each channel to create a single output feature map. This process is repeated across all channels of the input feature map to create multiple output feature maps. In contrast, depthwise separable convolution consists of two steps. First, the depthwise convolution is performed, in which each channel of the input feature map is convolved independently using a corresponding convolutional kernel, resulting in an intermediate feature map with the same number of channels as the input feature map. Then, in the pointwise convolution step, a 1 × 1 convolutional kernel is applied to each channel of the intermediate feature map, resulting in the final output feature map. The main advantage of depthwise separable convolution is the significant reduction in the number of parameters and computational complexity. As compared to ordinary convolution, depthwise separable convolution can notably decrease the computational cost while maintaining similar performance. Thus, depthwise separable convolution is preferred for mobile and edge computing devices, which have limited computational power and memory. Figure 5 presents the structure of the DSConv module schematic.
2.3.2. Integrated Dual-Path Gated Attention Module
The attention module has significantly impacted the field of deep learning, enabling advanced techniques in channel attention like the SE-Net [29], in channel and spatial dual attention such as CBAM [30], and non-local techniques [31] that emphasize global information of feature maps. Detection of pests greatly varies within this dataset with changing image sizes and uneven lighting; thus, comprehensive capturing of both channel and spatial information in the feature map is equally important. To improve the edge detection performance, we consider the attention gate AGs [32], which inspired the placement of an attention module in the connection layer. This preserves a great number of details in the fusing of low-level features into higher-level features. The addition of a dual-path attention mechanism in the neck connection layer (Concat) balances detection speed and feature extraction capacity.
DPAG, an acronym for dual-path attention gate module, merges the potentials of both the AGs and CBAM attention modules. It innovatively introduces an additional pathway on the channel layer, boosting the information extraction. DPAG integrates two continuous attention mechanisms, namely the Branch Channel Attention Module (BCAM) and the Channel Attention Module (CAM); the former enables dual-path channel attention, while the latter learns image location information. The BCAM and CAM interact closely to extract channel and spatial features, wherein the BCAM augments channel relevance and feature precision through channel relation gates and position relation gates, and the CAM locates entities by grasping spatial information. Through the process of feature absorption and refinement by DPAG, pixels obtain individual weights that identify their essentiality according to the weight value. This, in turn, enforces efficiency in feature utilization and recognition capabilities.
We denote the element-wise summation operation as “+” (element-wise summation), the element-wise multiplication operation as “×” (element-wise production), and the channel-wise summation as “⊕” (concatenation), denoted as C. The operation of channel attention BCAM is as follows: the transmitted feature maps are respectively processed by standard convolution Conv3 and Conv5, and then the two are merged to obtain the shallow convolutional layer denoted as . The reshaped row and column information is multiplied and added after global average pooling (GAP) to obtain the feature map, which is then passed through a Softmax layer to obtain a set of learning weights denoted as . The learned weights are multiplied and added with the standard convolution Conv and RepConv to obtain the channel attention output denoted as . The spatial attention CAM is based on the output of channel attention, using average pooling (Avgpool) and maximum pooling (Maxpool). The intermediate quantity is obtained by concatenating Avgpool and Maxpool. After a 1 × 1 convolution and a sigmoid layer, the final spatial attention is obtained as . Its formula is as follows:
The structure of the DPAG module is shown in Figure 6.
2.3.3. Built Feature Enhancement Module
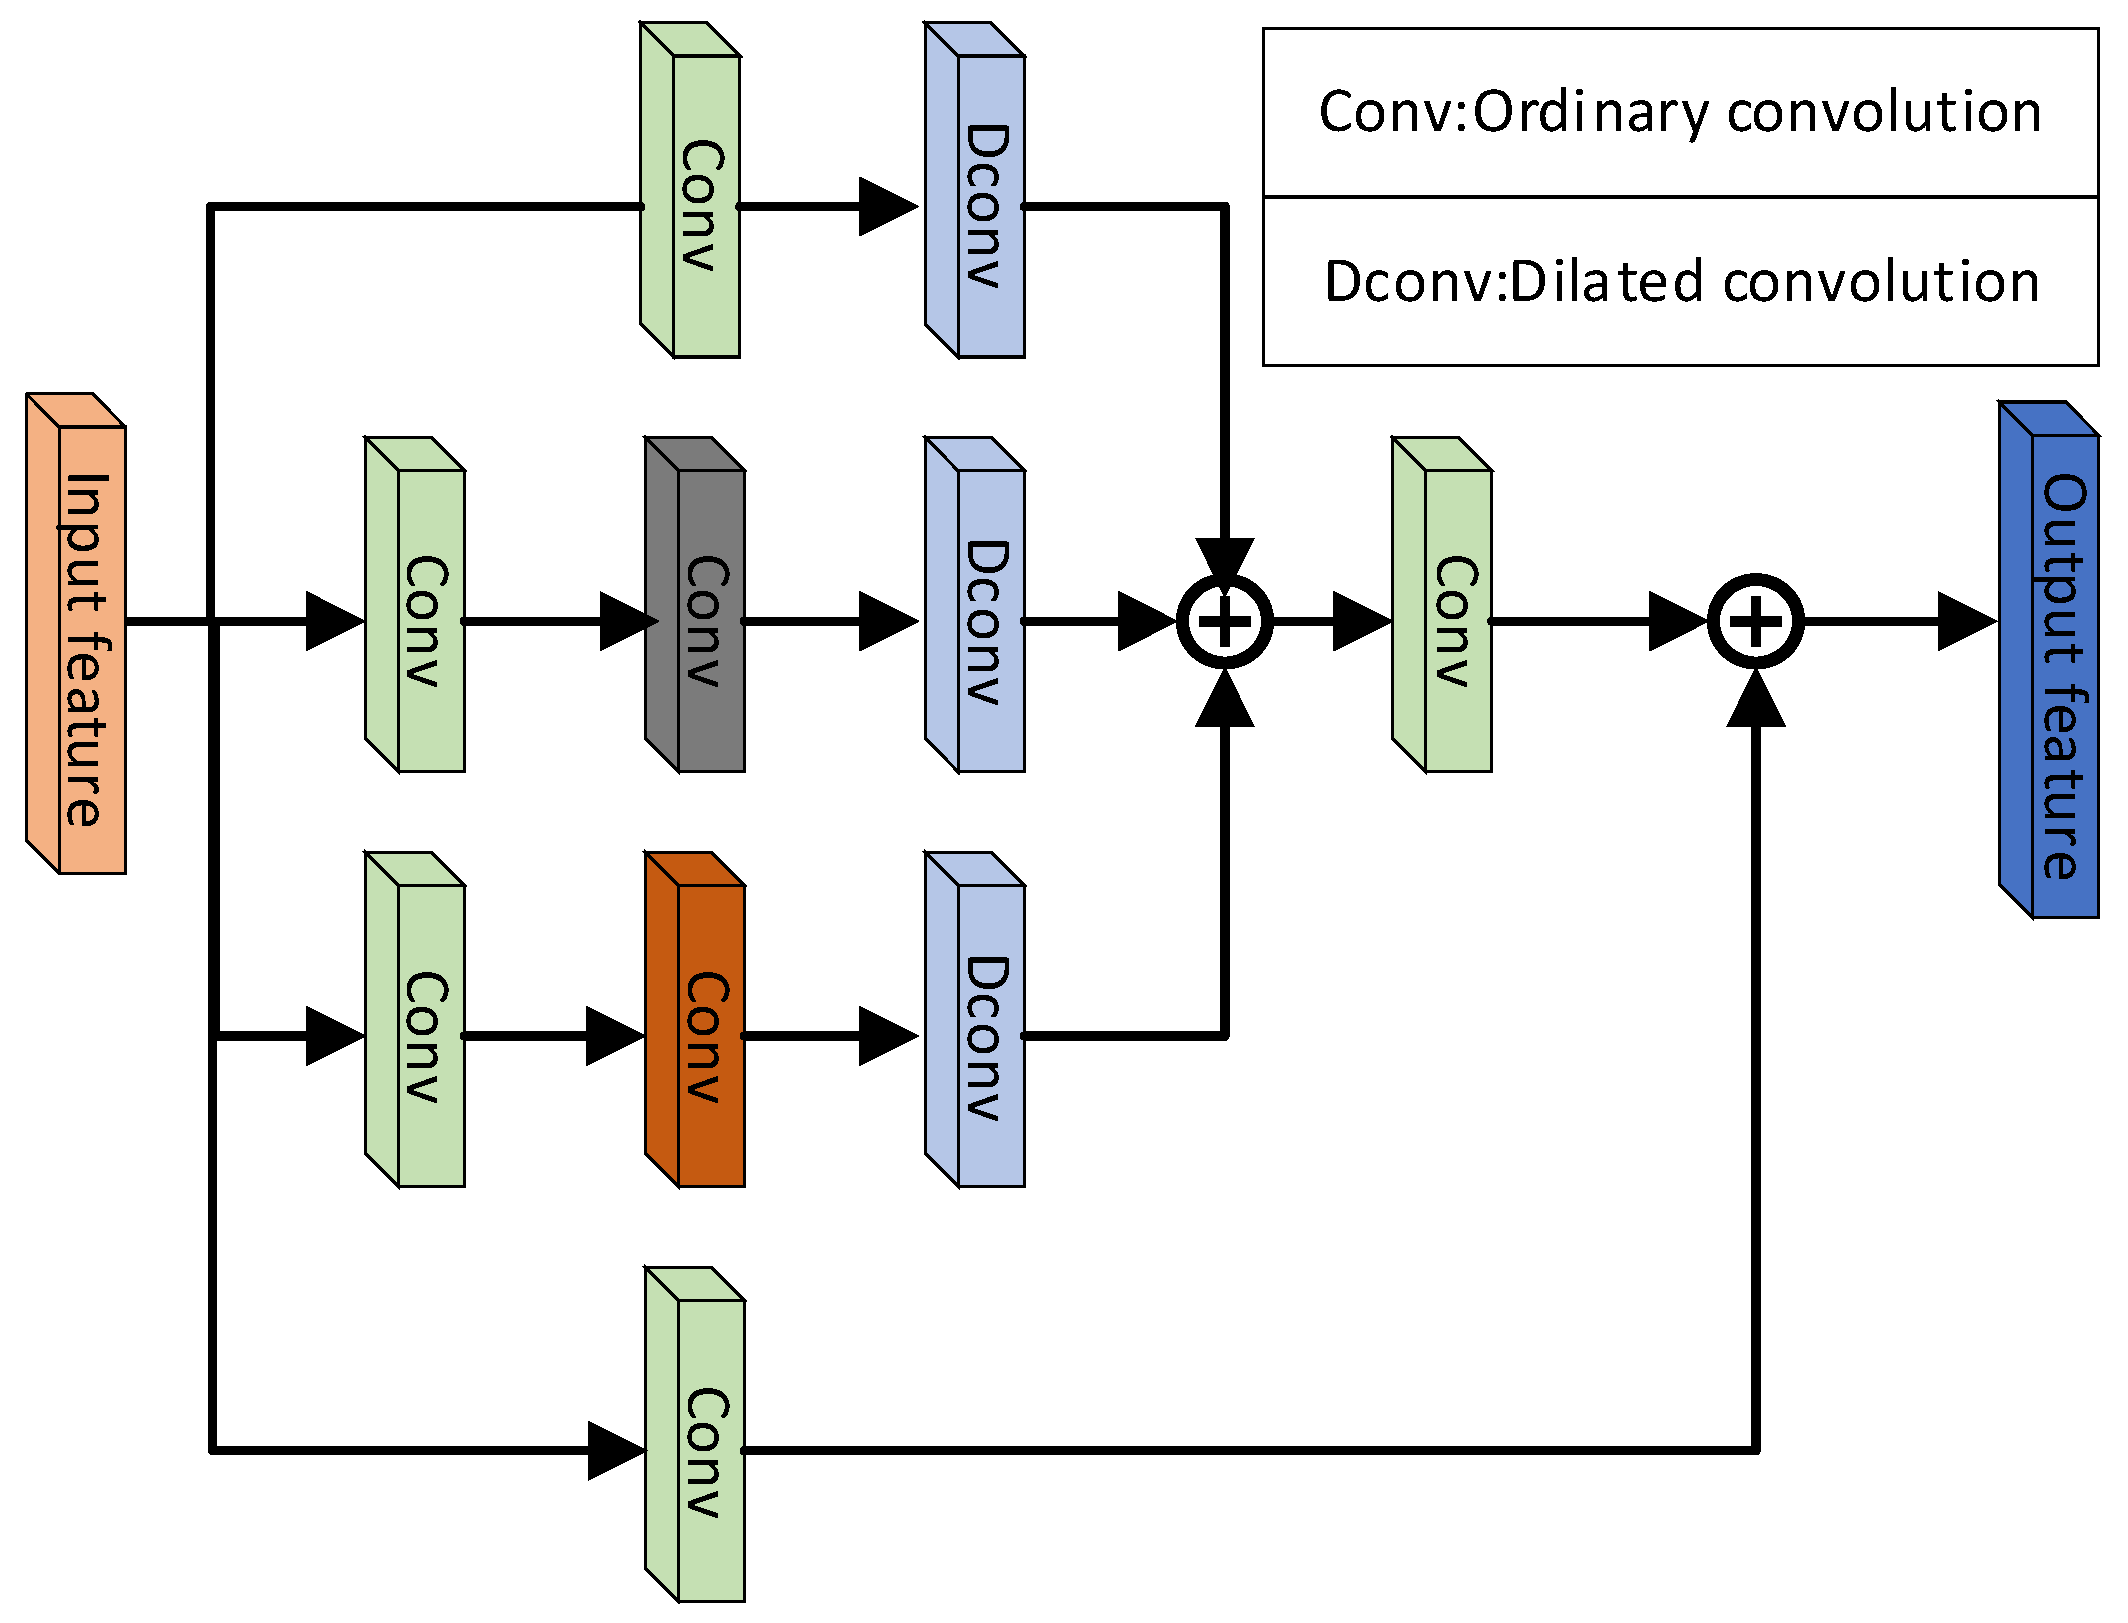
Feature maps are used in neural networks to predict targets. The amount of information contained in a feature map has a direct effect on the prediction output, while the main network has a limited ability to extract features. In the early stages of the network, the feature map processing is inadequate, leading to a dearth of semantic information in the low-level feature map. This, in turn, lowers the receptive field’s size and results in limited adaptability for detecting small objects. We propose a feature enhancement module called FEM that expands network width horizontally by constructing a multi-branch structure using various convolutions and scales on multiple branches to concatenate multi-channel feature maps. The FEM improves the network’s adaptability, sensitivity, and receptive field for detecting objects with small sizes. To enhance the network’s feature extraction ability, FEM modules are included in the main network to extract global features that work collaboratively with the previous convolutional layers to improve the detection performance. Additionally, the middle two branches incorporate dilated convolutional layers to widen the receptive field and increase contextual information, thereby improving the features’ effectiveness. Figure 7 presents the FEM, which is composed of four branches. The first three branches perform a 1 × 1 convolutional operation to process and regulate the number of feature map channels for further processing. The fourth branch incorporates a residual structure that generates an equivalent map at the output, preserving high-quality features that are effective for detecting small targets. The remaining three branches consist of cascaded 3 × 3 conventional and dilated convolutions, fetching finer granularity target features with convolutions of various scales. The FEM’s computation process is presented below:
The symbols in the formula can be explained as follows. The conventional convolution operation with kernel sizes of and is respectively represented by and . The operation of dilated convolution with dilation rates of 1, 3, and 5 is represented by , , and , respectively. The symbol “Concat” represents the operation of feature map concatenation, and the symbol “⊕” represents the operation of element-wise feature map summation. Furthermore, represents the input feature map, while, , , and respectively represent the feature maps obtained by the first three branches after performing conventional and dilated convolutions. Finally, represents the enhanced feature map. The feature enhancement module processes the low-level feature map of the primary network. It not only preserves the resolution but also improves the network’s ability to extract target features under occlusion and overlap. Figure 7 presents the structure of the FEM structure diagram.
2.4. Training Equipment and Parameter Setting
2.4.1. Experimental Environment and Parameter Adjustment
The experimental operating system utilized in this study is Windows 10, with PyTorch serving as the framework for the deep learning models developed. Specific details regarding the experimental environment are outlined in Table 2. During the training phase, optimization was achieved through the use of stochastic gradient descent (SGD), which employed an initial learning rate of 0.01, a cosine annealing hyperparameter of 0.1, a momentum factor of 0.937, and a weight decay coefficient of 0.0005. Input images were standardized to a size of 640 × 640, and batch size was set to 16, with training being conducted across 300 epochs.
2.4.2. Model Evaluation Indicators
This study utilized precision (P), recall (R), and mean average precision (mAP) as accuracy evaluation indicators. Specifically, P represents the ratio of the predicted algorithm area to the actual detection area, while R indicates the proportion of accurately predicted categories to the total number of required categories. MAP calculates the accuracy of the overall sample whose predicted box exceeds 50% of the actual box. Higher mAP values suggest higher prediction precision. Additionally, this study utilized inference time and network parameter volume as performance indicators. Shorter inference time suggests better real-time performance, while decreased model size indicates lower memory usage. The number of true positive samples is identified as TP, the number of false positive samples as FP, the total number of samples as N, and the number of detected tomato categories in this study as Q. The average precision of the i-th class can be represented by . The following formula is employed for calculation:
3. Results
3.1. Comparison of Ablation Experiments
To assess the effectiveness of the improved algorithm, this study designed five sets of ablation experiments, utilizing the same equipment and dataset for training and testing in order to ensure comparability. These five experiments consisted of the original YOLOv8s, YOLOv8s with DSConv, YOLOv8s with DPAG, YOLOv8s with FEM, and the proposed comprehensive method. Experimental findings are presented in Table 3.
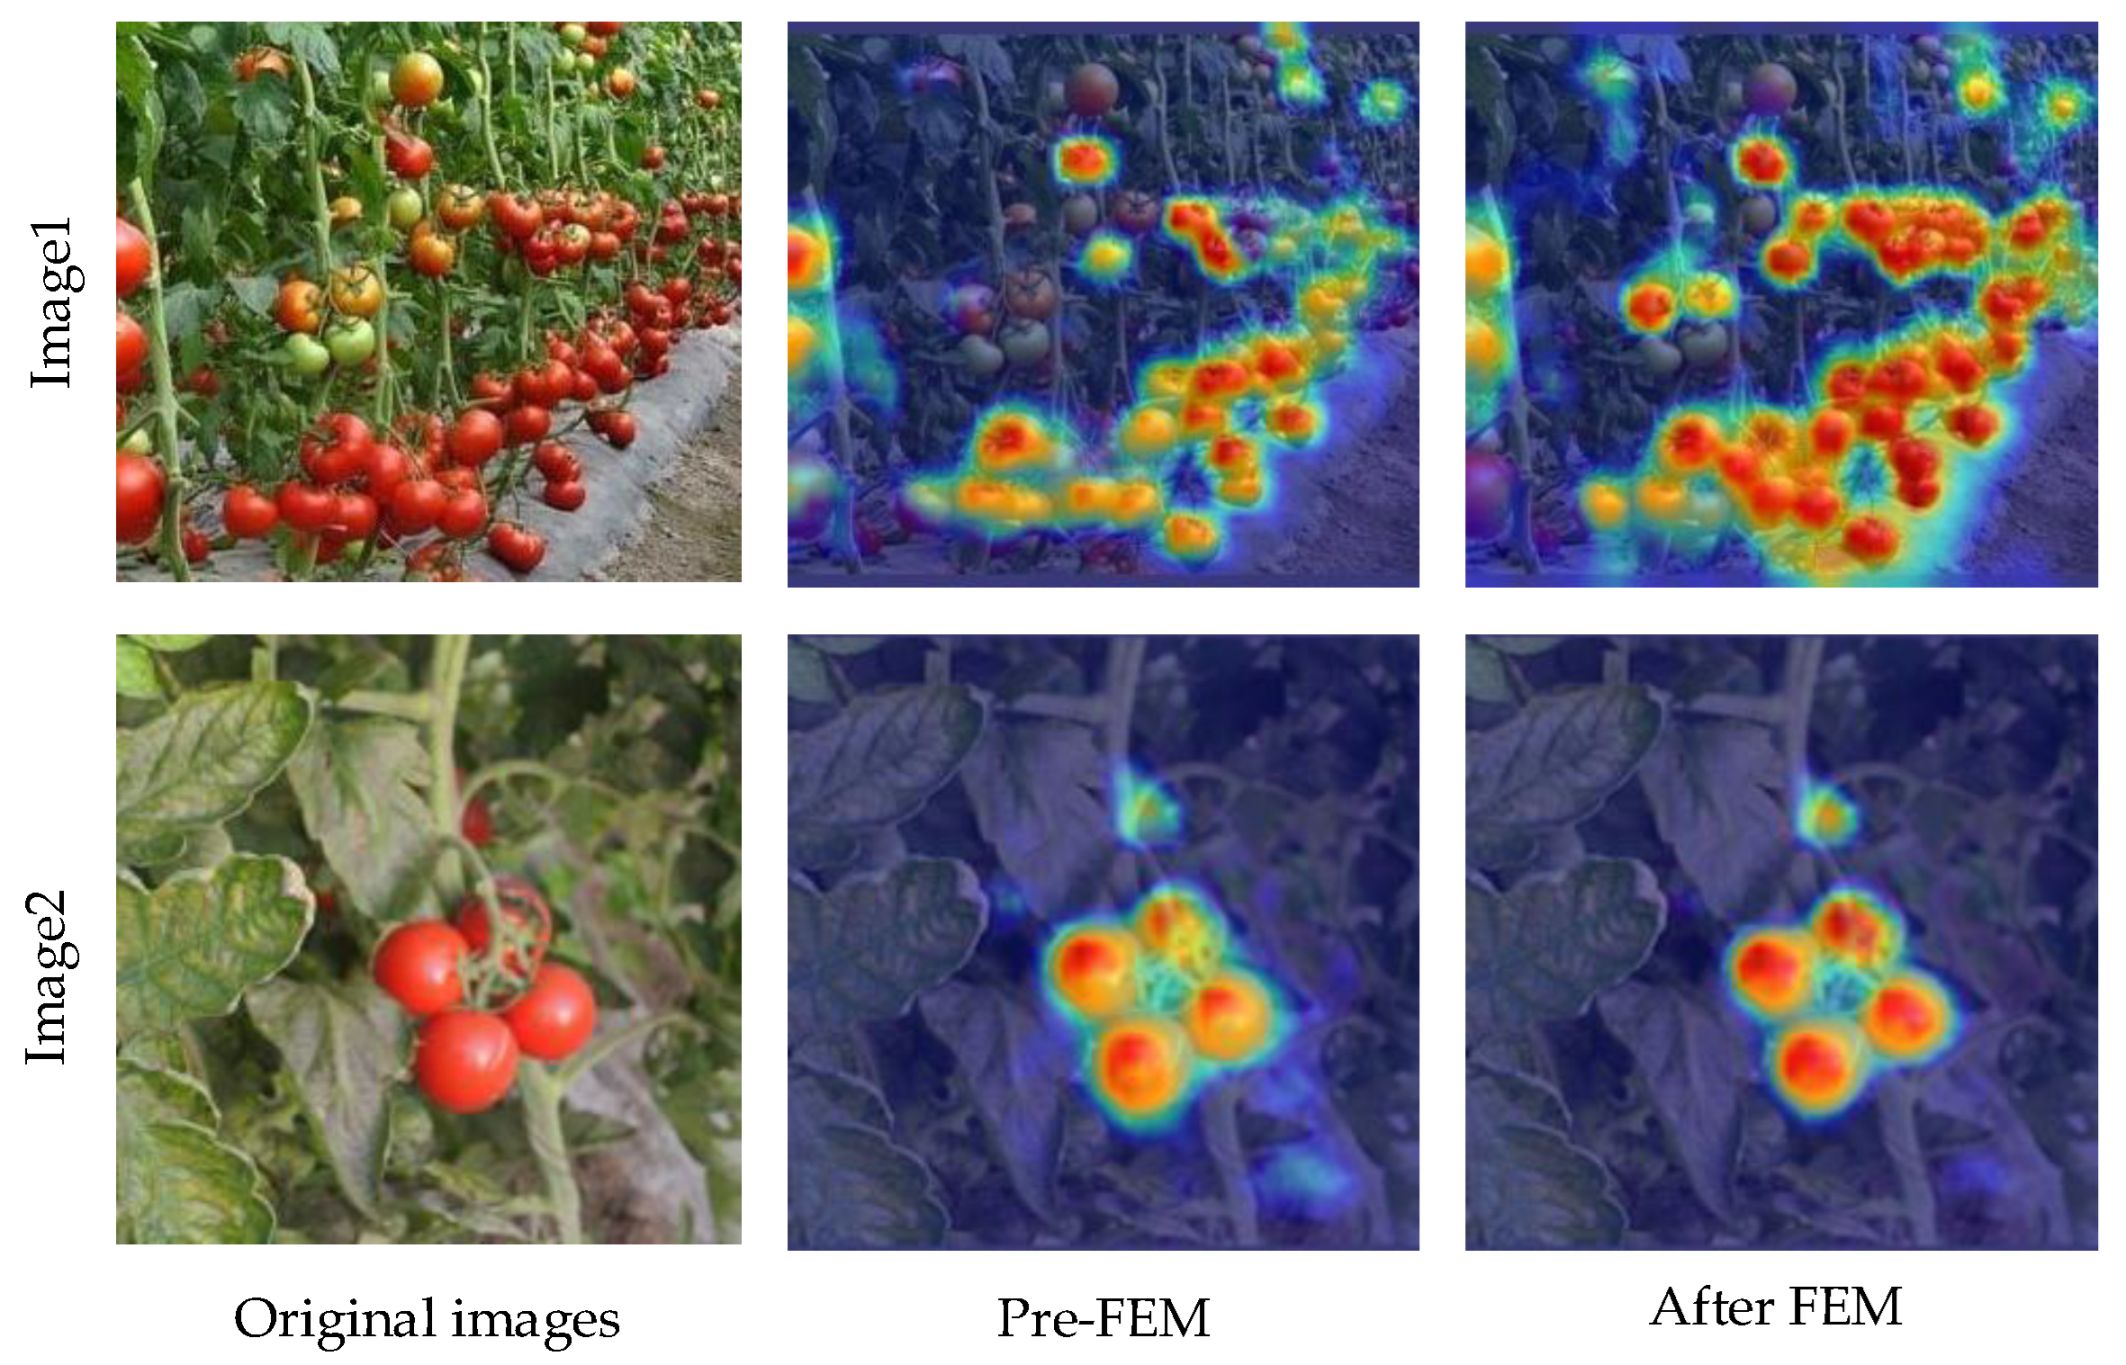
Table 3 illustrates that while DSConv may lower the detection precision and recall rate of the algorithm, it can significantly reduce the model’s weight and increase the inference speed, facilitating the deployment of the subsequent model effectively. Moreover, the addition of the DPAG module led to a rise in the model’s mAP from its original 91.9% to 92.8%, further resulting in a precision increase from 92.5% to 93.1%. These observations suggest a clear improvement in the original model. In contrast, although the FEM improvement module slightly augments the network’s inference time, it leads to a substantial improvement in the algorithm’s mAP, with the test set’s mAP registering an increase from 91.9% to 93.1%. Figure 8 depicts a visual comparison of the heat map of some detection findings prior to and following the addition of the FEM module.
Among the five network models compared in this study, the final improved YOLOv8s is found to exhibit the best overall detection performance. Compared to the original YOLOv8s network, the improved network manifests an enhancement in terms of p-value by 2% and an increase in mAP by 1.5%. The conversion of the frame rate demonstrated that the original YOLOv8s was at 151.5 FPS, while the improved network was at 138.8 FPS.
YOLOv8 losses included classification loss (VFL Loss) and regression loss (CIOU Loss + Distribution Focal loss (DFL)), and the three losses were weighted by a certain weight ratio. The three formulas are as follows:
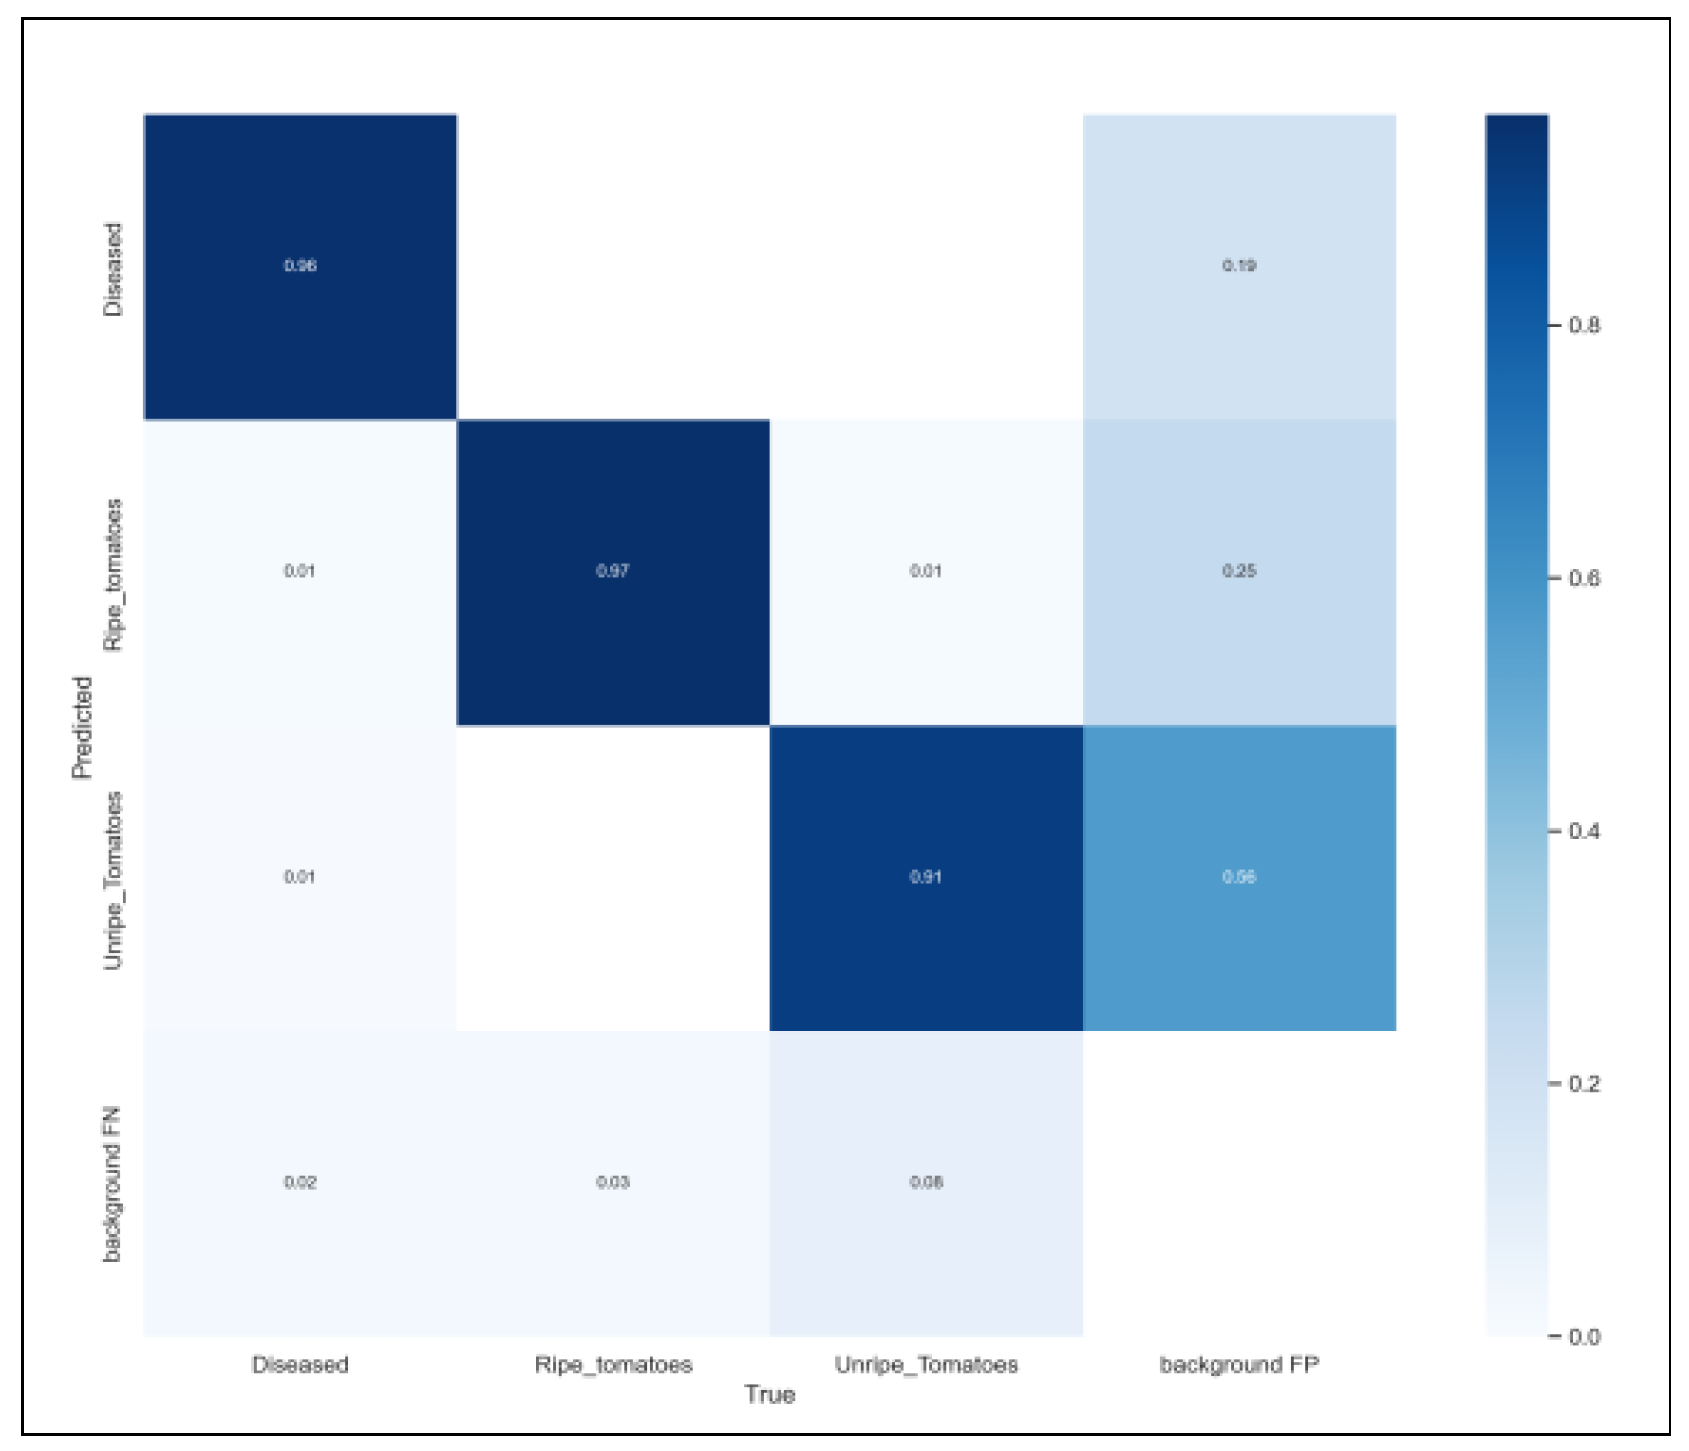
where q is lable, IoU is the intersection ratio, b and represent the center point of the two rectangular boxes, represents the Euclidean distance between the two rectangular boxes, c represents the diagonal distance of the closure area of the two rectangular boxes, is used to measure the consistency of the relative proportion of the two rectangular boxes, is the weight coefficient, y is the general distribution value, i represents the number, , and .The loss curves and mAP curves of the five models are shown in Figure 9. Confusion matrices can be found in Figure 10.
To showcase the detection outcomes of the proposed algorithm in this study, we have randomly chosen images from the test subset for comparative purposes. The results are depicted in Figure 11, where the highlighted area represents the detection outcome of the network. The text located atop the box indicates the type of tomato that the model identified, and the number denotes the confidence level of the detection. As per the experimental results, it is evident that the standard YOLOv8 model failed to detect an object in the image (purple box in Figure 11). This omission occurred because the tomato within that box was partly obstructed by the overlapping leaves, which completely concealed its appearance. After conducting numerous tomato comparison tests, we noticed that the two targets within the purple box correspond to the objects that the unoptimized model failed to detect due to their high overlap with the image and masking of the tomato. The introduction of FEM resulted in improved sensitivity and adaptability of the network to small object detection by expanding the receptive field. The incorporation of DPAG enhanced feature recognition ability and utilization efficiency, thus reducing missed detections. With the inclusion of DSConv in the model’s lightweight optimization, deployment has become relatively easier. The enhanced YOLOv8 exhibits higher detection ability and confidence level than the standard YOLOv8 in some instances, although it still encounters some missed detections, thus requiring further optimization strategies to fulfill practical detection needs.
3.2. Comparison of Detection Performance between Different Models
In order to compare the efficiency of the proposed improved algorithm in this paper, we selected Faster R-CNN, SSD, YOLOv4, YOLOv5, and YOLOv7 for conducting comparative experiments. These experiments were conducted using the same device, dataset, and data augmentation methods, while maintaining equal proportions between the training and test sets. The experiments were conducted for 300 iterations, and the optimal results were selected for testing purposes. The comparative data for precision, recall rate, mAP, frame rate, and model size are presented in Table 4.
It can be observed from Table 4 that the algorithm proposed in this paper exhibits remarkable mAP, reaching up to 93.4% under the same experimental setting. However, Faster R-CNN (80.8%), SSD (76.7%), YOLOv4 (88.4%), YOLOv5 (91.2%), YOLOv7 (91.6%), and the standard YOLOv8(91.9%) display significant differences in terms of mAP, in comparison. The detection rate of the improved YOLOv8 is 138.8FPS, satisfying real-time detection requirements. In contrast, neither the Faster R-CNN nor SSD meet the real-time requirements, while YOLOv4, YOLOv5, and YOLOv7 prove to be relatively weaker in this regard. Moreover, the proposed improved algorithm model in this paper has a size of 16.1 MB, which is considerably smaller than both Faster R-CNN and SSD models and only slightly larger than the YOLOv5 model yet performing better in terms of detection precision and frame rate. Conclusively, the proposed algorithm not only fulfills the real-time detection requirements but also improves the detection precision, minimizes the model size, and offers higher universality and practical value.
4. Conclusions
This paper investigated the detection of tomatoes in their natural environment and proposed an improved YOLOv8 algorithm for tomato detection. The algorithm’s feature extraction and representation capabilities were enhanced by introducing the FEM module, despite a slight reduction in detection speed due to complicated background interference. Incorporating the DPAG module offered better feature fusion and relieved the issue of inconsistent tomato detection density, resulting in an overall improvement in detection performance. Furthermore, optimizing the model using the DSConv module enhanced the detection ability significantly. The main conclusions of this paper are summarized as follows:
(1) In the ablation experiment, the improved YOLOv8 tomato network’s mAP increased by 1.5% with mAP of 93.4% when tested. Compared to the original YOLOv8 network, the improved model showed considerable improvement in all essential indicators. Additionally, the improved model demonstrated more dependable performance in tomato detection, showing a lower missed detection rate and higher mAP in comparison to other models.
(2) In the tomato dataset experiment, the improved YOLOv8 model was compared with Faster-RCNN, SSD, YOLOv4, YOLOv5, YOLOv7 and the unimproved YOLOv8 network. The test results showed that the improved YOLOv8 model achieved a balanced performance in model size, mAP, and detection frame rate. The model had a size of 16.1 MB, mAP of 93.4%, and a frame rate of 138.8 FPS, fulfilling the requirements for real-time agricultural detection.
The experimental results show that this model has great application potential in tomato detection. In the future, the improved YOLO could be combined with intelligent patrol picking robots to enable efficient and quality picking by using an AI-based tomato detection system.
Author Contributions
Conceptualization, G.Y. and J.W.; methodology, G.Y. and J.W.; software, G.Y.; validation, J.W. and Z.N.; formal analysis, H.Y. and S.Y.; investigation, H.Y. and S.Y.; resources, G.Y. and J.W.; data curation, Z.N.; writing—original draft preparation, G.Y. and J.W.; writing—review and editing, Z.N. and H.Y.; visualization, S.Y.; supervision, G.Y.; project administration, J.W. All authors have read and agreed to the published version of the manuscript.
Funding
This research was funded by the Science and Technology Program of Jiangxi Provincial Education Department, grant number GJJ190450, and the Science and Technology Project of the Education Department of Jiangxi Province, grant number GJJ180484.
Data Availability Statement
The data presented in this study are available on request from the cor-responding author. The data are not publicly available due to the privacy policy of the organization.
Acknowledgments
The main author expresses sincere gratitude to the School of Electrical Engineering and Automation, Jiangxi University of Science and Technology, for supplying the essential equipment. The unavailability of these tools would have hindered the completion of this study. We also extend our appreciation to the anonymous reviewers for their invaluable input.
Conflicts of Interest
The authors declare no conflict of interest.
References
- Costa, J.M.; Heuvelink, E.P. The global tomato industry. In Tomatoes; CABI: Wallingford, UK, 2018; pp. 1–26. [Google Scholar]
- Ünal, Z.; Kızıldeniz, T. Smart agriculture practices in potato production. In Potato Production Worldwide; Academic Press: Cambridge, MA, USA, 2023; pp. 317–329. [Google Scholar]
- Tiwari, I.; Shah, K.K.; Tripathi, S.; Modi, B.; Shrestha, J.; Pandey, H.P.; Bhattarai, B.P.; Rajbhandari, B.P. Post-harvest practices and loss assessment in tomato (Solanum lycopersicum L.) in Kathmandu, Nepal. J. Agric. Nat. Resour. 2020, 3, 335–352. [Google Scholar] [CrossRef]
- Benavides, M.; Cantón-Garbín, M.; Sánchez-Molina, J.A.; Rodríguez, F. Automatic tomato and peduncle location system based on computer vision for use in robotized harvesting. Appl. Sci. 2020, 10, 5887. [Google Scholar] [CrossRef]
- Bai, Y.; Mao, S.; Zhou, J.; Zhang, B. Clustered tomato detection and picking point location using machine learning-aided image analysis for automatic robotic harvesting. Precis. Agric. 2023, 24, 727–743. [Google Scholar] [CrossRef]
- Malik, M.H.; Zhang, T.; Li, H.; Zhang, M.; Shabbir, S.; Saeed, A. Mature tomato fruit detection algorithm based on improved HSV and watershed algorithm. IFAC-PapersOnLine 2018, 51, 431–436. [Google Scholar] [CrossRef]
- Lin, G.; Tang, Y.; Zou, X.; Cheng, J.; Xiong, J. Fruit detection in natural environment using partial shape matching and probabilistic Hough transform. Precis. Agric. 2020, 21, 160–177. [Google Scholar] [CrossRef]
- Zhang, C.; Zhang, K.; Ge, L.; Zou, K.; Wang, S.; Zhang, J.; Li, W. A method for organs classification and fruit counting on pomegranate trees based on multi-features fusion and support vector machine by 3D point cloud. Sci. Hortic. 2021, 278, 109791. [Google Scholar] [CrossRef]
- Gulzar, Y. Fruit image classification model based on MobileNetV2 with deep transfer learning technique. Sustainability 2023, 15, 1906. [Google Scholar] [CrossRef]
- Afonso, M.; Fonteijn, H.; Fiorentin, F.S.; Lensink, D.; Mooij, M.; Faber, N.; Polder, G.; Wehrens, R. Tomato fruit detection and counting in greenhouses using deep learning. Front. Plant Sci. 2020, 11, 571299. [Google Scholar] [CrossRef]
- Moreira, G.; Magalhães, S.A.; Pinho, T.; dos Santos, F.N.; Cunha, M. Benchmark of Deep Learning and a Proposed HSV Colour Space Models for the Detection and Classification of Greenhouse Tomato. Agronomy 2022, 12, 356. [Google Scholar] [CrossRef]
- Mu, Y.; Chen, T.-S.; Ninomiya, S.; Guo, W. Intact Detection of Highly Occluded Immature Tomatoes on Plants Using Deep Learning Techniques. Sensors 2020, 20, 2984. [Google Scholar] [CrossRef]
- Magalhães, S.A.; Castro, L.; Moreira, G.; dos Santos, F.N.; Cunha, M.; Dias, J.; Moreira, A.P. Evaluating the Single-Shot MultiBox Detector and YOLO Deep Learning Models for the Detection of Tomatoes in a Greenhouse. Sensors 2021, 21, 3569. [Google Scholar] [CrossRef]
- Wu, J.; Kuang, Z.; Wang, L.; Zhang, W.; Wu, G. Context-aware RCNN: A baseline for action detection in videos. In Proceedings of the Computer Vision–ECCV 2020: 16th European Conference, Glasgow, UK, 23–28 August 2020; Springer International Publishing: Cham, Switzerland, 2020. Part XXV 16. pp. 440–456. [Google Scholar]
- Jiang, L.; Chen, J.; Todo, H.; Tang, Z.; Liu, S.; Li, Y. Application of a fast RCNN based on upper and lower layers in face recognition. Comput. Intell. Neurosci. 2021, 2021, 9945934. [Google Scholar] [CrossRef]
- Hu, B.; Wang, J. Detection of PCB surface defects with improved faster-RCNN and feature pyramid network. IEEE Access 2020, 8, 108335–108345. [Google Scholar] [CrossRef]
- Zhu, Y.N.; Wang, Z.; Yang, Y.; Li, J.P.; Wan, C.; Jin, H.W.; Fang, F. Automatic Identification Technology of Lycium barbarum Flowering Period and Fruit Ripening Period Based on Faster R-CNN. Chin. J. Agrometeorol. 2020, 41, 668. [Google Scholar]
- Wang, P.; Niu, T.; He, D. Tomato young fruits detection method under near color background based on improved Faster R-CNN with attention mechanism. Agriculture 2021, 11, 1059. [Google Scholar] [CrossRef]
- Chu, P.; Li, Z.; Lammers, K.; Lu, R.; Liu, X. Deep learning-based apple detection using a suppression mask R-CNN. Pattern Recognit. Lett. 2021, 147, 206–211. [Google Scholar] [CrossRef]
- Zeng, F.; Liu, Y.; Ye, Y.; Zhou, J.; Liu, X. A detection method of Edge Coherent Mode based on improved SSD. Fusion Eng. Des. 2022, 179, 113141. [Google Scholar] [CrossRef]
- Jiang, P.; Ergu, D.; Liu, F.; Cai, Y.; Ma, B. A Review of Yolo algorithm developments. Procedia Comput. Sci. 2022, 199, 1066–1073. [Google Scholar] [CrossRef]
- Peng, H.; Huang, B.; Shao, Y.; Li, Z.; Zhang, C.; Chen, Y.; Xiong, J. General improved SSD model for picking object recognition of multiple fruits in natural environment. Trans. Chin. Soc. Agric. Eng. 2018, 34, 155–162. [Google Scholar]
- Liu, G.; Nouaze, J.C.; Touko Mbouembe, P.L.; Kim, J.H. YOLO-tomato: A robust algorithm for tomato detection based on YOLOv3. Sensors 2020, 20, 2145. [Google Scholar] [CrossRef] [Green Version]
- Yang, Y.; Li, J.; Nie, J.; Yang, S.; Tang, J. Cotton Stubble Detection Based on Improved YOLOv3. Agronomy 2023, 13, 1271. [Google Scholar] [CrossRef]
- Gai, R.; Chen, N.; Yuan, H. A detection algorithm for cherry fruits based on the improved YOLO-v4 model. Neural Comput. Appl. 2021, 35, 13895–13906. [Google Scholar] [CrossRef]
- Zhou, J.; Zhang, Y.; Wang, J. RDE-YOLOv7: An Improved Model Based on YOLOv7 for Better Performance in Detecting Dragon Fruits. Agronomy 2023, 13, 1042. [Google Scholar] [CrossRef]
- Li, R.; Ji, Z.; Hu, S.; Huang, X.; Yang, J.; Li, W. Tomato Maturity Recognition Model Based on Improved YOLOv5 in Greenhouse. Agronomy 2023, 13, 603. [Google Scholar] [CrossRef]
- Mamat, N.; Othman, M.F.; Abdulghafor, R.; Alwan, A.A.; Gulzar, Y. Enhancing Image Annotation Technique of Fruit Classification Using a Deep Learning Approach. Sustainability 2023, 15, 901. [Google Scholar] [CrossRef]
- Hu, J.; Shen, L.; Sun, G. Squeeze-and-excitation networks. In Proceedings of the IEEE Conference on Computer Vision and Pattern Recognition, Salt Lake City, UT, USA, 18–23 June 2018; pp. 7132–7141. [Google Scholar]
- Woo, S.; Park, J.; Lee, J.Y.; Kweon, I.S. Cbam: Convolutional block attention module. In Proceedings of the European Conference on Computer Vision (ECCV), Munich, Germany, 8–14 September 2018; pp. 3–19. [Google Scholar]
- Wang, X.; Girshick, R.; Gupta, A.; He, K. Non-local neural networks. In Proceedings of the IEEE Conference on Computer Vision and Pattern Recognition, Salt Lake City, UT, USA, 18–23 June 2018; pp. 7794–7803. [Google Scholar]
- Tong, X.; Wei, J.; Sun, B.; Su, S.; Zuo, Z.; Wu, P. ASCU-Net: Attention Gate, Spatial and Channel Attention U-Net for Skin Lesion Segmentation. Diagnostics 2021, 11, 501. [Google Scholar] [CrossRef]
Figure 1.
Part of the dataset raw image.

Figure 2.
Sample image after raw image and data enhancement.

Figure 3.
Standard YOLOv8 model structure diagram.

Figure 4.
Improved YOLOv8 model structure diagram.

Figure 5.
DSConv module schematic.

Figure 6.
DPAG module diagram.

Figure 7.
FEM structure diagram.

Figure 8.
Heat map visualizations before and after adding FEM.

Figure 9.
Training curve, test curve, mAP curve.

Figure 10.
Confusion metrics.

Figure 11.
Comparison of tomato detection before and after improvement.


Table 1.
Number of category labels before and after data enhancement.
| Category | Original | Data Enhancement |
|---|---|---|
| Ripe_tomatoes | 2099 | 8396 |
| Unripe_tomatoes | 2585 | 10,340 |
| Diseased | 1199 | 4796 |
Table 2.
Experimental environment configuration.
| Category | Configuration |
|---|---|
| CPU | Intel(R) Core (TM) i9-9900CPU @3.10 GHz 16G |
| GPU | GeForce RTX 2070SUPER 8G |
| System environment | Windows10 |
| Framework | PyTorch 1.11.0 |
| Programming voice | Python 3.8 |
Table 3.
Ablation experiment results.
| Network | P (%) | R (%) | mAP (%) | FPS | Model Size (M) |
|---|---|---|---|---|---|
| YOLOv8s | 92.5 | 91.2 | 91.9 | 151.5 | 22.5 |
| YOLOv8s + DSConv | 91.8 | 87.3 | 91.3 | 166.6 | 5.9 |
| YOLOv8s + DPAG | 93.1 | 90.3 | 92.8 | 133.3 | 27.0 |
| YOLOv8s + FEM | 93.8 | 91.4 | 93.1 | 147.0 | 23.6 |
| YOLOv8s + DSConv + DPAG + FEM | 94.5 | 92.0 | 93.4 | 138.8 | 16.1 |
Table 4.
Model comparison experiment results.
| Network | P/% | R/% | mAP (/%) | FPS | Model Size (M) |
|---|---|---|---|---|---|
| Faster R-CNN | 82.6 | 88.5 | 80.8 | 9 | 521 |
| SSD | 78.1 | 73.9 | 76.7 | 18 | 91.6 |
| YOLOv4 | 89.2 | 85.3 | 88.4 | 52 | 22.6 |
| YOLOv5 | 91.6 | 89.1 | 91.2 | 90 | 14.0 |
| YOLOv7 | 92.0 | 90.3 | 91.6 | 101 | 12 |
| YOLOv8 | 92.5 | 91.2 | 91.9 | 151.5 | 22.5 |
| Ours | 94.5 | 92.0 | 93.4 | 138.8 | 16.1 |
Disclaimer/Publisher’s Note: The statements, opinions and data contained in all publications are solely those of the individual author(s) and contributor(s) and not of MDPI and/or the editor(s). MDPI and/or the editor(s) disclaim responsibility for any injury to people or property resulting from any ideas, methods, instructions or products referred to in the content. |
© 2023 by the authors. Licensee MDPI, Basel, Switzerland. This article is an open access article distributed under the terms and conditions of the Creative Commons Attribution (CC BY) license (https://creativecommons.org/licenses/by/4.0/).
Share and Cite
MDPI and ACS Style
Yang, G.; Wang, J.; Nie, Z.; Yang, H.; Yu, S. A Lightweight YOLOv8 Tomato Detection Algorithm Combining Feature Enhancement and Attention. Agronomy 2023, 13, 1824. https://doi.org/10.3390/agronomy13071824
AMA Style
Yang G, Wang J, Nie Z, Yang H, Yu S. A Lightweight YOLOv8 Tomato Detection Algorithm Combining Feature Enhancement and Attention. Agronomy. 2023; 13(7):1824. https://doi.org/10.3390/agronomy13071824
Chicago/Turabian StyleYang, Guoliang, Jixiang Wang, Ziling Nie, Hao Yang, and Shuaiying Yu. 2023. "A Lightweight YOLOv8 Tomato Detection Algorithm Combining Feature Enhancement and Attention" Agronomy 13, no. 7: 1824. https://doi.org/10.3390/agronomy13071824
Note that from the first issue of 2016, this journal uses article numbers instead of page numbers. See further details here.