
Mineral Coating Enhances the Carbon Sequestration Capacity of Biochar Derived from Paulownia Biowaste
by
 ,
,
Liang Xiao
1, 
Jinghua Wu
1,
Wenhan Li
1,
Guodong Yuan
1,*,
Qing Xu
1,
Jing Wei
2 and
Fengxiang Han
3 1
Guangdong Provincial Key Laboratory of Environmental Health and Land Resource, Guangdong Technology and Equipment Research Center for Soil and Water Pollution Control, Zhaoqing University, Zhaoqing 526061, China
2
State Environmental Protection Key Laboratory of Soil Environmental Management and Pollution Control, Nanjing Institute of Environmental Sciences, Ministry of Ecology and Environment, Nanjing 210042, China
3
Department of Chemistry, Physics and Atmospheric Sciences, Jackson State University, Jackson, MS 39217, USA
*
Author to whom correspondence should be addressed.
Agronomy 2023, 13(9), 2361; https://doi.org/10.3390/agronomy13092361
Submission received: 28 July 2023
/
Revised: 5 September 2023
/
Accepted: 9 September 2023
/
Published: 11 September 2023
(This article belongs to the Special Issue Carbon Farming: Agriculture’s Solution to Climate Change)
Abstract
:Biochar holds great promise for carbon sequestration but is restricted by high costs. Here, we introduced the water–fire coupled method and developed a mineral coating technique for biochar production from paulownia waste (Paulownia fortune). Exposure time and mineral (lime) coating were assessed for their impacts on biochar properties. The former had a dominant adverse effect on carbon content, specific surface area, and carbon capture capacity of the biochar. In contrast, the latter alleviated the adverse impact on carbon capture capacity and specific surface area, the highest being 67.07% and 176.0 m2 g−1, respectively. Without a mineral coating (B), biochar functional groups reduced at the exposure time of 0–4 min (-COOH from 0.50 to 0.19 mol/kg, phenolic-OH from 0.43 to 0.14 mol/kg). In contrast, a mineral coating (B-Ca) increased -COOH from 0.25 to 0.83 mol/kg and phenolic-OH from 0.19 to 0.72 mol/kg. The pyrolysis process with a mineral coating is conceptualized as (1) wrapping the paulownia branch with the mineral, (2) enabling oxygen-limited pyrolysis inside the branch, and (3) ending the pyrolysis with water to form biochar. Ca2+ played multiple functions of ion bridging, complexation, and reduction of COx gas formation, thus enhancing the carbon capture capacity (the ratio of C in biomass converted to biochar) to 67%. This research would improve the feasibility of biochar use for carbon sequestration and climate change mitigation.
1. Introduction
Photosynthesis converts carbon dioxide in the atmosphere into biomass, which is naturally decomposed back into CO2 if not buried in the soil to form a clay-organic complex or transformed into biochar via pyrolysis. Biochar is chemically stable for hundreds of years or longer on the Earth’s surface, thus removing CO2 from the atmosphere long-term and holding significant promise as a viable solution for carbon sequestration [1,2,3]. Adding biochar to soil is considered a carbon-negative scheme [4,5] and contributes to climate change mitigation efforts [6,7].
It has been projected that biochar could sequester 0.3–2 Gt CO2 annually globally [8], accounting for 0.8–5.4% of the yearly CO2 emissions from the energy sector (36.8 Gt in 2022). Notably, China can sequester 0.2 Gt of CO2 annually through biochar utilization. Still, its current annual biochar production is merely one million tons, mainly due to its high production cost compared to its practical benefits [9,10]. Specifically, the price of biochar production via the classic anaerobic way stands at approximately CNY 1400–3700 per ton, which significantly exceeds the average benefit of CNY 600 per ton derived from its agricultural and environmental applications [11,12]. This cost–benefit disparity, attributed to biomass feed and biochar transportation expenses, equipment purchase, and the pyrolysis process, renders biochar an unfeasible carbon-negative solution [13]. From an economic perspective, it becomes crucial to explore cost-effective methods for producing biochar from local biowaste and reducing transportation and storage costs [14]. This approach would make biochar a more viable carbon-negative strategy, ultimately facilitating its widespread implementation [15].
Conventional biochar production relies on oxygen-limited high-temperature pyrolysis [16,17], but this method entails significant costs due to the need for oxygen restriction [10,18]. An alternative approach, inspired by the formation of black soil in the Amazon Basin and charcoal from forest fires [19,20], is the water–fire coupled method proposed by Xiao et al. [21]. This technique involves “self-oxygen-limitation-water quenching” high-temperature pyrolysis to achieve oxygen-limited conditions. The process includes the surface ashing of biomass for internal carbonization, followed by quenching with water to end carbonization. Although this method is more cost-effective, the resulting biochar has a carbon content of only 40–60%, falling short of the international standard for high-quality biochar (C ≥ 60%) [11,22]. Consequently, further research is necessary to increase the carbon content and enhance the carbon sequestration potential of biochar produced using this method.
Recent studies have explored potential solutions such as mineral modification and oxygen-restricted biochar production. Notably, adding Ca to the biomass pyrolysis process has been found to increase the carbon content of biochar by catalyzing thermal and chemical reactions and providing physical and chemical shielding [23,24,25]. These findings underscore the significance of continuous innovative research to maximize the carbon sequestration capabilities of biochar.
In this study, the water–fire coupled method and the mineral coating technique mentioned above were integrated to produce biochar with a high carbon content at a low cost. A biowaste available in large quantities (Paulownia) was used to enhance the usability of this study. Specifically, the objective was to investigate how exposure time and a mineral coating by saturated limewater influence the properties of biochar, including its elemental compositions, functional groups, specific surface area, and carbon sequestration capacity. This research aimed to develop a simplified and cost-effective method for biochar production, promote its use for carbon sequestration, and contribute to climate change mitigation.
2. Materials and Methods
2.1. Biowaste of Paulownia Branches
Paulownia is a common tree species in China, and its waste biomass is available in large quantities for use as feedstock for carbonization. Its uniformity was achieved by cutting branches into pieces 10 cm long and 1.2 cm in diameter, with an average mass of 5.41 ± 0.39 g. Before weighing, the branches were washed using deionized water to remove any surface contaminants. Subsequently, one part of the branches was soaked in deionized water and another in saturated limewater for 48 h. Immersing the branches in the limewater was performed to create a mineral-coating shell and help Ca(OH)2 penetrate the branches. After the immersion, the branches were dried at 85 °C for biochar production.
2.2. Preparation of Limewater
Analytical grade calcium hydroxide obtained from Tianjin Dengfeng Chemical Reagent Factory was used to prepare the saturated limewater. Specifically, 1.74 g portions of the calcium hydroxide were mixed with 1 dm3 of deionized water until fully dissolved. The solution was then stored in glass bottles in a refrigerator at 4 °C for later use.
2.3. Experimental Design
The experiment comprised two treatments: paulownia branches with (B-Ca) and without (B) a mineral coating. Each treatment included four replicates. The branches in each treatment were ignited and carbonized to form dark-red char and left for further carbonization for exposure times of 0, 0.5, 1, 2, and 4 min before being extinguished by water. These specific exposure times were chosen to achieve a range of carbon capture capacities.
2.4. Aerobic Carbonization via Water–Fire Coupled Method
The process of producing paulownia biochar took place at the Ecological Experimental Station of Guangdong Provincial Key Laboratory of Environmental Health and Land Resource in Shapu Town, Dinghu District, Zhaoqing City (23°08′69″ N, 112°41′52″ E). A commercial barbecue grill was modified for biochar production (Figure 1).
Paulownia branches were fixed to the rack and ignited by liquefied natural gas. The rack was rotated at 120 rpm to help homogenous carbonization. After branches turned into dark-red char, they were transferred to the exposure stand for further carbonization for the pre-determined exposure times of 0, 0.5, 1, 2, and 4 min, defined as the duration from the char being placed on the exposure stand and being quenched by the water or limewater in the sample box to form biochar. Pyrolysis temperature, defined as the temperature on the surface of the dark-red char on the exposure stand before being quenched by the water, was measured by a non-contact infrared thermometer (DT-8833, Shanghai, China) with a working range of −50 to 800 °C and a resolution of 0.1 °C.
The obtained biochar was oven-dried at 85 °C and then ground to pass through a 100-mesh sieve for laboratory analysis.
2.5. Sample Collection and Analysis
The biochar samples with (B-Ca) and without (B) mineral coatings were analyzed for their physical and chemical properties. Biochar was added to deionized water at a ratio of 1:10 (w/v) and shaken for 24 h at 160 r/min for pH measurement (Five Easy Plus, METTLER TOLEDO, Shanghai, China). For ash content determination, biochar samples were heated to 800 °C for 4 h in a muffle furnace (SX-G18123, Tianjin, China), and the residual ash weight was then expressed as a percentage of the biochar mass [26]. The elemental compositions (C, H) of the biochar without a mineral coating were directly determined by an elemental analyzer (Vario Micro cube, Elementar, Hesse, Germany), whereas the biochar with a mineral coating (B-Ca) was treated by HCl to remove inorganic carbon before analysis by the elemental analyzer. The -COOH and phenolic-OH contents of the biochar were analyzed by the titration method of IHSS [27]. The specific surface area of the biochar was determined by the nitrogen sorption BET method using an automatic analyzer (Autosorb-iQ, Quantachrome Boynton Beach, FL, USA). Fourier Transform Infrared Spectroscopy (FTIR, Thermo Fisher Nicolet iS5, (Waltham, MA, USA) was utilized for qualitative analysis of functional groups, scanning a range of 500–4000 cm−1 at a resolution of 2.0 cm−1 [28]. Finally, the biochar samples were examined by a high-resolution scanning electron microscope (SEM, Hitachi, S-4800, Tokyo, Japan) to assess the effect of a mineral coating on biochar surface morphology.
2.6. Data Processing
Besides biochar yield (the weight percentage of biochar to biomass), the carbon content of biochar is also a crucial factor in determining the effectiveness of biochar as a carbon-negative strategy to mitigate climate change. A novel indicator, carbon capture capacity (i.e., the percentage of C in paulownia branches converted to biochar C, CCC), was proposed to better quantify the carbon retention capacity per biomass unit during carbonization. The CCC or CCCCa can be computed using the following formula:
where m is the mass of the biowaste of paulownia (g), mB is the mass of paulownia biochar produced without a mineral coating (g), mB-Ca is the mass of paulownia biochar with a mineral coating (g), C0 is the carbon content of paulownia feedstock (%), C1 is the carbon content of paulownia biochar without a mineral coating (%), and C2 is the carbon content of paulownia biochar with a mineral coating (%).
Data management was performed using Excel 2021. Statistical analysis and variance testing were conducted using IBM SPSS Statistics 21, with a significance level set at p < 0.05. Pearson correlation analyses were conducted to establish the relationship between indicators, and the findings were visually presented using Origin 2021.
3. Results
3.1. Opposite Effects of Exposure Time and Mineral Coating on Carbon Content and Carbon Capture Capacity of Paulownia Biochar
Regardless of the mineral coating, the C contents of biochar decreased with exposure times (Figure 2A). Carbon contents at the exposure time of 0 min were the highest (83.8% and 92.1% without and with mineral coating, respectively), and a significant difference was observed between 0 and 4 min. As exposure time increased, elements in feedstock converted to carbon, nitrogen, and sulfur oxide gases, reducing the carbon content [21]. Meanwhile, at 0 and 0.5 min of exposure time, the mineral coating enhanced the carbon content of biochar. As the C contents of biochar were all ≥60%, it could be classified as class 1 according to both the European Biochar Certificate (EBC) Version 4.8 and International Biochar Initiative (IBI) Biochar Standards Version 2.0 [11]. Thus, the water–fire coupled method with the mineral coating technique can produce high-quality biochar.
As shown in Figure 2B, the H contents of biochars without a mineral coating (B) decreased with increasing exposure times, the highest being 4.1% at 0 min. In contrast, the H contents of biochars with a mineral coating (B-Ca) slightly increased from 2.81% to 3.44%, though the difference among the exposure times is statistically insignificant.
The carbon capture capacity of biochar, both with (B-Ca) and without (B) a mineral coating, decreased with increasing exposure times (Figure 3). At 0 min, the carbon capture capacity was the highest, with the CCC of paulownia biochar with a mineral coating (B-Ca) reaching 67%. Paulownia biochar without a mineral coating (B) has a CCC of 40%. In other words, mineral coating alleviated the adverse effect of exposure time on carbon capture capacity.
To better understand this process, we can envision a paulownia branch as a miniature furnace: the outer part of the branches is likened to the furnace wall in conventional pyrolysis, whereas the inner core is equivalent to the biomass in the traditional furnace of pyrolysis. In other words, the carbonization process involves a combination of surface aerobic combustion and oxygen-limited pyrolysis at the inner core during pyrolysis. Moreover, when a branch is coated with lime, the coating acts as a barrier to oxygen penetration, thus creating an oxygen-limited condition inside the branches. This concept of a paulownia branch as a small furnace helps explain the carbonization process and contributes to the increased carbon capture capacity.
3.2. Mineral Coating and Exposure Time Affected Ash Content and pH of Paulownia Biochar
Both biochars with (B-Ca) and without (B) a mineral coating exhibited an increase in ash content with exposure time, and the ash content of biochar at 0–1 min was significantly lower than that at 2–4 min (Table 1). Biochar formed at 0 min of exposure time displayed the lowest ash content, which agrees with carbon content in the opposite trend.
All biochars were alkaline (pH 7.96–8.58), and there was no significant difference in pH among the various exposure times. However, a slight difference was noted between biochars with (B-Ca) and without (B) a lime coating. As exposure times increased, the pH of biochar without a mineral coating (B) increased, while the pH of biochar with a mineral coating (B-Ca) decreased. This difference may be attributed to the calcium hydroxide-coated cladding creating an oxygen-limited environment, thus forming oxygen-containing functional groups (acidic groups) from C, H, and O elements in paulownia.
3.3. Mineral Coating and Exposure Time Affected the Specific Surface Area and Functional Groups of Paulownia Biochar
As exposure times increased, the specific surface area of biochar, regardless of mineral coating, showed a consistent decrease, with significant differences observed among the exposure times of 0–0.5 to 1–4 min (Figure 4). The mineral coating, however, alleviated the adverse effect of exposure time on the specific surface area, resulting in an increase at 0, 0.5, 1, 2, and 4 min exposure times of 27.19, 8.65, 5.42, 10.13, and 9.35 m2/g, respectively.
The contents of -COOH and phenolic-OH functional groups in paulownia biochar without a mineral coating (B) gradually decreased as exposure time increased, as shown in Figure 5A,C. Significant differences were observed between biochar formed at 0–0.5 and 1–4 min exposure times. This phenomenon can be attributed to the consumption and oxidation of functional groups in the dark-red char when exposed to the air for longer, which reduced the biochar’s -COOH and phenolic-OH contents.
Conversely, when biochar was formed with a mineral coating (B-Ca), its functional groups of -COOH and phenolic-OH increased with longer exposure times. This enhancement is partly due to the mineral coating providing an extended oxygen-limited environment, enabling C, H, and O elements in paulownia to form more oxygen-containing functional groups (-COOH and phenolic-OH) during the pyrolysis process, as evidenced by the decrease in H from 4.13% to 3.04% for biochar without a mineral coating (B) and the increase in H from 2.81% to 3.44% (Figure 2B) for biochar with a mineral coating (B-Ca).
3.4. Correlation between Carbon Capture Capacity and Other Properties of Paulownia Biochar under 0 Exposure Time
The carbon capture capacity (CCC) is a crucial index for carbon sequestration, and its relationships with the physical and chemical properties of biochar are illustrated in Table 2.
For biochar formed without a mineral coating (B), its CCC positively correlated with the specific surface area and functional groups while it negatively correlated with ash content. On the other hand, for biochar formed with a mineral coating (B-Ca), CCC exhibited a positive correlation with the specific surface area and pH while showing a negative correlation with ash content and functional groups.
The different relationships of functional groups with CCC for biochar with (B-Ca) or without a mineral coating (B) can be attributed to the oxygen-limiting conditions created by the mineral coating, leading to the increased formation of functional groups from C, H, and O elements in the dark-red char of paulownia with increased exposure time. Conversely, without a mineral coating, the exposure of dark-red char to the air caused the gradual consumption of functional groups during aerobic carbonization.
From the perspective of carbon sequestration, biochar with a higher CCC is desirable, and this can be achieved by minimizing exposure time or forming a mineral coating on biomass feedstock.
4. Discussion
4.1. Exposure Time Deteriorates Paulownia Biochar Properties
The pyrolysis process of paulownia feedstock through the water–fire coupled method can be conceptualized into three stages: (1) Initial ignition stage: the surface of the paulownia feedstock undergoes burning and forms char, while the inner core remains unburned [29]. (2) Mid-burning stage: the surface of the paulownia feedstock gradually transforms into ash, while the inner core burns under high-temperature and oxygen-limited conditions. As the carbonization progresses and structural changes occur, the resulting dark-red char falls to the sample box by gravity [30]. (3) End-burning stage: the carbonization process is ended as the dark-red char is quenched by water to form biochar [24], rather than becoming ash [31].
Each paulownia branch can be visualized as a miniature oxygen-limited furnace to gain further insight into the aerobic carbonization process. In this analogy, the surface of the branch represents the furnace wall, and the inner core acts as the fuelwood within the furnace. The carbonization process involves two main steps: the oxygen-limited action on the surface of the paulownia branches and the high-temperature pyrolysis of the inner core. The carbonization of the inner core is achieved through surface ashing and water quenching during the high-temperature pyrolysis of the biomass in an oxygen-exposed environment.
As the mid-burning stage progresses and dark-red char is formed, the longer the exposure times are, the more carbon and other elements are consumed by O2 in the air, decreasing carbon capture capacity (Figure 3). This phenomenon is accompanied by the collapse of the carbon skeleton structure [21], an increase in ash content and pH (Table 2), and reductions in hydrogen content (Figure 2), specific surface area (Figure 4), and functional group content (Figure 5). These changes indicate that the exposure time (i.e., ongoing carbonization) affects the physical and chemical properties of the biochar. A longer exposure time makes biochar less desirable for carbon sequestration purposes.
4.2. Mineral Coating Enhances Biochar Properties of Paulownia Biochar
For biochar formed with a mineral coating (B-Ca), additional reactions come into play. Firstly, the encapsulating shell formed by the mineral coating acts as a “new furnace wall” for the “oxygen-limited furnace”. This physical barrier between the dark-red char and O2 improves carbon capture capacity (Figure 3). Similar findings were reported by [24], where the inclusion of CaCO3 through pyrolysis acted as a protective shell, enhancing the carbon content of biochar through physical blocking [24,25].
Secondly, Ca2+ interacts with the functional groups of the dark-red char through processes like cation bridging [24] and complexation reactions [32]. These processes contribute to increased carbon capture capacity (Figure 3) and enhance the specific surface area of the biochar (Figure 4).
A qualitative analysis of functional group change using FTIR on paulownia biochar could give a deeper insight into the mechanism of mineral-coating-enhanced biochar carbon capture (Figure 6), which yielded several significant findings.
Firstly, the absorption peaks of -COOH and phenolic-OH under the mineral coating exhibited a redshift, indicating a reduced energy requirement for vibration and the instability of these groups. It suggests that the functional groups had reacted with Ca2+ in water [33].
Secondly, the COO- peak disappeared, possibly resulting from a coordination reaction with Ca2+.
Lastly, the aromatic-H absorption peak showed a redshift, likely due to the interaction with Ca2+ [34].
These observations demonstrate that Ca2+ in the mineral coating reacted with oxygen-containing functional groups in biochar through various pathways, effectively preventing the rupture of C=O bonds and minimizing the generation of COx gases [35]. Consequently, this process leads to enhanced carbon capture capacity.
Additionally, the pH value decreased as the content of -COOH and phenolic-OH functional groups increased with exposure times. It can be attributed to two factors: (1) the oxygen-limited environment provided by the mineral coating allows for the formation of more oxygen-containing functional groups in paulownia feedstock during the oxygen-limited pyrolysis process (similar to the prolonged retention times in anaerobic carbonization processes) [16,36] and (2) oxygen-containing functional groups (-COOH and phenolic-OH) generated at 0 and 30 s of exposure time can easily combine with Ca2+ at higher carbonization temperatures, leading to the substitution of H while retaining the carbon [37,38].
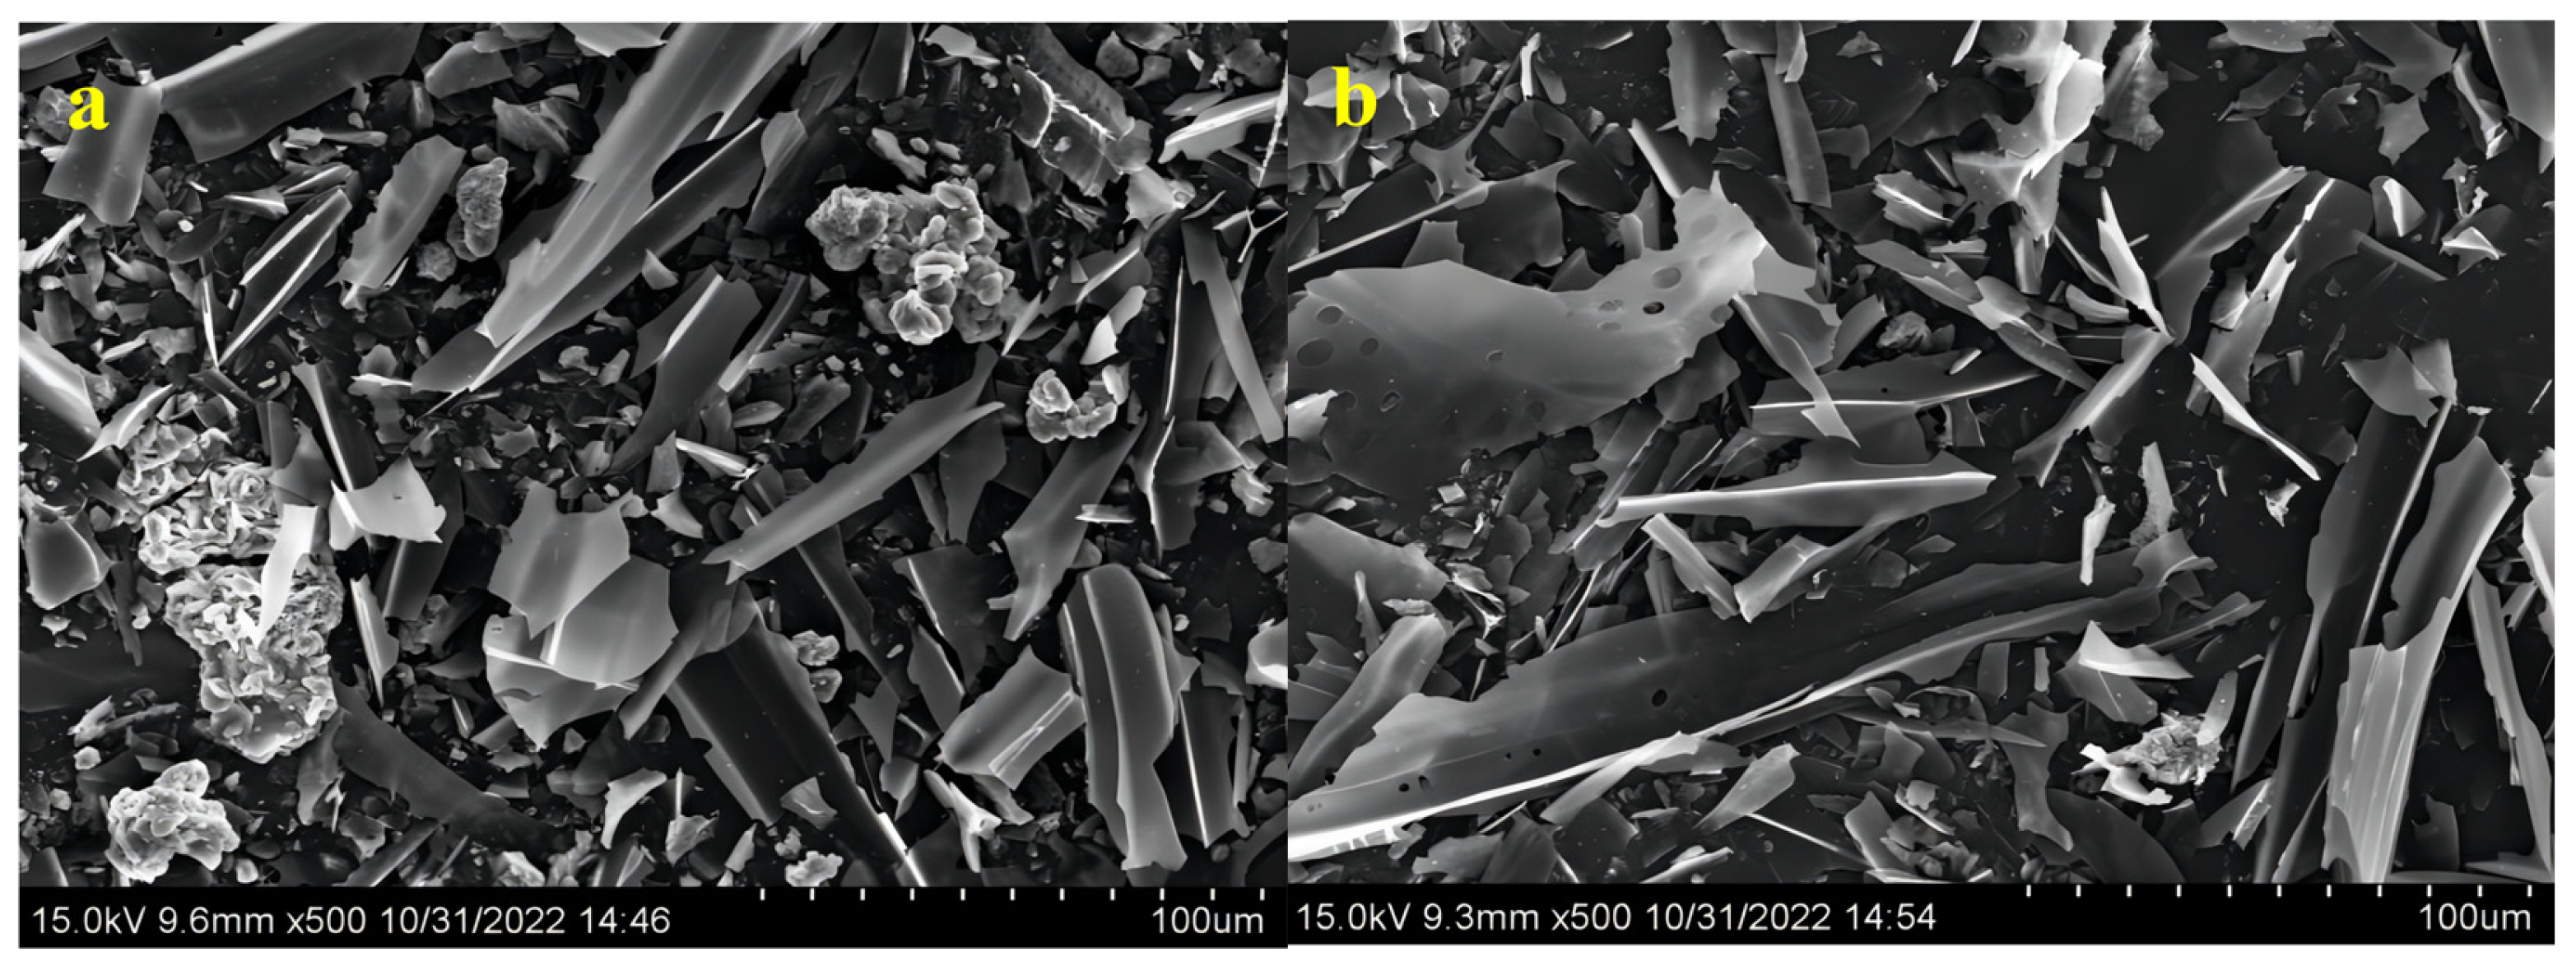
Furthermore, the SEM images of the paulownia biochar revealed distinct differences in their carbon skeleton structures (Figure 7). The biochar without a mineral coating (B) displayed an unordered carbon skeleton structure (Figure 7a) with more filamentous substances (i.e., ash), which is not conducive to achieving a favorable carbon capture capacity.
In contrast, biochar with a mineral coating (B-Ca) exhibited a more organized carbon skeleton structure (Figure 7b) with fewer filamentous substances (i.e., ash) between carbon particles. This well-organized structure facilitates the formation of a high specific surface area of biochar (Figure 4) and contributes to its enhanced carbon capture capacity (Figure 3) [21].
4.3. Innovative Techniques Improve the Carbon Sequestration Potential of Biochar
According to a report by Ding [39], China has the potential to sequester 0.2 Gt of carbon annually through biochar production. With a substantial amount of agricultural and forestry biowaste, including 1.02 billion tons of crop straw produced yearly, China possesses abundant raw materials for biochar production [40]. However, the current biochar production in China (ca. 1 million tons) falls far short of its carbon sequestration potential, indicating limitations in existing biochar production technologies. Therefore, it is crucial to urgently innovate and develop biochar production methods for a larger scale of biochar production and use. In this regard, combining the water–fire coupled method with mineral coating technology, as this research presents, could help.
This innovative approach can potentially enhance the carbon capture capacity of paulownia biowaste, optimize the carbon skeleton structure, and increase the specific surface area of biochar. The water–fire coupled method combined with mineral coating technology offers several advantages, such as simplicity, low cost, and ease of implementation, making it a promising solution for biochar production. Implementing this technology would provide a theoretical foundation and technical support for biochar as a negative emission solution for climate change mitigation and move China closer to achieving its carbon sequestration goals.
5. Conclusions
Inspired by natural charcoal formation, a water–fire coupled method was developed, and the mineral coating technique was improved for cost-effective biochar production in the field. This carbonization process involves a combination of surface combustion and oxygen-limited pyrolysis in the inner core of the biomass. Biochar properties deteriorated with exposure time. As exposure time increased from 0 to 4 min, the specific surface area, content of -COOH and phenolic-OH functional groups, and carbon capture capacity of biochar decreased. Applying a mineral coating alleviated the adverse effect of exposure time and enhanced the carbon capture capacity of biochar from 0 to 30 s exposure time by 40.0–45.5%. The mineral coating created an oxygen-limiting barrier, and the Ca2+ in the coating helped prevent the breakage of carbon–oxygen bonds. It exhibited a more organized carbon skeleton structure with low ash between carbon particles. This well-organized structure facilitates the formation of a high specific surface area of biochar and enhances carbon retention. This research has the potential to advance the paradigm of converting agricultural biowaste into biochar in the field, and the findings on mineral coatings lay the groundwork for the practical application of biomass carbonization, contributing to the realization of the potential of biochar for achieving carbon neutrality.
Author Contributions
G.Y.: Conceptualization, funding acquisition, supervision, and writing; L.X.: Conceptualization, funding acquisition, methodology, data analysis, supervision, methodology, and writing; J.W. (Jinghua Wu): data acquisition and drafting; W.L.: data acquisition and drafting; Q.X.: data interpretation and drafting; J.W. (Jing Wei): experimental design, data collection, and drafting; F.H.: Conception and manuscript editing. All authors have read and agreed to the published version of the manuscript.
Funding
This work was funded by the Science and Technology Bureau of Zhaoqing City (2021SN001), Guangdong Basic and Applied Basic Research Foundation (2022A1515110330), Department of Science and Technology of Guangdong Province (2020B121201014, YueCaiKeJiao2022–184), and Zhaoqing University Talent Program (2022BSZ005). The APC was funded by the grant 2021SN001.
Data Availability Statement
The data presented in this study are available on request from the corresponding author.
Conflicts of Interest
The authors declare no conflict of interest. The funders had no role in the design of the study; in the collection, analyses, or interpretation of data; in the writing of the manuscript; or in the decision to publish the results.
References
- Boguta, P.; Cybulak, M.; Sokołowska, Z.; Zarzycki, R.; Kacprzak, A.; Kobyłecki, R. Quality and quantity of humic-like and fulvic-like acids entrapped in biochars–The effect of various forestry feedstock and pyrolysis temperature of biochars. Fuel 2023, 333, 126405. [Google Scholar] [CrossRef]
- Sadowska, U.; Zaleski, T.; Kuboń, M.; Latawiec, A.; Klimek-Kopyra, A.; Sikora, J.; Gliniak, M.; Kobyłecki, R.; Zarzycki, R. Effect of the application of sunflower biochar and leafy trees biochar on soil hydrological properties of fallow soils and under soybean cultivation. Materials 2023, 16, 1737. [Google Scholar] [CrossRef] [PubMed]
- Woolf, D.; Amonette, J.E.; Street-Perrott, F.A.; Lehmann, J.; Joseph, S. Sustainable biochar to mitigate global climate change. Nat. Commun. 2010, 1, 56. [Google Scholar] [CrossRef] [PubMed]
- Hamidzadeh, Z.; Ghorbannezhad, P.; Ketabchi, M.R.; Yeganeh, B. Biomass-derived biochar and its application in agriculture. Fuel 2023, 41, 127701. [Google Scholar] [CrossRef]
- Dwibedi, S.K.; Pandey, V.C.; Divyasree, D.; Bajpai, O. Biochar-based land development. Land Degrad. Dev. 2022, 338, 1139–1158. [Google Scholar] [CrossRef]
- Safarian, S. To what extent could biochar replace coal and coke in steel industries? Fuel 2023, 339, 127401. [Google Scholar] [CrossRef]
- Lehmann, J.; Cowie, A.; Masiello, C.A.; Kammann, C.; Woolf, D.; Amonette, J.E.; Cayuela, M.L.; Camps-Arbestain, M.; Whitman, T. Biochar in climate change mitigation. Nat. Geosci. 2021, 14, 883–892. [Google Scholar] [CrossRef]
- Fawzy, S.; Osman, A.I.; Yang, H.; Doran, J.; Rooney, D.W. Industrial biochar systems for atmospheric carbon removal: A review. Environ. Chem. Lett. 2021, 194, 3023–3055. [Google Scholar] [CrossRef]
- Batista, R.; Jensen-Fellows, A.; Richard, B.; Sheridan, T. Biochar Market Profile Report; Worcester Polytechnic Institute: Worcester, MA, USA, 2021; pp. 1–62. [Google Scholar]
- Qifa, Z.; Houge, B.A.; Zhaohui, T.; Bin, G.; Guodong, L. An in-situ technique for producing low-cost agricultural biochar. Pedosphere 2018, 28, 690–695. [Google Scholar]
- Campbell, R.M.; Anderson, N.M.; Daugaard, D.E.; Naughton, H.T. Financial viability of biofuel and biochar production from forest biomass in the face of market price volatility and uncertainty. Appl. Energy 2018, 230, 330–343. [Google Scholar] [CrossRef]
- Giwa, A.; Yusuf, A.; Ajumobi, O.; Dzidzienyo, P. Pyrolysis of date palm waste to biochar using concentrated solar thermal energy: Economic and sustainability implications. Waste Manag. 2019, 93, 14–22. [Google Scholar] [CrossRef] [PubMed]
- Marousěk, J.; Vochozka, M.; Plachý, J.; Źák, J. Glory and misery of biochar. Clean Technol. Environ. Policy 2017, 19, 311–317. [Google Scholar] [CrossRef]
- Dahlawi, S.; Naeem, A.; Rengel, Z.; Naidu, R. Biochar application for the remediation of salt-affected soils: Challenges and opportunities. Sci. Total Environ. 2018, 625, 320–335. [Google Scholar]
- Campion, L.; Bekchanova, M.; Malina, R.; Kuppens, T. The costs and benefits of biochar production and use: A systematic review. J. Clean. Prod. 2023, 408, 137138. [Google Scholar] [CrossRef]
- Wu, P.; Ata-UI-Karim, S.T.; Singh, B.P.; Wang, H.L.; Wu, T.; Liu, C.; Fang, G.; Zhou, D.; Wang, Y.; Chen, W. A scientometric review of biochar research in the past 20 years (1998–2018). Biochar 2019, 1, 23–43. [Google Scholar] [CrossRef]
- Jiao, Y.; Li, D.; Wang, M.; Gong, T.; Sun, M.; Yang, T. A scientometric review of biochar preparation research from 2006 to 2019. Biochar 2021, 3, 283–298. [Google Scholar] [CrossRef]
- Gao, P.; Liu, Y.; Huang, X.; Abulaiti, A.; Yang, S. Effect of wet torrefaction on the physicochemical characteristics and gasification behavior of biochar. Ind. Crops Prod. 2023, 197, 116544. [Google Scholar] [CrossRef]
- Marris, E. Putting the carbon back: Black is the new green. Nature 2006, 442, 624–626. [Google Scholar] [CrossRef]
- Wardle, D.A.; Nilsson, M.C.; Zackrisson, O. Fire-derived charcoal causes loss of forest humus. Sci. Rep. 2008, 320, 629. [Google Scholar] [CrossRef]
- Xiao, L.; Feng, L.; Yuan, G.; Wei, J. Low-cost field production of biochars and their properties. Environ. Geochem. Health 2020, 42, 1569–1578. [Google Scholar] [CrossRef]
- Xiao, L.; Yuan, G.D.; Bi, D.X.; Wei, J.; Shen, G.H. Equipment and technology of field preparation of biochars from agricultural and forest residues under aerobic conditions with water-fire coupled method. Trans. Chin. Soc. Agric. Eng. 2019, 35, 239–244. [Google Scholar]
- Zhuo, S.N.; Dai, T.C.; Ren, H.Y.; Liu, B.F. Simultaneous adsorption of phosphate and tetracycline by calcium modified corn stover biochar: Performance and mechanism. Bioresour. Technol. 2022, 359, 127477. [Google Scholar] [CrossRef]
- Nan, H.; Yin, J.; Yang, F.; Luo, Y.; Zhao, L.; Cao, X. Pyrolysis temperature-dependent carbon retention and stability of biochar with participation of calcium: Implications to carbon sequestration. Environ. Pollut. 2021, 287, 117566. [Google Scholar] [CrossRef]
- Xiao, X.; Chen, B.; Chen, Z.; Zhu, L.; Schnoor, J.L. Insight into multiple and multilevel structures of biochars and their potential environmental applications: A critical review. Environ. Sci. Technol. 2018, 52, 5027–5047. [Google Scholar] [CrossRef]
- Balmuk, G.; Videgain, M.; Manyà, J.J.; Duman, G.; Yanik, J. Effects of pyrolysis temperature and pressure on agronomic properties of biochar. J. Anal. Appl. Pyrolysis 2023, 169, 105858. [Google Scholar] [CrossRef]
- IHSS. Available online: https://ihss.humicsubstances.org/ (accessed on 1 July 2023).
- Song, S.; Cong, P.; Wang, C.; Li, P.; Liu, S.; He, Z.; Zhou, C.; Liu, Y.; Yang, Z. Properties of biochar obtained from tropical crop wastes under different pyrolysis temperatures and its application on acidic soil. Agronomy 2023, 13, 921. [Google Scholar] [CrossRef]
- Hamelinck, C.N.; Van Hooijdonk, G.; Faaij, A.P. Ethanol from lignocellulosic biomass: Techno-economic performance in short-, middle- and long-term. Biomass Bioenergy 2005, 28, 384–410. [Google Scholar] [CrossRef]
- Shafizadeh, F. Introduction to pyrolysis of biomass. J. Anal. Appl. Pyrolysis 1982, 3, 283–305. [Google Scholar] [CrossRef]
- Shanmugam, V.; Sreenivasan, S.N.; Mensah, R.A.; Försth, M.; Sas, G.; Hedenqvist, M.S.; Neisiany, R.E.; Tu, Y.; Das, O. A review on combustion and mechanical behaviour of pyrolysis biochar. Mater. Today Commun. 2022, 31, 103629. [Google Scholar] [CrossRef]
- Wang, R.; He, Q.; Guo, C.; Bao, Y.; He, X.; Cao, Y.; Li, P.; Huangpu, X. Adsorption characteristics of Fe/Ca loaded on rice straw biochar for phosphorus in septic tanks. J. Civil Environ. Eng. 2022, 45, 205–214. [Google Scholar]
- Ou, W.; Lan, X.; Guo, J.; Cai, A.; Liu, P.; Liu, N.; Liu, Y.; Lei, Y. Preparation of iron/calcium-modified biochar for phosphate removal from industrial wastewater. J. Clean. Prod. 2023, 383, 135468. [Google Scholar] [CrossRef]
- Pan, L.; Mao, L.; Zhang, H.; Wang, P.; Wu, C.; Xie, J.; Muhammad, U.S.; Zhang, L.; Zhang, Y.; Zhu, L.; et al. Modified biochar as a more promising amendment agent for remediation of pesticide-contaminated soils: Modification methods, mechanisms, applications, and future perspectives. Appl. Sci. 2022, 12, 11544. [Google Scholar] [CrossRef]
- Iamsaard, K.; Weng, C.H.; Yen, L.T.; Tzeng, J.H.; Poonpakdee, C.; Lin, Y.T. Adsorption of metal on pineapple leaf biochar: Key affecting factors, mechanism identification, and regeneration evaluation. Bioresour. Technol. 2022, 344, 126131. [Google Scholar] [CrossRef] [PubMed]
- Wei, S.Y.; Song, J.Z.; Peng, P.A.; Yu, C.L.; Li, K.M. Characterization of pyrolysis products in biochar prepared at different temperatures. Geochimica 2019, 48, 511–520. [Google Scholar]
- Liu, M.; Zhao, Z.; Lu, Q.; Yu, W. Release of dissolved organic carbon from biochar and formation of humic-like component during photoreaction: Effects of Ca2+ and pH. Water Res. 2022, 219, 118616. [Google Scholar] [CrossRef]
- Chen, Q.; Qin, J.; Cheng, Z.; Huang, L.; Sun, P.; Chen, L.; Shen, G. Synthesis of a stable magnesium-impregnated biochar and its reduction of phosphorus leaching from soil. Chemosphere 2018, 199, 402–408. [Google Scholar] [CrossRef] [PubMed]
- Ding, Z. China carbon neutral framework roadmap research. Chin. Ind. Inf. Technol. 2021, 8, 54–61. [Google Scholar]
- Wang, Y.J.; Wang, F.; Shi, Z.L.; Gao, C.Y.; Wang, H.Y.; Bi, Y.Y. Straw resources and its utilization in China from the perspective of agricultural supply-side structural reform. Chin. J. Agric. Resour. Reg. Plan. 2017, 38, 921. [Google Scholar]
Figure 1.
Biochar production: (a) carbonization equipment; (b) paulownia branches; (c) biochar formed without mineral coating; (d) biochar formed with mineral coating.
Figure 1.
Biochar production: (a) carbonization equipment; (b) paulownia branches; (c) biochar formed without mineral coating; (d) biochar formed with mineral coating.
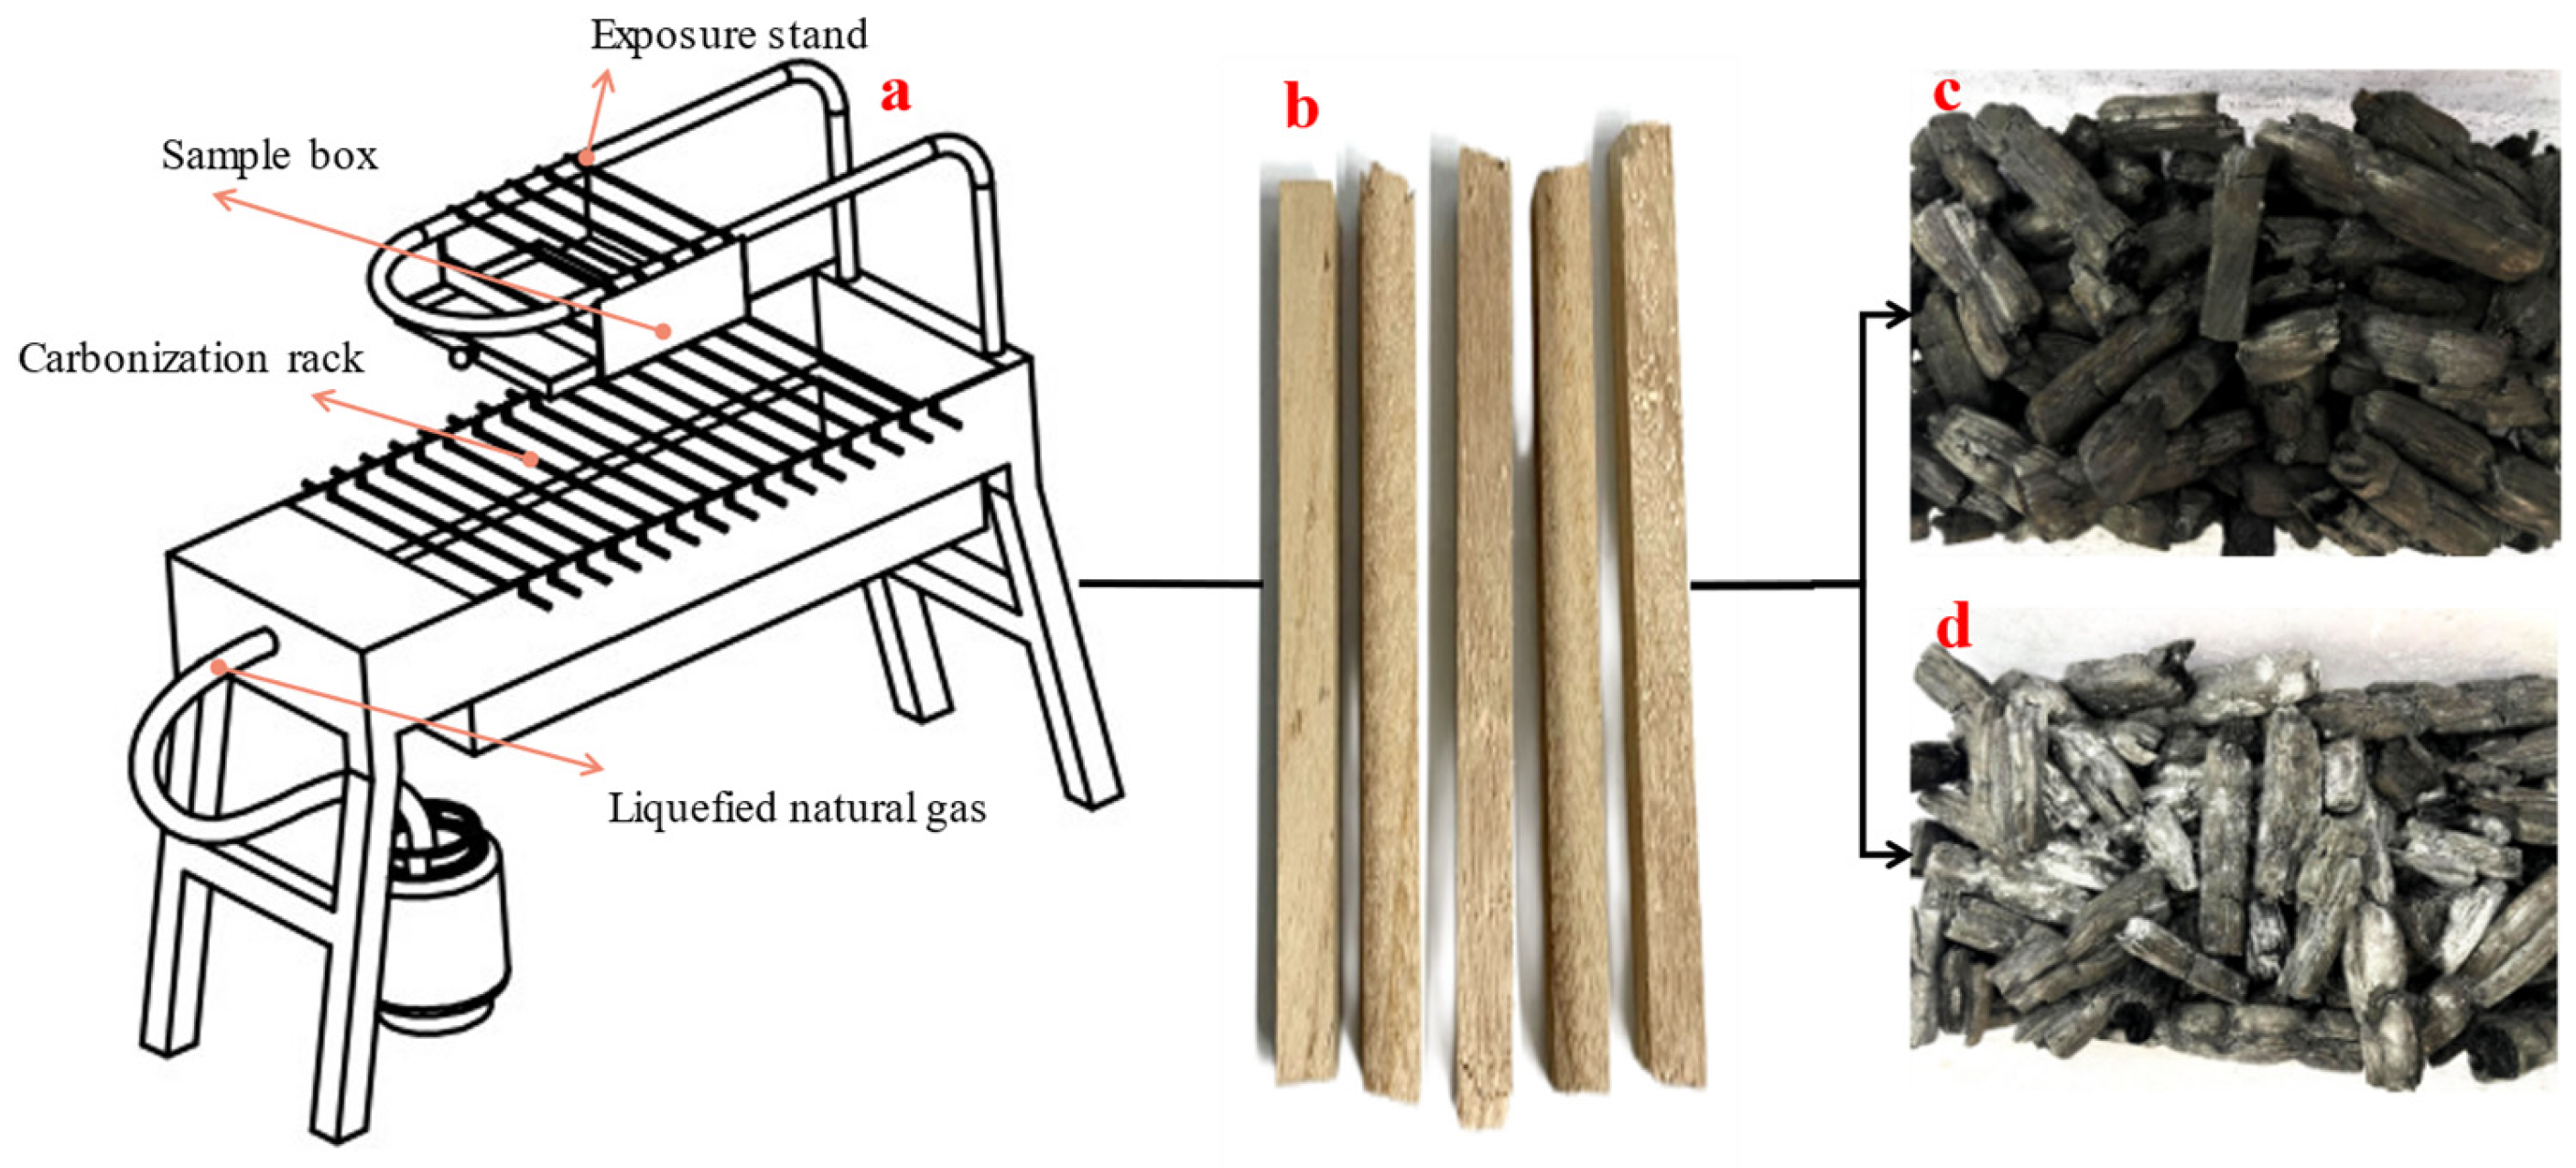
Figure 2.
Exposure time and mineral coating affect the C (A) and H (B) contents of biochars (B: without mineral coating, B-Ca: with mineral coating). Lowercase letters (a–d) indicate significant differences between exposure times (p < 0.05, Duncan’s test).
Figure 2.
Exposure time and mineral coating affect the C (A) and H (B) contents of biochars (B: without mineral coating, B-Ca: with mineral coating). Lowercase letters (a–d) indicate significant differences between exposure times (p < 0.05, Duncan’s test).
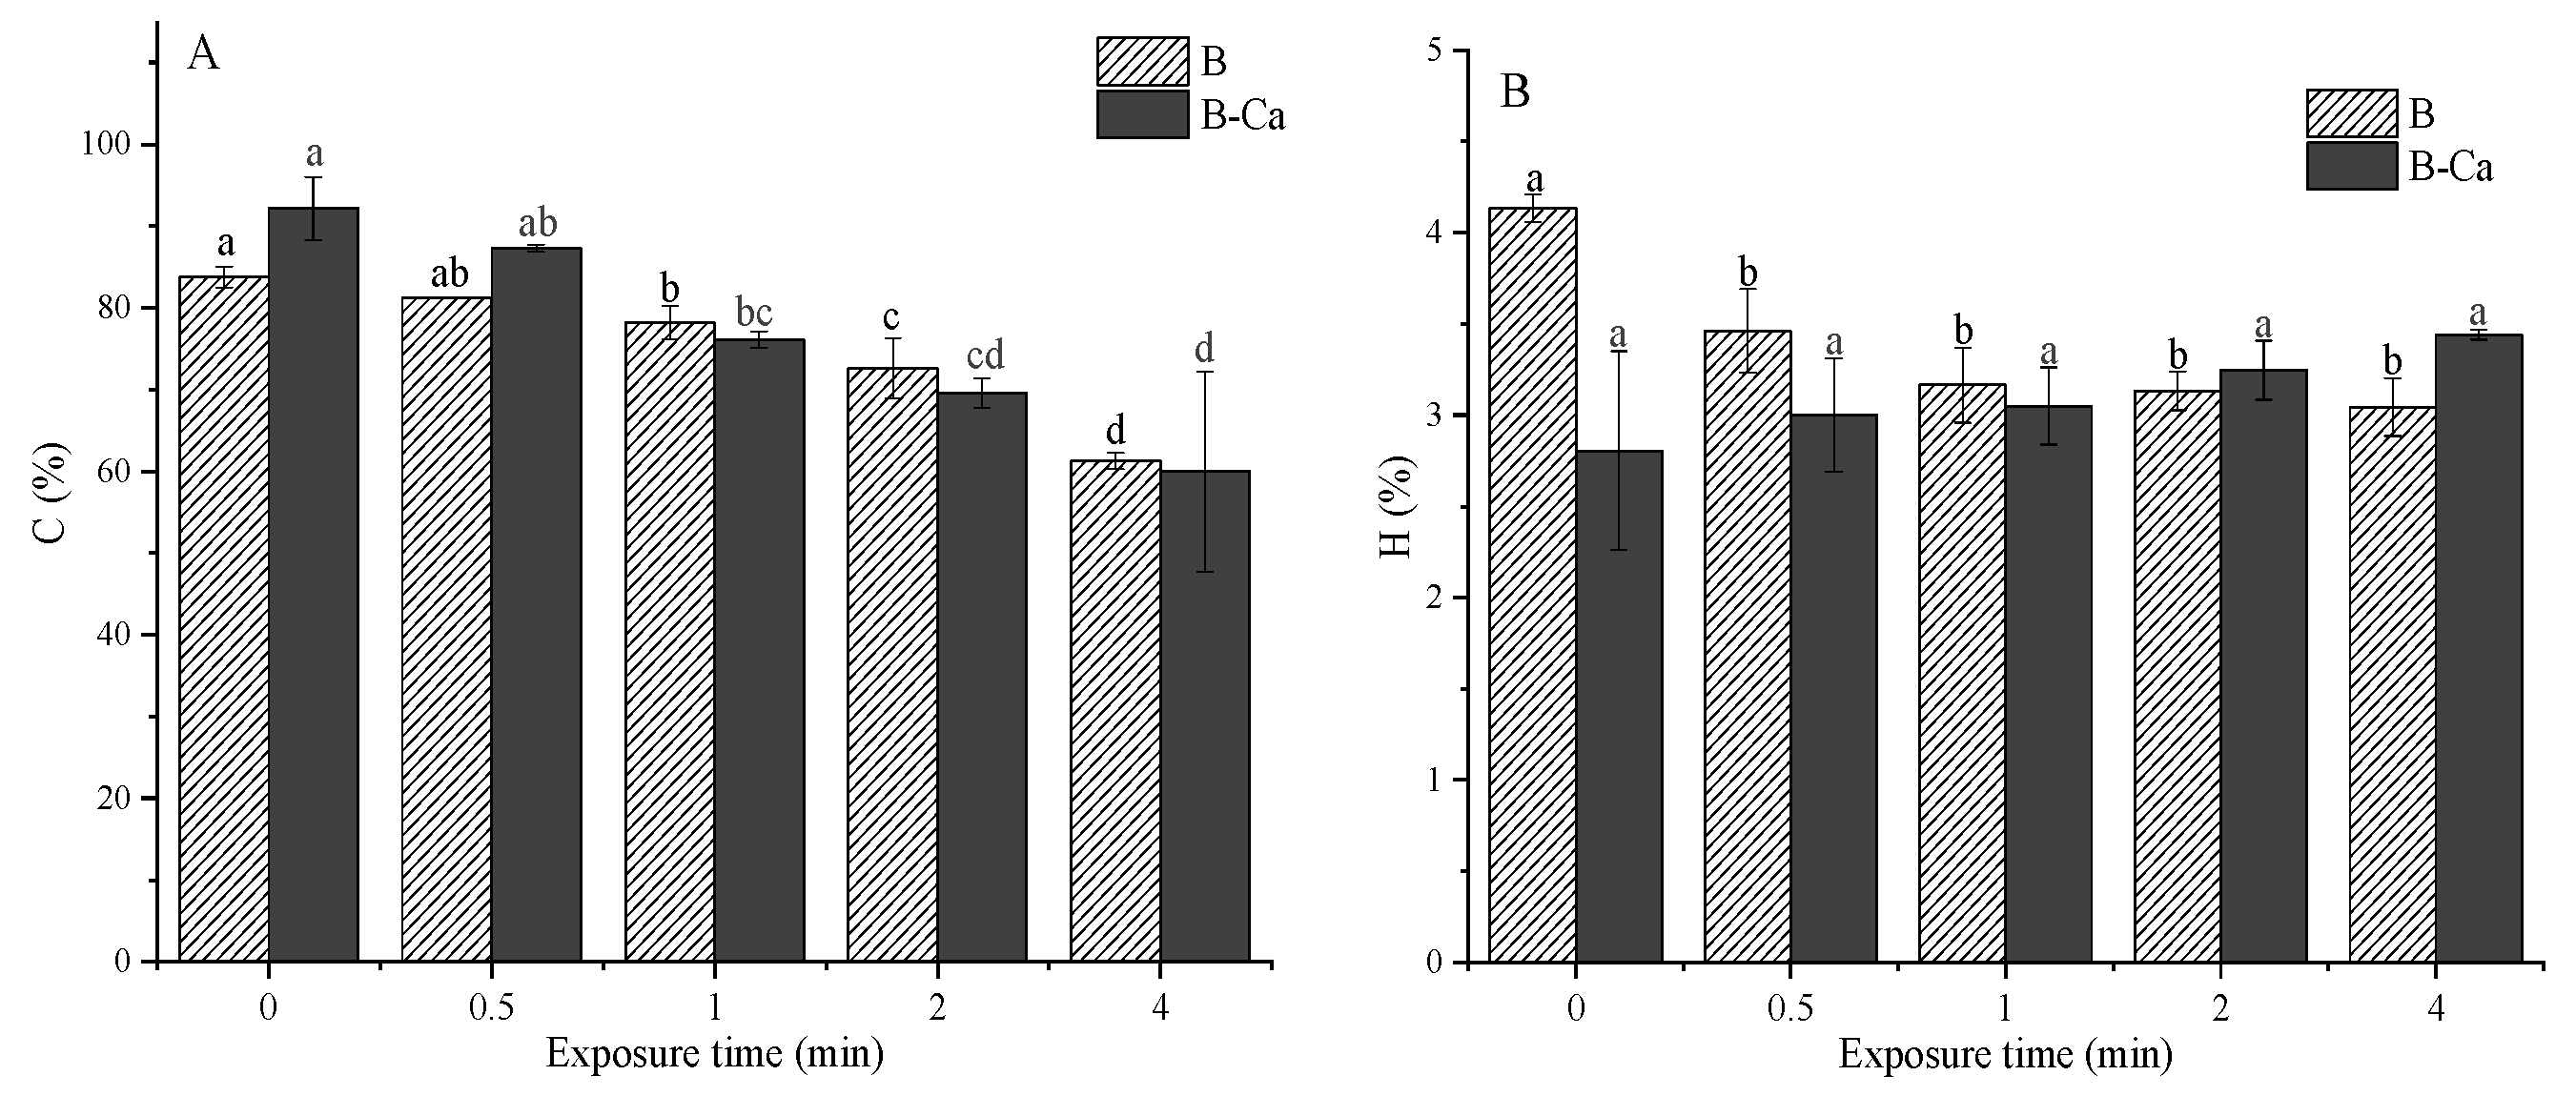
Figure 3.
Carbon capture capacity as affected by exposure time and mineral coating (B: without mineral coating, B-Ca: with mineral coating). Lowercase letters (a–e) indicate significant differences between exposure times (p < 0.05, Duncan’s test).
Figure 3.
Carbon capture capacity as affected by exposure time and mineral coating (B: without mineral coating, B-Ca: with mineral coating). Lowercase letters (a–e) indicate significant differences between exposure times (p < 0.05, Duncan’s test).
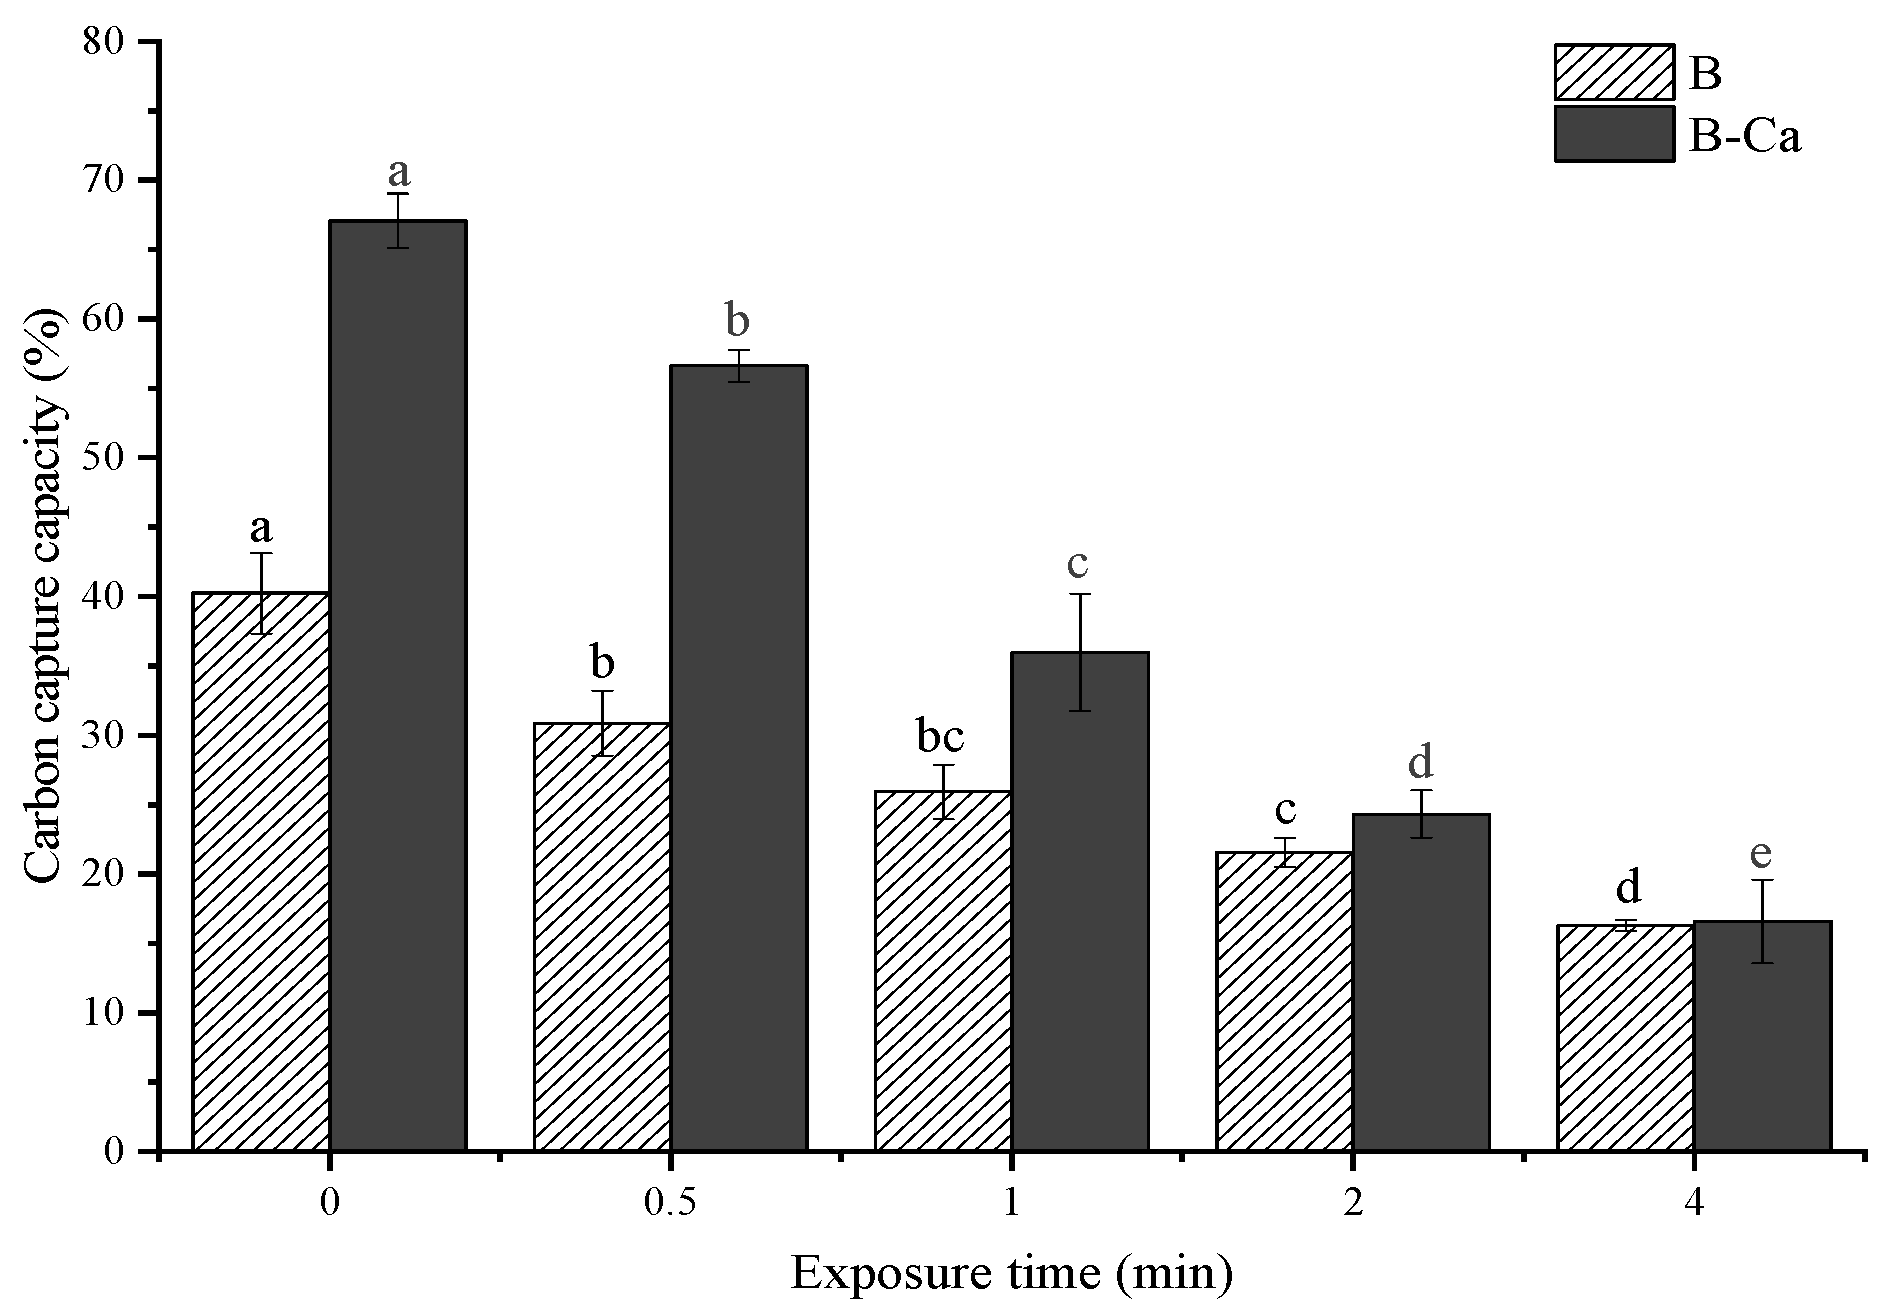
Figure 4.
Specific surface area of biochars as affected by exposure time and mineral coating (B: without mineral coating, B-Ca: with mineral coating). Lowercase letters (a–d) indicate significant differences between exposure times (p < 0.05, Duncan’s test).
Figure 4.
Specific surface area of biochars as affected by exposure time and mineral coating (B: without mineral coating, B-Ca: with mineral coating). Lowercase letters (a–d) indicate significant differences between exposure times (p < 0.05, Duncan’s test).

Figure 5.
Functional groups of biochars as affected by exposure time and mineral coating (B: without mineral coating, B-Ca: with mineral coating). Lowercase letters (a–e) indicate significant differences between exposure times (p < 0.05, Duncan’s test).
Figure 5.
Functional groups of biochars as affected by exposure time and mineral coating (B: without mineral coating, B-Ca: with mineral coating). Lowercase letters (a–e) indicate significant differences between exposure times (p < 0.05, Duncan’s test).
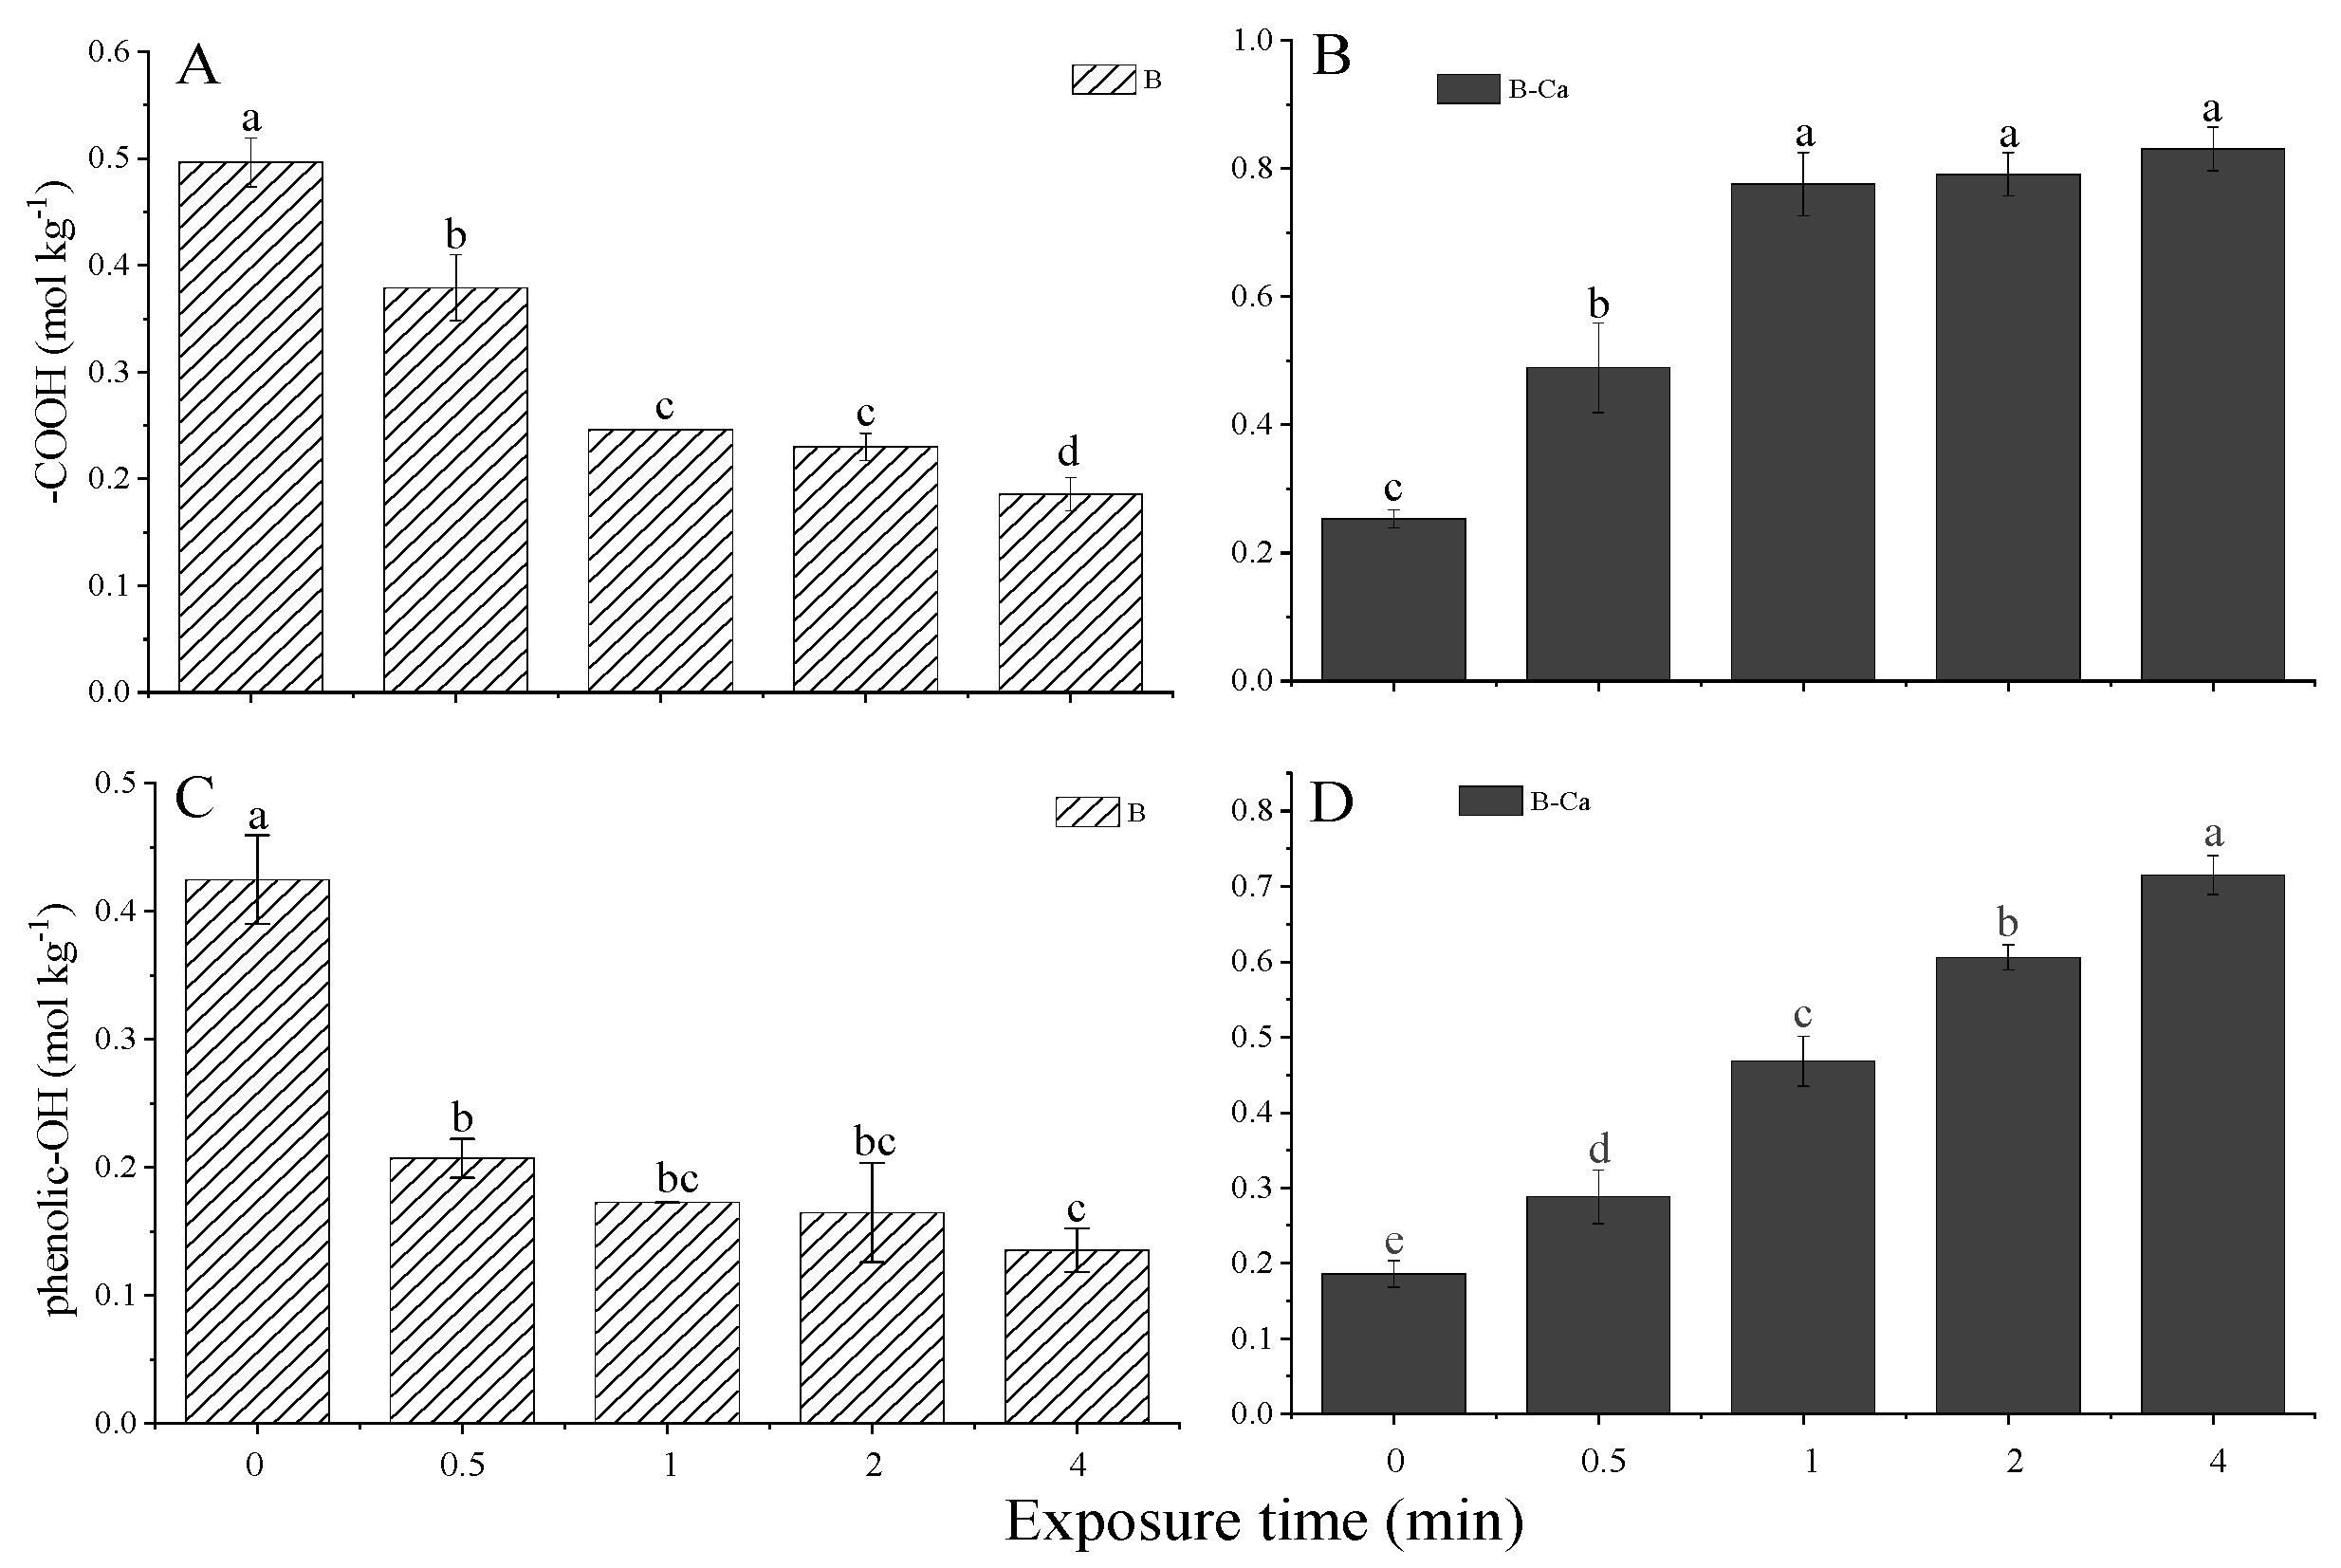
Figure 6.
FTIR spectra of biochars at 0 min exposure time with (B-Ca) or without (B) mineral coating.
Figure 6.
FTIR spectra of biochars at 0 min exposure time with (B-Ca) or without (B) mineral coating.
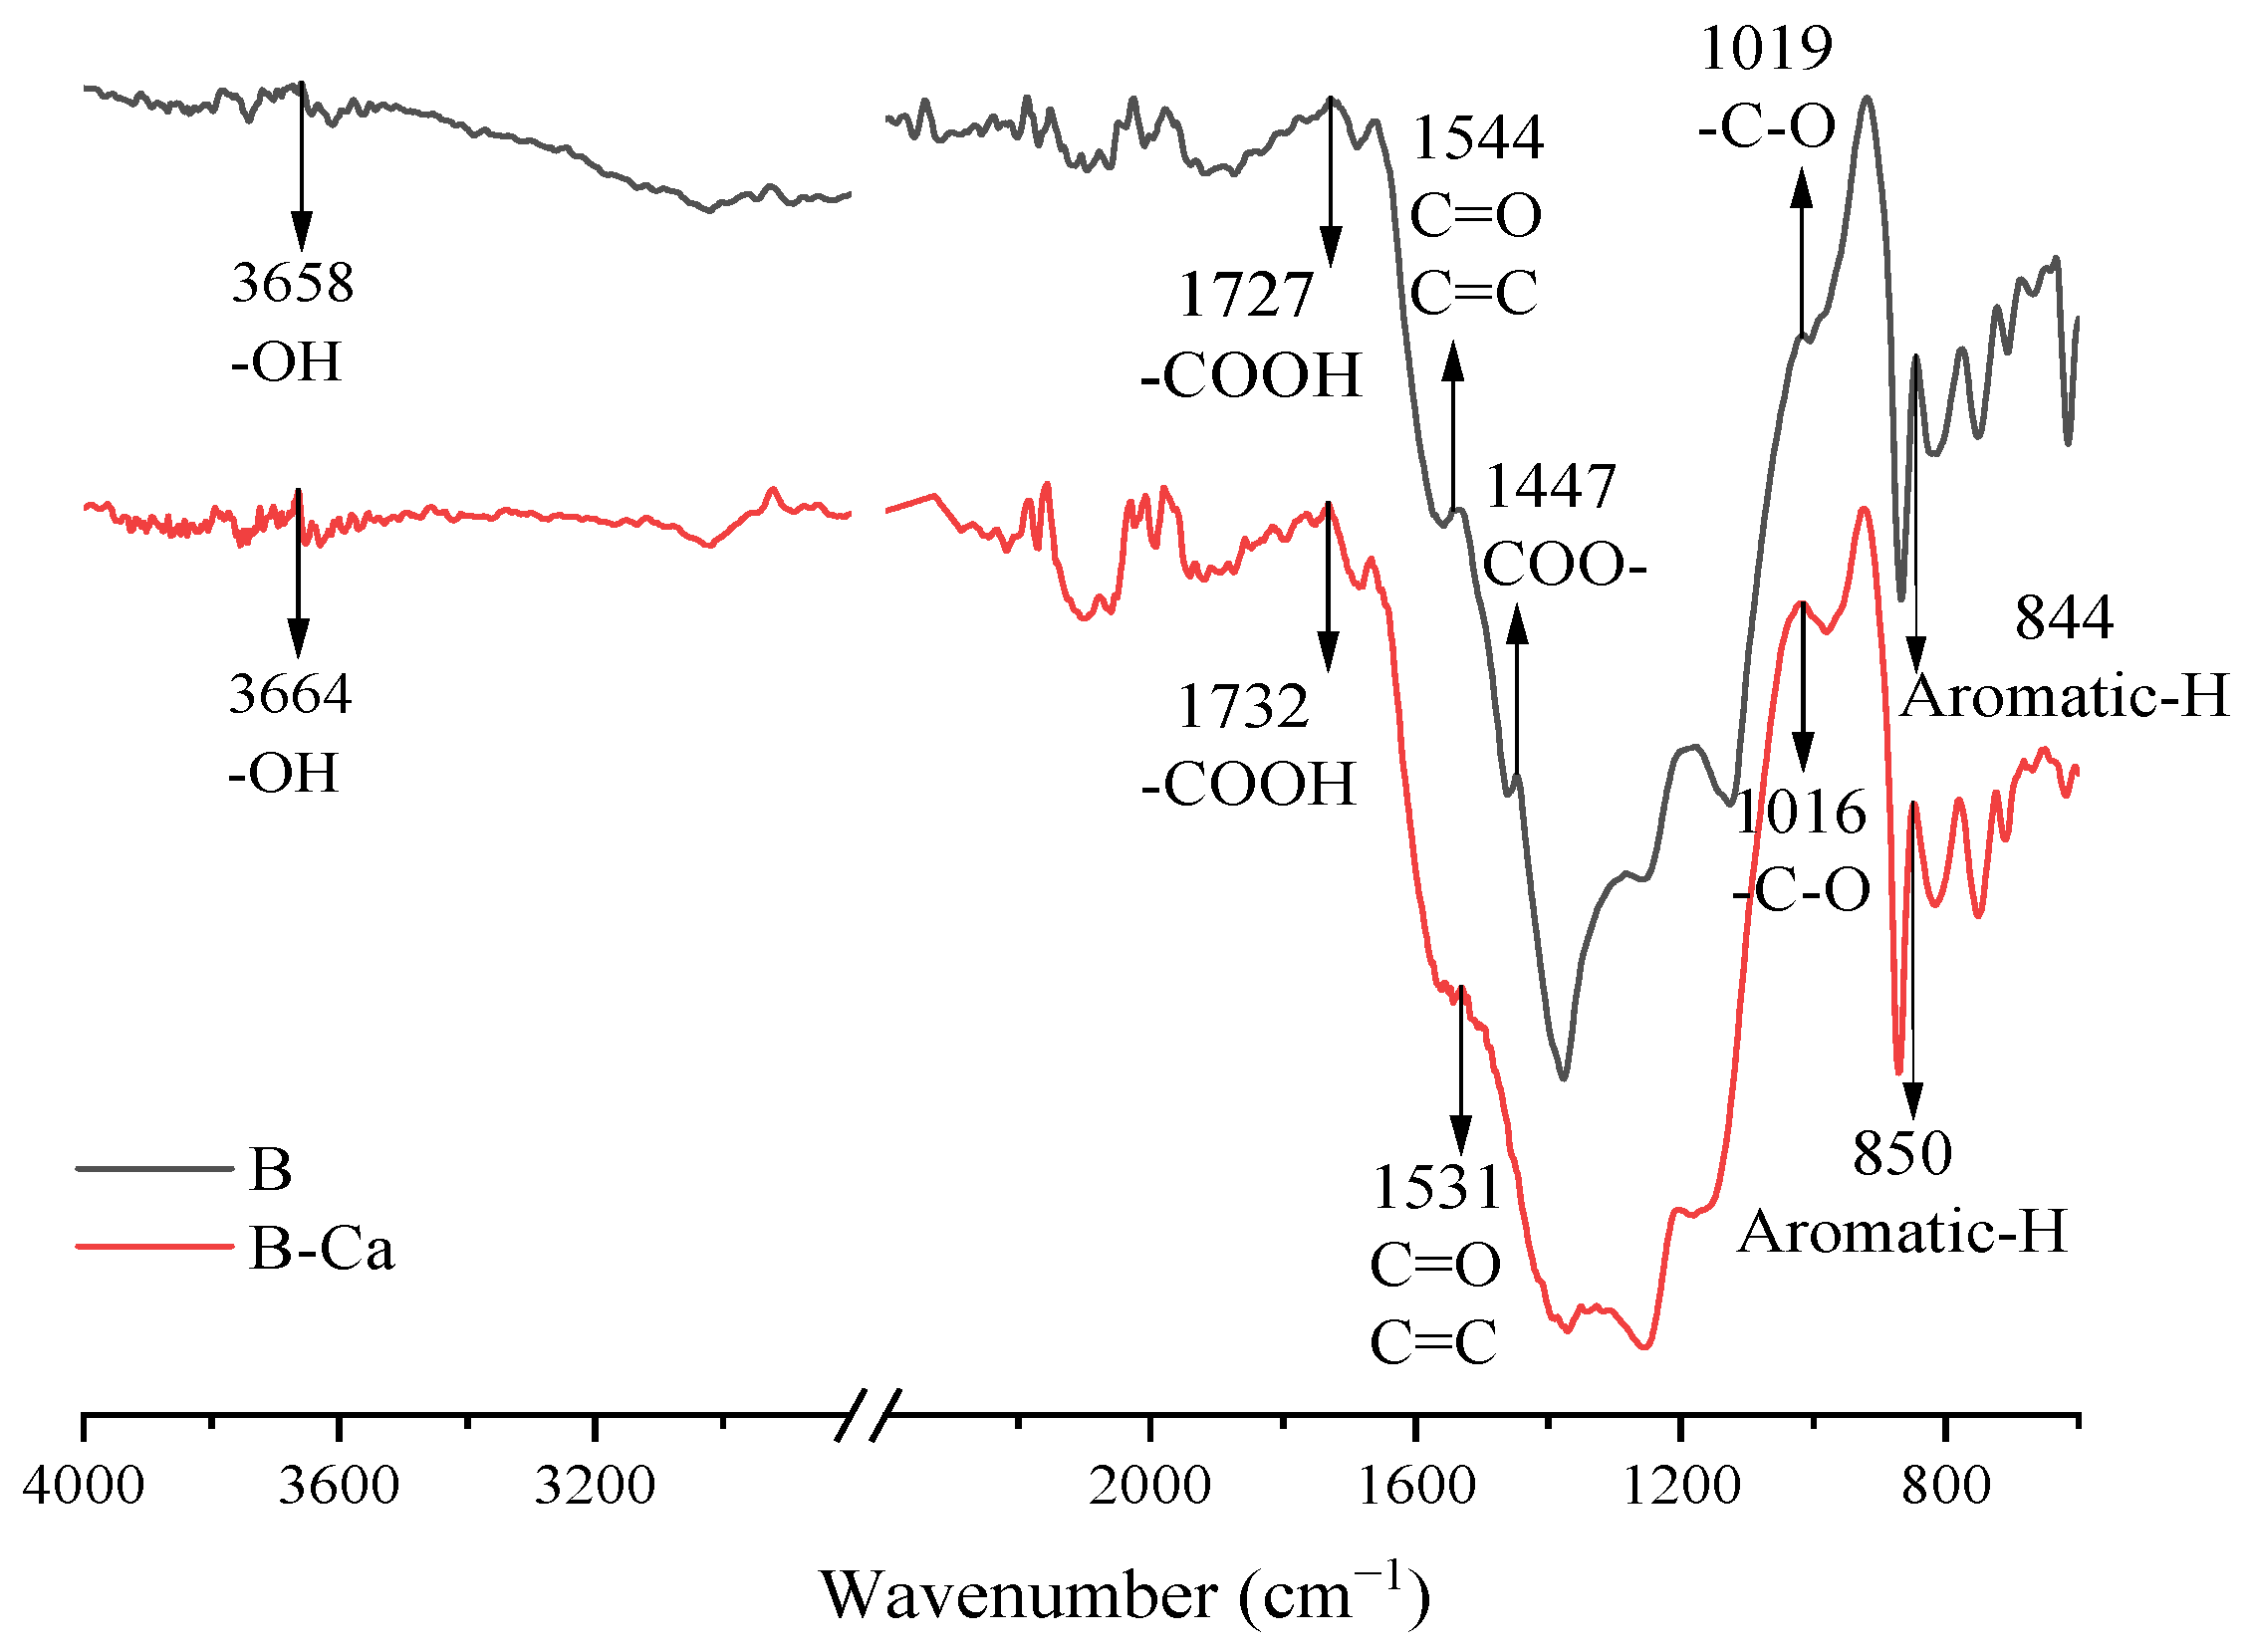
Figure 7.
SEM images of biochars at 0 min exposure time (a) without mineral coating, (b) with mineral coating.
Figure 7.
SEM images of biochars at 0 min exposure time (a) without mineral coating, (b) with mineral coating.

Table 1.
Ash content, pH, and pyrolysis temperature as affected by exposure time and mineral coating (B: without mineral coating, B-Ca: with mineral coating).
Table 1.
Ash content, pH, and pyrolysis temperature as affected by exposure time and mineral coating (B: without mineral coating, B-Ca: with mineral coating).
| Index | Treatments | Exposure Time (min) | ||||
|---|---|---|---|---|---|---|
| 0 | 0.5 | 1 | 2 | 4 | ||
| Ash content (%) | B | 1.03 ± 0.23 c,* | 1.29 ± 0.10 c | 1.52 ± 0.07 c | 3.30 ± 0.98 b | 6.10 ± 0.81 a |
| B-Ca | 6.93 ± 1.48 c | 9.49 ± 0.29 bc | 11.59 ± 0.55 b | 16.81 ± 2.81 a | 18.49 ± 1.15 a | |
| pH | B | 7.96 ± 0.06 b | 8.13 ± 0.23 ab | 8.17 ± 0.26 ab | 8.23 ± 0.15 ab | 8.58 ± 0.38 a |
| B-Ca | 8.39 ± 0.24 a | 8.12 ± 0.04 ab | 8.05 ± 0.11 ab | 8.01 ± 0.04 ab | 7.97 ± 0.04 b | |
| Pyrolysis temperature (°C) | B | 564.9 ± 27.6 a | 457.6 ± 28.4 b | 385.9 ± 5.1 c | 143.7 ± 23.1 d | 47.3 ± 7.9 e |
| B-Ca | 623.6 ± 16.1 a | 457.3 ± 14.0 b | 424.5 ± 7.0 b | 347.5 ± 25.0 c | 117.8 ± 13.8 d | |
* Average value ± standard deviation. As the values decrease, the labels change from a to d successively. Lowercase letters (a–e) indicate significant differences between exposure times (p < 0.05, Duncan’s test). Two letters (e.g., ab and bc) are used if the treatment difference is insignificant.
Table 2.
Correlations between carbon capture capacity and other properties of biochar (B: without mineral coating, B-Ca: with mineral coating).
Table 2.
Correlations between carbon capture capacity and other properties of biochar (B: without mineral coating, B-Ca: with mineral coating).
| Treatments | Dimension | Carbon Capture Capacity (%) | Ash Content (%) | pH | Specific Surface Areas (m2/g) | Phenolic-OH (mol/kg) | -COOH (mol/kg) |
|---|---|---|---|---|---|---|---|
| B | Carbon capture capacity (%) | 1 | |||||
| Ash content (%) | −0.819 ** | 1 | |||||
| pH | −0.698 * | 0.789 ** | 1 | ||||
| Specific surface areas (m2/g) | 0.938 ** | −0.906 ** | −0.770 ** | 1 | |||
| phenolic-OH (mol/kg) | 0.880 ** | −0.578 | −0.53 | 0.761 * | 1 | ||
| -COOH (mol/kg) | 0.958 ** | −0.699 * | −0.668 * | 0.907 ** | 0.930 ** | 1 | |
| B-Ca | Carbon capture capacity (%) | 1 | |||||
| Ash content (%) | −0.934 ** | 1 | |||||
| pH | 0.772 ** | −0.794 ** | 1 | ||||
| Specific surface areas (m2/g) | 0.964 ** | −0.905 ** | 0.812 ** | 1 | |||
| phenolic-OH (mol/kg) | −0.983 ** | 0.953 ** | −0.785 ** | −0.974 ** | 1 | ||
| -COOH (mol/kg) | −0.944 ** | 0.856 ** | −0.829 ** | −0.941 ** | 0.938 ** | 1 |
** significant at 0.01 level. * significant at 0.05 level.
Disclaimer/Publisher’s Note: The statements, opinions and data contained in all publications are solely those of the individual author(s) and contributor(s) and not of MDPI and/or the editor(s). MDPI and/or the editor(s) disclaim responsibility for any injury to people or property resulting from any ideas, methods, instructions or products referred to in the content. |
© 2023 by the authors. Licensee MDPI, Basel, Switzerland. This article is an open access article distributed under the terms and conditions of the Creative Commons Attribution (CC BY) license (https://creativecommons.org/licenses/by/4.0/).
Share and Cite
MDPI and ACS Style
Xiao, L.; Wu, J.; Li, W.; Yuan, G.; Xu, Q.; Wei, J.; Han, F. Mineral Coating Enhances the Carbon Sequestration Capacity of Biochar Derived from Paulownia Biowaste. Agronomy 2023, 13, 2361. https://doi.org/10.3390/agronomy13092361
AMA Style
Xiao L, Wu J, Li W, Yuan G, Xu Q, Wei J, Han F. Mineral Coating Enhances the Carbon Sequestration Capacity of Biochar Derived from Paulownia Biowaste. Agronomy. 2023; 13(9):2361. https://doi.org/10.3390/agronomy13092361
Chicago/Turabian StyleXiao, Liang, Jinghua Wu, Wenhan Li, Guodong Yuan, Qing Xu, Jing Wei, and Fengxiang Han. 2023. "Mineral Coating Enhances the Carbon Sequestration Capacity of Biochar Derived from Paulownia Biowaste" Agronomy 13, no. 9: 2361. https://doi.org/10.3390/agronomy13092361
Note that from the first issue of 2016, this journal uses article numbers instead of page numbers. See further details here.