Article

Analysis of Spatial and Temporal Variability and Coupling Relationship of Soil Water and Salt in Cultivated and Wasteland at Branch Canal Scale in the Hetao Irrigation District

College of Water Conservancy and Civil Engineering, Inner Mongolia Agricultural University, Huhhot 010018, China
*
Author to whom correspondence should be addressed.
Agronomy 2023, 13(9), 2367; https://doi.org/10.3390/agronomy13092367
Submission received: 3 August 2023 / Revised: 30 August 2023 / Accepted: 11 September 2023 / Published: 12 September 2023

Abstract

:
The Hetao Irrigation District is a typical salinized irrigation district in China, and soil salinization restricts agricultural development. To explore the spatial and temporal variability of soil water and salt and the coupling relationship in the Hetao Irrigation District, a field experiment was carried out at the scale of the Yichang Irrigation District branch canal in the downstream of the Hetao Irrigation District. Fifty-three soil sampling points were established to analyze the spatial and temporal variability of soil water content and total salt content and the coupling relationship using geostatistics and the coupling degree model. The results showed that soil water content in the study area belonged to medium variability and weak variability, and soil total salt content belonged to strong variability and medium variability. The theoretical models of soil water content and total salt content semi-variance function in the study area following the Gaussian model, with the block-base ratio less than 25%, with strong spatial autocorrelation, and the spatial correlation gradually increased with the increase of soil depth. The total salt content of the soil in the study area was interpolated with higher accuracy using radial basis functions as compared to ordinary kriging interpolation. In terms of temporal changes in salinity, the average salt accumulation rate of the 0–100 cm soil layer in the study area was 20.17% when salinity increased from May to June; the average desalination rate was 16.37% when salinity decreased from June to August. The main factors affecting soil salinity in cultivated land during the growing period were irrigation, precipitation, and planting crops, and the main factors affecting soil salinity in wasteland were precipitation and topography. The average coupling degree of soil water and salt in wasteland in the study area was lower than that of cultivated land, ranging from 65.15% to 86.59% of that of cultivated land. The level of coordination is marginal coordination for cultivated land and marginal disorder for wasteland. The study provides a theoretical basis for the prevention and control of soil salinization in arid areas.

1. Introduction

The Hetao Irrigation District is a typical mega-irrigation district in the Yellow River Basin of China [1] and the largest self-flowing irrigation district in Asia [2]. Its yellow diversion control area is 1.162 million hm2 [3], and it is an important production base for China’s major grain and cash crops [4]. Being located in an arid inland area, it suffers from strong evaporation and low precipitation all year round, with a high water table, leading to serious soil salinization problems [5]. This, together with anthropogenic factors such as farming practices and irrigation, has led to increasing secondary soil salinization [6]. Soil salinization has become an urgent problem in the Hetao Irrigation District [7].
Soil water and salt are characterized by high spatial variability under the combined influence of climate, soil type, topography, and human activities [8,9]. Geostatistics is a widely used method for studying soil spatial variability, describing these properties through semi-variance functions [10]. Geostatistics is a reliable approach for examining the spatial properties and variability of soils [11]. Using geostatistical methods to explore the spatial variability characteristics of soil water content and salinity can reflect the distribution and variability characteristics of water and salinity in the area more intuitively and effectively. It can also recognize and grasp the spatial correlation of soil water content and total salinity and clarify the dynamic changes of soil water and salt, thus providing a theoretical basis for the solution of local soil salinization problems [12].
Understanding the spatial and temporal variability of soil water and salinity is a critical component of managing salinized soils and improving crop yields, as well as formulating related management strategies [13]. This topic has been the focus of extensive research by scholars both domestically and internationally [14,15]. Rongjiang Yao et al. [16] analyzed the spatial variability of soil salinity in different soil layers of typical plots in the Yellow River Delta. Their study aimed to reveal the spatial variability pattern of soil salinity, which extended the understanding of spatial and temporal variability of soil salinity in both horizontal and vertical scales. Jinzheng Zhu et al. [17] investigated the spatial and temporal variability of soil salinity in green areas of the Tianjin Binhai Development Zone to establish a theoretical basis for alkali drainage and salt control in the region’s green areas. Igor Bogunovic et al. [18] studied the spatial variability of soil chemical properties of agroecosystems in eastern Croatia, examining the short-term and regional spatial variability of several soil chemical properties to provide quantitative information for regional planning and environmental monitoring and protection. Xu Dou et al. [12] studied the spatial variability of soil salinity in a typical zone of the Hetao Irrigation District and considered the effect of groundwater burial depth on soil salinity, reflecting the degree and state of salinization within the root layer of soil vegetation. Zhanyong Fu et al. [19] quantified the soil salinity content, anions, and cations in the pre-monsoon, monsoon, and post-monsoon seasons of Shenier Island in the Yellow River Delta. They concluded that soil salinity exhibited significant spatial heterogeneity and seasonality in different microtopographic types. Yannan Liu et al. [20] analyzed the spatial and temporal variability of soil water content and salinity at different depths and their relationship, considering the effects of groundwater burial depth and mineralization on soil salinity. Their findings provide technical support for the prevention and control of soil salinization in arid zones.
The study of soil water–salt coupling can better understand the transport and transformation process of water and salt in the soil, which is of great significance for the rational use of land resources and the prevention of land salinization. Xudong Zhang et al. [21] reviewed the coupling of heat, salt, mechanics, and gas based on water–salt transport and provided an outlook on the future direction of soil salinization in a carbon-neutral environment. Qingfeng Wang et al. [22] studied the coupling effect and mechanism of water, heat, and salt in permafrost in the source region of the Yellow River on the Tibetan Plateau, providing a scientific basis for soil salinization research. Yong Guo et al. [23] studied the soil water and salt dynamic law of different landscape units in arid inland areas under water-saving irrigation conditions, constructed a BP neural network soil water and salt coupling model, and provided a theoretical basis for the mechanism of soil water and salt mutual influence. Congliang Luo et al. [24] established a three-field coupling model of water–heat–salt in unsaturated sulfuric acid saline soil, which provides a reference for the treatment of soil salinization and engineering construction in arid zones.
At present, a large number of studies on the spatial and temporal variability and coupling relationship of soil water and salt have been conducted at domestic and international levels. However, all of them focus on the large space and farmland scale, and there are fewer studies on the spatial and temporal variability and coupling relationship of soil water salinity in cultivated land and wasteland at the scale of a branch canal. The Hetao Irrigation District is an alluvial floodplain, and there are many salt wastelands in the irrigation district with irregular distribution. Wasteland, as a storing area of salinity in the region, has a close and complex hydraulic connection with cultivated land. Therefore, mastering the spatial and temporal distribution patterns and characteristics of soil salinity in cultivated and wastelands is an important prerequisite for preventing and controlling soil salinization.
In addition, the spatial and temporal variability and coupling relationships presented by soil water and salt are different at different scales, and the rational delineation of the scale is conducive to the correct interpretation of the nature of the research object [25]. The branch canal scale is a scale between the large space and the field. Compared with the large space, it is more accurate, and can more accurately reflect the hydrological process and water resources utilization; compared with the point scale in the field, it can avoid the limitations caused by the small scale. The study of branch canal scale can also take into account the influence of topography, soil, vegetation, and other surface features on hydrological processes, which is more flexible and operable and can be flexibly adjusted according to the actual situation to meet the different research and management needs. Therefore, in this study, the Zuo Er Branch Canal in the Yi Chang Irrigation District was selected for the experiment, focusing on the spatial and temporal variability characteristics of soil water and salinity in cultivated land and wasteland and the coupling relationship, to provide a theoretical basis for the improvement and prevention of salinization in the Hetao Irrigation District.

2. Materials and Methods

2.1. Study Area

The experiment was conducted from May to August 2022 in the Yichang Irrigation District. The study area is located in Wuyuan County, downstream of the Hetao Irrigation District in the Yellow River Basin of China, in an irrigation and drainage unit controlled by the Zuo Er Branch Canal, as shown in Figure 1. The study area is about 2.78 km wide from east to west and 5.24 km long from north to south, with a total area of 1553 hm2, of which 1121 hm2 is cultivated and 129 hm2 is wasteland. The geographical location of the study area is 108°19′7″ E~108°21′19″ E, 41°6′41″ N~41°9′39″ N, and the altitude is 1021.23~1025.97 m. The study area has a temperate continental monsoon climate with dry and windy conditions, variable temperature, sufficient sunshine, strong evaporation, scarce and concentrated rainfall, large temperature difference between day and night, and a short frost-free period. The average annual temperature is 6.1 °C, the frost-free period is 133 d, the number of sunshine hours is 3230.9 h, the precipitation is 177 mm, and the rainfall is concentrated from June to August each year. The average groundwater depth in the study area from May to August 2022 was 1.7 m. The main physicochemical properties of the soil in the study area are shown in Table 1.

2.2. Experimental Design

The grid method (600 m × 600 m) was used to lay out the soil sampling points; considering that the ratio of cultivated to wasteland in the study area was 8.69, 44 soil sampling points were laid out for cultivated land and 9 for wasteland soil sampling points. Due to multiple factors such as topography, human activities, planting types, and ditch distribution, field sampling locations were adjusted. Finally, 53 sampling points were laid out and recorded by GPS technology (Figure 1). Sampling was conducted once a month from May–August 2022. Soil sampling points were sampled at 20 cm intervals using soil augers and were added a layer in the surface layer for a total of 6 layers (0–10 cm, 10–20 cm, 20–40 cm, 40–60 cm, 60–80 cm, and 80–100 cm). The samples were taken while a portion of the soil samples were packed in an aluminum box to determine the soil mass water content using the drying method. A portion of the soil samples taken was air-dried and sieved through a 1 mm sieve to make a soil–water ratio of 1:5 soil leachate, and the conductivity was determined using a conductivity meter (Leici DDS-307A, Shanghai, China).

2.3. Research Methodology

2.3.1. Soil Total Salt Content Calculation

The conversion of soil conductivity to total soil salinity is calculated using the equation [26]
C = 3.7657EC1:5 − 0.2405
where C is the soil total salt content, g/kg; EC1:5 is the conductivity of soil extract with the soil—water ratio of 1:5, dS/m.

2.3.2. Coefficient of Variation

The ratio of the standard deviation to the mean is the coefficient of variation, which can reflect the magnitude of spatial variability in soil water content and total salinity [27] and is calculated as the equation
C v = σ μ × 100 %
where σ is the standard deviation of the sample; µ is the mean of the sample; Cv is the coefficient of variation, %. weak variability for Cv ≤ 10%, moderate variability for 10% < Cv < 100%, and strong variability for Cv ≥ 100% [28].

2.3.3. Semi-Variance Function

The semi-variance is defined as half of the estimated squared difference between sample values at a given distance [29] and can represent the spatial variance structure of a variable with the equation
γ h = 1 2 N h i = 1 N h Z ( x i ) Z x i + h 2
where γ(h) is the semi-variance; N(h) is the lag distance, which is equal to the logarithm of point h; Z(xi) is the measured value of the variable at point xi; Z(xi + h) is the measured value of the variable at the deviation h from point xi. The semi-variance function in this paper is fitted with a Gaussian model, and the expression is the equation
γ h = C 0 + C ( 1 e ( h a ) 2 )
where h is the lag distance; C is the arch height; C0 is the block gold value; C0 + C is the abutment value; a is the variable range, indicating the maximum correlation distance of spatial variables.

2.3.4. Ordinary Kriging Interpolation and Radial Basis Functions Interpolation

Ordinary kriging provides the best linear unbiased estimate [30], and, in this paper, ordinary kriging is used to interpolate to obtain the spatial distribution of soil water content and salinity in the study area. Assuming that there are n measurement points in the neighborhood of the estimated point x0, i.e., x1x2, …, xn, the ordinary kriging interpolation equation is
Z * ( x 0 ) = i = 1 n λ i Z ( x i )
where Z(xi) is the observation selected for kriging interpolation near the estimation point x0; Z*(x0) is the kriging estimate at x0; λi is the weight of the ith observation on the estimation point x0.
Radial basis functions interpolation is an exact deterministic interpolator with the interpolation equation [31]
Z = i = 1 n λ i Φ ( x x i ) + p ( x )
where Z is the predicted value; p(x) is a polynomial function; λ i is the real valued weight; |xxi| denotes the Euclidean distance between x and the center point xi; and Φ is the radial basis functions.

2.3.5. Soil Salt Accumulation Rate and Desalination Rate Calculation

The rate of soil salt accumulation is the rate of increase in total soil salt in a given period compared to the previous period and is calculated by the equation
t = S i S i 1 S i × 100 %
where t is the soil salt accumulation rate; Si is the total soil salt in period i; Si − 1 is the total soil salt in period i − 1.
The rate of soil desalination is the rate of reduction of total soil salinity in a given period compared to the subsequent period and is calculated by the equation
w = S i S i + 1 S i × 100 %
where w is the soil desalination rate; Si is the total soil salinity in period i; Si + 1 is the total soil salinity in period i + 1.

2.3.6. Soil Water and Salt Coupling Coordination Degree Model

To clarify the degree of soil water and salt interaction in the study area, the soil water content and total salt content data were normalized, drawing on the coupling theory in physics [32]. The soil water and salt coupling coordination degree model equation was constructed as
C = 2 ( u 1 u 2 ) ( u 1 + u 2 ) ( u 1 + u 2 ) 1 2
T = α u 1 + β u 2
D = C · T
where C is the soil water and salt coupling degree, C ∈ [0, 1]. The larger value of C indicates that the soil water and salt influence each other to a greater extent. u 1 is the soil water content, and u 2 is the soil total salt content. T is a comprehensive soil water and salt evaluation index. α , β is the coefficient of determination to be used to calculate the T value. Considering that soil water content and total salt content have the same importance, the coefficient of determination in this study was set to α = β = 0.5. D is the soil water and salt coupling coordination degree, and its evaluation criteria are shown in Table 2.

2.4. Data Processing

The statistical characteristics of the data were analyzed using Excel 2016 software. Normality was tested using Minitab 18.0 software, and the Box-Cox transformation was applied to non-normally distributed data. For the data that conformed to normal distribution after transformation, spatial correlation analysis was conducted using GS+9.0, and the optimal semi-variance function theoretical model was fitted. Ordinary kriging interpolation and radial basis functions interpolation were applied to the soil total salt content data in ArcGIS 10.3, and the optimal interpolation method was selected to map the spatial distribution of soil total salt content. Soil water and salt coupling coordination degree analysis was plotted using Origin 2021 software.

3. Results

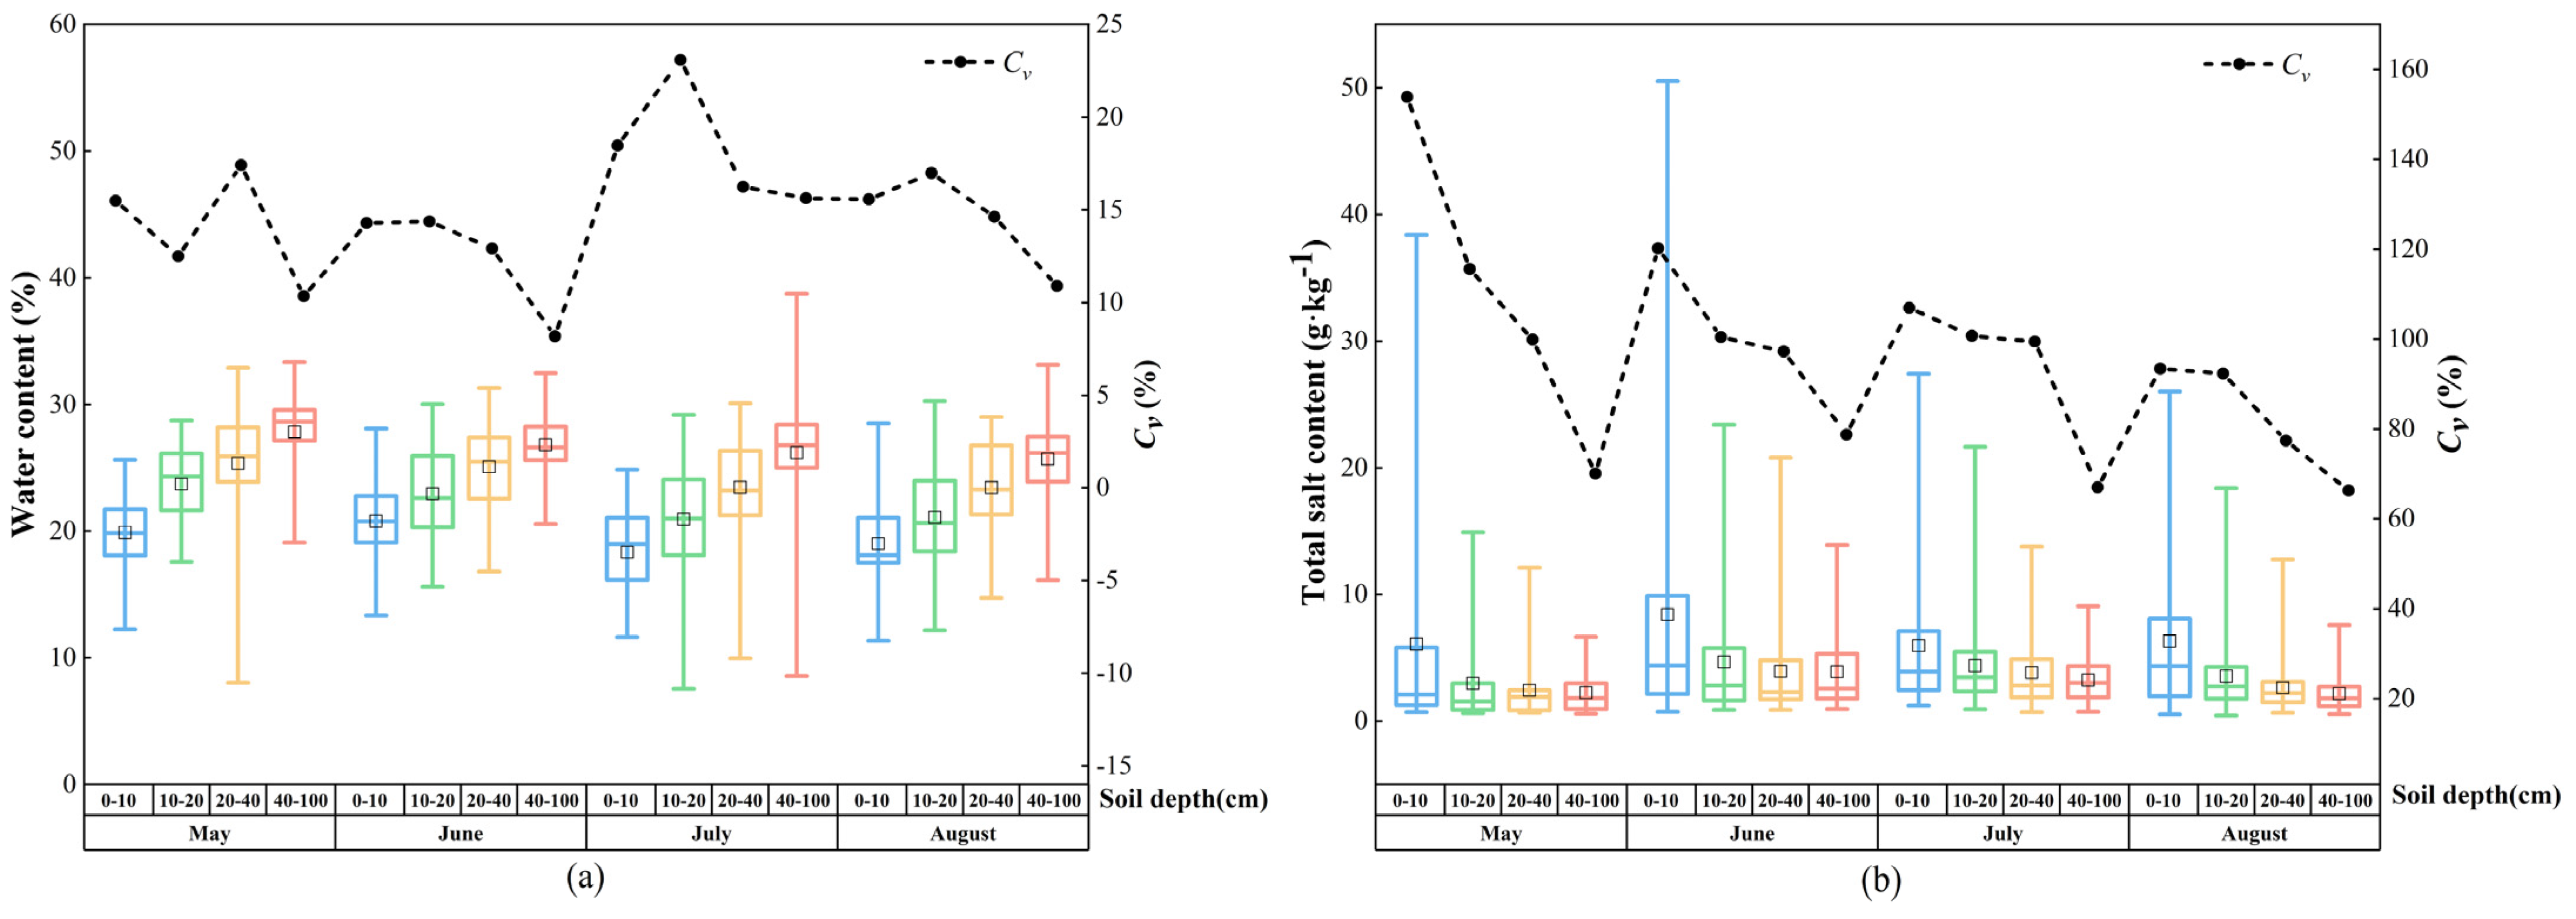
3.1. Statistical Characterization of Soil Water Content and Total Salt Content

The soil water content and total salt content of the study area were divided into four layers for the study; because the salinization degree of the top 0–20 cm of the soil was more serious, it was refined into two layers, and the final stratification results were 0–10 cm, 10–20 cm, 20–40 cm, and 40–100 cm.
As can be seen from Figure 2a, the mean value of soil water content varied from 17.977% to 27.833%. The mean values of water content in each month increased gradually with the depth of the soil layer, indicating that the deeper soils were recharged by groundwater, while evaporative losses were also smaller. The coefficient of variation of soil water content ranged from 8.185% to 23.085%, which is weak and medium variability. Figure 2b shows that the mean values of soil total salt content varied from 2.173 to 8.426 g/kg, and the mean values of the total salt content in each month decreased gradually with the increase of soil depth. The coefficient of variation of soil total salt content ranged from 66.293% to 153.873%, which is medium variability and strong variability. The coefficient of variation of the total salt content was much larger than that of water content, indicating that the spatial dependence of soil water content was weaker than that of the total salt content.

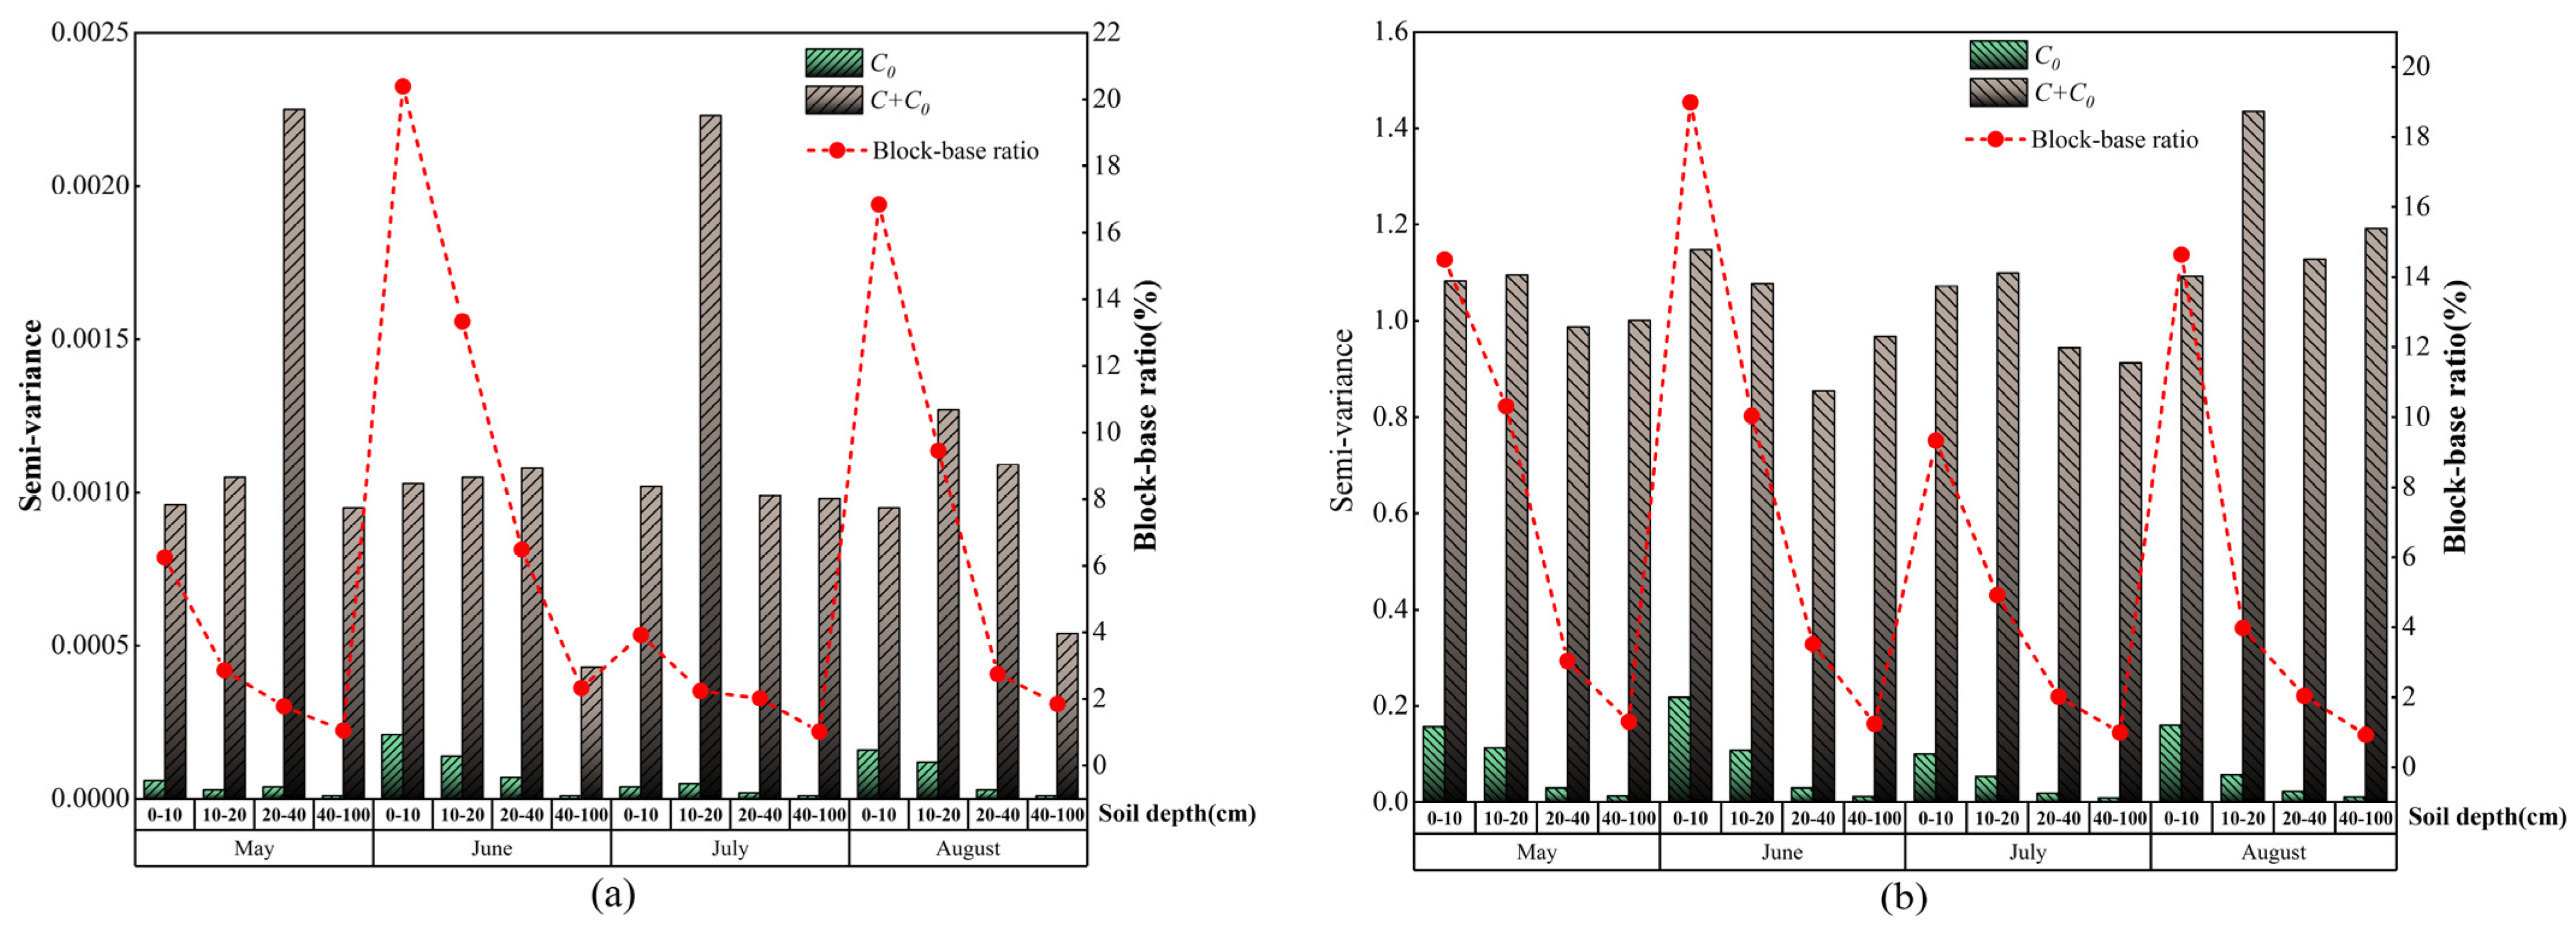
3.2. Spatial Correlation Analysis of Soil Water Content and Total Salt Content of Each Soil Layer in Different Periods

To investigate the spatial correlation of soil water content and salinity in each layer, the geostatistical software GS+9.0 was applied to perform autocorrelation analysis of spatial data for water content and total salinity. C0 is the block gold value indicating the spatial variation due to stochastic factors, C is the structural variance indicating the variation due to structural factors, and C0 + C is the abutment value, indicating the total variation [33]. The block-base ratio, also known as the spatial structure ratio, is defined as the ratio of the block gold value (C0) to the abutment value (C + C0), which can reflect which of the two structural influences (natural factors) or random influences (human factors) plays the dominant role in spatial variation [34]. The block-base ratio ranges from 0 to 1. When the block-base ratio is less than 25%, it exhibits a strong spatial correlation; it exhibits a medium spatial correlation within 25% to 75%, and, if it is greater than 75%, the spatial correlation is weak and is mainly affected by stochastic factors [35].
Theoretical models of semi-variance functions were fitted to the soil water content and total salinity of each layer during different periods, and the results were consistent with the Gaussian model. The correlation parameters are presented in Table 3, and the coefficients of determination ranged from 0.463 to 0.919 and 0.501 to 0.927, respectively, indicating a significant level of correlation. Its residual errors are less than 1.646 × 10⁻⁶ and 0.373, respectively, and the Gaussian model is considered to be a valid and good fit. From Figure 3a, we can see that the block-base ratio of water content for each month ranged from 1.020% to 20.388%, and from Figure 3b, we can see that the block-base ratio of soil total salinity ranged from 0.923% to 18.990%, both of which were less than 25%, and it can be considered that soil water content and total salinity have strong spatial autocorrelation.
Soil water content and total salinity both have strong spatial correlation, and the block-base ratio shows the same trend, i.e., with the increase of soil depth, the block-base ratio gradually decreases, and spatial correlation gradually increases, mainly caused by structural factors (e.g., climate, soil type, topography, etc.) causing variability, and random factors (e.g., tillage, irrigation, human activities, etc.) have less influence. The autocorrelation of deep soil water content and total salinity is stronger, and the influence of random factors on deep soil is weaker than that on surface soil. The reason is that random factors such as tillage, irrigation, and human activities affect the surface soil first, and after the surface soil is weakened, the effect on the deep soil is reduced.

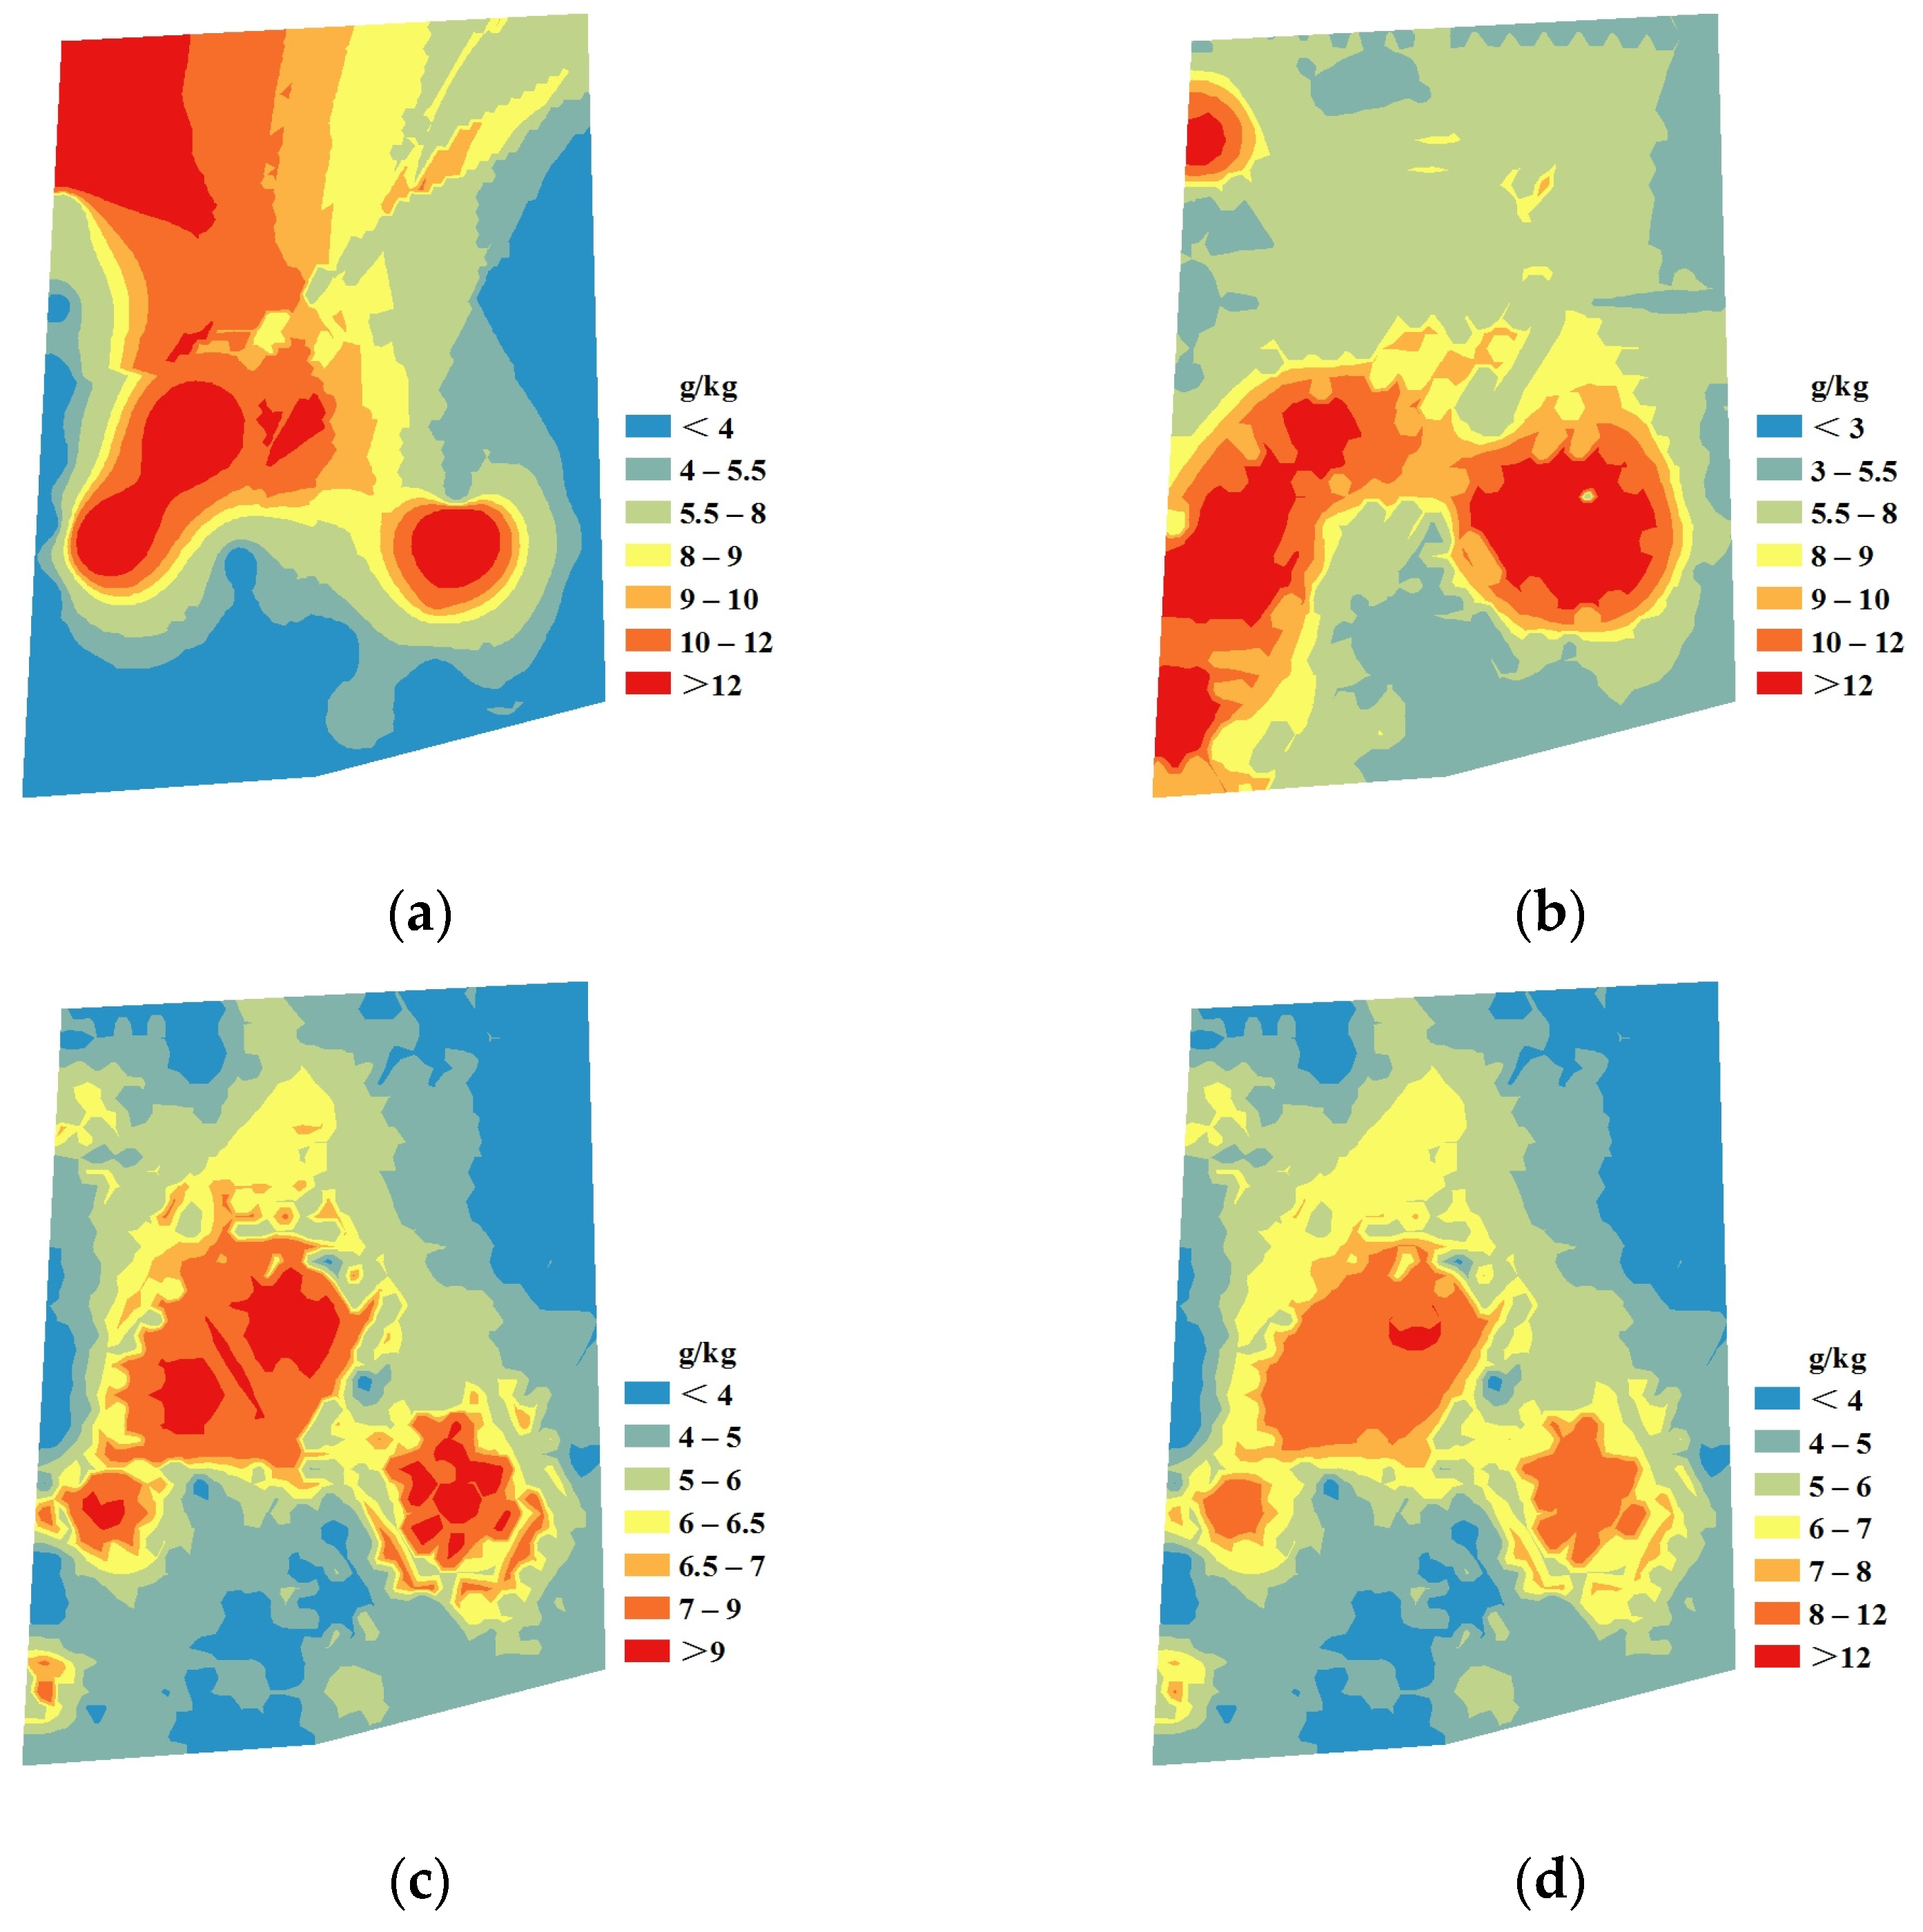
3.3. Spatial Distribution Characteristics of Soil Salinity

To investigate the spatial distribution characteristics of soil salinity in the study area, the total salt content data were interpolated using ArcGIS 10.3 software. Different interpolation methods give different results, and the more mainstream interpolation methods are ordinary kriging interpolation and radial basis functions interpolation. Therefore, in this study, the mean error (ME) and root mean square error (RMSE) were used to assess the accuracy and reliability of ordinary kriging interpolation and radial basis functions interpolation for the total salt content of the 0–100 cm soil layer in the study area. As shown in Table 4, the ME of the radial basis functions interpolation of the total salt content of the soil in the 0–100 cm soil layer in the study area was 75.93% of the ordinary kriging interpolation, which was more accurate; the RMSE was 103.04% of the ordinary kriging interpolation, and the degree of dispersion of the errors of the two methods was relatively close to each other. In summary, radial basis functions provided a more reliable calculation of the total salt content of the soil in the study area.
The spatial distribution of the total salt content of the soil interpolated by radial basis functions for different periods is shown in Figure 4. In terms of the spatial distribution of salinity, the salinity in the study area has a generally consistent distribution, i.e., the salinity is higher in the central part of the study area and relatively lower in the northern and southern parts. The soil salinity is higher in the central part of the study area due to the lower topography, increased groundwater recharge, and the existence of localized wastelands, which are influenced by multiple factors. The southern boundary of the study area is a trunk canal, the terrain is higher, the groundwater depth is deeper, and the groundwater recharge to the soil is less. Meanwhile, the northern part of the study area is close to the dry ditch, the drainage conditions are good, and the water carries the salts into the drainage ditch, so the soil salinity is lower. In terms of temporal changes in salinity, salinity increased in the study area from May to June, with an average salt accumulation rate of 20.17% in the 0–100 cm soil layer. The groundwater depth is shallow in June, the groundwater recharges the soil more, the soil salinity is higher; at the same time, the crops are just starting to grow, the ground surface is bare, and the strong soil evaporation makes the salts stagnate the surface of the soil, thus increasing the soil salinity. The average desalination rate of the 0–100 cm soil layer was 16.37% from June to August in the study area due to precipitation irrigation and crop growth.

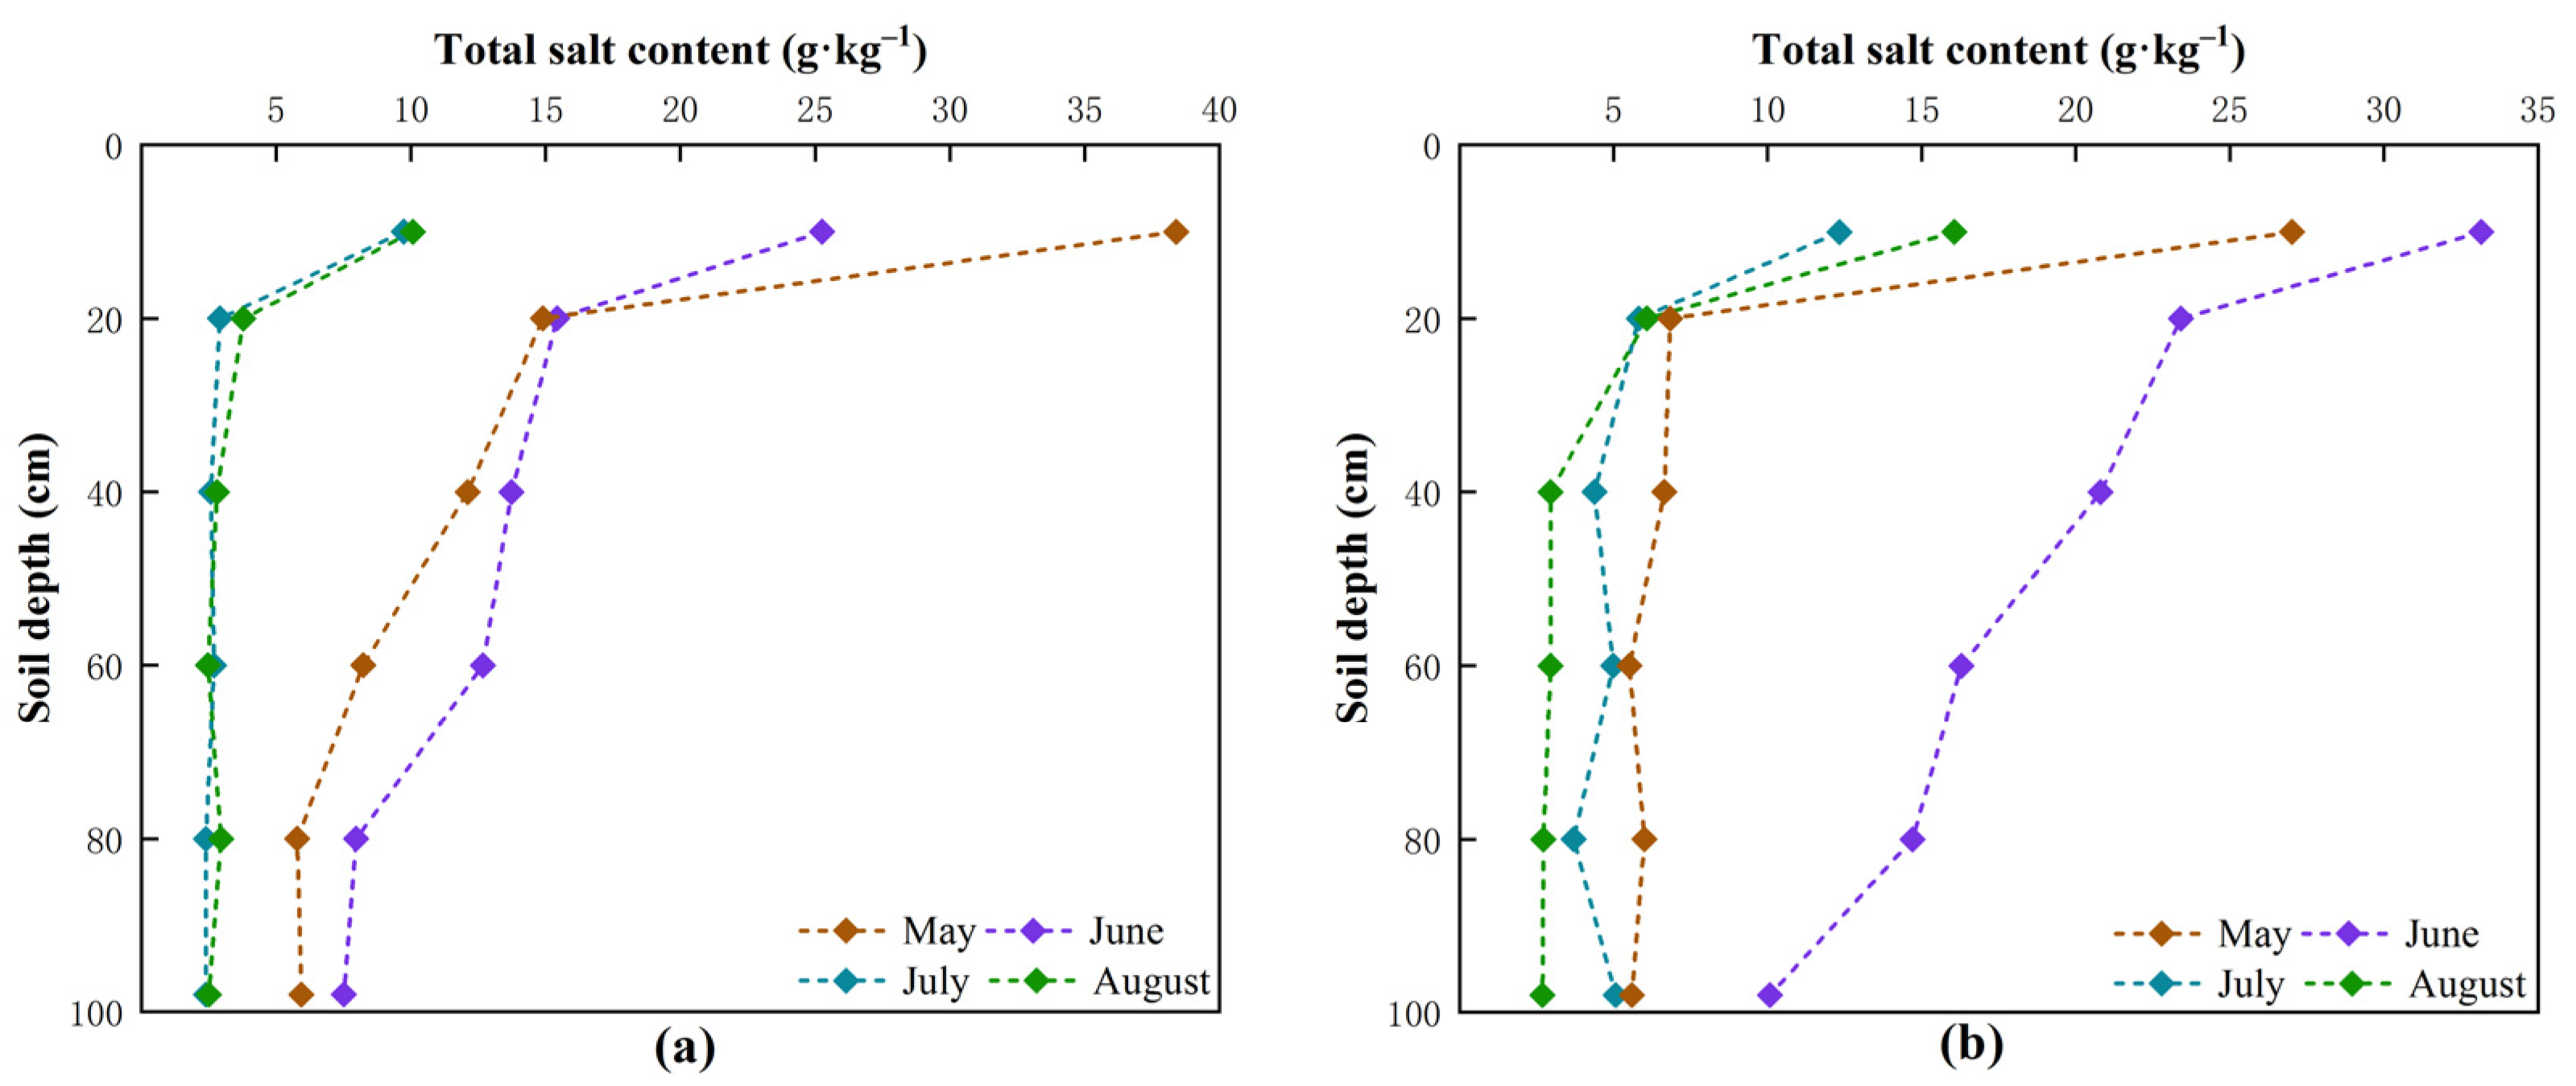
3.4. Distribution Pattern of Soil Salinity in Cultivated and Wasteland

To investigate the distribution pattern of soil salinity in the cultivated and wasteland in the study area, two representative areas were selected for cultivated land and wasteland, respectively, and vertical distribution maps of their total salt content were drawn. As shown in Figure 5 and Figure 6, the total salt content of cultivated land ranged from 0.5 to 10 g/kg and that of wasteland ranged from 2 to 40 g/kg during the growing period in the study area, and the salt content of cultivated land was 25% of that of wasteland.
The range of total salt content variation in the cultivated land is small, as can be seen in Figure 5. Cultivated land “a” (Figure 5a) was planted with maize, and the downward washing of surface soil salts was mainly affected by irrigation and precipitation. In July, due to multiple instances of irrigation and precipitation, more salts were washed downward, and the increase in the total salt content of the soil in the 20–40 cm layer was 65.23% of that in the 10–20 cm layer. Cultivated land “b” (Figure 5b) was planted with sunflowers, with no irrigation during the growing period, and the downward washing of salts in the surface soil was mainly influenced by precipitation, so the washing of salts was less, and the variation of the total salt content in different soil depths was smaller. It can be seen that the main factors affecting the total salt content of cultivated land are irrigation, precipitation, and planting crops.
From Figure 6, it can be seen that the total salt content of wastelands varied in a wide range. The desalination rate of wasteland “a” (Figure 6a) was 71.16% and that of wasteland “b” (Figure 6b) was 41.88% in the 0–100 cm soil layer from May to August. The reason for this is that wasteland “a” is adjacent to cultivated land, and the neighboring cultivated land is irrigated during the growing period of the crop. Irrigation water from the cropland leaks downward, and then lateral recharge occurs to the wasteland. This is followed by deep seepage from the wasteland, which carries the salts downward, resulting in high desalination rates. Wasteland “b” is at a distance from cultivated land, and the hydraulic exchange with cultivated land is more lagging. Salts from the cultivated land are leached into the groundwater and move towards the wasteland, which has a lower topography, and then migrate upwards under the action of capillary forces. Because the surface of wasteland “b” is exposed, soil evaporation is strong, the surface soil retains more salts, and salt washing mainly depends on precipitation, so the desalination rate is low. It can be seen that the main factors affecting the total salt content of wasteland soil are precipitation and topography.

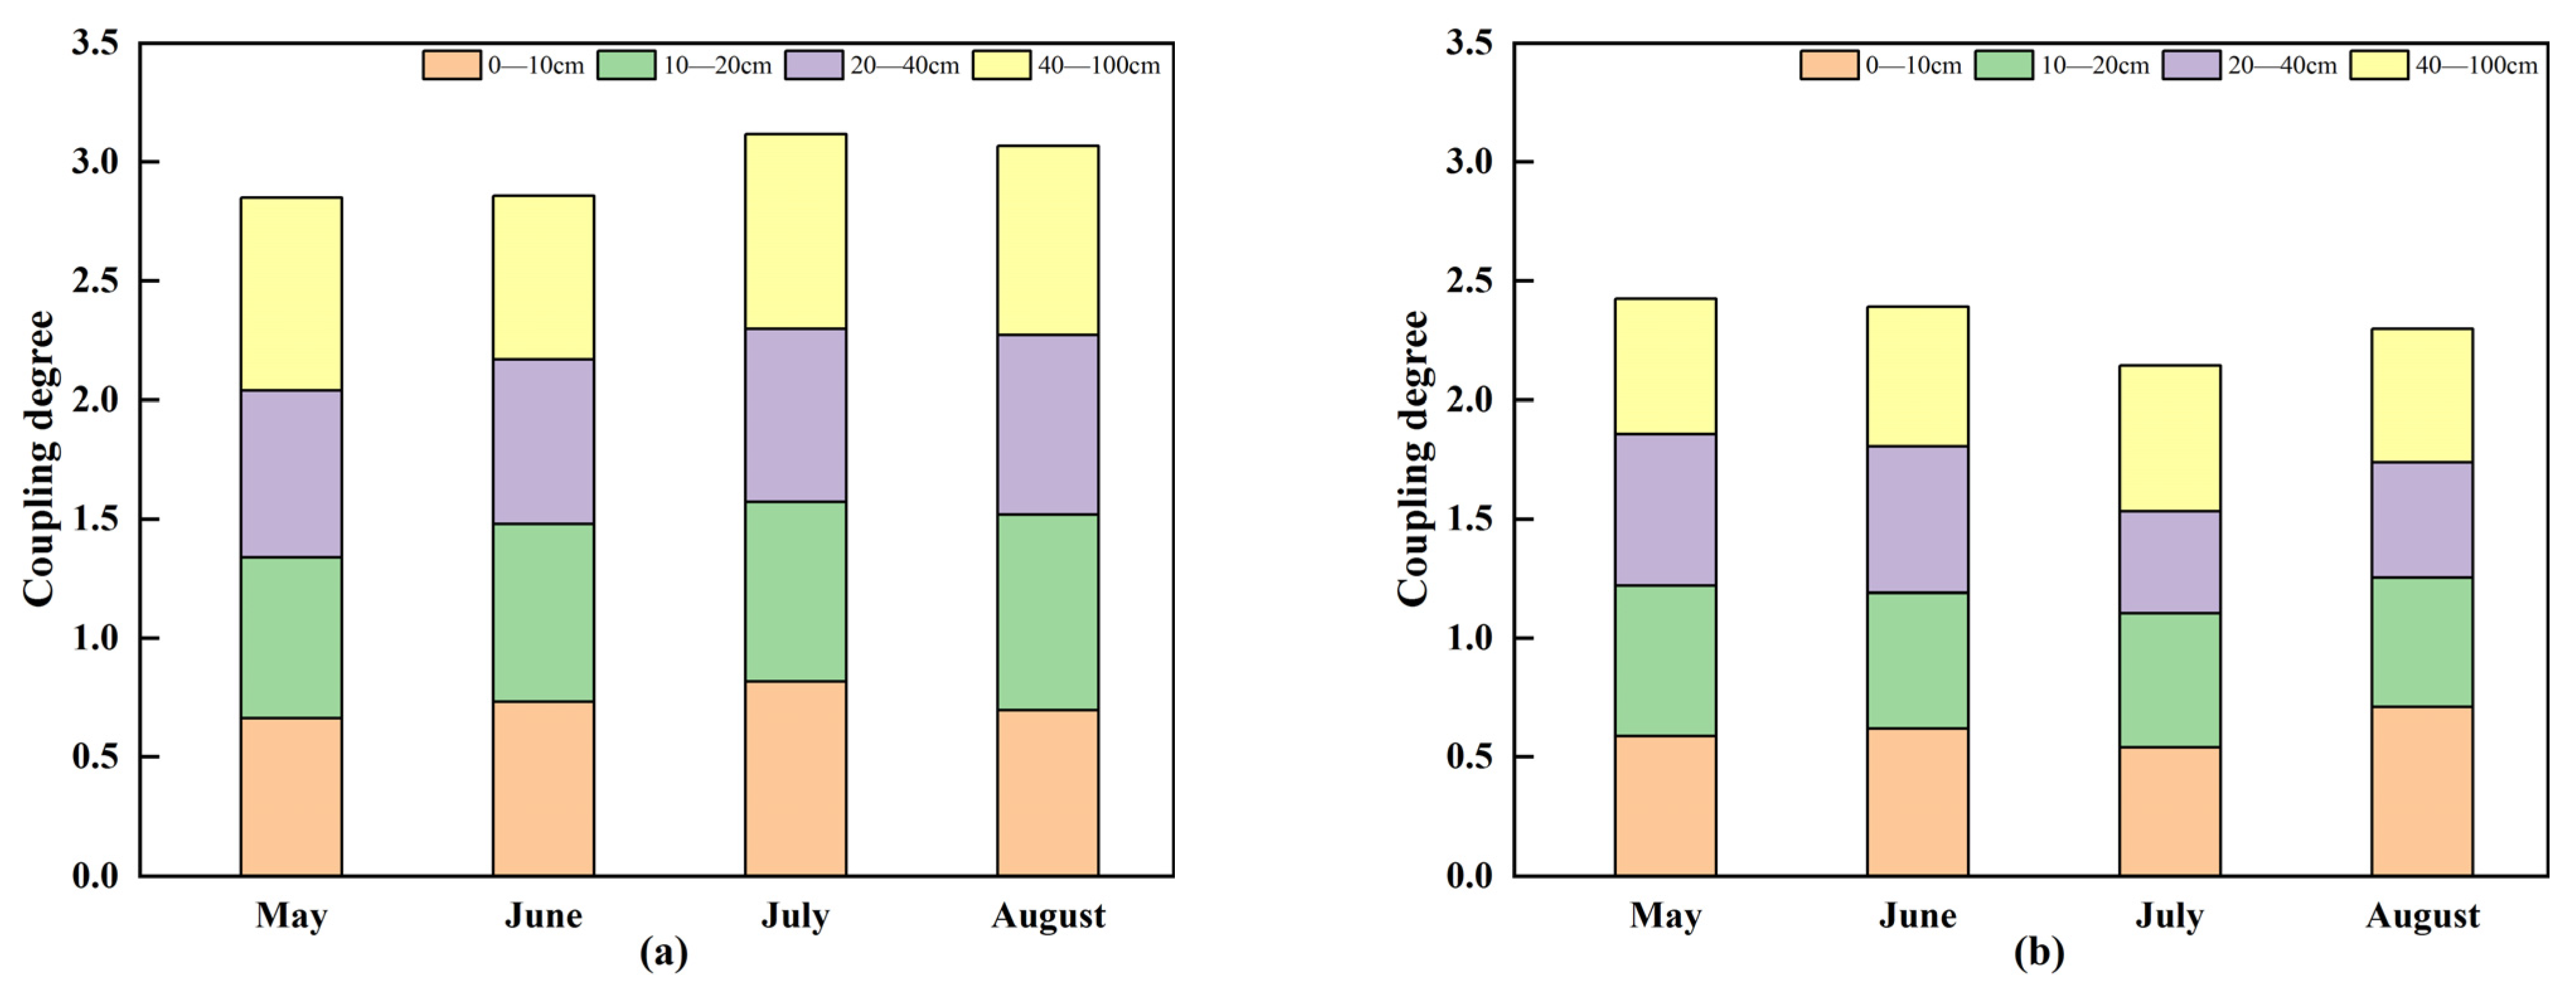
3.5. Soil Water–Salt Coupling Coordination Degree in Cultivated and Wasteland

To investigate the degree of correlation between soil water and salt in cultivated and wasteland, soil water content and total salt content data in the study area were analyzed for coupling coordination degree. From Figure 7, it can be seen that the average coupling degree of soil water and salt during the growing period ranged from 0.66 to 0.82 for cultivated land and from 0.43 to 0.71 for wasteland. The average coupling degree of soil water and salt in wasteland was lower than that in cultivated land, ranging from 65.15% to 86.59% of that in cultivated land. From Figure 8, it can be seen that the average soil water and salt coupling coordination degree during the growing period ranged from 0.46 to 0.57 in cultivated land and from 0.39 to 0.5 in the wasteland. The average coupling coordination degree of soil water and salt in the 0–100 cm soil layer during the growing period was 0.52 for cultivated land and 0.45 for wasteland. From Table 2, it can be seen that the coordination level of cultivated land was marginal coordination, and the coordination level of wasteland was marginal disorder.
The relationship between soil water and salt was more harmonized in cultivated land compared to wasteland. The reason is that cultivated land is controlled by human management, and both irrigation and crop growth affect soil water–salt distribution. When irrigation is carried out, the irrigation water carries salts into the field, and the migration of water is accompanied by the transportation of salts, revealing the soil water–salt transportation law of “salt follows water”. In addition, crop growth absorbs water, which also helps to reduce the salt in the surface layer of the soil. Therefore, the soil water–salt coupling degree of cultivated land is relatively large. In contrast, there is no human intervention in the wasteland, soil moisture mainly depends on precipitation recharge, and the distribution and migration of soil salts are subject to the constraints of natural conditions. Since there is no crop growth in the wasteland, the coupling degree between soil moisture and salinity is relatively small.

4. Discussion

In recent years, due to the complexity of the natural environment and the influence of anthropogenic factors, the Hetao Irrigation District land use type is more complex, and the interleaved distribution of cultivated land and wasteland is a significant feature. Soil water and salt have different variation characteristics and coupling relationships in cultivated and wasteland.
Zhuoran Wang et al. [36] explored the spatial variability of soil salinity in coastal saline lands of the Yellow River Delta, China, at macro, meso, and micro scales and found that at the macro scale, the variability of soil salinity diminished with increasing soil depth. Based on this study, soil samples were collected at the branch canal scale, and soil water content and total salt content data were analyzed to conclude that the soil water content is of medium variability and weak variability, and the soil total salt content is of strong variability and medium variability. Lijuan Chen et al. [37] used traditional statistical and geostatistical analysis to study the spatial distribution characteristics of soil water and salt and the causes of soil salinization in the Minqin oasis area and found that the variability of soil salinity was significantly greater than the variability of water content. This is consistent with the results of this paper, which show that the spatial dependence of soil water content is weaker than total soil salt content.
Rahul Tripathi et al. [38] fitted a semi-variance function model for various soil properties and determined the optimum semi-variance function theoretical model for soil conductivity as the Gaussian model by using the cross-validation method. On this basis in this study, the semi-variance function theoretical model was fitted for soil water content and total salt content and found to be following the Gaussian model. Zhiwei Zhang et al. [39] investigated the spatial variability of surface soil water content on shaded and sunny slopes of alpine meadows on the Tibetan Plateau and showed that the theoretical modes of the optimal semi-variance function of soil water content in the 0–20 cm soil layer were different and that there was a strong spatial correlation of soil water content. On this basis, this study found that both soil water content and total salt content had a strong spatial correlation. Yanan Liu et al. [20] analyzed the spatial variability of soil water and salt in the Hetao Irrigation District based on geostatistics and concluded that the spatial correlation of soil water content and salinity increased with the increase of soil depth, and the results of this paper are consistent with these findings.
Ruping Wang et al. [40] used ordinary kriging interpolation to study the spatial distribution characteristics of spring soil salinization in the Hetao Irrigation District and found that salinized soils in the 0–20 cm soil layer had a wider distribution range. On this basis, this paper carried out ordinary kriging interpolation and radial basis functions interpolation on soil total salt content data in the study area. Comparing the ME and MSRE of the two interpolation methods, it is concluded that the total salt content of the soil in the study area is more accurate when interpolated by radial basis functions.
Liang Li et al. [41] found that wasteland is a temporary drainage area during irrigation of cultivated land, and salt transport between cultivated wasteland is generally a process of salt loss from cultivated land and salt accumulation in wasteland during crop growth. On this basis, this study investigated the factors affecting soil salinity in cultivated and wasteland and found that the main factors affecting soil salinity in cultivated lands are irrigation, precipitation, and planting crops, and the main factors affecting soil salinity in the wasteland are precipitation and topography. Wang et al. [42] conducted a 5-year experimental study in the Hetao Irrigation District and found that during irrigation activities, fallow areas act as drainage reservoirs, receiving excess water and salts from surrounding irrigated cultivated lands. Guoshuai Wang et al. [43] analyzed water and salt transport in different land types in the Hetao Irrigation District and found that of the groundwater salinity at the wasteland–dune interface, 53% accumulated in the wasteland groundwater and the remaining 47% in the lakes. On the basis of some scholars, this study analyzed the soil water and salt coupling relationship between cultivated and wasteland and concluded that the average coupling coordination degree of soil water and salt of wasteland in the study area was lower than that of cultivated land, which made the soil water and salt interaction relationship between cultivated and wasteland clearer.
This study can provide a theoretical basis for salinized irrigation districts. Since the relationship between soil water and salt is more uncoordinated in wasteland than in cultivated land, wasteland can be treated differently according to the topography to reduce soil salinity. For the wasteland adjacent to cultivated land, as the salts can be easily washed away, it can be considered for improvement into cultivated land, so that the soil salts can be better washed away under long-term irrigation, and the effect of reducing soil salts can be obtained. For the wasteland at a certain distance from the cultivated land, since the salt is not easily washed away, it can be left untreated and assume the role of salt drainage. Surface cover of cultivated and wasteland can be treated differently, with cultivated land covered with mulch and wasteland planted with salt-tolerant plants to reduce soil evaporation. The water table should also be controlled to reduce surface evaporation, thus reducing soil salinity. In addition, a rational agricultural planting structure and regional distribution are essential to reduce soil salinity.
This study has an important role in controlling salinity for effective salt drainage under the characteristics of cultivated–wasteland interpolation distribution in the Hetao Irrigation District. However, the current study has less quantitative research on salt migration between cultivated and wasteland. From the perspective of actual irrigation management, a large number of management decisions are made at the regional level, and it is a good choice to invert the salt transport between cultivated and wasteland in the region by combining remote sensing.

5. Conclusions

Soil water content in the study area belonged to medium variability and weak variability, and soil total salt content belonged to strong variability and medium variability. The theoretical models of soil water content and total salt content semi-variance function in the study area following the Gaussian model, with a block-base ratio of less than 25%, with strong spatial autocorrelation, and the spatial correlation gradually increased with the increase of soil depth. The total salt content of the soil in the study area was interpolated with higher accuracy using radial basis functions than ordinary kriging interpolation. In terms of temporal changes in salinity, the average salt accumulation rate of the 0–100 cm soil layer in the study area was 20.17% when salinity increased from May to June; the average desalination rate was 16.37% when salinity decreased from June to August. The main factors affecting soil salinity in cultivated land during the growing period were irrigation, precipitation, and planting crops, and the main factors affecting soil salinity in wasteland were precipitation and topography. In practical agricultural measures, different treatments are considered for different types of wasteland to reduce soil salinity. Wasteland immediately adjacent to cultivated land can be considered for improvement into cultivated land. Wasteland at a certain distance from cultivated land can be left untreated and assumes the role of salt drainage. The average soil water and salt coupling degree of wasteland in the study area was lower than that of cultivated land, ranging from 65.15% to 86.59% of that of cultivated land. The level of coordination of cultivated land was marginal coordination, and the level of coordination of wasteland was marginal disorder. The relationship between soil water and salt was more harmonized in cultivated land compared to wasteland.

Author Contributions

Y.Z., H.S. and Q.M. were involved in designing the manuscript; Y.Z., S.Y., Z.H., C.H., C.Y. and Y.Y. carried out this experiment; Y.Z. and H.S. analyzed the data and wrote the manuscript. All authors have read and agreed to the published version of the manuscript.

Funding

This research was funded by the “14th Five-Year Plan” National Key R&D Program, China (2021YFC3201202-05); the National Natural Science Foundation of China (52269014), and the Inner Mongolia Autonomous Region “Unveiling the List of Commanders” Project, China (2023JBGS0003).

Data Availability Statement

Not applicable.

Conflicts of Interest

The authors declare no conflict of interest.

References

  1. Zhang, J.; Xiao, H. Past, Current and Future Prospect for Research on Agricultural Water Use in Irrigation Districts in the Yellow River Basin. J. Irrig. Drain. 2020, 39, 9–17. [Google Scholar] [CrossRef]
  2. Cao, Z.; Zhu, T.; Cai, X. Hydro-agro-economic optimization for irrigated farming in an arid region: The Hetao Irrigation District, Inner Mongolia. Agric. Water Manag. 2023, 277, 108095. [Google Scholar] [CrossRef]
  3. Zhang, H.; Xiong, Y.; Huang, G.; Xu, X.; Huang, Q. Effects of water stress on processing tomatoes yield, quality and water use efficiency with plastic mulched drip irrigation in sandy soil of the Hetao Irrigation District. Agric. Water Manag. 2017, 179, 205–214. [Google Scholar] [CrossRef]
  4. Guo, K.; Liu, X. Reclamation effect of freezing saline water irrigation on heavy saline-alkali soil in the Hetao Irrigation District of North China. CATENA 2021, 204, 105420. [Google Scholar] [CrossRef]
  5. Jiang, D.; Ao, C.; Bailey, R.T.; Zeng, W.; Huang, J. Simulation of water and salt transport in the Kaidu River Irrigation District using the modified SWAT-Salt. Agric. Water Manag. 2022, 272, 107845. [Google Scholar] [CrossRef]
  6. Mao, W.; Yang, J.; Zhu, Y.; Ye, M.; Wu, J. Loosely coupled SaltMod for simulating groundwater and salt dynamics under well-canal conjunctive irrigation in semi-arid areas. Agric. Water Manag. 2017, 192, 209–220. [Google Scholar] [CrossRef]
  7. Wang, X.; Zhang, H.; Zhang, Z.; Zhang, C.; Zhang, K.; Pang, H.; Bell, S.M.; Li, Y.; Chen, J. Reinforced soil salinization with distance along the river: A case study of the Yellow River Basin. Agric. Water Manag. 2023, 279, 108184. [Google Scholar] [CrossRef]
  8. Zhu, L.; Liu, Y.; Jiao, F. Time Series Analysis of Spatial Variability of Soil Moisture in Loess Hilly Region. Procedia Earth Planet. Sci. 2012, 5, 346–353. [Google Scholar] [CrossRef]
  9. Gu, X.; Han, J.; Zhang, F.; Zhang, D.; Liu, S. Spatial variability of soil salinity and its multi factor response in irrigation area. Bull. Soil Water Conserv. 2020, 40, 100–106. [Google Scholar] [CrossRef]
  10. Selmy, S.; El-Aziz, S.A.; El-Desoky, A.; El-Sayed, M. Characterizing, predicting, and mapping of soil spatial variability in Gharb El-Mawhoub area of Dakhla Oasis using geostatistics and GIS approaches. J. Saudi Soc. Agric. Sci. 2022, 21, 383–396. [Google Scholar] [CrossRef]
  11. John, K.; Abraham, I.I.; Kebonye, N.M.; Agyeman, P.C.; Ayito, E.O.; Kudjo, A.S. Soil organic carbon prediction with terrain derivatives using geostatistics and sequential Gaussian simulation. J. Saudi Soc. Agric. Sci. 2021, 20, 379–389. [Google Scholar] [CrossRef]
  12. Dou, X.; Shi, H.; Miao, Q.; Tian, F.; Yu, D.; Zhou, L.; Liang, Z. Temporal and spatial variability analysis of soil water and salt and the influence of groundwater depth on salt in saline irrigation area. J. Soil Water Conserv. 2019, 33, 246–253. [Google Scholar] [CrossRef]
  13. Barman, A.; Sheoran, P.; Yadav, R.K.; Abhishek, R.; Sharma, R.; Prajapat, K.; Singh, R.K.; Kumar, S. Soil spatial variability characterization: Delineating index-based management zones in salt-affected agroecosystem of India. J. Environ. Manag. 2021, 296, 113243. [Google Scholar] [CrossRef] [PubMed]
  14. Brocca, L.; Tullo, T.; Melone, F.; Moramarco, T.; Morbidelli, R. Catchment scale soil moisture spatial–temporal variability. J. Hydrol. 2012, 422–423, 63–75. [Google Scholar] [CrossRef]
  15. Feng, X.; An, P.; Li, X.; Guo, K.; Yang, C.; Liu, X. Spatiotemporal heterogeneity of soil water and salinity after establishment of dense-foliage Tamarix chinensis on coastal saline land. Ecol. Eng. 2018, 121, 104–113. [Google Scholar] [CrossRef]
  16. Yao, R.; Yang, J.; Liu, G.; Zhou, P. Spatial variability of soil salinity in characteristic field of the Yellow River Delta. Trans. Chin. Soc. Agric. Eng. 2006, 22, 61–66. [Google Scholar]
  17. Zhu, J.; Guo, S.; Yang, Y.; Li, P.; Zhang, Q.; Dai, Q.; Zhang, K. Temporal-spatial variability of soil salinity in greenspace of Tianjin Binhai Economic-Technological Development Area. Trans. Chin. Soc. Agric. Eng. 2016, 32, 161–168. [Google Scholar] [CrossRef]
  18. Bogunovic, I.; Trevisani, S.; Seput, M.; Juzbasic, D.; Durdevic, B. Short-range and regional spatial variability of soil chemical properties in an agro-ecosystem in eastern Croatia. CATENA 2017, 154, 50–62. [Google Scholar] [CrossRef]
  19. Fu, Z.; Wang, P.; Sun, J.; Lu, Z.; Yang, H.; Liu, J.; Xia, J.; Li, T. Composition, seasonal variation, and salinization characteristics of soil salinity in the Chenier Island of the Yellow River Delta. Glob. Ecol. Conserv. 2020, 24, e01318. [Google Scholar] [CrossRef]
  20. Liu, Y.; Sun, G.; Mao, W.; Cheng, X.; Zhu, Y.; Yang, J. Geostatistical Analysis of Spatial Variability of Soil Water and Salt in Hetao Irrigation District. J. Irrig. Drain. 2022, 41, 101–109. [Google Scholar] [CrossRef]
  21. Zhang, X.; Shu, C.; Wu, Y.; Ye, P.; Du, D. Advances of coupled water-heat-salt theory and test techniques for soils in cold and arid regions: A review. Geoderma 2023, 432, 116378. [Google Scholar] [CrossRef]
  22. Wang, Q.; Jin, H.; Yuan, Z.; Yang, C. Synergetic variations of active layer soil water and salt in a permafrost-affected meadow in the headwater area of the Yellow River, northeastern Qinghai–Tibet plateau. Int. Soil Water Conserv. Res. 2022, 10, 284–292. [Google Scholar] [CrossRef]
  23. Guo, Y.; Yin, X.; Li, Y.; Chen, Y.; Cui, M. Soil water and salt dynamics and its coupling model at cropland-treebelt-desert compound system. Trans. Chin. Soc. Agric. Eng. 2019, 35, 87–101. [Google Scholar]
  24. Luo, C.; Yu, Y.; Zhang, J.; Cui, W. Heat-Mass Transfer Test and Coupling Model of Sulfate Saline Soil. J. Southwest Jiaotong Univ. 2023, 58, 470–478. [Google Scholar] [CrossRef]
  25. Zhang, N. Study on the Spatial Variia Bility and Transform Techniques of Soil Hydraulic Parameters Iin Multi-Scaled Saline Irrigation Districts; Inner Mongolia Agricultural University: Hohhot, China, 2016. [Google Scholar]
  26. Wang, G.; Shi, H.; Li, X.; Guo, J.; Wang, W.; Wu, D. Estimation of Salt Transport and Relationship with Groundwater Depth in Different Land Types in Hetao Irrigation Area. Trans. Chin. Soc. Agric. Mach. 2020, 51, 255–269. [Google Scholar] [CrossRef]
  27. Tagore, G.S.; Sharma, G.D.; Kulhare, P.S.; Set, S.K. Characterization of Spatial Variability of Micro Nutrients in Soils: Classical Vs. Geo-Statistical Approach. Commun. Soil Sci. Plant Anal. 2023, 54, 472–487. [Google Scholar] [CrossRef]
  28. Deng, X.; Xu, X.; Wang, S. The tempo-spatial changes of soil fertility in farmland of China from the 1980s to the 2010s. Ecol. Indic. 2023, 146, 109913. [Google Scholar] [CrossRef]
  29. Shifteh-Some’e, B.; Hassanpour, F.; Ezani, A.; Miremadi, S.R.; Tabari, H. Erratum to: Investigation of spatial variability and pattern analysis of soil properties in the northwest of Iran. Environ. Earth Sci. 2012, 65, 401. [Google Scholar] [CrossRef]
  30. Yao, X.; Yu, K.; Deng, Y.; Liu, J.; Lai, Z. Spatial variability of soil organic carbon and total nitrogen in the hilly red soil region of Southern China. J. For. Res. 2020, 31, 2385–2394. [Google Scholar] [CrossRef]
  31. Zhang, D.; Jiang, B.; Liu, G.; Zhang, H.; Nie, F.; Sun, Q.; Ji, M. Applicability of spatial interpolation methods to predict total phosphorus in the typical irrigated areas of the Sanjiang Plain. Chin. J. Eco-Agric. 2021, 29, 1405–1416. [Google Scholar] [CrossRef]
  32. Chengjing, N.; Yixuan, L.; Linsheng, Y.; Li, W.; Fengying, Z. Spatio-temporal characteristics and coupling coordination relationship between urbanization and atmospheric particulate pollutants in the Bohai Rim in China. Ecol. Indic. 2023, 153, 110387. [Google Scholar] [CrossRef]
  33. Liu, H.; Ding, B.; Bai, Y.; Zhang, J.; Wang, S.; Huang, Z. Spatial Distribution character istics of Soil Salinity in an Oasis of Typical Arid Regions in Spring. Chin. J. Soil Sci. 2021, 52, 279–285. [Google Scholar] [CrossRef]
  34. Cambardella, C.A.; Moorman, T.B.; Novak, J.M.; Parkin, T.B.; Konopka, A.E. Field-Scale Variability of Soil Properties in Central Iowa Soils. Soil Sci. Soc. Am. J. 1994, 58, 1501–1511. [Google Scholar] [CrossRef]
  35. Zhang, X.; Xiang, D.-Q.; Yang, C.; Wu, W.; Liu, H.-B. The spatial variability of temporal changes in soil pH affected by topography and fertilization. CATENA 2022, 218, 106586. [Google Scholar] [CrossRef]
  36. Wang, Z.; Zhao, G.; Gao, M.; Chang, C. Spatial variability of soil salinity in coastal saline soil at different scales in the Yellow River Delta, China. Environ. Monit. Assess. 2017, 189, 80. [Google Scholar] [CrossRef]
  37. Chen, L.; Feng, Q.; Cheng, A. Spatial distribution of soil water and salt contents and reasons of saline soils’ development in the Minqin Oasis. J. Arid Land Resour. Environ. 2013, 27, 99–105. [Google Scholar] [CrossRef]
  38. Tripathi, R.; Nayak, A.K.; Shahid, M.; Raja, R.; Panda, B.B.; Mohanty, S.; Kumar, A.; Lal, B.; Gautam, P.; Sahoo, R.N. Characterizing spatial variability of soil properties in salt affected coastal India using geostatistics and kriging. Arab. J. Geosci. 2015, 8, 10693–10703. [Google Scholar] [CrossRef]
  39. Zhang, Z.; Yin, H.; Chang, J.; Xue, J. Spatial variability of surface soil water content and its influencing factors on shady and sunny slopes of an alpine meadow on the Qinghai–Tibetan Plateau. Glob. Ecol. Conserv. 2022, 34, e02035. [Google Scholar] [CrossRef]
  40. Wang, R.; Wan, H.; Chen, S.; Xia, Y.; Bai, Q.; Peng, Z.; Shang, S. Spatial distribution pattern of soil salinization in farmland of Wulate sub-irrigation areas in Hetao Irrigation District in Inner Mongolia in spring. Trans. Chin. Soc. Agric. Eng. 2021, 37, 105–113. [Google Scholar] [CrossRef]
  41. Li, L.; Shi, H.; Takeo, A.; Zhang, Y.; Liu, H. Transport of Soil Moisture and Salt between Irrigated Land and Saline Land in the Inner Mongolia Hetao Irrigation District. J. Irrig. Drain. 2010, 29, 73–77. [Google Scholar] [CrossRef]
  42. Wang, C.; Wu, J.; Zeng, W.; Zhu, Y.; Huang, J. Five-Year Experimental Study on Effectiveness and Sustainability of a Dry Drainage System for Controlling Soil Salinity. Water 2019, 11, 111. [Google Scholar] [CrossRef]
  43. Wang, G.; Shi, H.; Li, X.; Yan, J.; Akae, T. A Study on Water and Salt Transport, and Balance Analysis in Sand Dune–Wasteland–Lake Systems of Hetao Oases, Upper Reaches of the Yellow River Basin. Water 2020, 12, 3454. [Google Scholar] [CrossRef]
Figure 1. Location of the study area and sampling points.
Agronomy 13 02367 g001
Figure 2. Soil water content and total salt content statistical characteristic values. (a) Soil water content statistical characteristic values; (b) Soil total salt content statistical characteristic values.
Agronomy 13 02367 g002
Figure 3. Semi-variance and block-base ratio of soil water content and total salt content. (a) Semi-variance and block-base ratio of soil water content; (b) Semi-variance and block-base ratio of soil total salt content.
Agronomy 13 02367 g003
Figure 4. Spatial distribution of soil salinity in different periods. (a) May; (b) June; (c) July; (d) Au-gust.
Agronomy 13 02367 g004
Figure 5. Vertical distribution of total salt content in typical cultivated land. (a) Planted with maize; (b) Planted with sunflowers.
Agronomy 13 02367 g005
Figure 6. Vertical distribution of total salt content in typical wasteland. (a) Wasteland “a” is adjacent to cultivated land; (b) Wasteland “b” is at a distance from cultivated land.
Agronomy 13 02367 g006
Figure 7. Soil water–salt coupling degree for cultivated and wasteland. (a) Cultivated land; (b) Wasteland.
Agronomy 13 02367 g007
Figure 8. Soil water–salt coupling coordination degree for cultivated and wasteland. (a) Cultivated land; (b) Wasteland.
Agronomy 13 02367 g008
Table 1. Soil physical properties in the study area.
Soils Layer (cm)Soils Type Soil Bulk Density (g·cm−3)Field Moisture Capacity (%)Saturated Water Capacity (%)
0–10Silty loam1.55 ± 0.1224.17 ± 0.0428.63 ± 0.04
10–20Silty loam1.41 ± 0.0929.72 ± 0.0433.79 ± 0.04
20–40Silty loam1.44 ± 0.0431.11 ± 0.0335.53 ± 0.02
40–60Silt1.40 ± 0.0231.32 ± 0.0135.64 ± 0.01
60–80Silt1.33 ± 0.0436.07 ± 0.0240.73 ± 0.01
80–100Silt1.37 ± 0.0233.06 ± 0.0238.91 ± 0.03
Table 2. Degree of coupling coordination and coordination level.
Coupling Coordination Degree DCoordination Level
0 < D ≤ 0.1Extreme disorder
0.1 < D ≤ 0.2Serious disorder
0.2 < D ≤ 0.3Moderate disorder
0.3 < D ≤ 0.4Low disorder
0.4 < D ≤ 0.5Marginal disorder
0.5 < D ≤ 0.6Marginal coordination
0.6 < D ≤ 0.7Low coordination
0.7 < D ≤ 0.8Moderate coordination
0.8 < D ≤ 0.9Good coordination
0.9 < D ≤ 0.1High coordination
Table 3. Theoretical model of semi-variance function for soil water content and total salt content and related parameters.
Test
Index
Soils Layer/cmTheoretical ModelDecision Factor R2Residual Error RSS
MayJuneJulyAugustMayJuneJulyAugust
Water content0–10Gaussian0.6910.5160.5360.5873.954 × 10−74.017 × 10−74.868 × 10−75.707 × 10⁻⁸
10–20Gaussian0.9190.4920.4630.6687.046 × 10−81.541 × 10−79.292 × 10−73.588 × 10⁻⁷
20–40Gaussian0.7360.6460.5030.4931.646 × 10−66.214 × 10−72.884 × 10−73.680 × 10⁻⁷
40–100Gaussian0.5840.7820.4720.8113.829 × 10−71.925 × 10−81.273 × 10−72.056 × 10⁻⁸
Total salt
content
0–10Gaussian0.5010.5950.6130.8600.3070.0300.1350.011
10–20Gaussian0.5500.7910.7080.7590.3380.0750.1990.174
20–40Gaussian0.5820.7870.5440.9270.3410.0580.0190.052
40–100Gaussian0.5660.7070.8230.7970.3730.1790.0330.062
Table 4. Ordinary kriging interpolation and radial basis functions interpolation error parameters.
MethodsSoils Layer/cmMERMSE
MayJuneJulyAugustMeanMayJuneJulyAugustMean
Ordinary kriging0–1000.0720.1330.1140.0730.108 3.3186.2192.6483.0863.818
Radial basis functions0–1000.0260.0650.1360.1560.082 3.4116.3582.7843.1833.934
Disclaimer/Publisher’s Note: The statements, opinions and data contained in all publications are solely those of the individual author(s) and contributor(s) and not of MDPI and/or the editor(s). MDPI and/or the editor(s) disclaim responsibility for any injury to people or property resulting from any ideas, methods, instructions or products referred to in the content.

