Article

Response of Nitrification and Crop Yield to the Presence of NBPT and DCD in a Wheat-Corn Double Cropping System

National Engineering Research Center for Efficient Utilization of Soil and Fertilizer Resources, College of Resources and Environment, Shandong Agricultural University, Daizong Road, Tai’an 271018, China
*
Authors to whom correspondence should be addressed.
Agronomy 2024, 14(2), 285; https://doi.org/10.3390/agronomy14020285
Submission received: 26 December 2023 / Revised: 24 January 2024 / Accepted: 25 January 2024 / Published: 27 January 2024
(This article belongs to the Special Issue Applied Research and Extension in Agronomic Soil Fertility Series II)

Abstract

:
The excessive application of nitrogen fertilizer aggravated the loss of nitrogen in farmland and exerted detrimental effects on the soil and water environment. Examining the effects of N-(n-Butyl)thiophosphoric triamide (NBPT) and nitrification inhibitor dicyandiamide (DCD) on nitrification and crop yield in wheat-corn double cropping systems would provide valuable insights for improving nitrogen efficiency and ensuring a rational application of inhibitors. A field experiment lasting one and a half years was performed in the winter wheat–summer maize double agroecosystem in North China. The four treatments that were applied included (I) conventional fertilization without inhibitors (CK), (II) conventional fertilization with 0.26 g/m2 NBPT (NBPT), (III) conventional fertilization with 1.00 g/m2 DCD (DCD), and (IV) conventional fertilization with 0.26 g/m2 NBPT and 1.00 g/m2 DCD (NBPT + DCD). The results demonstrated that the combined use of NBPT and DCD exerted better effects in reducing NO3-N leaching. Nitrification could be inhibited for up to 95 days by combining NBPT and DCD, while 21 days by DCD. Ammonia-oxidizing archaea (AOA) (R2 = 0.07159, p < 0.01) along with ammonia-oxidizing bacteria (AOB) (R2 = 0.09359, p < 0.01), rather than a complete ammonia oxidizer (comammox), were significantly and positively correlated with NO3-N content, which indicated that the ammoxidation process was mainly regulated by AOA and AOB, instead of comammox in the winter wheat–summer maize double agroecosystem in North China.

1. Introduction

Nitrogen is not only a fundamental nutrient element in the process of crop growth, but is also the key nutrient element to ensure crop quality and promote yield improvement. Urea has the characteristics of high nitrogen content, making it a universally applied N-fertilizer around the world. The use of urea has enhanced 100-fold globally over the past 50 years [1]. Traditionally, nitrification was performed by the combination of ammonia-oxidizing archaea (AOA) and ammonia-oxidizing bacteria (AOB), which oxidize N H 4 + -N to N O 3 -N. Recently, complete ammonia oxidizers (comammox Nitrospira) have been discovered to perform complete nitrification in one cell, which refuted the previous view that nitrification required two distinct ammonia-oxidizing microorganisms [2]. Comammox was relatively abundant and widely distributed in various soils, suggesting the potential functional significance of comammox in the nitrification process [3]. Currently, the relative contributions of these three ammonia-oxidizing microorganisms to nitrification in soils has become one of the research hotspots in soil biochemistry.
The application of nitrogen fertilizer was directly related to the growth and physiological metabolism of crops, and the level of nitrogen fertilizer application plays a decisive role in the constitution of the final yield of crops [4]. At the present stage, the area of excessive nitrogen application accounts for about 20% of the sown area, and the phenomenon of excessive nitrogen application is still quite common. Meanwhile, the loss of nitrogen fertilizer is about 45% [5], which results in low fertilizer utilization efficiency. Problems such as NH3 volatilization, N2O emission, and N O 3 -N leaching led to the pollution of air and water, soil acidification, and compaction. Therefore, the use of inhibitors to further nitrogen use potency will be beneficial in promoting the sustainable development of agriculture.
NBPT itself was not easily hydrolyzed by urease and could effectively bind to the active site of urease, thus becoming the most widely used urease inhibitor at present [6]. It has been reported that NBPT not only delays urea hydrolysis and reduces NH3 volatilization, but also benefits the sustained supply of soil nitrogen, thereby improving nitrogen absorption and utilization [7]. In addition, NBPT could significantly decrease AOA abundance in alkaline soils and decrease AOA activity [8]. Luchibia et al. (2020) found that NBPT directly inhibited the growth of AOB and comammox, thereby reducing nitrogen loss in agricultural soils in Australia [9]. Despite a few conflicting reports, the effects of NBPT on nitrification remain exclusive.
DCD is currently one of the most widely used and commercialized nitrification inhibitors. DCD could decrease ammonia oxidation activity, thus suppressing the nitrification step and diminishing the N O 3 -N concentration and leaching risk in the soil [10]. DCD showed outstanding efficacy in inhibiting nitrification and reducing nitrogen loss, but its effectiveness was limited by degradation and deactivation. On the one hand, the decrease in the inhibitory effects of DCD could be due to the enhancement of the nitrification substrate and nitrification activity with N H 4 + -N accumulation [11]. On the other hand, DCD degradation was performed by microbes, whose activity was firmly linked to temperature and soil moisture [12,13]. Previous results have proposed that DCD could significantly inhibit the growth of AOB populations in both sandy loam soil and Templeton silt loam [8]. After the degradation of DCD, AOB could gradually recover its activity and carry out the ammonia oxidation process again. However, DCD had little effect on AOA in soil [14]. Lehtovirta-Morley et al. (2013) proposed that 5 mM and 10 mM DCD could completely inhibit the increment of AOA in acidic sandy soils (pH = 4.5) [15]. Recent findings further suggested that DCD could hinder the growth of comammox in grassland and sandy loam soils [16,17].
A large number of studies have shown that the combined application of NBPT and DCD was beneficial for increasing nitrogen efficiency and reducing the environmental risks caused by the heavy application of nitrogen fertilizer [8,18]. At present, there are abundant incubation experiments focusing on the influence of nitrogen fertilizer synergists on nitrogen fertilizer utilization potency and ammonia-oxidizing microorganisms [17]. Field experiments involving NBPT and DCD alone or in combination to investigate the inhibition effect and specificity on AOA, AOB, and comammox were urgent. For this, a field test was performed to estimate the impacts of NBPT and DCD on nitrogen conversion and the differing dominance of nitrification by either of the functional guilds. We hypothesized that the inhibitors could suppress both traditional ammonia-oxidizing microorganisms and comammox and reduce N O 3 -N, thus increasing nitrogen efficiency and the crop yield.

2. Materials and Methods

2.1. Experimental Site and Experimental Design

The experiment was managed from November 2020 to July 2022 in the Mount Tai Experimental Field, Shandong province, China (35°59′05″ N, 116°52′18″ E). Rainfall was concentrated in this area, and rain and heat occurred in the same season. The region has hot and rainy summers and cold and dry winters. It has an average temperature of 12.8 °C and an annual rainfall of 702 mm. The frost-free period is more than 200 days, and the annual sunshine is more than 2611 h in the area. The soil type is brown loam soil, belonging to the Udoll according to WRB (2022). The farmland in this area has a deep and fertile plow layer with the winter wheat–summer maize double agroecosystem. The property index of the surface soil is as follows: soil organic matter (SOM) 26.39 g kg−1, soil total nitrogen (TN) 2.22 g kg−1, and pH 7.73. The soil ammonium nitrogen ( N H 4 + -N) and nitrate nitrogen ( N O 3 -N) levels were 24.67 and 7.49 mg kg−1, respectively.
The experiment included the following four treatments: (I) conventional fertilization without inhibitors (CK), (II) conventional fertilization with 0.26 g/m2 NBPT (NBPT), (III) conventional fertilization with 1.00 g/m2 DCD (DCD), and (IV) conventional fertilization with 0.26 g/m2 NBPT and 1.00 g/m2 DCD (NBPT + DCD). The field experiment was arranged in complete random blocks with three replications. Each plot size of the replication was 5 m × 10 m. The varieties of the fertilizers used for testing included urea (containing 46% N), diammonium phosphate (containing 18% N, 46% P2O5), and potassium sulfate (containing 50% K2O). A total of 25.80 g/m2 of urea, 26.10 g/m2 of diammonium phosphate, and 15.00 g/m2 of potassium sulfate were applied to each plot. NBPT and DCD were used as fertilizer inhibitors once per season for crops. Solid state inhibitors were mixed with chemical fertilizers as the base fertilizer and applied at the moment of sowing. During the wheat greening and maize jointing stages, urea was applied to each plot at a rate of 12.90 g/m2 as the second fertilization. The wheat cultivar was Jimai 22 and the maize cultivar was Denghai 605. The sowing and harvest, planting density, and various cultivation and management measures were in line with local practices.

2.2. Soil Sample Analysis

Field samples were collected one week after sowing, three times at the seedling stage, and one time at the maturity stage. Field sampling was thus conducted fifteen times during 2020–2022 (wheat-corn-wheat). In each plot, three random points were selected to collect the soil within the depth range of 0 to 20 cm, and mixed evenly to form a synthetic sample. The soil samples were separated into two sub-samples according to different determination indexes. One sample was naturally air-dried, screened for 2 mm of impurities, and kept at −20 °C, and the other fresh soil sample was kept at −80 °C. Among them, −20 °C was used to determine the soil property index, and −80 °C was used to study soil ammonia oxidation microorganisms.
The soil pH was gauged with 1:2.5 soil to water ratio. Similar to Abdo et al., (2022) [7], the amount of soil organic matter (SOM) was determined using the potassium dichromate oxidation techniques. Using an auto-analyzer and the Kjeldahl acid digestion method, the total nitrogen (TN) content was determined [19]. Soil mineral N ( N H 4 + -N and N O 3 -N) contents were extracted with 2 mol L−1 potassium chloride (Sinopharm Chemical Reagent Co. Ltd., Shanghai, China) solution at a ratio of 10:1 and measured using a flow injection analyzer (SEAL Auto Analyzer AA3, Ludwigshafen, Germany).

2.3. DNA Extraction and Quantitative PCR (qPCR)

About 0.5 g of fresh soil was used for total soil DNA extraction. The procedures of extracting the total DNA from soil followed the MP Biomedicals Fast DNA SPIN Kit for soil (MP Biomedicals, LLC., Solon, OH, USA) manufacturer’s instructions. The successfully extracted DNA samples were deposited in a refrigerator with a constant temperature of −20 °C.
Table 1 lists the primers and PCR conditions. The 20 μL amplification system included 10 μL of 2 × SuperReal Premix Plus, 2 μL of 50 × Roxpreference Dye, 0.5 μL of forward primers, 0.5 μL of reverse primers, 2 μL of template DNA, and 5 μL of RNase-free water.
Each amplification sample was divided into three parallels. The standard curve was continuously diluted by the equal volume plasmid containing the corresponding gene fragment with the 10 times gradient as the amplification template. RNAse-free water was used to replace the template DNA as a negative control. The running program quantitatively calculated the initial copy number of the sample based on the calibration curve and the Ct value of the specimen.

2.4. Data Processing

SPSS version 20.0 was used for all statistical analyses. The abundance of functional genes and soil physio-chemical characteristics was compared among treatments using the one-way analysis of variance (ANOVA) and Duncan’s multiple range test. p < 0.05 was regarded as statistically significant. Pearson correlation coefficients determine the connection between N O 3 -N content and AOA, AOB, and comammox amoA gene abundance. All figures were plotted using Origin 2021 (9.8).

3. Results

3.1. Soil N H 4 + -N and N O 3 -N Content

Overall, the N H 4 + -N content ranged from 10.50 to 18.66 mg kg−1, with a mean of 14.83 mg kg−1 in all soils (Figure 1a). The N H 4 + -N content in NBPT-treated soils ranged from 10.77 to 17.07 mg kg−1. The N H 4 + -N content ranged from 10.72 to 18.66 mg kg−1. NBPT treatment significantly decreased the N H 4 + -N content during the seedling and jointing stages in the wheat and maize seasons. Soil N H 4 + -N was significantly increased after 7 days of urea addition in the wheat and maize seedling stages in both seasons. The N H 4 + -N content in NBPT-treated soil was not significantly diverse from that in CK soils during the maturity stage in either the wheat or maize season. The soil N H 4 + -N content under DCD treatment varied from 10.50 to 17.06 mg kg−1. DCD treatment significantly reduced N H 4 + -N content in the wheat and maize seedling stages. The N H 4 + -N content in NBPT + DCD-treated soil ranged from 10.86 to 16.86 mg kg−1. Compared with CK, NBPT + DCD treatment significantly decreased the N H 4 + -N content at the seedling and jointing stages during the wheat and maize seasons. The N H 4 + -N content under NBPT + DCD treatment was not significantly different from that in CK soils at the maturity stage during the wheat or maize season.
Generally, the N O 3 -N level during the maize season was much higher than that during the wheat season. During the testing period, the N O 3 -N concentration ranged from 4.07 to 44.35 mg kg−1, with an average of 16.54 mg kg−1 (Figure 1b). The N O 3 -N content significantly increased after urea addition and significantly decreased 14 days after urea application under the four treatments. The N O 3 -N content in NBPT-treated soils ranged from 4.52 to 44.35 mg kg−1, and that in CK soil ranged from 4.14 to 35.97 mg kg−1. Compared with CK, NBPT treatment significantly decreased the N O 3 -N concentration at the seedling and jointing stages during the wheat and maize seasons. By analyzing the N O 3 -N content data of wheat and corn during the ripening stage treated with CK and NBPT, not one of these differences was statistically significant. The N O 3 -N concentration under DCD treatment ranged from 4.32 to 39.24 mg kg−1. Compared to CK, DCD treatment significantly decreased the N O 3 -N content at the seedling stage during the wheat and maize seasons. However, there was no remarkable difference in N O 3 -N content between DCD and CK treatments at the jointing and maturity stages during the wheat and maize seasons. The N O 3 -N content under NBPT + DCD treatment ranged from 4.07 to 32.74 mg kg−1. During the wheat and maize seasons, NBPT + DCD treatment considerably reduced the N O 3 -N content at the seedling and jointing phases in comparison to CK. However, there was no remarkable difference in N O 3 -N content between NBPT + DCD and CK treatments at the wheat and maize maturity stages.

3.2. Abundance of Ammonia-Oxidizing Microorganisms

3.2.1. Abundance of the AOA amoA Gene

During the wheat season, the AOA amoA gene’s copy number varied between 1.43 × 10⁶ and 3.78 × 10⁶ and 1.6 × 10⁶ and 4.23 × 10⁶ copies g−1 d.w.s under NBPT and NBPT + DCD treatments, respectively (Figure 2). Different from CK treatment, NBPT and NBPT + DCD treatments greatly decreased AOA abundance at the wheat seedling stage. The gene abundance value of AOA amoA in CK and DCD-treated soils varied between 1.57 × 10⁶ and 4.99 × 10⁶ and in the range of 1.54 × 10⁶ to 4.48 × 10⁶ copies g−1 d.w.s, respectively. From these results, it is clear that DCD treatment differs from CK treatment throughout the wheat season.
The gene abundance value of AOA amoA under NBPT and NBPT + DCD treatments varied between 2.43 × 10⁶ and 3.57 × 10⁶ and in the range of 2.23 × 10⁶ to 3.31 × 10⁶ copies g−1 d.w.s, respectively, during the maize season. Different from CK treatment, NBPT and NBPT + DCD treatments significantly decreased AOA abundance at the maize seedling and jointing stages. The abundance of the AOA amoA gene ranged between 2.32 × 10⁶ and 4.71 × 10⁶ and between 2.16 × 10⁶ and 3.83 × 10⁶ copies g−1 d.w.s in CK soils and soils treated with DCD, respectively. There was no significant difference between the DCD and CK treatments throughout the maize season.

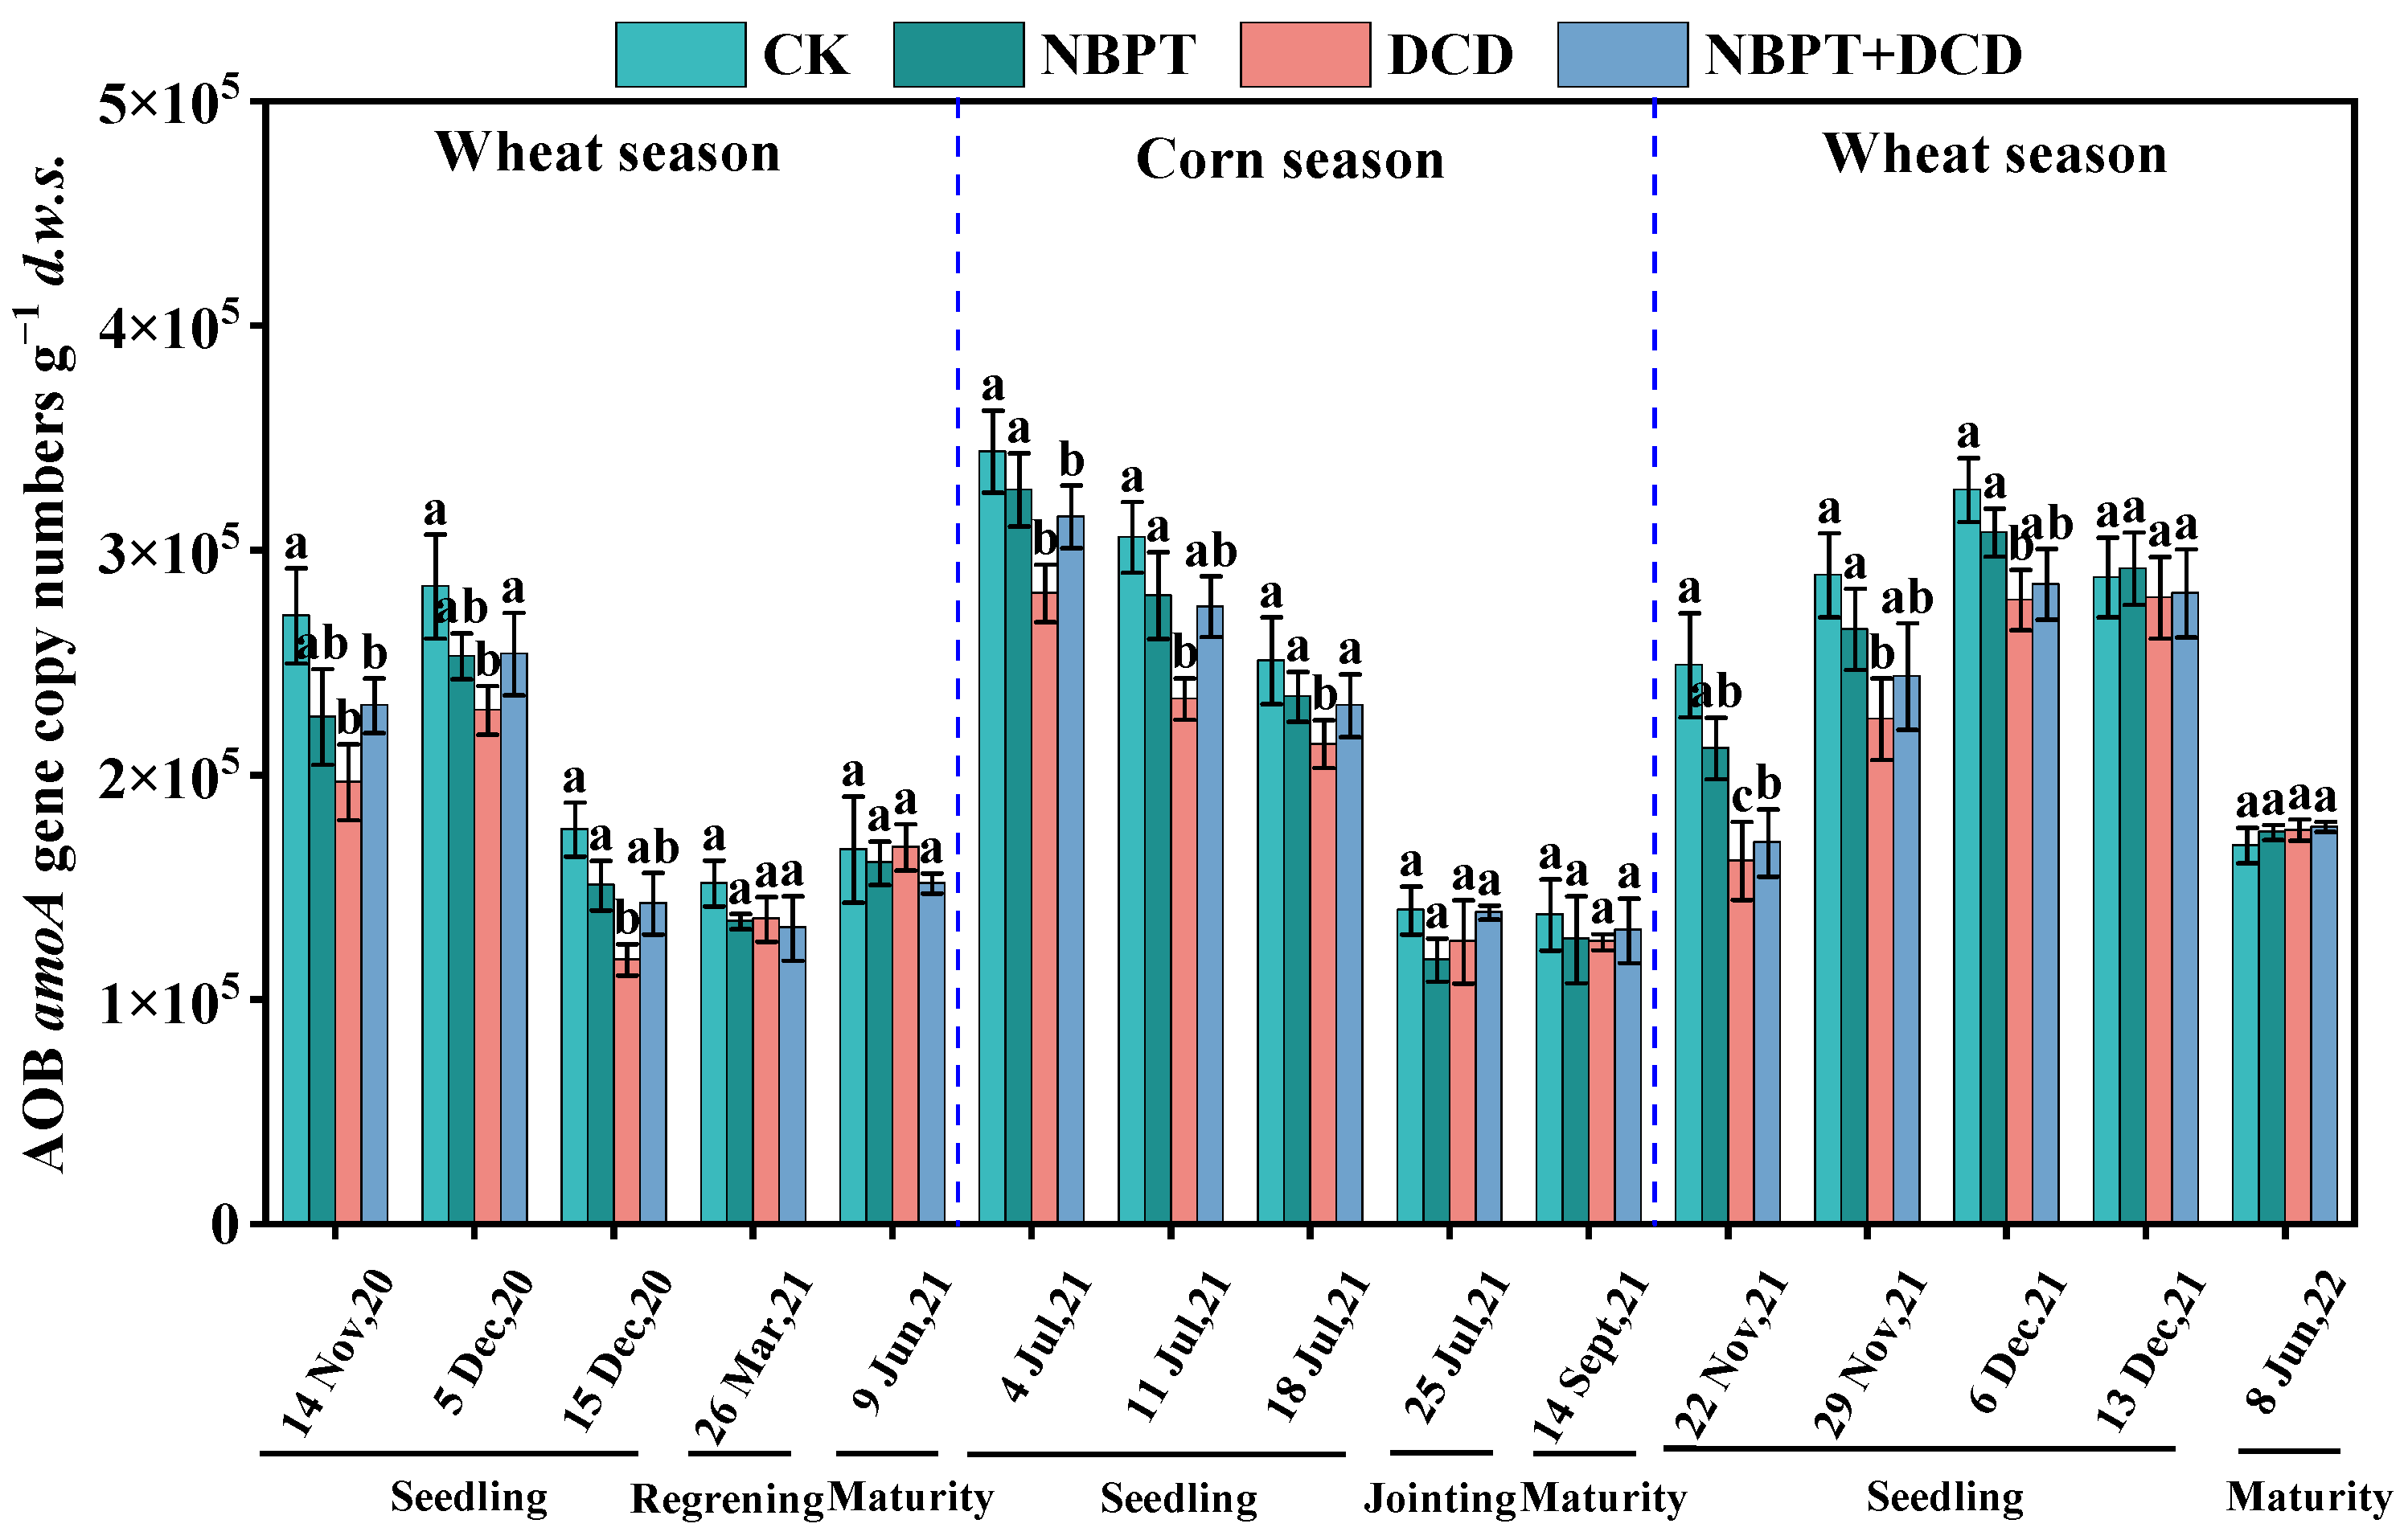
3.2.2. Abundance of the AOB amoA Gene

The gene abundance value of AOB amoA under CK and NBPT treatments varied from 1.52 × 10⁵ to 2.89 × 10⁵ and in the range of 1.35 × 10⁵ to 3.08 × 10⁵ copies g−1 d.w.s (Figure 3), respectively, during the wheat season. The investigation did not find any appreciable variations in the gene abundance value of AOB amoA during the course of the wheat season between the NBPT and CK treatments. The gene abundance value of AOB amoA in DCD and NBPT + DCD soils varied from 1.18 × 10⁵ to 2.79 × 10⁵ and from 1.32 × 10⁵ to 2.85 × 10⁵ copies g−1 d.w.s, respectively. Compared to CK treatment, DCD treatment significantly decreased the gene abundance value of AOB amoA at the wheat seedling stage, while NBPT + DCD treatment greatly lessened the gene abundance value of AOB amoA within 15 days of fertilization.
The gene abundance value of AOB amoA under CK and NBPT treatments ranged from 1.38 × 10⁵ to 3.44 × 10⁵ and from 1.18 × 10⁵ to 3.27 × 10⁵ copies g−1 d.w.s, respectively, during the wheat season. According to our data, there was no remarkable diversity in the copy number of the AOB amoA gene between the NBPT and CK treatments throughout the wheat season. The gene abundance value of AOB amoA in DCD and NBPT + DCD soils varied from 1.26 × 10⁵ to 2.81 × 10⁵ copies g−1 d.w.s and in the range of 1.31 × 10⁵ to 3.15 × 10⁵ copies g−1 d.w.s, respectively. Different from CK treatment, DCD treatment significantly decreased the copy number of the AOB amoA gene at the wheat seedling stage. NBPT + DCD treatment also greatly suppressed the gene abundance value of AOB amoA within 15 days after fertilization.

3.2.3. Abundance of the comammox amoA Gene

Generally, the gene abundance value of comammox amoA was much lower than those of AOA and AOB (Figure 4). The gene abundance value of comammox amoA in CK soils was from 1.45 × 10⁴ to 2.94 × 10⁴ copies g−1 d.w.s. The gene abundance value of the comammox gene treated with NBPT, DCD, and NBPT + DCD ranged between 7.70 × 10³ and 2.06 × 10⁴, from 4.66 × 10³ to 1.76 × 10⁴, and from 5.55 × 10³ to 1.91 × 10⁴ copies g−1 d.w.s, respectively. The gene abundance value of comammox amoA under NBPT, DCD, and NBPT + DCD treatments varied from 9.00 × 10³ to 2.06 × 10⁴, from 6.45 × 10³ to 1.76 × 10⁴, and from 7.30 × 10³ to 1.91 × 10⁴ copies g−1 d.w.s, respectively. In general, compared with CK, the NBPT, DCD, and NBPT + DCD treatments significantly decreased the abundance of comammox at the wheat and maize seedling stages.

3.3. Relationships between Nitrification Activity and the Abundance of Ammonia Oxidizers

Relationship analysis showed that the N O 3 -N concentration was positively correlated with both AOA (R2 = 0.07159, p < 0.01) and AOB abundance (R2 = 0.09359, p < 0.01) (Figure 5). There was no significant correlation between the concentration of N O 3 -N and comammox (R2 = 0.02589, p > 0.01) (Figure 5). No significant correlations were found between comammox and N O 3 -N content.

3.4. Crop Yield

The wheat yield varied from 8.95 to 9.26 t hm−2 in 2021 (Figure 6). Compared with CK, different treatments had no significant effect on the wheat yield. Interestingly, the maize yield under NBPT + DCD treatment was 11.63 t hm−2, which was greatly higher than that of CK. The wheat yield of CK was 7.81 t hm−2, which was greatly lower than that under NBPT, DCD, and NBPT + DCD treatments in 2022.

4. Discussion

4.1. Effects of Nitrification Inhibitors on Soil Mineral N

Our results revealed that NBPT treatment significantly decreased the concentration of N H 4 + -N and N O 3 -N at the seedling stage in both wheat and maize seasons compared with CK (Figure 1), which was consistent with Liu et al. (2020), who proposed that the application of NBPT in combination with urea during the corn season would make it possible to delay the nitrification step and improve nitrogen utilization efficiency [23]. The effects of NBPT on reducing nitrogen loss could be ascribed to the fact that NBPT decreased the hydrolysis rate of urea and reduced soil N H 4 + -N concentration, thus preventing the conversion of N H 4 + -N to N O 3 -N [24]. In addition, limited research has shown that NBPT treatment could increase ammonia (NH3) volatilization and was impractical for reducing NH3 volatilization from N sources with a high N H 4 + -N content, such as animal manure and ammonium fertilizers [25]. Therefore, the use of N inhibitors to improve nitrogen use efficiency in agriculture may be a double-edged sword.
The significant inhibitory effects of DCD on N O 3 -N content was in accordance with key findings. DCD inhibited nitrification in the seedling period of wheat and maize, thus reducing the production and leaching losses of N O 3 -N to a certain extent [26]. This could be attributed to DCD hindering the transformation of N H 4 + -N to N O 3 -N, thus effectively reducing the leaching loss of N O 3 -N [27]. It has been reported that the inhibitory capabilities of DCD only present for a week in soils at 30 °C, making DCD suitable for application in fall and winter [28]. This might be the reason why there was no difference in the content of N H 4 + -N and N O 3 -N between DCD and CK treatment after the maize seedling stage (18 July 2021; 30 °C). These results further corroborated that the application of DCD in the wheat-corn double cropping system has a positive effect on the nitrogen utilization of crops at the seedling stage, which provides valuable suggestions for guiding the scientific use of fertilizer inhibitors.
Interestingly, the effects of NBPT + DCD on soil mineral N resembled those of NBPT. Compared with CK, the soil N H 4 + -N and N O 3 -N content significantly decreased at the seedling and jointing stages of wheat and maize (Figure 1). In agricultural soils, applying NBPT and DCD together may be a more environmentally friendly strategy than doing so alone [29]. This might be explained by the possibility that DCD alone could increase soil N loss, while NBPT can prevent urea hydrolysis from delaying N H 4 + -N formation, thus reducing NH3 volatilization and nitrification loss [30,31]). That was consistent with the results of laboratory cultivation, as DCD could cause N H 4 + -N evaporation loss increases by 19%, DCD would not affect NBPT, and combining DCD and NBPT may partially counteract NBPT’s positive effects on N H 4 + -N volatilization [32].

4.2. Effects of NBPT and DCD on Ammonia-Oxidizing Microorganisms

NBPT exerted little effect on AOB abundance but drastically affected the gene abundance value of AOA and comammox in the tested soils (pH = 7.73) (Figure 2, Figure 3 and Figure 4). These consequences are consistent with Klimczyk et al. (2021), who found that NBPT could inhibit the growth and reproduction of AOA and comammox by reducing ammonia substrate [33]. Therefore, we hypothesize that NBPT in brown soil could limit nitrogen loss by preventing the growth of AOA and comammox, thereby maintaining the status of N H 4 + -N in the long term.
Our findings showed that DCD had no discernible effects on AOA but greatly inhibited the rise of AOB and comammox, which was in agreement with the results of previous studies (Figure 2, Figure 3 and Figure 4). The effect of DCD on reducing soil AOB and comammox activity and abundance is obvious, but its impact on AOA was minimal [16,34]. Previous studies have provided evidence that AOB plays a significant role in agricultural soils with high nutrient levels. We generally believe that as the abundance of microbes increases, their activity also increases, and in our wheat-corn double cropping sytem, AOA was much more abundant than comammox [35]. Here, we speculated that AOB might dominate the ammonia oxidation process in soils.

4.3. Correlation between Nitrifying Communities and Nitrification Activity

We found significant and positive correlations between N O 3 -N content and AOA (R2 = 0.07159, p < 0.01), as well as AOB (R2 = 0.09359, p < 0.01). In contrast, comammox (R2 = 0.02589, p > 0.01) abundance was low and did not show a significant positive correlation with N O 3 -N (Figure 5). This was generally consistent with the results of previous studies that under conditions of high ammonia concentrations in cultivated soils, AOA and AOB were functionally active [36]. Comammox was commonly found in low ammonium concentration environments, and dominates nutrient poor soil ecosystems [37]. Nevertheless, complete nitrification was theoretically more energy saving than traditional two-step nitrification [38]. The abundance of comammox was relatively low and there was no significant correlation with N O 3 -N content. Therefore, it was speculated that comammox hardly participated in nitrification.

4.4. Effect of Fertilizer Inhibitors on Yield

The use of DCD has been reported to positively affect N fertilization and the yield of crops [39]. In the present study, we found that the use of NBPT and DCD in the wheat-corn double cropping system significantly improved N use efficiency, which positively affected the grain yield. This might be because fertilizer inhibitors could increase the stomatal conductance of crops, and positive effects of fertilizer inhibitors on photosynthesis and yield could be expected under well-watered conditions [39]. On the other hand, an adequate N supplement could promote the growth of crop roots, which was conducive to leaf growth, and increase the photosynthetic area and thus increase production. These observations may need further refinement by more studies in different soil types and climates.

5. Conclusions

The results of the present investigation demonstrated that the N H 4 + -N oxidation and net N O 3 -N production were successfully inhibited by DCD and NBPT. The combined application of NBPT and DCD showed greater potential effects than DCD alone in reducing N O 3 -N leaching. DCD inhibited nitrification from urea for a maximum of 21 d, whereas NBPT and NBPT combined with DCD inhibited nitrification from urea for a maximum of 95 d. The fate of urea-derived N was correlated with both AOA and AOB, but not with comammox, which indicated that AOA and AOB played a major role in the agricultural soil nitrification process, rather than comammox. Our results also revealed that DCD directly blocked the growth of AOB and comammox, while NBPT blocked the growth of AOA and comammox. Our findings offer a theoretical framework for further investigation into the potential function of inhibitors in the environment and the overall nitrogen cycle.

Author Contributions

Conceptualization, Y.Z. and H.P.; methodology, H.P., H.F., Q.Y., Y.L., Z.Y. and H.W.; software, Z.Q. and X.X.; validation, Z.Q. and X.X.; formal analysis, H.P.; investigation, D.L., H.D. and T.P.; resources, Y.Z.; data curation, H.P., Z.Q. and X.X.; writing—original draft preparation, Z.Q. and H.P.; writing—review and editing, Z.Q. and H.P.; visualization, Y.Z. and H.P.; supervision, Y.Z.; project administration, Y.Z., H.P. and H.F. All authors have read and agreed to the published version of the manuscript.

Funding

This research was funded by the Natural Science Foundation of China (42007076 and 41907026), the Shandong Provincial Natural Science Foundation (ZR2023MD006), and Shandong Province Key Scientific and Technological Innovation Projects Program (2021CXGC010801).

Data Availability Statement

All relevant data presented in the article are stored according to institutional requirements and, as such, are not available online. However, all data used in this manuscript can be made available upon request to the authors.

Conflicts of Interest

The authors declare no conflicts of interest.

References

  1. Kits, K.; Sedlacek, C.; Lebedeva, E.; Han, P.; Bulaev, A.; Pjevac, P.; Daebeler, A.; Romano, S.; Albertsen, M.; Stein, L.; et al. Kinetic analysis of a complete nitrifier reveals an oligotrophic lifestyle. Nature 2017, 549, 269–272. [Google Scholar] [CrossRef]
  2. Daims, H.; Lebedeva, E.; Pjevac, P.; Han, P.; Herbold, C.; Albertsen, M.; Jehmlich, N.; Palatinszky, M.; Vierheilig, J.; Bulaev, A.; et al. Complete nitrification by Nitrospira bacteria. Nature 2015, 528, 504–509. [Google Scholar] [CrossRef]
  3. Wang, Z.; Cao, Y.; Zhu-Barker, X.; Nicol, G.; Wright, A.; Jia, Z.; Jiang, X. Comammox Nitrospira clade B contributes to nitrification in soil. Soil Biol. Biochem. 2019, 135, 392–395. [Google Scholar] [CrossRef]
  4. Ssenyonga, P.; Umemiya, Y. Amount of nitrogen and phosphorus fertilizer required to optimize growth and yield of rice. Afr. J. Agric. Res. 2021, 17, 829–835. [Google Scholar] [CrossRef]
  5. Singh, B.; Craswell, E. Fertilizers and nitrate pollution of surface and ground water: An increasingly pervasive global problem. SN Appl. Sci. 2021, 3, 518. [Google Scholar] [CrossRef]
  6. Ren, B.; Huang, Z.; Liu, P.; Zhao, B.; Zhang, J. Urea ammonium nitrate solution combined with urease and nitrification inhibitors jointly mitigate NH3 and N2O emissions and improves nitrogen efficiency of summer maize under fertigation. Field Crops Res. 2023, 296, 108909. [Google Scholar] [CrossRef]
  7. Abdo, A.; Xu, Y.; Shi, D.; Li, J.; Li, H.; El-Sappah, A.; Elrys, A.; Alharbi, S.; Zhou, C.; Wang, L.; et al. Nitrogen transformation genes and ammonia emission from soil under biochar and urease inhibitor application. Soil Tillage Res. 2022, 223, 105491. [Google Scholar] [CrossRef]
  8. Meng, X.; Li, Y.; Yao, H.; Wang, J.; Dai, F.; Wu, Y.; Chapman, S. Nitrification and urease inhibitors improve rice nitrogen uptake and prevent denitrification in alkaline paddy soil. Appl. Soil Ecol. 2020, 154, 103665. [Google Scholar] [CrossRef]
  9. Luchibia, A.; Suter, H.C.; Hu, H.; Lam, S.; He, J.-Z. Responses of ureolytic and nitrifying microbes to urease and nitrification inhibitors in selected agricultural soils in Victoria, Australia. J. Soils Sediments 2020, 20, 1309–1322. [Google Scholar] [CrossRef]
  10. Zhou, X.; Wang, S.; Ma, S.; Zheng, X.; Wang, Z.; Lu, C. Effects of commonly used nitrification inhibitors—Dicyandiamide (DCD), 3,4-dimethylpyrazole phosphate (DMPP), and nitrapyrin—On soil nitro-gen dynamics and nitrifiers in three typical paddy soils. Geoderma 2020, 380, 114637. [Google Scholar] [CrossRef]
  11. Avrahami, S.; Conrad, R.; Braker, G. Effect of Soil Ammonium Concentration on N2O Release and on the Community Structure of Ammonia Oxidizers and Denitrifiers. Appl. Environ. Microbiol. 2002, 68, 5685–5692. [Google Scholar] [CrossRef]
  12. Kelliher, F.; van Koten, C.; Kear, M.J.; Sprosen, M.S.; Ledgard, S.; De Klein, C.; Letica, S.; Luo, J.; Rys, G. Effect of temperature on dicyandiamide (DCD) longevity in pastoral soils under field conditions. Agric. Ecosyst. Environ. 2014, 186, 201–204. [Google Scholar] [CrossRef]
  13. Kim, D.G.; Giltrap, D.; Saggar, S.; Palmada, T.; Berben, P.; Drysdale, D. Factors controlling disappearance of nitrification inhibitor, dicyandiamide (DCD) in a grazed pasture soil in Manawatu. In Proceedings of the Workshop “Advanced Nutrient Management: Gains from the Past–Goals for the Future, Palmerston North, New Zealand, 7–9 February 2012. [Google Scholar]
  14. Fu, Q.; Abadie, M.; Blaud, A.; Carswell, A.; Misselbrook, T.; Clark, I.; Hirsch, P. Effects of urease and nitrification inhibitors on soil N, nitrifier abundance and activity in a sandy loam soil. Biol. Fertil. Soils 2020, 56, 185–194. [Google Scholar] [CrossRef] [PubMed]
  15. Lehtovirta-Morley, L.E.; Verhamme, D.T.; Nicol, G.W.; Prosser, J.I. Effect of nitrification inhibitors on the growth and activity of Nitrosotalea devanaterra culture and soil. Soil Biol. Biochem. 2013, 62, 129–133. [Google Scholar] [CrossRef]
  16. Duff, A.; Forrestal, P.; Ikoyi, I.; Brennan, F. Assessing the long-term impact of urease and nitrification inhibitor use on microbial community composition, diversity and function in grassland soil. Soil Biol. Biochem. 2022, 170, 108709. [Google Scholar] [CrossRef]
  17. Li, C.; Hu, H.; Chen, Q.; Chen, D.; He, J.-Z. Growth of comammox Nitrospira is inhibited by nitrifica-tion inhibitors in agricultural soils. J. Soils Sediments 2020, 20, 621–628. [Google Scholar] [CrossRef]
  18. Zaman, M.; Saggar, S.; Blennerhassett, J.D.; Singh, J. Effect of urease and nitrification inhibitors on N transformation, gaseous emissions of ammonia and nitrous oxide, pasture yield and N uptake in grazed pasture system. Soil Biol. Biochem. 2009, 41, 1270–1280. [Google Scholar] [CrossRef]
  19. Liu, G.; Yang, Z.; Du, J.; He, A.; Yang, H.; Xue, G.; Yu, C.; Zhang, Y. Adding NBPT to urea increases N use efficiency of maize and decreases the abundance of N-cycling soil microbes under reduced fertilizer-N rate on the North China. Plain PLoS ONE 2020, 15, e0240925. [Google Scholar] [CrossRef] [PubMed]
  20. Rotthauwe, J.; Witzel, K.; Liesack, W. The Ammonia Monooxygenase Structural Gene amoA as a Functional Marker: Molecular Fine-Scale Analysis of Natural Ammonia-Oxidizing Populations. Appl. Environ. Microbiol. 1998, 63, 4704–4712. [Google Scholar] [CrossRef]
  21. Long, X.-E.; Chen, C.; Xu, Z.; Oren, R.; He, J.-Z. Abundance and community structure of ammo-nia-oxidizing bacteria and archaea in a temperate forest ecosystem under ten-years elevated CO2. Soil Biol. Biochem. 2012, 46, 163–171. [Google Scholar] [CrossRef]
  22. Zhao, Z.; Huang, G.; Wang, M.; Zhou, N.; He, S.; Dang, C.; Wang, J.; Zheng, M. Abundance and community composition of comammox bacteria in different ecosystems by a universal primer set. Sci. Total Environ. 2019, 691, 146–155. [Google Scholar] [CrossRef] [PubMed]
  23. Peters, N.; Sören, T.-B. Major metabolites of NBPT degradation pathways contribute to urease inhibition in soil. Chemosphere 2022, 303, 135163. [Google Scholar] [CrossRef] [PubMed]
  24. Lam, S.; Suter, H.C.; Mosier, A.; Chen, D. Using nitrification inhibitors to mitigate agricultural N2O emission: A double-edged sword? Glob. Chang. Biol. 2016, 23, 485–489. [Google Scholar] [CrossRef]
  25. Tufail, M.; Naeem, A.; Arif, M.; Farooq, T.; Shahzad, S.; Dar, A.A.; Albasher, G.; Shakoor, A. Unraveling the efficacy of nitrification inhibitors (DCD and DMPP) in reducing nitrogen gases emissions across agroecosystems: A three-decade global data synthesis (1993–2021). Fuel 2022, 324, 124725. [Google Scholar] [CrossRef]
  26. Barth, G.; Otto, R.; Ferraz-Almeida, R.; Cardoso, E.; Cantarella, H.; Vitti, G. Conversion of ammonium to nitrate and abundance of ammonium-oxidizing-microorganism in Tropical soils with nitrification inhibitor. Sci. Agric. 2020, 77. [Google Scholar] [CrossRef]
  27. Gilsanz, C.; Báez, D.; Misselbrook, T.H.; Dhanoa, M.S.; Cárdenas, L.M. Development of emission factors and efficiency of two nitrification inhibitors, DCD and DMPP. Agric. Ecosyst. Environ. 2016, 216, 1–8. [Google Scholar] [CrossRef]
  28. Li, X.; Zhang, X.; Wang, S.; Hou, W.; Yan, L. The Combined Use of Liquid Fertilizer and Ure-ase/Nitrification Inhibitors on Maize Yield, Nitrogen Loss and Utilization in the Mollisol Region. Plants 2023, 12, 1486. [Google Scholar] [CrossRef] [PubMed]
  29. Mahmood, T.; Ali, R.; Latif, Z.; Ishaque, W. Dicyandiamide increases the fertilizer N loss from an alkaline calcareous soil treated with 15N-labelled urea under warm climate and under different crops. Biol. Fertil. Soils 2011, 47, 619–631. [Google Scholar] [CrossRef]
  30. Chen, D.; Suter, H.C.; Islam, A.; Edis, R.; Freney, J.; Walker, C. Prospects of improving efficiency of fertiliser nitrogen in Australian agriculture: A review of enhanced efficiency fertilisers. Aust. J. Soil Res. 2008, 46, 289–301. [Google Scholar] [CrossRef]
  31. Soares, J.R.; Cantarella, H.; Menegale, M.L.d.C. Ammonia volatilization losses from surface-applied urea with urease and nitrification inhibitors. Soil Biol. Biochem. 2012, 52, 82–89. [Google Scholar] [CrossRef]
  32. Klimczyk, M.; Siczek, A.; Schimmelpfennig, L. Improving the efficiency of urea-based fertilization leading to reduction in ammonia emission. Sci. Total Environ. 2021, 771, 145483. [Google Scholar] [CrossRef]
  33. Fan, X.; Chen, H.; Yan, G.; Ye, M.; Yin, C.; Li, T.; Wakelin, S.; Liang, Y. Niche Differentiation Among Canonical Nitrifiers and N2O Reducers Is Linked to Varying Effects of Nitrification Inhibitors DCD and DMPP in Two Arable Soils. Microb. Ecol. 2022, 85, 1434–1447. [Google Scholar] [CrossRef]
  34. Guo, J.; Ling, N.; Chen, H.; Zhu, C.; Kong, Y.; Wang, M.; Shen, Q.; Guo, S. Distinct drivers of activity, abundance, diversity and composition of ammonia-oxidizers: Evidence from a long-term field experiment. Soil Biol. Biochem. 2017, 115, 403–414. [Google Scholar] [CrossRef]
  35. Yin, Z.; Bi, X.; Xu, C. Ammonia-Oxidizing Archaea (AOA) Play with Ammonia-Oxidizing Bacteria (AOB) in Nitrogen Removal from Wastewater. Archaea 2018, 2018, 8429145. [Google Scholar] [CrossRef] [PubMed]
  36. Sakoula, D.; Koch, H.; Frank, J.; Jetten, M.; Kessel, M.; Lücker, S. Enrichment and physiological characterization of a novel comammox Nitrospira indicates ammonium inhibition of complete nitrification. ISME J. 2020, 15, 1010–1024. [Google Scholar] [CrossRef] [PubMed]
  37. van de Leemput, I.; Veraart, A.; Dakos, V.; De Klein, J.; Strous, M.; Scheffer, M. Erratum to Predicting microbial nitrogen pathways from basic principles. Environ. Microbiol. 2014, 16, 1477–1487. [Google Scholar] [CrossRef]
  38. Abalos, D.; Jeffery, S.; Sanz-Cobena, A.; Guardia, G.; Vallejo, A. Meta-analysis of the effect of urease and nitrification inhibitors on crop productivity and nitrogen use efficiency. Agric. Ecosyst. Environ. 2014, 189, 136–144. [Google Scholar] [CrossRef]
  39. Kawakami, E.M.; Oosterhuis, D.M.; Snider, J.L.; Mozaffari, M. Physiological and yield responses of field-grown cotton to application of urea with the urease inhibitor NBPT and the nitrification inhibitor DCD. Eur. J. Agron. 2012, 43, 147–154. [Google Scholar] [CrossRef]
Figure 1. Content of N H 4 + -N (a) and N O 3 -N (b) in soil. Fertilizers and inhibitors were applied simultaneously at the time of crop seeding. Different lowercase letters indicate statistical differences between different treatments during the same period (p < 0.05; n = 3). Bars represent standard errors.
Agronomy 14 00285 g001
Figure 2. Copy number of ammonia-oxidizing archaea (AOA) amoA gene in the soil. Fertilizers and inhibitors were applied simultaneously at the time of crop seeding. Different lowercase letters indicate statistical differences between different treatments in the same period (p < 0.05; n = 3). Bars represent standard errors.
Agronomy 14 00285 g002
Figure 3. Copy number of ammonia-oxidizing bacteria (AOB) amoA gene in the soil. Fertilizers and inhibitors were applied simultaneously at the time of crop seeding. Different lowercase letters indicate statistical differences between different treatments in the same period (p < 0.05; n = 3). Bars represent standard errors.
Agronomy 14 00285 g003
Figure 4. Copy number of complete ammonia oxidizer (comammox) amoA gene in the soil. Fertilizers and inhibitors were applied simultaneously at the time of crop seeding. Different lowercase letters indicate statistical differences between different treatments in the same period (p < 0.05; n = 3). Bars represent standard errors.
Agronomy 14 00285 g004
Figure 5. Relationships between N O 3 -N content and AOA (a) and AOB (b) and comammox (c).
Agronomy 14 00285 g005
Figure 6. Wheat and maize yield during the experiment period. According to the least significant difference (LSD) multiple comparison method, for each treatment, different lowercase letters indicate that there were statistical differences between treatments in the same period (p < 0.05; n = 3). Bars represent standard errors.
Agronomy 14 00285 g006
Table 1. Primers and conditions used for Real-time Quantitative PCR Detecting System (qPCR).
Target GenePrimer SetSequence (5′–3′)Annealing TemperatureReference
Ammonia-oxidizing archaea (AOA) crenamoA23f
crenamoA616r
ATGGTCTGGCTWAGACG
GCCATCCATCTGTATGTCCA
59 °C[20]
Ammonia-oxidizing bacteria (AOB)amoA-1F
amoA-2R
GGGGTTTCTACTGGTGGT
CCCCTCKGSAAAGCCTTCTTC
55 °C[21]
Complete ammonia oxidizer (comammox)comamoA F
comamoA R
AGGNGAYTGGGAYTTCTGG
CGGACAWABRTGAABCCCAT
53 °C[22]
Disclaimer/Publisher’s Note: The statements, opinions and data contained in all publications are solely those of the individual author(s) and contributor(s) and not of MDPI and/or the editor(s). MDPI and/or the editor(s) disclaim responsibility for any injury to people or property resulting from any ideas, methods, instructions or products referred to in the content.

