Article

Physiological Nitrogen Uptake and Utilisation Responses in Two Native Plants from the Qinghai-Tibet Plateau under Different Water and Fertiliser Conditions

1
School of Life Sciences, Guizhou Normal University, Guiyang 550025, China
2
State Key Laboratory of Soil Erosion and Dryland Farming on the Loess Plateau, Northwest A&F University, Xianyang 712100, China
3
State Key Laboratory of Soil Erosion and Dryland Farming on the Loess Plateau, Institute of Soil and Water Conservation, Chinese Academy of Sciences and Ministry of Water Resources, Xianyang 712100, China
4
State Key Laboratory of Herbage Improvement and Grassland Agro-Ecosystems, Center for Grassland Microbiome, and College of Pastoral, Agriculture Science and Technology, Lanzhou University, Lanzhou 730000, China
5
Qiangtang Alpine Grassland Ecosystem Research Station (Jointly Built with Lanzhou University), Tibet Agricultural and Animal Husbandry University, Nyingchi 860000, China
6
College of Grassland Agriculture, Northwest A&F University, Xianyang 712100, China
*
Author to whom correspondence should be addressed.
Agronomy 2024, 14(3), 440; https://doi.org/10.3390/agronomy14030440
Submission received: 21 December 2023 / Revised: 7 February 2024 / Accepted: 17 February 2024 / Published: 23 February 2024
(This article belongs to the Special Issue Interactions between Plants and Soil Microbes in Natural Ecosystem)

Abstract

:
Drought and poor soil quality are the main characteristics of extreme environments in arctic–alpine areas. Understanding how herbaceous plants in alpine grasslands maintain the normal supply and utilisation of nutrients under different rainfall conditions is key to maintaining population stability. In the present study, the native plants Poa crymophila and Stipa purpurea of the Qinghai–Tibet Plateau were used to conduct a controlled experiment involving water and fertiliser to analyse their physiological responses in terms of nutrient uptake and utilisation. The results showed that decreased soil moisture increased proline and non-structural carbohydrates in P. crymophila, mainly accumulating in the leaves and stems. Nitrogen (N) addition promoted proline accumulation, whereas nonstructural carbohydrate content decreased. However, the proline and non-structural carbohydrate contents of S. purpurea were less affected by water and fertiliser. Additionally, drought restricted rhizospheric and non-rhizospheric alkaline-hydrolysed N release, increased rapidly available phosphorus (RAP) content in rhizospheric soil, limited root growth, and reduced surface area, root length, and root volume. Both aboveground and underground N fertiliser utilisation rates decreased. Under well-hydrated conditions (WH), high N levels increased rhizospheric alkaline-hydrolysed N and urease activity while inhibiting RAP and activity of alkaline phosphatase contents, thereby limiting root growth and reducing N fertiliser utilisation. The results indicate that both plant species have relatively low overall nutrient requirements that are limited mainly by water availability. The addition of low amounts of fertiliser is beneficial for nutrient release and utilisation, improving their adaptability to arctic–alpine environments and their suitability and superiority in the community. This study has significant implications for nutrient management and ecological restoration measures in arctic–alpine grasslands.

1. Introduction

Under the influence of climate change, soil evaporation rates increase and water content decreases, which leads to a decrease in nutrient mineralisation rates and soil available nitrogen (N) and phosphorus (P) concentrations, aggravating the degradation of alpine grasslands [1]. Water and fertilisers are vital for the growth, development, and sustainability of plant populations. Water is integral to the metabolic processes within plants, facilitating a range of biochemical reactions. It enhances nutrient utilisation efficacy and aids the adaptability of plants to environmental conditions [2]. Fertilisers provide essential nutrients to plants and can improve water utilisation, which also determines the role of water–fertiliser synergies [3].
Plants adjust their physiological properties to adapt to various water and nutrient environments. Proline, soluble sugars, and starch play important roles in plant physiological processes. As carbon (C) buffers and osmotic regulators, they regulate plant stress responses, growth, and development [4]. In arid environments, proline and soluble sugars accumulate in plants, reducing water loss to maintain cell osmotic pressure and reduce osmotic potential [5]. Starch can be rapidly mobilised in plants to provide energy and C, release sugars and other derived metabolites, support plant growth under stress, and act as an osmoprotectant and a compatible solute to mitigate the negative effects of stress [6].
In a study focusing on water stress, Li (2013) et al. [7] found that longer drought durations led to increased proline and soluble sugar levels in the leaves of several plant species, including Trifolium repens, Bothrio’.chloa ischaemum, and Melilotus officinalis. Additionally, Bothriochloa ischaemum exhibited increased conversion of starch to soluble sugars, resulting in a decrease in starch content [8]. Under moderate drought conditions, the judicious application of nitrogen fertiliser has been shown to enhance a plant’s ability to regulate osmotic pressure. This adaptation improves water availability, enabling plants to sustain turgor pressure despite reduced water potential, thereby augmenting their overall drought tolerance [9]. Cong (2019) et al. [10] revealed that increased N application in Leymus chinensis, a grass species, gradually increased its soluble sugar content while reducing its starch content. In Linum usitatissimum, also known as flax, an initial increase in nonstructural carbohydrate accumulation in the leaves was observed, followed by a decrease with increasing N levels. Current studies have mainly focused on the influence of a single factor, either water or fertiliser, on plant physiological processes. Considering the close relationship between water and fertiliser, it is necessary to clarify the physiological responses of plants under the interaction of water and fertiliser. In the process of plant growth, the distribution and transformation of nonstructural carbohydrates produced by photosynthesis between the source and sink organs under different water and fertiliser conditions also need to be explored further.
In addition, there is a close relationship between plant adaptability and nutrient supply under stressful conditions. Soil nutrients provide essential mineral elements for plant growth, and soil enzyme activity and the rhizosphere environment can affect soil nutrient supply [11]. Urease (URE), an enzyme catalyst, plays a pivotal role in the N cycle by decomposing and converting N compounds, thereby facilitating the hydrolysis of nitrogenous organic matter [12]. Phosphatases promote the conversion of organophosphorus to inorganic P, which is easily absorbed and utilised by plants [13]. Soil moisture content influences plant nutrient uptake by affecting soil enzyme activities, including those of URE and alkaline phosphatase (ALP) [14]. Insufficient soil moisture limits nutrient transport and hampers nutrient transfer, leading to decreased nutrient utilisation, as air replaces water in soil pores [15]. An adequate nutrient supply causes various changes in soil pH, nutrient use efficiency, and the activity of several soil enzymes in the rhizosphere [16]. Nitrogen addition to the soil stimulates URE and phosphatase activity [17]; however, excessively high nitrogen levels can inhibit this activity [18]. Soil moisture and nutrient conditions significantly affect the rhizosphere. Limited water availability can lead to increased salt concentrations near plant roots, releasing solutes from root cells and adversely affecting root development and biochemical processes in the rhizosphere [19]. Enhanced N and P inputs can modify plant root architecture, biomass, and root respiration, impacting the rhizosphere environment through their effects on C cycling [20]. However, in the present study, when soil nutrients were scarce or supplied adequately, their effectiveness and release mechanisms remained unclear. The role of the rhizosphere still needs to be explored.
The Qinghai–Tibet Plateau is experiencing notable warming due to global climate change [21]. Alpine grassland is one of the main grassland types on the Qinghai–Tibet Plateau, and the population size and density of the dominant species, such as P. crymophila and S. purpurea, have been decreasing in degraded areas due to that water and temperature conditions. Understanding how such primary native plant species adapt to environmental changes is crucial for promoting the sustainable development of high-altitude meadows. At present, studies on P. crymophila and S. purpurea have focused on single-factor fertilisation rates [22] or drought resistance [23], and analysis of the water-N coupling process is lacking. Moreover, the processes of nutrient release, absorption, and physiological adaptation under water–N interactions are poorly understood. The present study was an experimental investigation of water and fertiliser regulation in potted plants, focusing on the following aspects: (1) the physiological adaptability of P. crymophila and S. purpurea under different water and fertiliser conditions, (2) the relationship between N and P supply under water–N interactions, and (3) the regulation of nutrient uptake in the species under water–N conditions. Furthermore, the optimal water and fertiliser ratios were determined. The findings of the present study could provide critical insights that could facilitate the development of science-based management strategies for alpine grasslands and the restoration of degraded grasslands.

2. Materials and Methods

2.1. Study Area

The experimental site was located at the Grass Science Internship Base of the Tibet College of Agriculture and Animal Husbandry (29.66° N, 94.34° E, altitude 2969 m). For the present study, P. crymophila and S. purpurea, two primary forage grasses found in the alpine grasslands of Northern Tibet, were selected as the test subjects. Seeds of the plants were collected in Nagchu City, Tibet, in September 2020 and stored at 5 °C until subsequent experiments.

2.2. Experimental Design

Controlled pot experiments were conducted in a greenhouse with a temperature of 26 °C from August to December 2021. Cylindrical flowerpots with a height of 20 cm and an inner diameter of 28.5 cm were selected. Sandy loam with a RAN content of 25.73 mg/Kg, a RAP content of 9.30 mg/Kg, and a pH value of 7.30 was selected. The potting soil weight was 8.5 kg, the maximum field water capacity was 30.27%, and the soil bulk density was 1.32 g/cm3. A two-factor split block design was selected. The first factor was fertilisation treatment, and urea CO(NH2)2 was selected as the N fertiliser, with four levels, i.e., CK (0 g/kg, normal water supply), FL (0.11 g/kg), FM (0.33 g/kg), and FH (0.54 g/kg). The second factor was water treatment, with three levels, i.e., sufficient water (WH), mild water stress (WM), and moderate water stress (WL). The soil water contents were 75%, 55%, and 35% of the maximum field water capacity. There were 24 treatments with six replicates, yielding 144 pots.
On 6 August 2022, 10 seeds were sowed uniformly in the centre of each pot, and 5 plants/pots of seedlings with similar growth conditions were selected and retained after sprouting. On September 15, P2O5 (0.07 g/kg) and KCl (0.1 g/kg) were applied as base fertiliser, and the plants were irrigated to the maximum field water capacity of 60%. One week after the base fertiliser was applied, the urea was applied in various treatments according to the fertiliser gradient; the specific fertiliser amounts were calculated according to the unit area, and it could be added only once. The weighing method was used to replenish and control the moisture strictly based on the soil moisture content of the experimental design until the end of the experiment. The positions of the two plants were switched weekly to minimise any impact of the environment on the experimental outcome.

2.3. Measurement of Indicators and Methods

2.3.1. Soil Nutrient and Enzyme Activity Measurement

At the end of the experiment, three individuals with uniform growth were selected randomly from each treatment and the root system was removed from the soil. The rhizosphere soil and non-rhizosphere soil were collected using the root shaking method. A portion of the soil sample was passed through a 1 mm sieve and then placed in a refrigerator at 4 °C for enzyme activity determination; another portion of the soil was dried to determine soil nutrients.
The RAP was measured through sodium bicarbonate extraction with molybdenum-antimony resistance colourimetry. First, a 2.5 g (accurate to 0.001 g) air-dried soil sample was weighed and placed in a 150 mL triangular flask; subsequently, 50 mL of 0.5 mol/L NaHCO3 solution and a spoonful of P-free activated charcoal were added; the sample was shaken for 30 min and then filtered immediately through P-free filter paper. Next, 10 mL of the filtrate were pipetted into a 50 mL volumetric flask; distilled water was added, and 5 mL of molybdenum–antimony antimicrobial reagent were added. Subsequently, it was left to stand for 30 min after shaking at constant volume. Finally, the colour was compared at 700 nm, and the absorbance value of the solution to be measured was read when the absorption value of the blank solution was zero.
The alkali hydrolysed N content in the soil was measured using the alkaline diffusion method. First, 2.0 g of air-dried soil sample were weighed and placed in the outer chamber of the diffusion dish and the dish was rotated gently to make the sample spread evenly. Subsequently, 2 mL of 2% boric acid-indicator solution were absorbed and placed in the inner chamber of the diffusion dish. Afterward, an alkaline adhesive solution was applied to the outer edge of the diffusion dish; it was covered with ground glass and rotated several times so that the ground glass was bonded fully to the edge of the dish. Subsequently, the ground glass was pushed gently forward to open the outer chamber of the diffusion dish until a slit was exposed, and 10 mL of 1.8 mol/L NaOH solution were added quickly to the outer chamber of the diffusion dish and covered tightly immediately. The diffusion dish was rotated gently so that the NaOH solution was mixed completely with the soil. Finally, the ground glass was fastened with a rubber band, labelled, and placed in a 40 °C thermostat for 24 ± 0.5 h for alkaline diffusion. After removal, the amount of N absorbed in the inner chamber of the diffusion dish was titrated with standard HCl solution (0.01 mol/L). The end point was reached when the colour changed from blue to violet-red; the amount (millilitre) of HCl used was recorded. A blank test was also performed to record the amount of hydrochloric acid used for titration of the blank soil sample.
Urease activity was measured using a colourimetric method. Soil samples (5 g) were incubated with 1 mL of toluene, 10 mL of 10% urea solution, and 20 mL of citrate buffer (pH 6.7) in an incubator at 37 °C. After 24 h of incubation, 4 mL of sodium phenol solution and 1 mL of hypochlorite solution were added to a 3 mL suspension and measured using a spectrophotometer at 578 nm within 1 h. Alkaline phosphatase activity was measured using the disodium benzene phosphate method. Another 5 g of soil sample were incubated with 20 mL of 0.5% disodium phenyl phosphate solution in an incubator at 37 °C. After 24 h of incubation, 2 mL ammonium molybdate solution were added to a 10 mL suspension and measured using a spectrophotometer at 578 nm [24].

2.3.2. Soluble Sugar, Starch, and Proline Measurement

The roots, stems, and leaves of the selected plants were separated during soil collection, wrapped in foil, and stored in plastic bags to preserve their morphology, before being frozen at −80 °C. The total soluble sugar and starch contents were measured using the anthrone–sulfuric acid method. Briefly, oven-dried samples (0.1 g) with 5 mL of 80% v/v ethanol were incubated at 80 ℃ for 40 min and then centrifuged at 8000× g for 10 min. The supernatant was collected, and the residue was re-extracted twice, as described above. The residue was retained for starch analysis, as described in the present section. Anthrone reagent (5 mL) was applied to the collected supernatant, which was then incubated at 100 °C for 10 min, and then the absorbance was determined at 620 nm using an ultraviolet–visible spectrophotometer. The proline levels were measured using acid ninhydrin colourimetry. A fresh 0.25 g sample was crushed in 10 mL of 3% aqueous sulfosalicylic acid and centrifuged at 1500× g for 10 min. Subsequently, 2 mL of the supernatant were added to 2 mL of glacial acetic acid, after which 2 mL of acidic ninhydrin were added. The solution was kept at 100 °C in a bain-marie for 60 min. The reaction was terminated by placing the mixture in an ice bath and adding 4 mL of toluene. The absorbance of the upper phase was measured at 520 nm using toluene as the blank [25].

2.3.3. Measuring Root Indicators

The entire root system of each plant was scanned using a root scanner to capture detailed images. WinRHIZO Tron v2018.06 root analysis software (Regent Instruments, Quebec City, QC, Canada) was used to map the root system images and collect morpho-configurational parameters, including root length, surface area, and volume.

2.4. Statistical Analysis

Data collected from the experiments were compiled and processed using MS Excel 2010 (Microsoft Corp., Redmond, WA, USA). Statistical analyses, including one-way and two-way significance tests at an α = 0.05 level, were conducted using IBM SPSS Statistics 21 (IBM Corp., Armonk, NY, USA). Multiple comparisons were performed using the least significant difference (LSD) method. The resulting data plots were generated and evaluated using Origin2021 software (OriginLab Corporation, Northampton, MA, USA). Note that some data in the following section are presented as mean ± SE.

3. Results

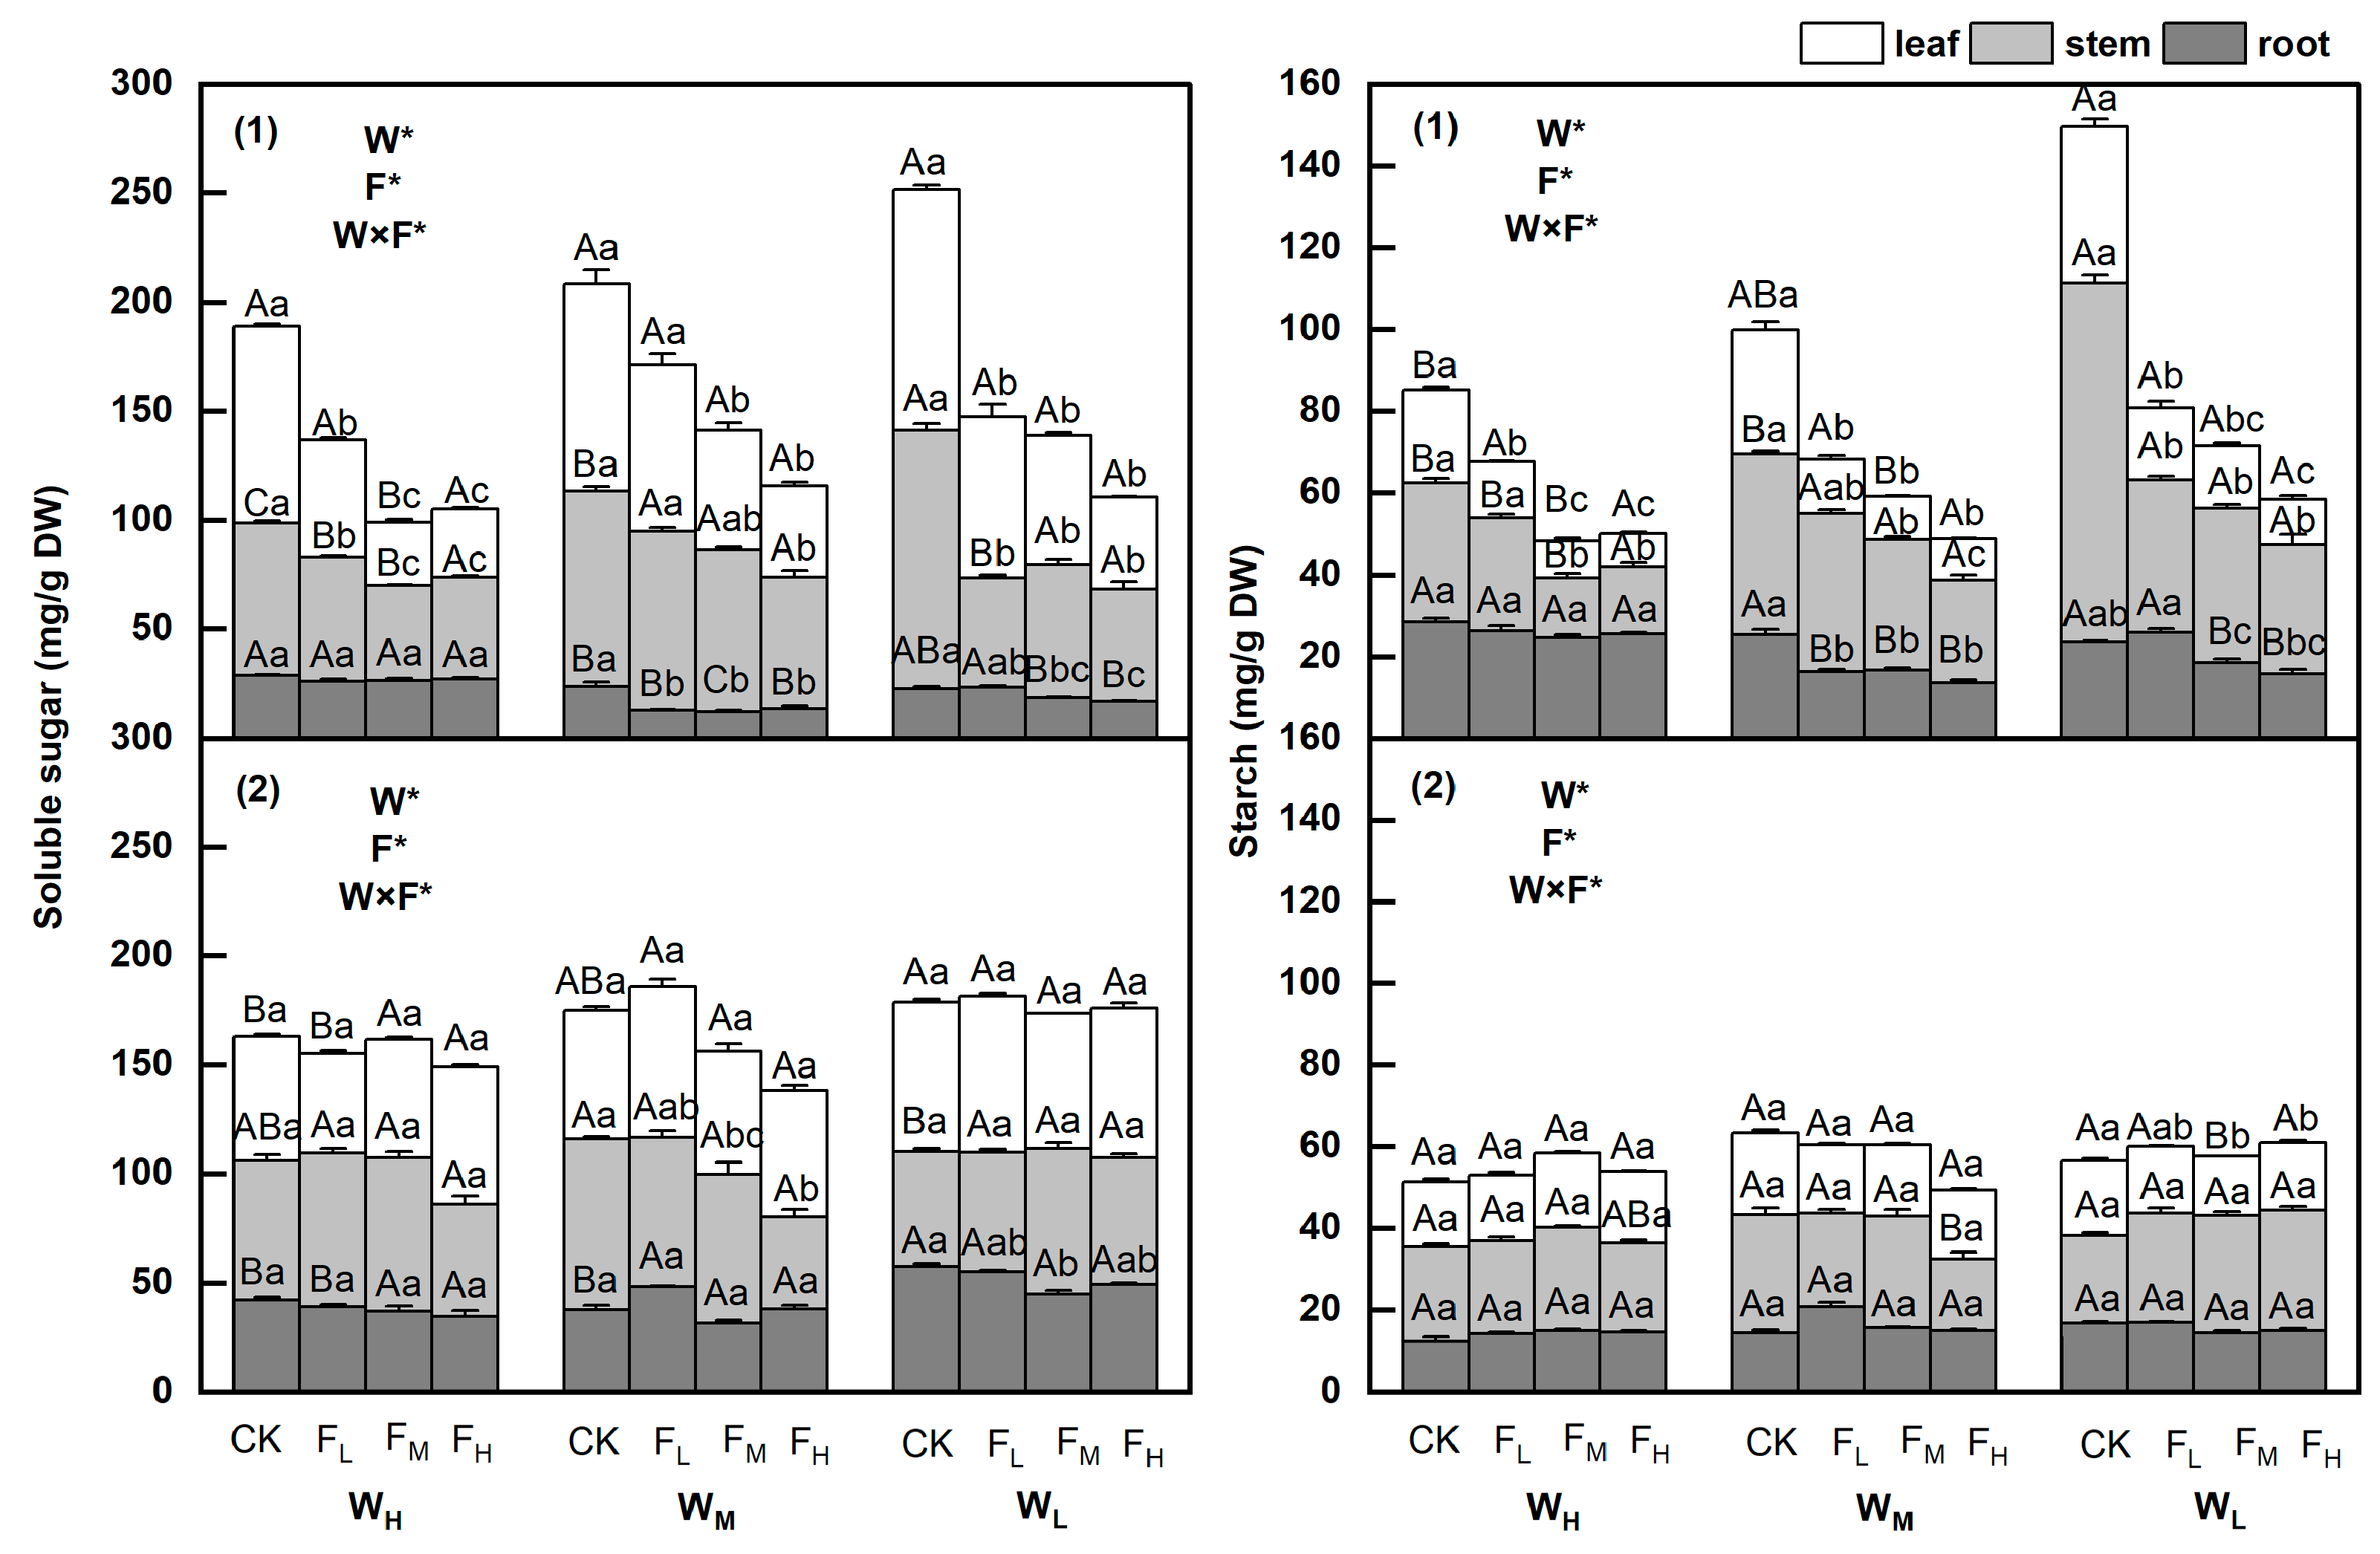
3.1. Changes in Soluble Sugars and Starch Contents

The soluble sugar and starch contents of the two species differed across the various water and fertiliser treatments (p < 0.05). Overall, the soluble sugar and starch contents in P. crymophila were the highest in the CK treatment group, with an increasing trend under water stress and a decreasing trend with increasing fertiliser levels, reaching maximum values in the WLCK treatment group. In contrast, the soluble sugar and starch contents in S. purpurea remained relatively stable, showing minimal change under the influence of water and fertiliser; the optimal water and fertiliser ratio was observed in the WMFL and WMCK treatments (Figure 1).
The soluble sugar and starch contents in the leaves and stems of P. crymophila were affected significantly by water and fertiliser changes; however, the contents in the roots remained relatively stable. The soluble sugar and starch contents in the leaves and stems decreased significantly with increasing fertiliser levels (p < 0.05), with FH reductions ranging from 128.0% to 189.0% and from 48.2% to 129.4% compared to those in the leaves of the CK group, and from 178.1% to 244.1% and from 76.3% to 178.9% in the stems of the CK group (p < 0.05); in contrast, the reductions in FH in the roots were only from 7.5% to 75.5% and from 11.6% to 85.9% (p < 0.05), respectively (Figure 1 (1)).
The soluble sugar contents in the stems of S. purpurea decreased by 85.2% in the FH treatment group compared to the CK treatment group (p < 0.05), whereas the roots in the WM treatment group had the lowest nonstructural carbohydrate content, which was 28.5% lower compared to the CK treatment group (p < 0.05). Only the starch content in the leaves of the WL treatment group differed, with FM decreasing by 26.6% compared to the CK treatment group (p < 0.05) (Figure 1 (2)).

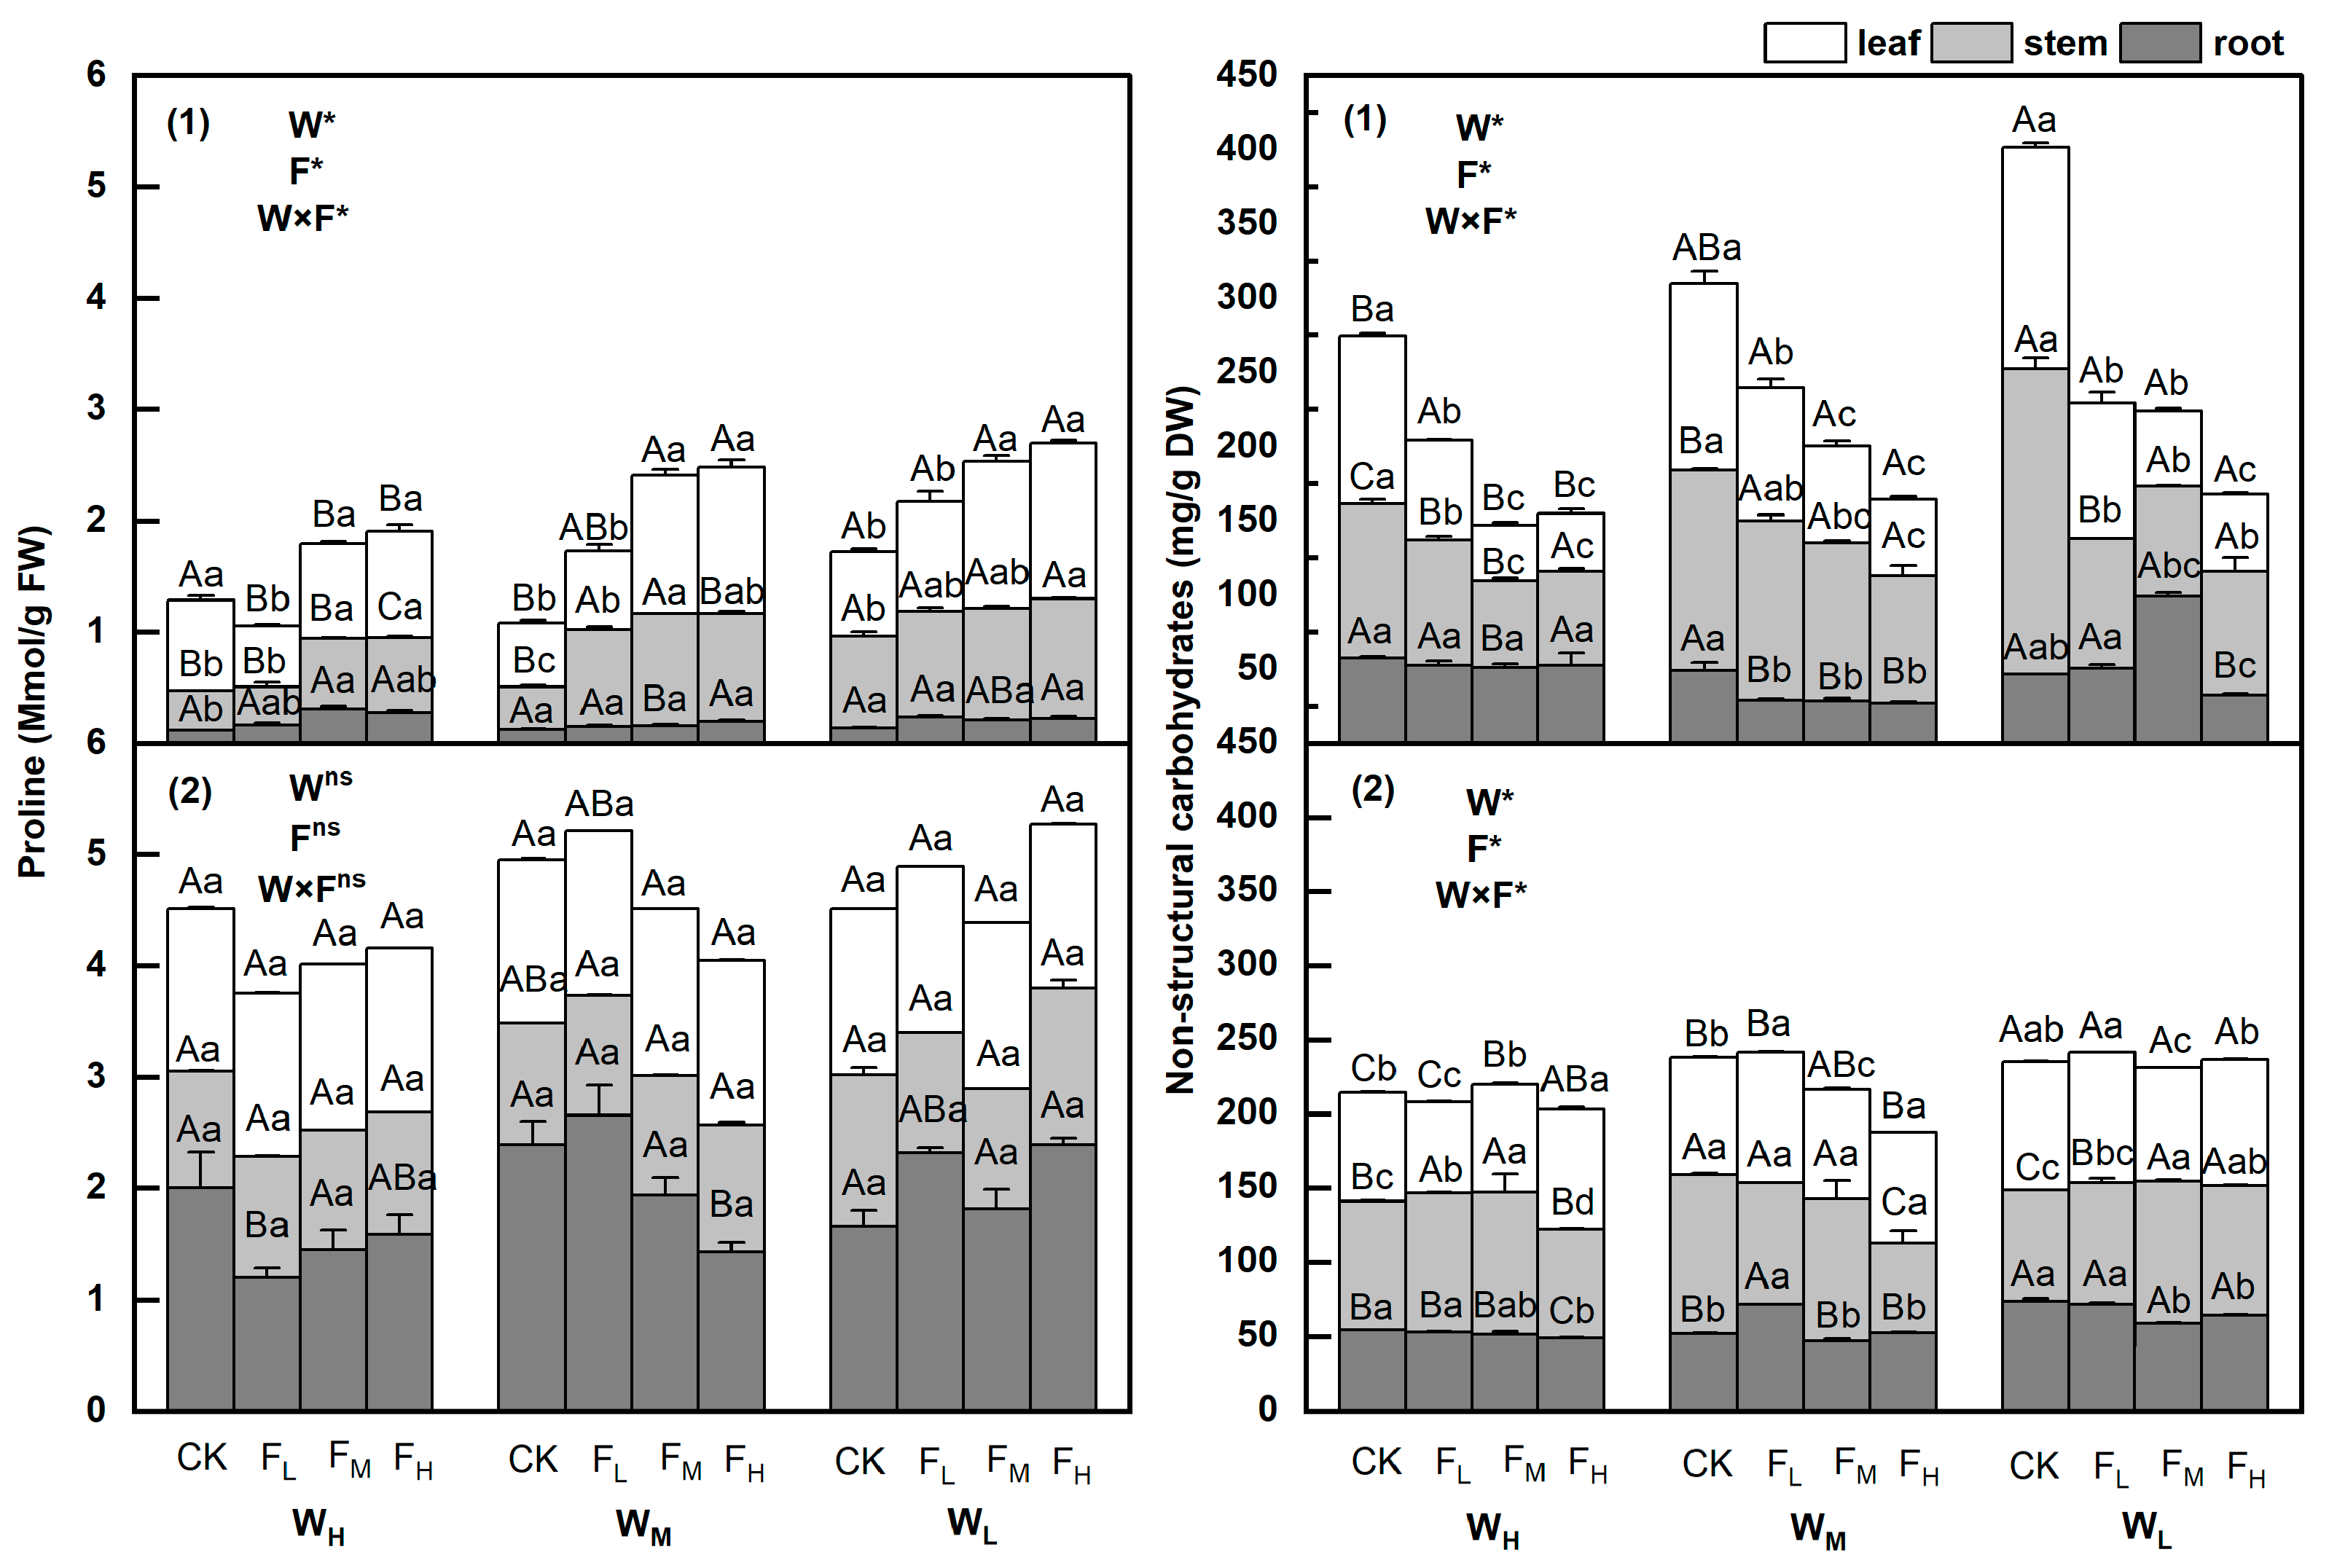
3.2. Changes in Proline and Nonstructural Carbohydrate Contents

The proline and nonstructural carbohydrate contents in the different plant components of the two species differed between the various water and fertiliser treatments (p < 0.05). Overall, the proline and nonstructural carbohydrate contents in P. crymophila were the highest in the CK and FH treatment groups, with an increasing trend under increased water stress for the former and a decreasing trend for the latter. The optimal water-to-fertiliser ratio was observed in the WLCK and WLFH treatments. In contrast, the proline content in S. purpurea showed an increasing and then decreasing trend under increased water stress, whereas nonstructural carbohydrate content was barely affected by water. Both components showed an increasing and then decreasing trend under increased fertiliser levels in the WM treatment group, with the optimal water and fertiliser ratios occurring in the WMFL and WLFH treatment groups (Figure 2).
The proline and nonstructural carbohydrate contents in the leaves and stems of P. crymophila were affected significantly by changes in water and fertiliser, whereas those in the roots remained relatively stable. Both the leaves and stems showed a significant decrease in proline and nonstructural carbohydrate contents with increasing fertiliser levels (p < 0.05). Under the FH treatment, proline content in leaves and stems increased from 18.2% to 129.1% and from 29.5% to 152.3%, respectively, compared to the CK group, whereas in the roots, FM increased by 164.2% under the WH treatment (p < 0.05). Nonstructural carbohydrate content under the FH treatment decreased from 142.5% to 186.9% and from 58.2% to 148.1% in the leaves and stems, respectively, compared to the CK group, with a smaller reduction of 42.4% to 80.7% in the roots (p < 0.05) (Figure 2 (1)). In S. purpurea, the proline content in the leaves was not affected significantly by changes in water or fertiliser, whereas in the roots, there was a significant difference in proline content between the FL and FH treatments (p < 0.05). Under FL, WM was 121.8% higher than WH (p < 0.05), and under FH, WL was 67.6% higher than WM (p < 0.05). The nonstructural carbohydrate content in the leaves increased significantly with increasing fertiliser levels under the WH treatment, with FH being 10.3% higher than that of the CK group (p < 0.05), whereas under WM and WL, FM was the lowest and was 7.2% and 23.4% lower than that of CK, respectively (p < 0.05). In the stems, FM was the highest under the WH and WL treatments, at 10.0% and 28.8% higher than that in the CK treatment, respectively (p < 0.05), with minimal differences in the roots under each water treatment (Figure 2 (2)).

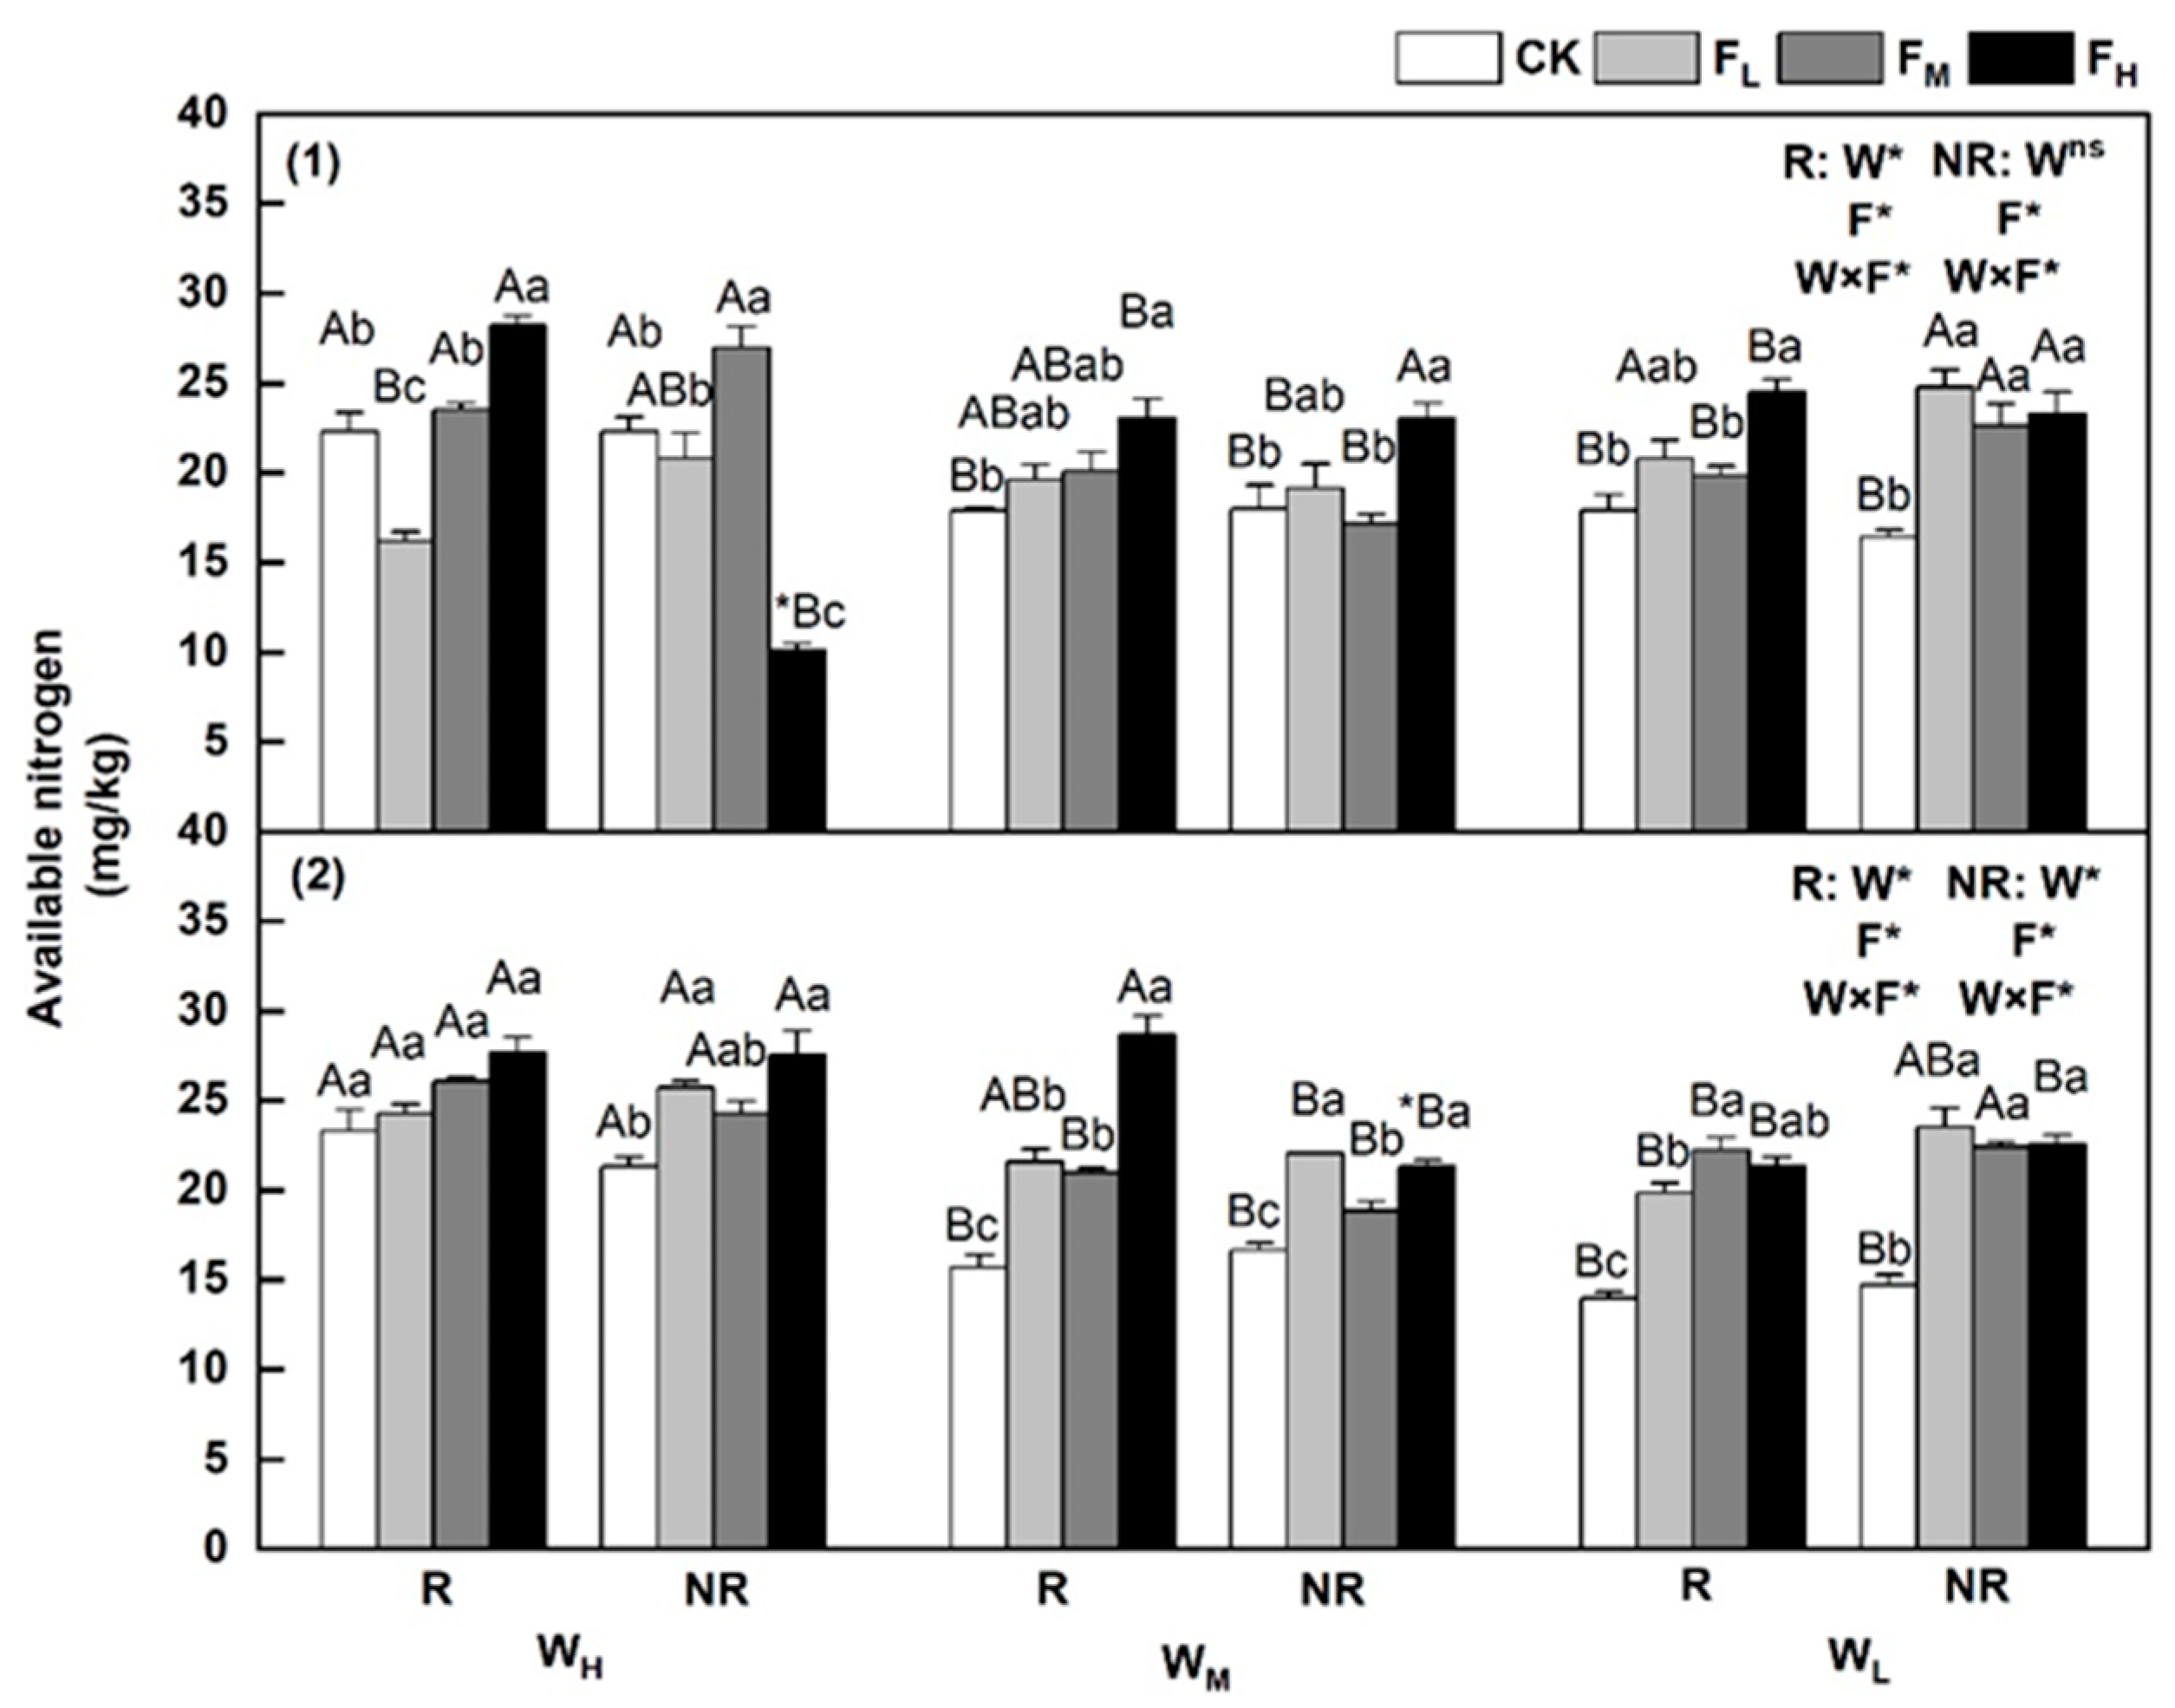
3.3. Changes in Alkaline-Dissolved Nitrogen Content

The available N content of the two tested plants was influenced by the rhizosphere, with significant differences between the rhizosphere and non-rhizosphere soils (p < 0.05). Controlled by water availability and fertiliser treatments, available N decreased with decreasing moisture and exhibited varying sensitivities under different fertiliser conditions. The highest available N contents for both plants were observed in the rhizosphere soil under the WHFH and WMFH treatments (Figure 3). Specifically, in the rhizosphere soil, the available N content for P. crymophila was the highest under the FH treatment for all water conditions, showing an increase of 26.4% to 37.0% compared with that of CK (p < 0.05). In the non-rhizosphere soil, under the WH and WM treatments, the values were the highest under the FM and FH treatments, showing increases of 20.9% and 27.9%, respectively, compared to that of CK (p < 0.05). The highest FL values occurred under the WL treatment, with a 35.7% increase compared to that in the CK group (p < 0.05) (Figure 3 (1)). For S. purpurea in the rhizosphere soil, the highest available N content was observed under the FH and FM treatments and the WM and WL conditions, with increases of 82.3% and 61.5%, respectively, compared to that in the CK treatment groups (p < 0.05). In the non-rhizosphere soil, the FL values were the highest for all conditions, showing increases of 32.4% and 60.0% compared to that in the CK group (p < 0.05). Under the WH treatment, the available N content in the rhizosphere soil of S. purpurea was less affected by fertiliser intensity (Figure 3 (2)).

3.4. Changes in Urease Activity

The effects of different water and fertiliser treatments on the URE content of the tested herbaceous plants varied, with significant differences in the URE content of plants between the rhizosphere and non-rhizosphere soils (p < 0.05). Urease content was less affected by moisture than fertiliser treatment, as various changes in content occurred under different fertiliser conditions. The maximum URE contents for both plants were observed in the rhizosphere soil under the WLCK and WMCK treatments (Figure 4).
Specifically, in the rhizosphere and non-rhizosphere soils of P. crymophila, the FH values were highest under the WH treatment, whereas the highest FH values under the WL and WM treatments were observed under the CK treatment. With increasing fertiliser application, the URE content showed a decreasing trend (Figure 4 (1)). For S. purpurea, under the WH treatment, the FM values in the rhizosphere soil were 14.8% higher than those in the CK group (p < 0.05), whereas in both the rhizosphere and non-rhizosphere soils, under the WM treatment, the highest URE activity in S. purpurea occurred under the CK treatment (Figure 4 (2)). For both P. crymophila and S. purpurea, the URE content in non-rhizosphere soils showed low sensitivity to fertilisers across all water treatments (Figure 4).

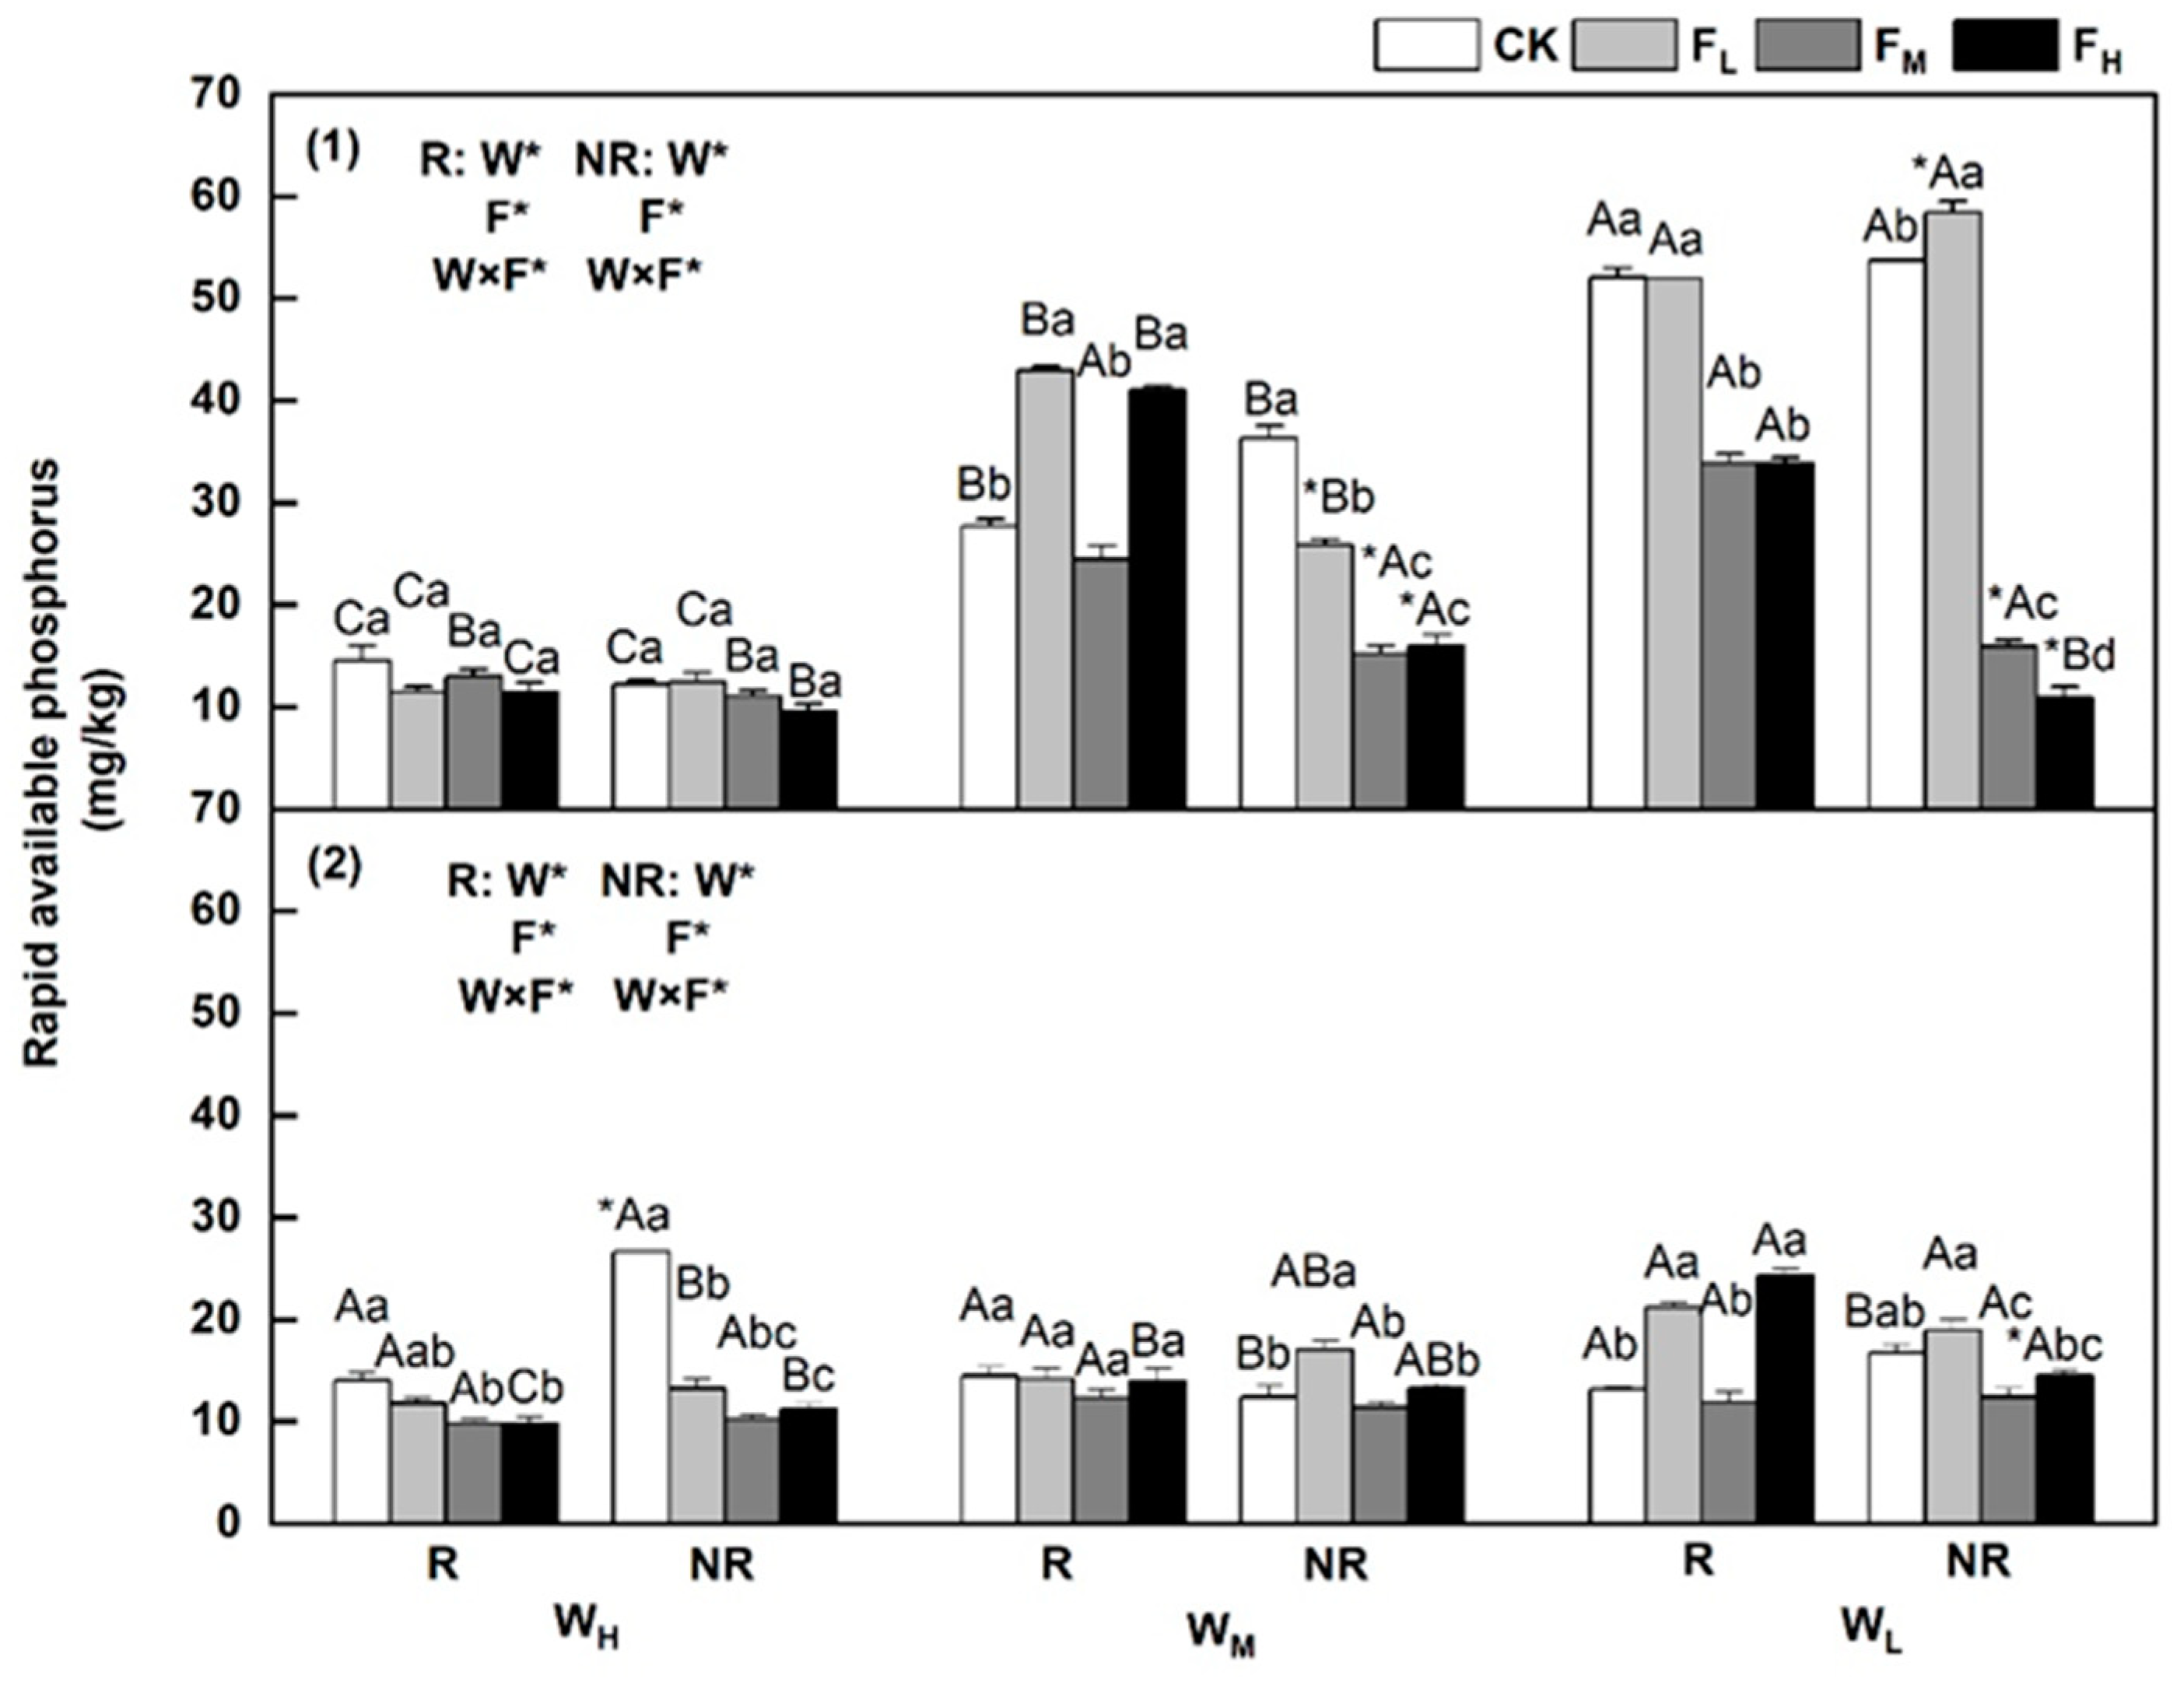
3.5. Changes in Rapidly Available Phosphorus Content

The impacts of different water and fertiliser treatments on the RAP content of the tested herbaceous plants varied, with significant differences between the rhizosphere and non-rhizosphere soils (p < 0.05). The available P content of both plants generally increased with decreasing moisture, and varying sensitivities were observed under different fertiliser conditions. The maximum values for both plants were observed in the non-rhizosphere soil under the WLFL and WHCK treatments.
Specifically, under the WH treatment, the RAP content in both the rhizosphere and non-rhizosphere soils for both plants was the highest under the CK treatment. The differences in RAP content between the various fertiliser treatments were not significant for P. crymophila, whereas for S. purpurea, the FM values were the lowest among all the groups and were 43.5% and 161.3% lower than the CK values, respectively (p < 0.05). For P. crymophila, under the WL treatment in the non-rhizosphere soil and under the WM treatment in the rhizosphere soil, along with S. purpurea under the WM and WL treatments in non-rhizosphere soils, the RAP content was the highest under the FL treatment (55.2%, 8.8%, 37.5%, and 13.3% higher than that of the CK group, respectively (p < 0.05)). Under the WM treatment for P. crymophila in the non-rhizosphere soil and the WM treatment in the rhizosphere soil, RAP content showed a decreasing trend with increasing fertiliser application, with FM values that were 138.0% and 53.8% lower than the CK values, respectively (p < 0.05). The influence of fertiliser intensity on the RAP content in the rhizosphere soil of S. purpurea under the WM treatment was not significant, whereas under the WL treatment, the FH values were the highest, showing an 84.5% increase compared with the CK values (p < 0.05) (Figure 5).

3.6. Changes in Alkaline Phosphatase

The impact of different water and fertiliser treatments on the ALP content of the tested herbaceous plants varied, with significant differences between rhizosphere and non-rhizosphere soils (p < 0.05). The ALP activity of P. crymophila increased with decreasing moisture, whereas S. purpurea was less affected by moisture. Varying changes in ALP activity were observed under different fertiliser conditions. The maximum values for both plant species were observed in the non-rhizosphere and rhizosphere soils under the WLFL treatment (Figure 6).
Specifically, for P. crymophila, ALP activity in both the rhizosphere and non-rhizosphere soils under the WM and WL treatments showed a trend of increasing and then decreasing with increasing fertiliser application, with FL resulting in the highest ALP activity in all cases. Only the rhizosphere soil under the WL treatment exhibited significantly increased ALP activity, showing a 35.6% increase compared to that in the CK treatment. Under the WH treatment, ALP activity in both the rhizosphere and non-rhizosphere soils was the lowest under the FL and FH treatments, being 43.8% and 42.2% lower than that of the CK treatment, respectively (p < 0.05) (Figure 6 (1)). For S. purpurea, ALP activity in the non-rhizosphere soil decreased with increasing fertiliser application under the WH treatment, showing a 125.6% decrease compared to that in the CK treatment (p < 0.05). Under the WM treatment, ALP activity in both the rhizosphere and non-rhizosphere soils showed a trend of increasing and then decreasing with increasing fertiliser application, with the highest phosphatase activity under FL in both cases, showing 62.2% and 22.9% increases compared to that in the CK treatment group, respectively (p < 0.05). Alkaline phosphatase activity in the rhizosphere soil under the WH treatment and in the rhizosphere and non-rhizosphere soils under the WL treatment showed no significant changes with different fertiliser intensities (Figure 6 (2)).

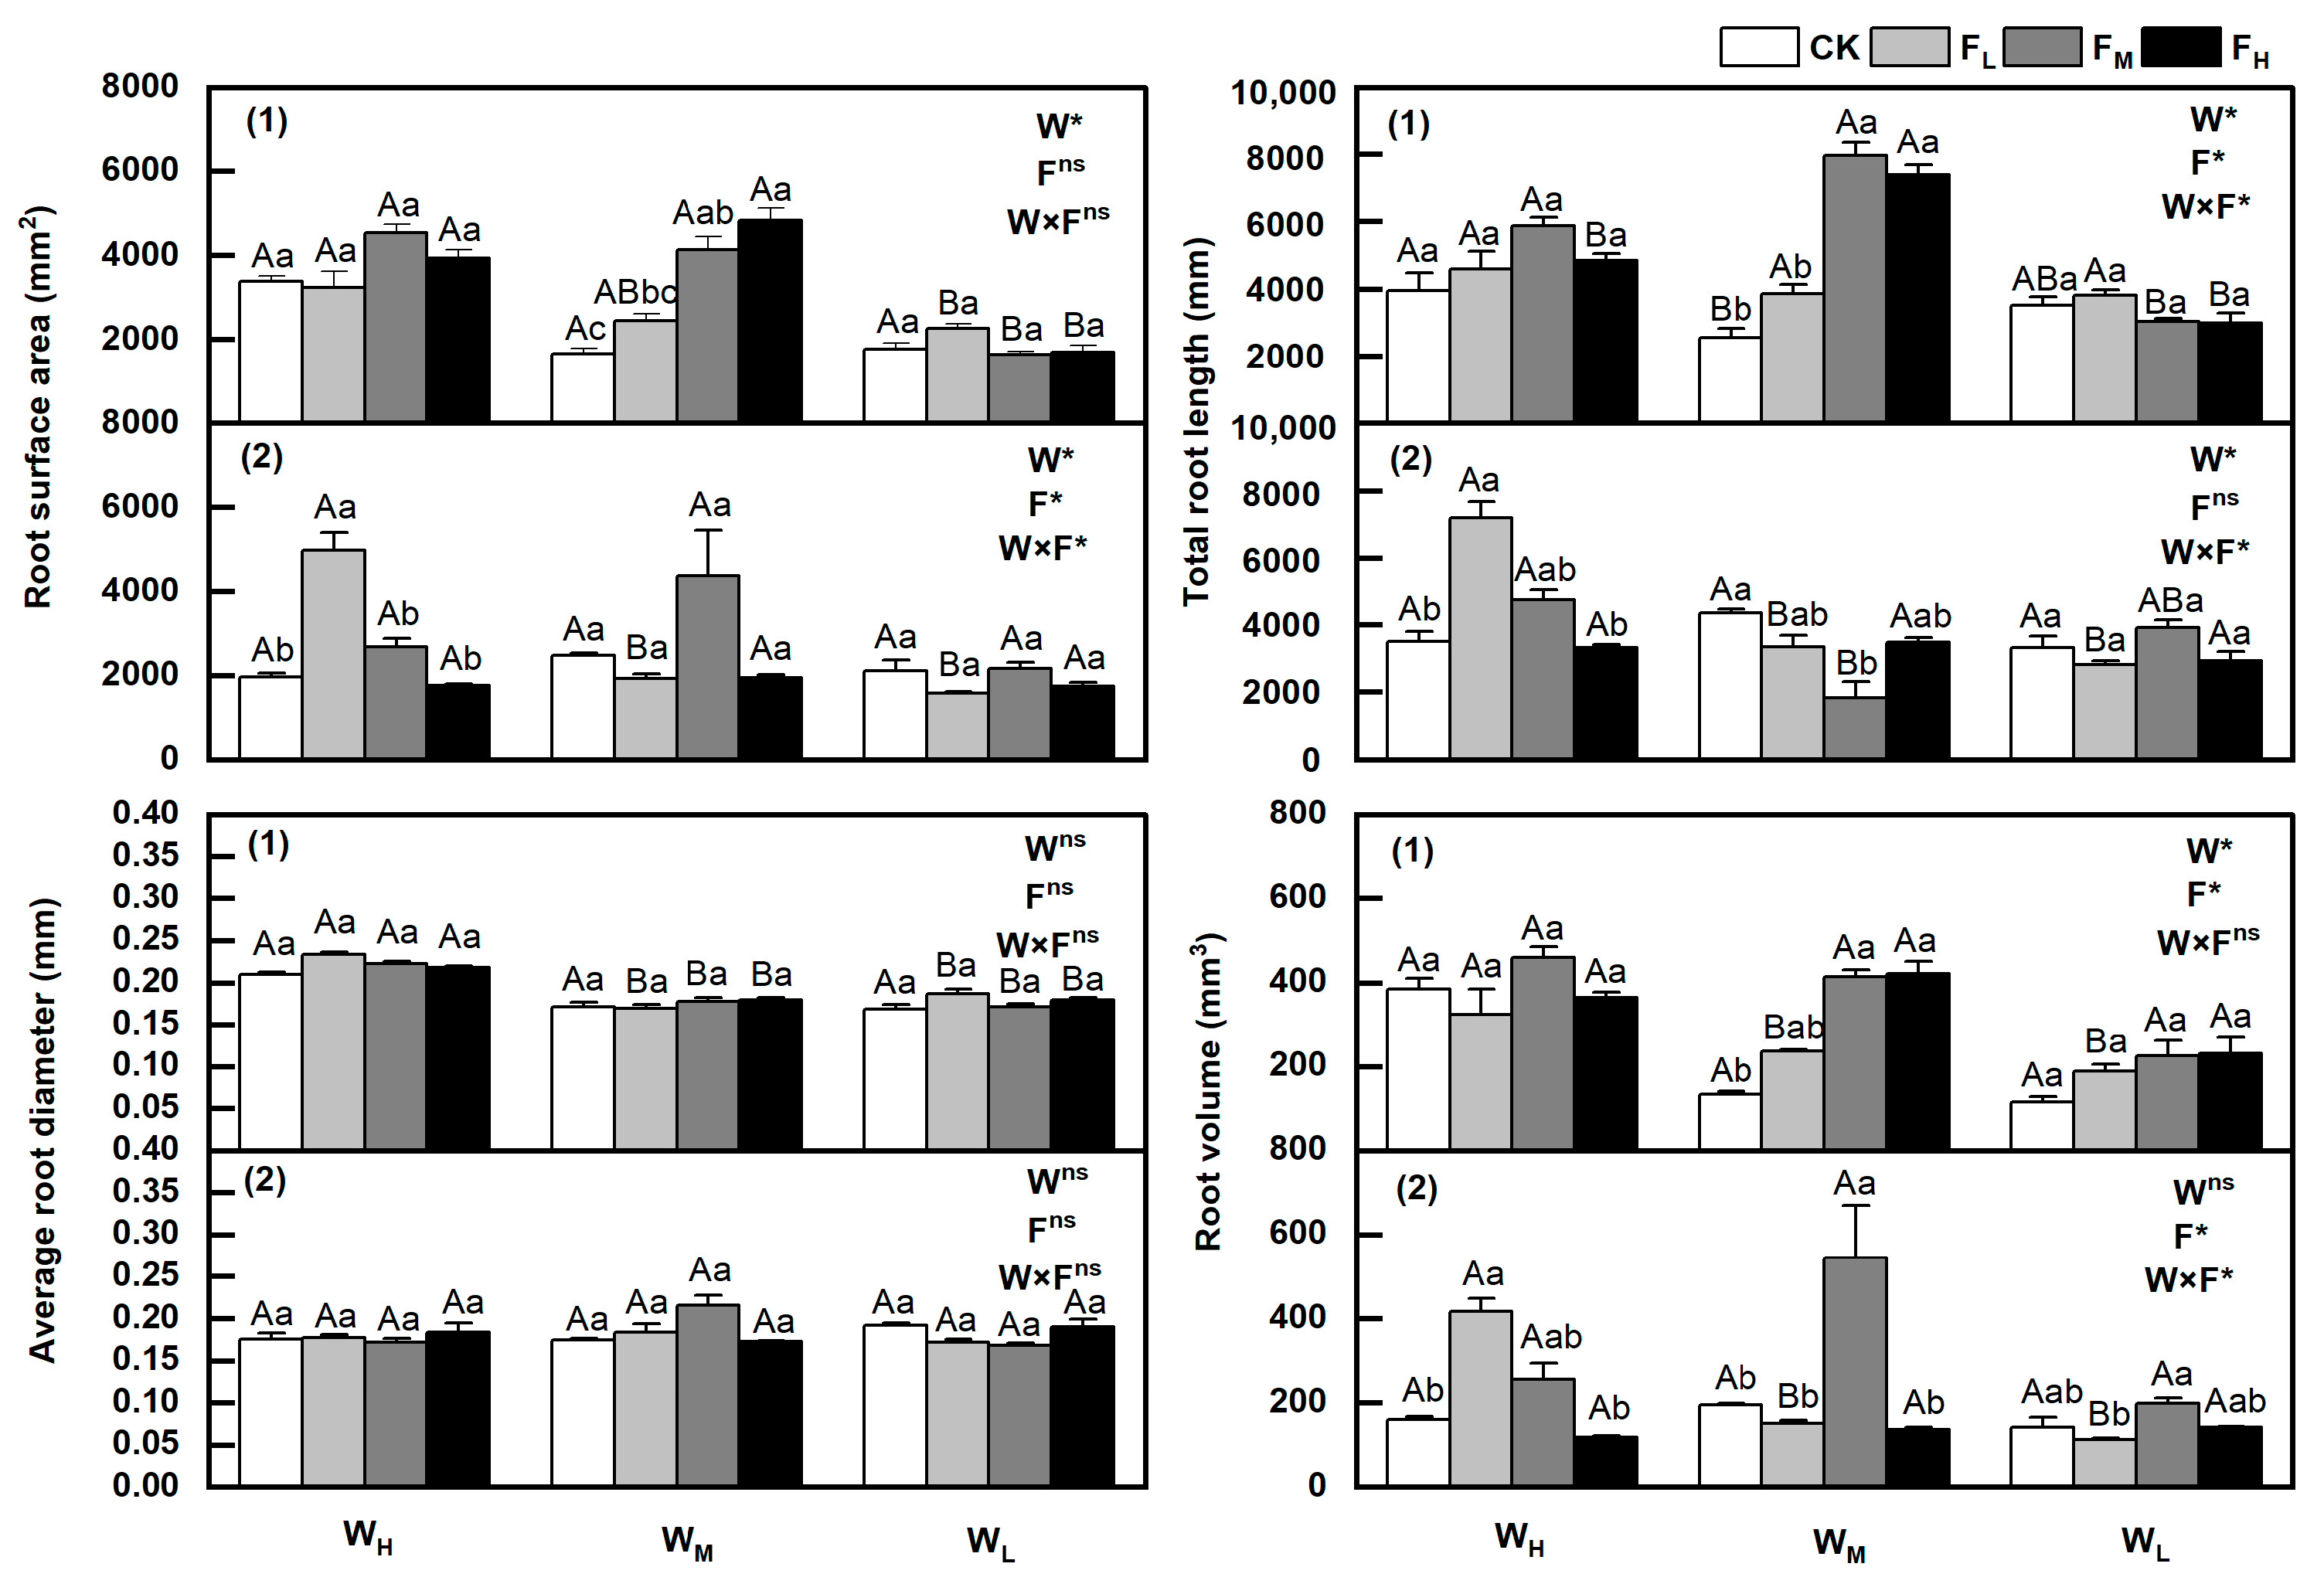
3.7. Changes in Root Characteristics

The root characteristics of the two herbaceous plants differed under the various water and fertiliser treatments (p < 0.05). Root surface area, length, and volume generally decreased with increasing water stress, with varying sensitivities under different fertiliser conditions. The average root diameter of both plants was not significantly influenced by the different water and fertiliser treatments (Figure 7).
For P. crymophila, root surface area, root length, and root volume exhibited a decreasing trend with increasing water stress in all treatments except FH, where they showed an initial increase followed by a decrease. Under the WH treatment, all three parameters were highest under FM, but the differences were not significant. Under the WL treatment, the influence of fertiliser intensity was minimal, with differences only present under WM. The root surface area and root volume increased with fertiliser application under WM, with their values under FH being 191.8% and 215.8% higher than those of CK, respectively (p < 0.05). Root length was highest under FM and WM and was 213.0% higher than that in the CK group (p < 0.05) (Figure 7 (1)).
For S. purpurea, the root surface area, root length, and root volume only decreased with increasing water stress under FL, with minimal influence by water under the other treatments. Under the WH treatment, all three parameters showed an initial increase followed by a decrease with increasing fertiliser intensity, with FL producing the highest root surface area, root length, and root volume, showing increases of 155.1%, 105.7%, and 160.0%, respectively, compared to those in the CK group (p < 0.05). The root surface area and root length showed little difference under different fertiliser intensities under WM and WL, with root length being significantly lower under FM in WM, decreasing by 136.3% compared to that in the CK group (p < 0.05). The root volume was highest under FM in WM, which was 179.5% higher than in CK (p < 0.05) (Figure 7 (2)).
The maximum values for the root characteristics of P. crymophila occurred in WMFH, WMFM, WHFL, and WHFM. For S. purpurea, the maximum values for root surface area and root length were both observed under the WHFL treatment, whereas the maximum values for average root diameter and root volume were observed under the WMFM (Figure 7).

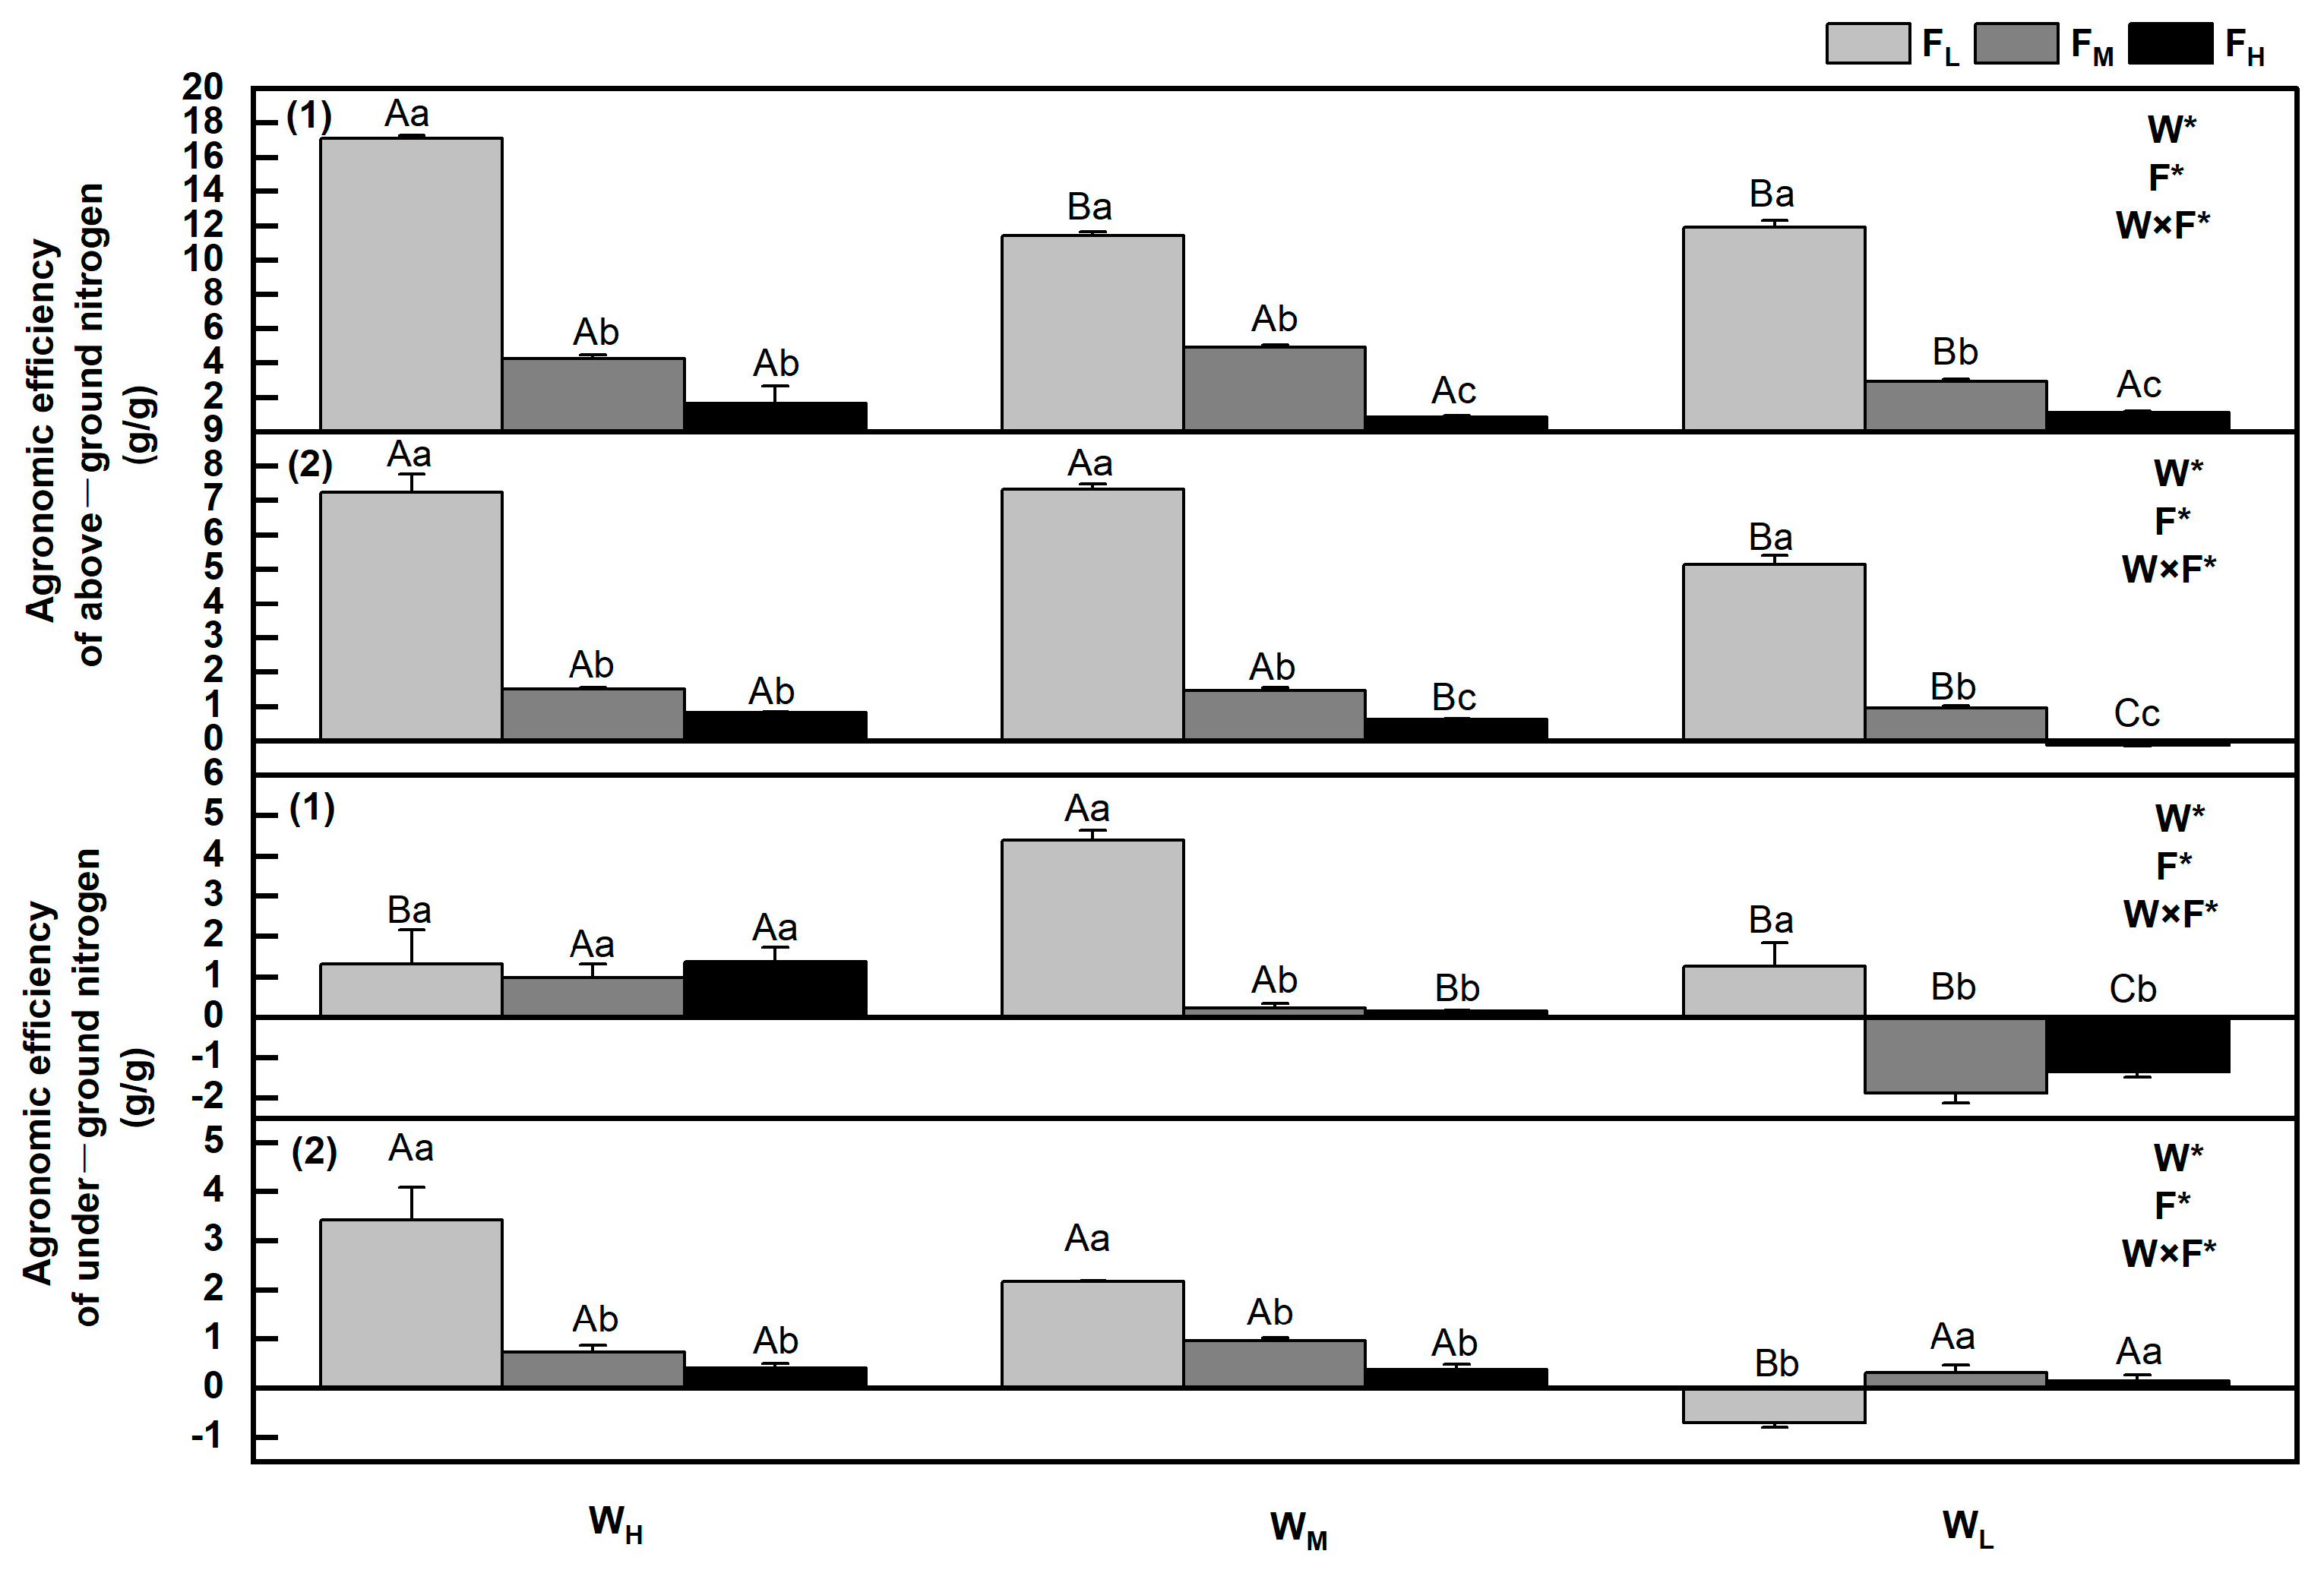
3.8. Changes in Agronomic Efficiency of Underground Nitrogen

The agronomic efficiency of the two tested plants differed under the various water and fertiliser treatments (p < 0.05). Overall, the aboveground agronomic efficiency of both plant species decreased with increasing water stress and fertiliser intensity. Comparing FH to FL, the reduction ranged from 9.3 to 12.4 times for one plant and from 7.8 to 10.6 times for the other. The maximum agronomic efficiency values occurred under the WHFL and WMF treatments, reaching 17.07 and 7.31, respectively. Under WLFH for one of the plants, the aboveground agronomic efficiency was negative.
For P. crymophila under FM and FH and S. purpurea under FL and FH, the underground agronomic efficiency decreased with increasing water stress. However, for the other fertiliser treatments in both plants, there was an initial increase followed by a decrease with decreasing water availability. Under WM for P. crymophila and WH and WM for S. purpurea, the FL values were 28.1 times, 7.7 times, and 5.4 times higher than those under FH, respectively. The maximum agronomic efficiency values occurred under the WMFL and WHFL treatments, reaching 7.34 and 3.41, respectively. Under WLFM and WLFH for P. crymophila and WLFL for S. purpurea, the underground agronomic efficiency was negative (Figure 8).

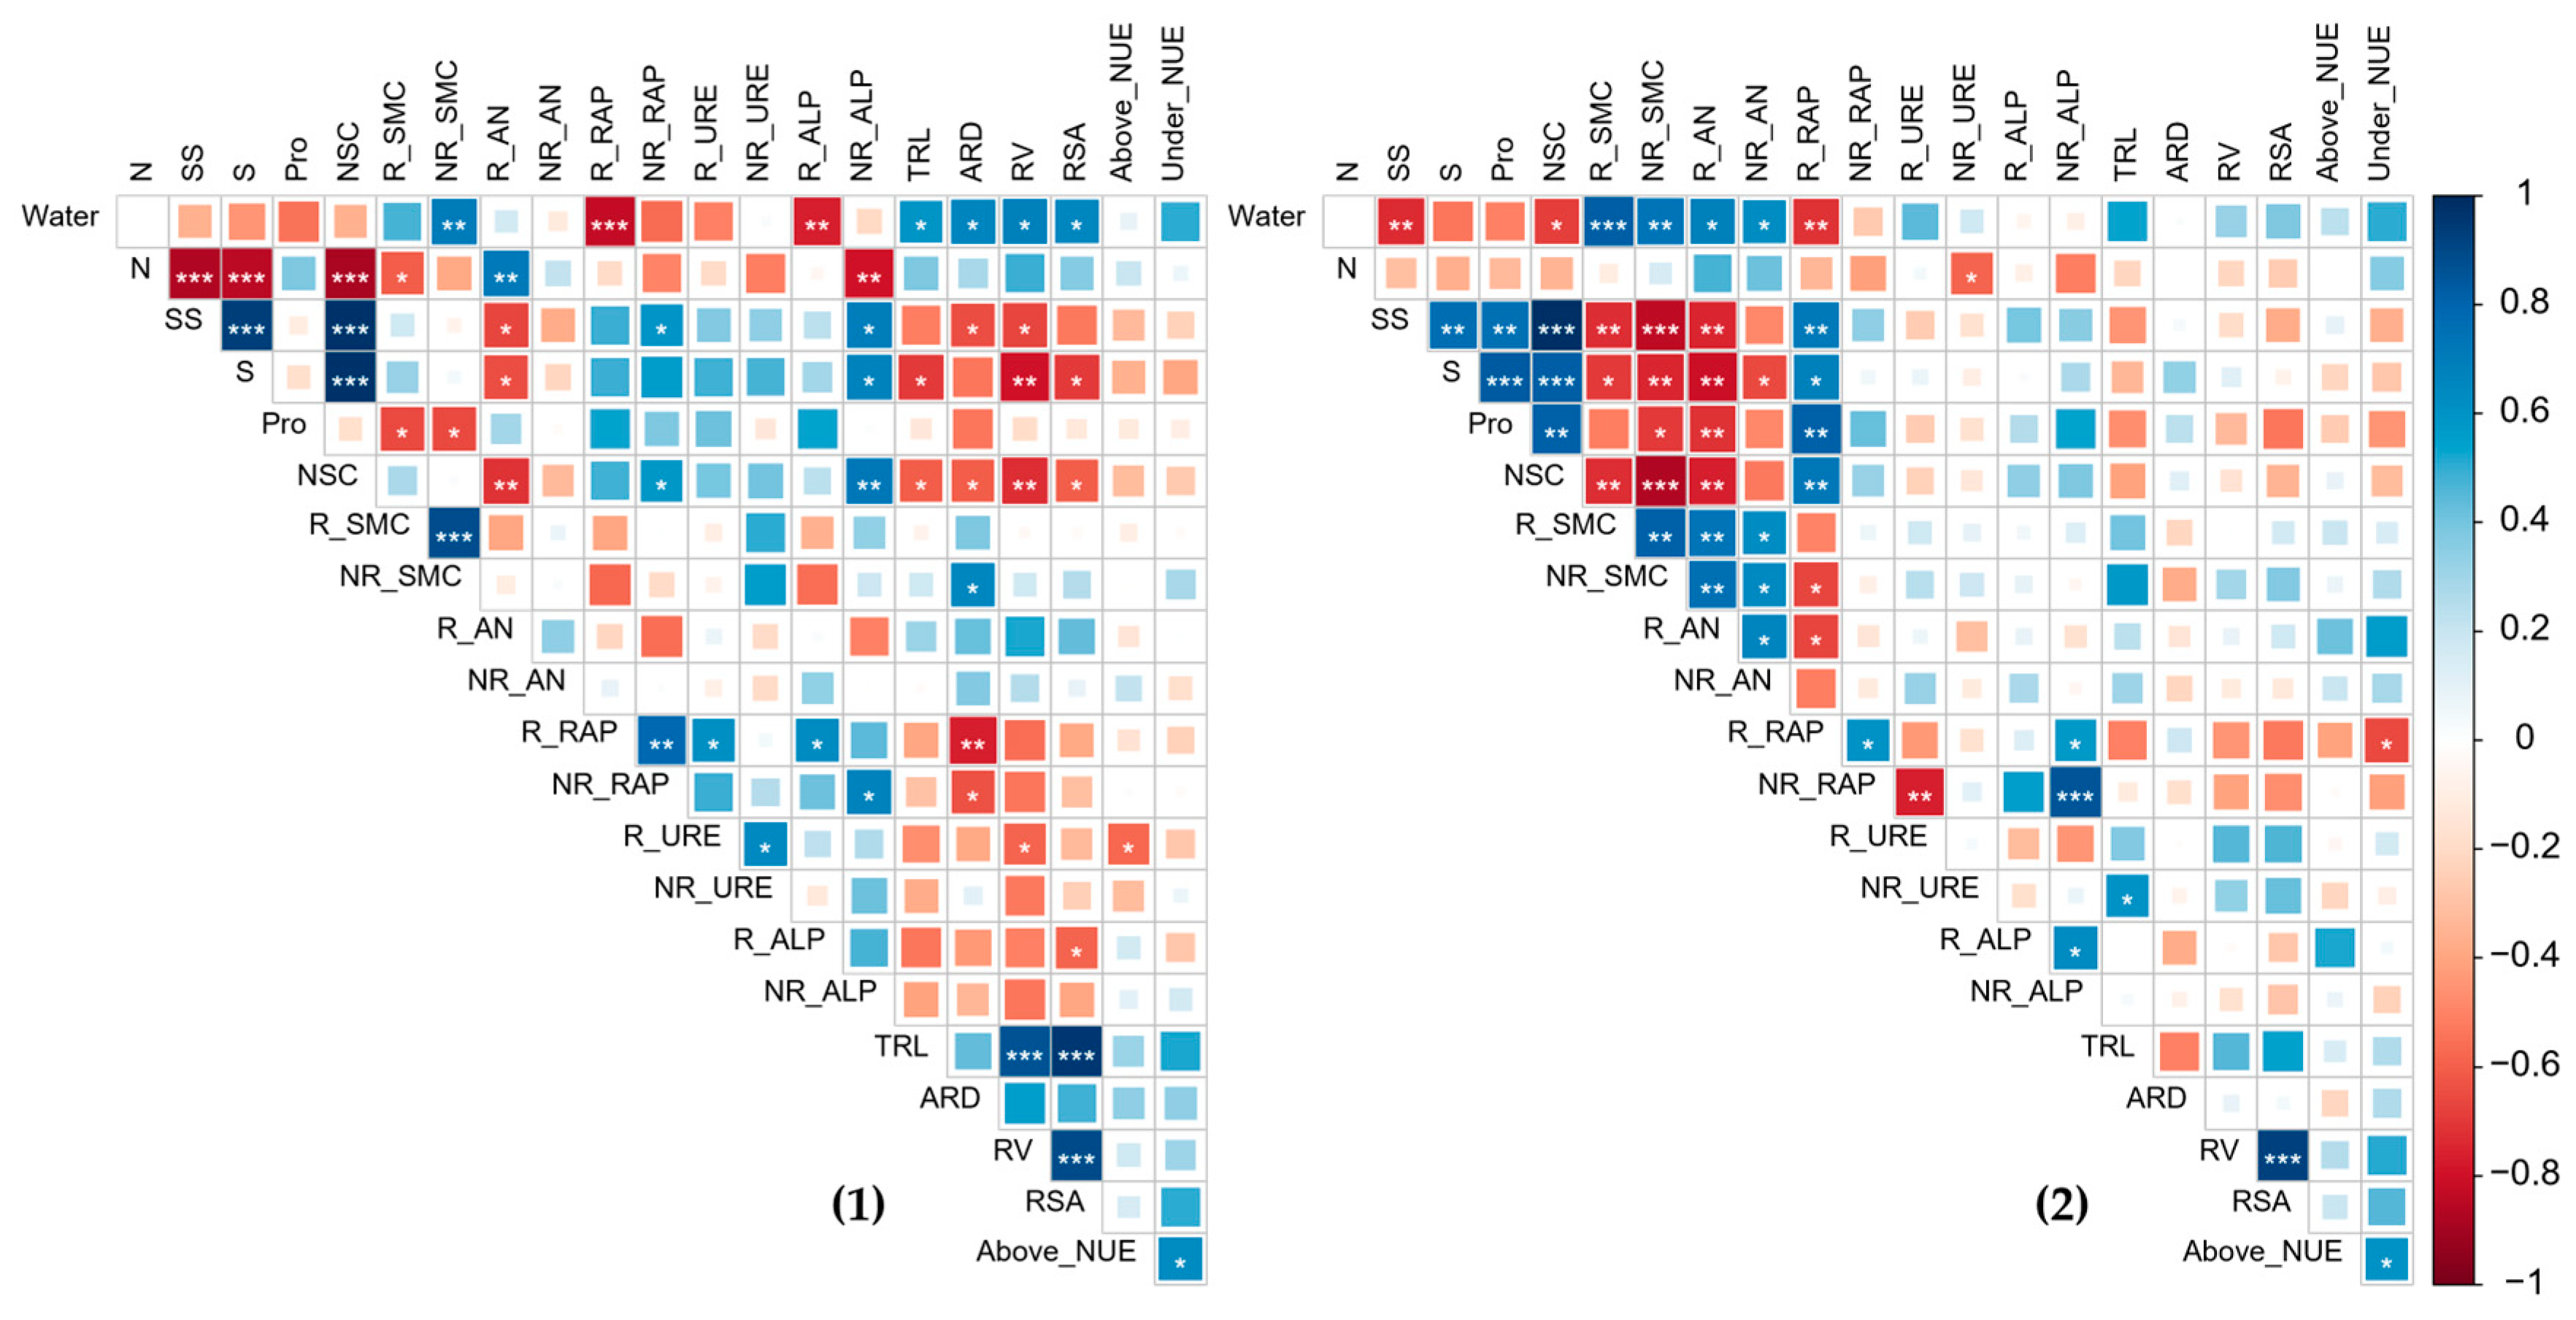
3.9. Nutrient Supply–Demand Relationship and Its Correlation with Physiological Resistance

For P. crymophila, increasing water treatment was positively correlated with the total length, average diameter, volume, and surface area of the root system (p < 0.05). Increasing nitrogen treatment was negatively correlated with drought resistance physiological indicators (soluble sugar, starch, and nonstructural carbohydrate content) (p < 0.001), soil water content (p < 0.05), and ALP activity in the non-rhizosphere soil (p < 0.01). There was a positive correlation between RAP and ALP levels (p < 0.05) (Figure 9 (1)). For S. purpurea, the water treatment was negatively correlated with soluble sugars, RAP content in the rhizosphere soil (p < 0.01), and nonstructural carbohydrate content (p < 0.05). N treatment was negatively correlated with URE level (p < 0.05) (Figure 9 (2)).

4. Discussion

4.1. The Effects of Different Water and Fertiliser Conditions on the Physiological Regulation of Two Plant Species

When plants are under drought stress, their cells actively accumulate soluble solutes, such as nonstructural carbohydrates and proline, to reduce their osmotic potential, ensure normal water supply under adverse conditions, and maintain normal physiological cellular functions, which increase with the aggravation of drought stress [26]. Our study found that P. crymophila also conformed to this rule, most notably in the leaves and stems, but with little overall change in the plant.
The proline content in the leaves and stems of P. crymophila increased with the increase in fertiliser application; however, the overall proline content of the plant was not significantly affected by changes in fertiliser application. This indicates that after the application of N fertiliser, the accumulation of proline in P. crymophila mainly occurred in the leaves and stems, thereby increasing the permeability of cells in the leaves and stems to water, causing an increase in the concentration of cell sap, a decrease in water potential, and an enhancement in water retention capacity, thus maintaining a balance with the environment to improve the damage caused by adverse stress to the plant. The contents of nonstructural carbohydrates, soluble sugars, and starch decreased with an increase in fertiliser, which may have been due to the increase in N content promoting the transfer of nonstructural carbohydrates from the leaves and stems to the storage organs for morphogenesis, leading to a decrease in the contents of soluble sugars, starch, and nonstructural carbohydrates. The results are similar to those reported by Li et al. [27]. A decrease in N content inhibited the transfer of NSC components to the storage organs [28]. The contents of proline, soluble sugars, starch, and nonstructural carbohydrates in the leaves and stems of S. purpurea were not affected significantly by different water and fertiliser treatments, possibly because of the long-term evolutionary processes of S. purpurea that have enhanced its adaptability and resistance to the harsh environment of alpine grasslands, reducing the impact of changes in water and fertiliser on proline content [29]. In the early stages of planting, the accumulation of soluble sugars for the alleviation of stress and promote plant growth rather than for storage is a priority, thus enhancing resistance [30].
S. purpurea maintains higher proline content in the roots than in the leaves and stems to regulate the growth and development of the roots and ensure sufficient water and nutrient supply for plant growth [5]. In P. crymophila, the proline content in the leaves and stems was greater than that in the roots, possibly because of the influence of light intensity in high-altitude areas, where aboveground growth is restricted, leading to rapid changes in the plant’s internal adaptation; the accumulation of proline alters the plant’s osmotic regulation to adapt to stressful environments [31]. The soluble sugar content in the leaves and stems of both plants was much greater than in the roots, possibly because in the early stages of planting, the growth and maintenance of the roots require amounts of high energy [32], and the starch content in the stems was much greater than in the leaves and roots. According to the principle of the near distribution of C compounds from C sources to sinks, stems are located between the leaves and roots, with storage and transport functions, and starch is obtained first for growth and storage [33]. This indicates that when faced with different external environments, the distribution strategies of soluble sugars and starch in the different components of the two plants are similar, whereas their strategies for proline accumulation differ.

4.2. Impacts of Different Water and Fertiliser Conditions on Nitrogen and Phosphorus Release

In both rhizospheric and non-rhizospheric soils, the mineralised N content decreased with decreasing water content, whereas URE activity was less affected by water content. This may have been due to the leaching effect of water on N, resulting in a positive correlation between soil mineralised N content and water content [34]. Soil moisture levels influence the release of mineralised N and inhibit root development, the effectiveness of organic matter, and diffusion transport, thereby affecting URE activity.
In the rhizosphere soils of P. crymophila and S. purpurea, the available P content increased with decreasing water content. The ALP activity of P. crymophila increased with decreasing water content, whereas that of S. purpurea was less affected by water content. The difference may be attributed to the formation of complexes between organic acid anions in root exudates and Fe3+ or Al3+ in iron or aluminium phosphate, resulting in the release of available P in the plant into the soil and increasing the P content [35]. To some extent, an increase in the available P content enhanced the ALP activity of P. crymophila [36]. The lesser change in ALP activity in S. purpurea may have been due to differences in root conditions, types, and quantities of root exudates between different species, indicating that S. purpurea exhibits stronger drought resistance than P. crymophila and that P cycling is not affected by different moisture conditions [37]. P. crymophila showed a positive correlation between the available P and ALP levels.
In the rhizospheric soil of P. crymophila and S. purpurea, the mineralised N content and URE activity were highest under WH conditions and lowest under FH conditions, whereas the available P content and ALP activity were the lowest under these conditions. This could be due to improved water conditions enhancing the dissolution and mineralisation rate of organic N, increasing the content of mineralised N in the soil, thereby enhancing N metabolic enzyme activity and providing more N to the plants, leading to increased accumulation of nitrate in the plant [38]. However, excessive N levels inhibit soil phosphatase activity, reduce the mineralisation of organic P, and decrease available P content and ALP activity in the soil [39]. Fertilisation promoted the release of mineralised N in both rhizospheric and non-rhizospheric soils under WM and WL conditions, but inhibited URE activity. The contents of available P and ALP were the highest under FL conditions, possibly because under water-deficient conditions, N inhibits URE activity but increases soil N content, improving the utilisation efficiency of soil moisture, resulting in a compensatory effect and increasing the content of mineralised N in the soil [40]. However, plants cannot fully utilise high levels of N, leading to a decrease in N fertiliser utilisation efficiency, soil acidification due to excessive N in the soil, increased diffusion of phosphate ions, increased P availability in the soil, promotion of plant P absorption, and a decrease in the content of available P and ALP.

4.3. Effects of Different Water and Fertiliser Conditions on the Root Characteristics of Tested Plants

The root surface area, length, and volume of P. crymophila and S. purpurea decreased with increasing water stress levels. This could be attributed to the high altitude and intense light on the Qinghai–Tibet Plateau, leading to increased water evaporation and, consequently, water scarcity in the soil. This scarcity restricts water uptake by the roots, reduces the transport of photosynthetic products to the roots, and increases mechanical impedance because of the cold environment, thereby limiting root growth and development [41].
Under low fertilisation (FL) and WH conditions, S. purpurea exhibited significant increases in root surface area, length, and volume, which were achieved by enhancing the root absorption area and capacity. Conversely, P. crymophila required moderate fertilisation (FM), indicating that the roots of the two plants have different nutrient requirements. Although high N application under WH conditions led to good solubility, S. purpurea required relatively less N than P. crymophila. Excessive N may acidify the soil, potentially inhibiting the respiratory function of S. purpurea roots and limiting their growth [42]. Under WL conditions, the root characteristics of both plants showed little response to changes in fertilisation. However, moderate fertilisation (FM) promoted growth under moderate water conditions significantly. This suggests that under water-deficient conditions, nutrients are less soluble, making nutrient uptake more challenging and resulting in minimal changes in root growth and development. As water conditions improve, moderate fertilisation increases soil nutrient content, enhances soil water retention and supply capacity, and allows for better nutrient solubility and migration, thereby improving root respiration and nutrient absorption and promoting robust root development [43].
In the correlation analysis, the root characteristics of P. crymophila were positively correlated with water content, whereas the root characteristics of S. purpurea showed no significant correlation. Additionally, there was no significant correlation between the root systems of the two plants and N application. This could have been due to the insignificant influence of water and fertiliser on the average root diameter of both plants. When the soil water and fertiliser environments change, the roots of both plants primarily adapt by altering their length, volume, and surface area to suit the changing environment. Moreover, the two species exhibited distinct changes in root system type, length, and surface area. S. purpurea’s dense root system relies mainly on the absorption of water and nutrients by new lateral roots at the edge of the plant clumps, in contrast to the sparse root system of P. crymophila, which partially explains the differences in their responses to water and fertiliser [44].

4.4. Impacts of Different Water and Fertiliser Conditions on Nitrogen Fertiliser Utilisation Efficiency in the Tested Plants

The N fertiliser utilisation efficiencies of both the aboveground and underground parts of the two plants showed no significant correlation with water and N. However, the N fertiliser utilisation efficiency of both plants decreased with increasing water stress, showing a consistent pattern of changes in soil mineral N, root characteristics, and biomass. This suggests that water is a key limiting factor for the N fertiliser utilisation efficiency of these plants, although it does not directly affect it. Under different water treatments, both the N fertiliser utilisation efficiency and the biomass of the aboveground parts of P. crymophila and S. purpurea showed a decreasing trend when fertilisation increased [45]. This indicates that when the N supply is sufficient, these plants tend to allocate more N to the underground parts, possibly to ensure their survival in the extreme environment of the Qinghai–Tibet Plateau, and thus adopting a survival strategy that prioritises supplying the underground parts [46].
The underground N fertiliser utilisation efficiency of P. crymophila and S. purpurea decreased with increasing fertilisation under WM conditions. This could have been due to the limited influence of fertilisation on the root surface area, root length, and root volume of S. purpurea under WM conditions, leading to insignificant changes in underground biomass, whereas mineral N continued to increase, resulting in an excessive N supply in the soil and reduced underground N fertiliser utilisation. Conversely, the consistent decrease in the underground N fertiliser utilisation efficiency of P. crymophila with biomass suggests that N absorption and underground biomass growth were synchronous. Additionally, under WH conditions, the underground N fertiliser utilisation efficiency of S. purpurea decreased with increasing fertilisation, whereas P. crymophila showed no significant change. The decrease in underground N fertiliser utilisation by S. purpurea was attributed to the continuous increase in the mineral N supply in the soil, which exceeded a reasonable range. Furthermore, root development was restricted, preventing the complete absorption of N applied to the soil and leading to substantial N loss through denitrification, ammonia volatilisation, leaching, and other means [47]. The increase in soil N supply for P. crymophila increased the underground biomass, resulting in no significant change in underground N fertiliser utilisation. Therefore, studying the N utilisation efficiency and allocation mechanisms of these two plants under different water and fertiliser conditions is of great significance for optimising the species composition of artificial grassland ecosystems, guiding soil fertilisation in alpine grasslands, and improving the effectiveness of N resources.

5. Conclusions

The synergistic effects of water and fertiliser play an important role in regulating the growth of the dominant species P. crymophila and S. purpurea in alpine grasslands. The results indicate that under drought conditions, P. crymophila accumulated more proline and nonstructural carbohydrates in its leaves and stems, whereas fertilisation promoted proline accumulation and reduced the content of nonstructural carbohydrates. S. purpurea accumulated proline and nonstructural carbohydrates in its roots, leaves, and stems, but this was not impacted significantly by changes in water or fertiliser. Additionally, drought stress limited nutrient release and root growth in both plants, leading to decreased N fertiliser utilisation efficiency. Fertilisation increased soil mineral N content and URE activity while inhibiting P release. Under WH conditions, the application of FM increased the root length, surface area, and volume of P. crymophila, enhancing nutrient absorption, whereas S. purpurea required FL because of the differences in root nutrient demand, resulting in different underground N fertiliser utilisation efficiencies. Therefore, the release and utilisation of nutrients were the most effective under the WHFM treatment for P. crymophila and WHFM for S. purpurea (Figure 10). The differences in the nutrient and water interaction strategies of plants in alpine environments provide a reference for the effective scientific management of alpine grasslands and the restoration of degraded grasslands.

Author Contributions

X.W.: methodology, writing—original draft, formal analysis, writing—review and editing, and funding acquisition. P.W.: writing—original draft, formal analysis, writing—review, and editing. N.Z. and C.Z.: methodology and investigation, formal analysis, writing—review, and editing. S.H. and X.S.: formal analysis, writing—review, and editing. All authors have read and agreed to the published version of the manuscript.

Funding

This work was funded by the National Natural Science Foundation of China (42161012), the Science and Technology Major Project of the Tibetan Autonomous Region of China (XZ202201ZD0005G02), and the Projects of Science and Technology of Guizhou Province (QKHPTRC-GCC[2022]022-1).

Data Availability Statement

Data are not publicly available due to commercial restrictions.

Conflicts of Interest

The authors declare no conflicts of interest.

References

  1. Wu, G.L.; Ren, G.H.; Dong, Q.M.; Shi, J.J.; Wang, Y.L. Above- and belowground responses along a degradation gradient in an alpine grassland on the Qinghai–Tibetan Plateau. CLEAN–Soil Air Water 2014, 42, 319–323. [Google Scholar] [CrossRef]
  2. Li, S.X.; Wang, Z.H.; Malhi, S.; Li, S.Q.; Gao, Y.J.; Tian, X.H. Effects of nutrient and water management on crop production and nutrient and water use efficiency in dryland areas of China. Adv. Agron. 2009, 102, 223–265. [Google Scholar]
  3. Fang, X.M.; Li, Y.S.; Nie, J.; Wang, C.; Huang, K.H.; Zhang, Y.K.; Zhang, Y.L.; She, H.Z.; Liu, X.B.; Ruan, R.W.; et al. Effects of nitrogen fertiliser and planting density on leaf photosynthetic characteristics, agronomic traits, and grain yield in common buckwheat (Fagopyrum esculentum M.). Field Crops Res. 2018, 219, 160–168. [Google Scholar] [CrossRef]
  4. Farooq, M.; Wahid, A.; Kobayashin, N.; Fujita, D.; Basra, S.M.A. Plant drought stress: Effects, mechanisms, and management. Agron. Sustain. Dev. 2009, 29, 185–212. [Google Scholar] [CrossRef]
  5. Kumari, A.; Das, P.; Parida, A.K.; Agarwal, P.K. Proteomics, metabolomics, and ionomics perspectives of salinity tolerance in halophytes. Front. Plant Sci. 2015, 6, 537. [Google Scholar] [CrossRef] [PubMed]
  6. Krasensky, J.; Jonak, C. Drought, salt, and temperature stress-induced metabolic rearrangements and regulatory networks. J. Exp. Bot. 2012, 63, 1593–1608. [Google Scholar] [CrossRef] [PubMed]
  7. Li, Z.; Peng, Y.; Su, X.Y. The physiological responses of white clover to different leaf types under drought stress are associated with antioxidative enzyme protection and osmotic adjustment. Acta Prataculturae Sin. 2013, 22, 257–263. (In Chinese) [Google Scholar]
  8. Xiao, L.; Liu, G.B.; Li, P.; Xue, S. Responses of photosynthesis and nonstructural carbohydrates in Bothriochloa ischaemum to doubled CO2 concentration and drought stress. J. Plant Nutr. Fertil. 2017, 23, 389–397. (In Chinese) [Google Scholar]
  9. Wang, X.; Luo, W.T.; Yu, Q.; Yan, C.F.; Xu, Z.W.; Li, M.H.; Jiang, Y. Effects of nutrient addition on nitrogen, phosphorus, and nonstructural carbohydrate concentrations in the leaves of dominant plant species in a semiarid steppe. Chin. J. Ecol. 2014, 33, 1795–1802. (In Chinese) [Google Scholar]
  10. Cong, B.M.; Zhang, Y.X.; Wang, X.G.; Zhu, A.M.; Tian, Y.L.; Zhang, Q.X. Effects of nitrogen application on unstructured carbon and nitrogen in the leaves of Leymus chinensis in sandy land. Grassl. Turf. 2019, 39, 50–55. (In Chinese) [Google Scholar]
  11. Monreal, C.M.; Bergström, D.W. Soil enzymatic factors expressing the influence of land use, tillage system, and soil texture on soil biochemical quality. Can. J. Soil Sci. 2000, 80, 419–428. [Google Scholar] [CrossRef]
  12. Wang, Q.K.; Wang, S.L.; Liu, Y. Responses to N and P fertilisation in a young Eucalyptus dunnii plantation: Microbial properties, enzyme activities, and dissolved organic matter. Appl. Soil. Ecol. 2008, 40, 484–490. [Google Scholar] [CrossRef]
  13. Wang, B.S.; Wang, Y.; Sun, Y.; Yu, L.R.; Lou, Y.S.; Fan, X.R.; Ren, L.X.; Xu, G.H. Watermelon responds to organic fertilizer by enhancing root-associated acid phosphatase activity to improve organic phosphorus utilization. J. Plant Physiol. 2022, 279, 153838. [Google Scholar] [CrossRef]
  14. Kivlin, S.N.; Treseder, K.K. Soil extracellular enzyme activities correspond with abiotic factors more than fungal community composition. Biogeochemistry 2014, 117, 23–37. [Google Scholar] [CrossRef]
  15. Cregger, M.A.; Mcdowell, N.G.; Pangle, R.E.; Pockman, W.T.; Classen, A.T. Impact of precipitation change on nitrogen cycling in a semi-arid ecosystem. Funct. Ecol. 2015, 28, 1534–1544. [Google Scholar] [CrossRef]
  16. Li, C.H.; Jia, Z.J.; Tang, L.S.; Wu, Y.C.; Li, Y. Effect of model of fertilization on microbial abundance and enzyme activity in oasis farmland soil. Acta Pedol. Sin. 2012, 49, 567–574. (In Chinese) [Google Scholar]
  17. Sun, Y.N.; Li, Q.; Li, Y.K. The effect of nitrogen and phosphorus applications on soil enzyme activities in Qinghai-Tibetan alpine meadows. Acta Prataculturae Sin. 2016, 25, 18–26. (In Chinese) [Google Scholar]
  18. Zhang, G.N.; Chen, Z.H.; Zhang, A.M.; Chen, L.J.; Wu, Z.J. Nitrogen and phosphorus related hydrolytic enzyme activities influenced by N deposition under semi-arid grassland soil. Adv. Mater. Res. 2013, 726–731, 3847–3854. [Google Scholar] [CrossRef]
  19. Ludlow, M.M.; Muchow, R.C. A critical evaluation of traits for improving crop yields in water-limited environments. Adv. Agron. 1990, 43, 107–153. [Google Scholar]
  20. Rasse, D.P. Nitrogen deposition and atmospheric CO2 interactions on fine root dynamics in temperate forests: A theoretical model analysis. Glob. Chang. Biol. 2002, 8, 486–503. [Google Scholar] [CrossRef]
  21. Kuang, X.X.; Jiao, J.J. Review on climate change on the Tibetan Plateau during the last half century. J. Geophys. Res. Atmos. 2016, 121, 3979–4007. [Google Scholar] [CrossRef]
  22. Pornaro, C.; Dal Maso, M.; Macolino, S. Drought resistance and recovery of kentucky bluegrass (Poa Pratensis L.) cultivars under different nitrogen fertilisation rates. Agronomy 2021, 11, 1128. [Google Scholar] [CrossRef]
  23. Yang, D.; Ni, R.; Yang, S.; Yang, S.A.; Pu, Y.A.; Qian, M.; Yang, Y.Q.; Yang, Y.P. Functional Characterization of the Stipa purpurea P5CS gene under drought stress conditions. Int. J. Mol. Sci. 2021, 22, 9599. [Google Scholar] [CrossRef] [PubMed]
  24. Albaigés, J. Handbook of environmental analysis: Chemical pollutants in air, water, soil, and solid wastes. Int. J. Environ. Anal. Chem. 2017, 97, 1420. [Google Scholar] [CrossRef]
  25. Zhang, X. Crop Physiology Research Method; Chinese Agriculture Press: Beijing, China, 1992; pp. 201–202. [Google Scholar]
  26. Li, M.H.; Cherubini, P.; Dobbertin, M.; Arend, M.; Xiao, W.F.; Rigling, A. Responses of leaf nitrogen and mobile carbohydrates in different Quercus species/provenances to moderate climate changes. Plant Biol. 2013, 15, 177–184. [Google Scholar] [CrossRef]
  27. Li, W.; Hartmann, H.; Adams, H.D.; Zhang, H.; Jin, C.; Zhao, C.; Guan, D.; Wang, A.; Yuan, F.; Wu, J. The sweet side of global change–dynamic responses of non-structural carbohydrates to drought, elevated CO2 and nitrogen fertilization in tree species. Tree Physiol. 2018, 38, 1706–1723. [Google Scholar] [CrossRef]
  28. Zhang, W.T.; Li, S.; Li, Y.; Bai, Y.M.; Ma, J. Effects of nitrogen addition and precipitation change on non-structural carbohydrates in Reaumuria soongorica seedlings. Chin. J. Ecol. 2020, 39, 803–811. (In Chinese) [Google Scholar]
  29. Qian, Y.S.; Zhu, J.M.; Wu, J.B.; Zhang, X.Q.; Chai, M.L. Effects of fertilizing on manilagrass growth and physiological characteristics. Acta Partaculturae Sin. 2012, 21, 234–241. (In Chinese) [Google Scholar]
  30. Turner, L.B.; Humphreys, M.O.; Cairns, A.J.; Pollock, C.J. Carbon assimilation and partitioning into non-structural carbohydrate in contrasting varieties of Lolium perenne. Plant Physiol. 2002, 159, 257–263. [Google Scholar] [CrossRef]
  31. Cui, G.; Li, B.; He, W.H.; Yin, X.J.; Liu, S.Y.; Lian, L.; Zhang, Y.L.; Liang, W.X.; Zhang, P. Physiological analysis of the effect of altitudinal gradients on Leymus secalinus on the Qinghai-Tibetan Plateau. PLoS ONE 2018, 13, e0202881. [Google Scholar] [CrossRef]
  32. Zhou, G.Y.; Zhou, X.H.; Nie, Y.Y.; Bai, S.H.; Zhou, L.Y.; Shao, J.J.; Cheng, W.S.; Wang, J.W.; Hu, F.Q.; Fu, Y.L. Droughtinduced changes in root biomass largely result from altered root morphological traits: Evidence from a synthesis of global field trials. Plant Cell Environ. 2018, 41, 2589–2599. [Google Scholar] [CrossRef] [PubMed]
  33. Cofield, G.N.; Ruuska, S.A.; Aoki, N.; Lewis, D.C. Starch storage in the stems of wheat plants: Localization and temporal changes. Ann. Bot. 2009, 103, 859–868. [Google Scholar] [CrossRef] [PubMed]
  34. Wang, X.; Xu, Z.; Yan, C.; Luo, W.; Wang, R.; Han, X.; Li, M.H. Responses and sensitivity of N, P and mobile carbohydrates of dominant species to increased water, N and P availability in semi-arid grasslands in northern China. J. Plant Ecol. 2017, 10, 486–496. [Google Scholar] [CrossRef]
  35. Wang, Y.; Lambers, H. Root-released organic anions in response to low phosphorus availability: Recent progress, challenges and future perspectives. Plant Soil 2020, 447, 135–156. [Google Scholar] [CrossRef]
  36. Li, X.F.; Zhang, Y.; Ding, C.X.; Liu, Y.; Wu, K.X.; Jiang, F.Z.; Su, D.R. Water addition promotes vegetation recovery of degraded alpine meadows by regulating soil enzyme activity and nutrients in the Qinghai-Tibetan Plateau. Ecol. Eng. 2020, 158, 106047. [Google Scholar] [CrossRef]
  37. Song, F.B.; Han, X.Y.; Zhu, X.C.; Herbert, S.J. Response to water stress of soil enzymes and root exudates from drought and non-drought tolerant corn hybrids at different growth stages. Can. J. Soil Sci. 2012, 92, 501–507. [Google Scholar] [CrossRef]
  38. Liu, W.X.; Allson, S.D.; Xia, J.Y.; Liu, L.L.; Wan, S.Q. Precipitation regime drives warming responses of microbial biomass and activity in temperate steppe soils. Biol. Fertil. Soils 2016, 52, 469–477. [Google Scholar] [CrossRef]
  39. Chen, Z.K.; Khan, A.; Shi, X.J.; Hao, X.Z.; Tan, D.K.Y.; Luo, H.H. Water-nutrient management enhances root morpho-physiological functioning, phosphorus absorption, transportation and utilization of cotton in arid region. Ind. Crops Prod. 2020, 143, 111975. [Google Scholar] [CrossRef]
  40. Brueck, H. Effects of nitrogen supply on water-use efficiency of higher plants. J. Plant Nutr. Soil Sci. 2008, 171, 210–219. [Google Scholar] [CrossRef]
  41. Hoad, S.P.; Russell, G.; Lucas, M.E.; Bingham, I.J. The management of wheat, barley and oat root systems. Adv. Agron. 2001, 74, 193–246. [Google Scholar]
  42. Xue, Q.; Zhu, Z.; Musick, J.T.; Stewart, B.A.; Dusek, D.A. Root growth and water uptake in winter wheat under deficit irrigation. Plant Soil 2003, 257, 151–161. [Google Scholar] [CrossRef]
  43. Wang, H.; Yamauchi, A. Growth and function of roots under abiotic stress in soil. In Plant–Environment Interactions, 3rd ed.; Huang, B., Ed.; CRC Press: New York, NY, USA, 2006; pp. 271–320. [Google Scholar]
  44. Li, X.; Zeng, R.; Liao, H. Improving crop nutrient efficiency through root architecture modifications. J. Integr. Plant Biol. 2016, 58, 193–202. [Google Scholar] [CrossRef] [PubMed]
  45. Zhao, N.N.; Sun, X.R.; Hou, S.; Chen, G.H.; Zhang, H.; Han, Y.X.; Zhou, J.; Wang, X.T.; Zhang, Z.X. N Addition Mitigates Water Stress via Different Photosynthesis and Water Traits for Three Native Plant Species in the Qinghai–Tibet Plateau. Agriculture 2022, 12, 1873. [Google Scholar] [CrossRef]
  46. Wang, D.J.; Zhou, H.K.; Yao, B.Q.; Wang, W.Y.; Dong, S.K.; Shang, Z.H.; She, Y.D.; Ma, L.; Huang, X.T.; Zhang, Z.H.; et al. Effects of nutrient addition on degraded alpine grasslands of the Qinghai-Tibetan Plateau: A meta-analysis. Agric. Ecosyst. Environ. 2020, 301, 106970. [Google Scholar] [CrossRef]
  47. Wilkins, P.W.; Allen, D.K.; Mytton, L.R. Differences in the nitrogen use efficiency of perennial ryegrass varieties under simulated rotational grazing and their effects on nitrogen recovery and herbage nitrogen content. Grass Forage Sci. 2000, 55, 69–76. [Google Scholar] [CrossRef]
Figure 1. Changes in soluble sugars and starch content in two plant species under different water and fertiliser treatments. Numbers 1 and 2 in brackets indicate P. crymophila and S. purpurea, respectively. W; F; W × F indicate the effects of water and fertiliser, and their interaction results as determined by ANOVA (p < 0.05). Asterisks (*) indicate significant differences. The uppercase and lowercase letters represent differences in contents between the different water and fertiliser treatments.
Agronomy 14 00440 g001
Figure 2. Changes in proline and nonstructural carbohydrate content in two plant species under different water and fertiliser treatments. Numbers 1 and 2 in brackets indicate P. crymophila and S. purpurea, respectively. W; F; W × F indicate the effects of water and the fertiliser, and their interaction results determined by ANOVA are shown (p < 0.05). Asterisks (*) and “ns” indicate significant differences. The uppercase and lowercase letters represent the differences between the water and fertiliser treatments.
Agronomy 14 00440 g002
Figure 3. Changes in the available nitrogen contents of two tested plants under different water and fertiliser treatments. Notes: Numbers 1 and 2 in brackets indicate P. crymophila and S. purpurea, respectively. “R” and “NR” indicate rhizosphere and non-rhizosphere soils, respectively. W; F; W × F indicate the effects of different water and fertiliser treatments and their interaction results as determined by ANOVA (p < 0.05). Asterisks (*) and “ns” indicate significant differences. The uppercase and lowercase letters represent significant differences in contents between the water and fertiliser treatments. Asterisks before letters indicate significant differences between the rhizosphere and non-rhizosphere soils.
Agronomy 14 00440 g003
Figure 4. Changes in urease activity in two tested plants under different water and fertiliser treatments. Notes: Numbers 1 and 2 in brackets indicate P. crymophila and S. purpurea, respectively. “R” and “NR” indicate rhizosphere and non-rhizosphere soils, respectively. W; F; W × F indicate the effects of different water and fertiliser treatments and their interaction results determined by ANOVA (p < 0.05). Asterisks (*) and “ns” indicate significant differences. The uppercase and lowercase letters represent significant differences between the water and fertiliser treatments. Asterisks before letters indicate significant differences between the rhizosphere and non-rhizosphere soils.
Agronomy 14 00440 g004
Figure 5. Changes in rapidly available phosphorus content of two tested plants under different water and fertiliser treatments. Notes: Numbers 1 and 2 in brackets indicate P. crymophila and S. purpurea, respectively. “R” and “NR” indicate rhizosphere and non-rhizosphere soils, respectively. W; F; W × F indicate the effects of different water and fertiliser treatments and their interaction results determined by ANOVA (p < 0.05). Asterisks (*) indicate significant differences. The uppercase and lowercase letters represent the significant differences between the water and fertiliser treatments. Asterisks before letters indicate significant differences between the rhizosphere and non-rhizosphere soils.
Agronomy 14 00440 g005
Figure 6. Changes in alkaline phosphatase activity in two tested plants under different water and fertiliser treatments. Notes: Numbers 1 and 2 in brackets indicate P. crymophila and S. purpurea, respectively. “R” and “NR” indicate rhizosphere and non-rhizosphere soils, respectively. W; F; W × F indicate the effects of different water and fertiliser treatments and their interaction results determined by ANOVA (p < 0.05). Asterisks (*) and “ns” indicate significant differences. The uppercase and lowercase letters represent the differences between the water and fertiliser treatments. Asterisks before letters indicate significant differences between the rhizosphere and non-rhizosphere soils.
Agronomy 14 00440 g006
Figure 7. Changes in root characteristics of two tested plants under different water and fertiliser treatments. Notes: Numbers 1 and 2 in brackets indicate P. crymophila and S. purpurea, respectively. W; F; W × F indicate the effects of different water and fertiliser treatments and their interaction results determined by ANOVA (p < 0.05). Asterisks (*) and “ns” indicate significant differences. The uppercase and lowercase letters represent the differences between the water and fertiliser treatments.
Agronomy 14 00440 g007
Figure 8. Changes in the agronomic efficiency of two tested plants under different water and fertiliser treatments. Notes: Numbers 1 and 2 in brackets indicate P. crymophila and S. purpurea, respectively. W; F; W × F indicate the effects of different water and fertiliser treatments and their interaction results determined by ANOVA (p < 0.05). Asterisks (*) indicate significant differences. The uppercase and lowercase letters represent the differences between the water and fertiliser treatments.
Agronomy 14 00440 g008
Figure 9. The nutrient supply–demand relationship and its correlation with resistance physiology of two plant species under different water and fertiliser treatments. Notes: Numbers 1 and 2 in brackets indicate P. crymophila and S. purpurea. SS: soluble sugars; S: starch; Pro: proline; NSC: nonstructural carbohydrates; R: rhizosphere soil; NR: non-rhizosphere soil; SWC: soil moisture content; AN: alkaline dissolved nitrogen; RAP: rapidly available phosphorus; URE: urease; ALP: alkaline phosphatase; TRL: total root length; ARD: average root diameter; RV: root volume; RSA: root surface area; Above-NUE: agronomic efficiency of above-ground nitrogen; Under-NUE: agronomic efficiency of underground nitrogen.* p < 0.05; ** p < 0.01; *** p < 0.001.
Agronomy 14 00440 g009
Figure 10. The nutrient supply–demand relationship and resistance physiological response regulation of P. crymophila (left) and S. Purpurea (right). Notes: Blue represents the mechanism of P. crymophila and yellow represents the mechanism of S. purpurea. The red arrow represents the effect of water, the green arrow represents the effect of fertiliser, the upward arrow represents a positive influence, and the downward arrow represents a negative influence.
Agronomy 14 00440 g010
Disclaimer/Publisher’s Note: The statements, opinions and data contained in all publications are solely those of the individual author(s) and contributor(s) and not of MDPI and/or the editor(s). MDPI and/or the editor(s) disclaim responsibility for any injury to people or property resulting from any ideas, methods, instructions or products referred to in the content.

