
The Application of Biochar Enhances Soil Organic Carbon and Rice Yields


1
College of Resource and Environmental Science, Jilin Agricultural University, Changchun 130118, China
2
College of Agriculture, Jilin Agricultural Science and Technology University, Jilin 132101, China
*
Author to whom correspondence should be addressed.
Agronomy 2024, 14(3), 455; https://doi.org/10.3390/agronomy14030455
Submission received: 6 February 2024
/
Revised: 22 February 2024
/
Accepted: 23 February 2024
/
Published: 25 February 2024
(This article belongs to the Section Soil and Plant Nutrition)
Abstract
:The freezing winter temperatures in Northeast China hinder the breakdown speed of straw, making it challenging to implement widespread straw return in rice fields, meaning that crop remnants are not efficiently utilised. This study involved a pot experiment conducted on rice plants that were treated with varying quantities of biochar: CK (no biochar); BC1 (5 t ha−1); BC2 (10 t ha−1); and BC3 (20 t ha−1). An investigation was conducted to examine the impact of biochar on the soil organic carbon (SOC), humus (HS) composition, humic acid (HA) structure, and rice yield of paddy fields. The findings demonstrated that the use of biochar led to a substantial rise in SOC and HA-C concentrations in the soil layer between 20 and 40 cm. Additionally, biochar’s application enhanced soil humification. Notably, the treatment with BC3 (20 t ha−1) had the most pronounced impact. The O/C ratio in the HA and the relative strength of the peaks at 1620 cm−1 on the infrared spectra showed a more pronounced response to the BC3 treatment compared to the other biochar treatments. However, the application of the BC1 treatment at a rate of 5 t ha−1 and the BC2 treatment at a rate of 10 t ha−1 had a minimal impact on the fluorescence intensity of humic acid (HA). The application of the BC3 treatment increased the aromatic nature of the humic acid (HA) in paddy soil, leading to the formation of an intricate and enduring HA structure. Furthermore, the use of the BC3 treatment resulted in a notable enhancement in the quantity of spikes, spike weight, and number of grains per spike. Additionally, it positively impacted the accumulation of dry matter in the spike, leading to a substantial 13.7% increase in the rice yield. Applying biochar at a rate of 20 t ha−1 is a sensible and effective approach to enhance the soil organic carbon (SOC) content, enhance the stability of the humic acid (HA)’s structure, and raise the rice yield in the rice-growing area of Northeast China. This study’s findings will establish a theoretical foundation for utilising soil biochar in the rice fields located in Northeast China.
1. Introduction
Soil quality is damaged by the excessive cultivation of rice, resulting in a lack of soil organic carbon (SOC) [1]. However, excessive cultivation practices have led to a significant accumulation of crop residue that is not well utilised. This has resulted in severe consequences such as the greenhouse effect and environmental pollution [2]. The improper application of straw can have a negative impact on both the soil and the growth of crops [3]. Straw’s decomposition rate is notably diminished in the winter, particularly in the northeast of China, due to low temperatures. Hence, executing extensive straw returns in cold-water-saturated paddy fields poses significant challenges.
Producing biochar from agricultural wastes that are not fully utilised and using it as a soil enhancer is seen as an efficient approach to achieve sustainable agricultural development [4]. Biochar contains abundant oxygen-rich functional groups, such as carboxyl and hydroxyl groups, and exhibits exceptional stability. The application of biochar in agricultural production can increase plants’ nutrient uptake, increase the soil’s nutrient effectiveness, enhance microbial diversity and activity, reduce greenhouse gas emissions, and improve crop growth and productivity [5]. According to Devêvre and Horwáth, the introduction of biochar into soil can lead to different levels of increases in soil pH, SOC, and cation exchange [6]. Conversely, the utilisation of biomass charcoal enhances crop growth, boosts root secretions, strengthens the connection of organic cementitious materials, and enhances soil aggregate stability [7]. The enhanced stability of aggregates preserves soil moisture and enhances its porosity [8]. Research has demonstrated that varying quantities of biochar undoubtedly result in distinct effects on the paddy field environment, due to its unique physical and chemical characteristics [9]. The utilisation of 5–40 t ha−1 of biochar in a rice–wheat rotation system resulted in a substantial decrease in N2O emissions. The application of 20 t ha−1 of biochar had a significant effect on soil carbon sequestration in paddy fields [10]. Liu et al. found that applying 20 t ha−1 of biochar had a minimal impact on the N and P concentrations in the paddy field water environment [11]. However, it resulted in a 16.9% increase in the rice yield and a 10.1% reduction in N fertiliser utilisation. Hence, biochar has been widely employed to enhance soil fertility, augment food yields, and alleviate global climate change [12].
Soil humic acid (HA), fulvic acid (FA), and humin (HM) are important components of SOC [13]. According to Piccolo et al., these components represent the most stable and microbially resistant components of organic carbon [14]. Due to their stability in the soil, they play a crucial role in the sequestration and stabilization of SOC [15]. The stabilization and sequestration of SOC are mainly regulated by HA’s structural characteristics, which are influenced by the application of organic materials [16] and tillage practices [17]. Studies have shown that the application of straw and biochar to soil can change the soil’s humic acid structure [18]. The application of different amounts of biochar affected the humus fractions and black soil’s humic acid (HA) structure [19]. Liu et al. indicated that biochar’s application increased the degree of HA condensation, decreased the degree of HA oxidation, and enhanced the aromatic nature of HA [20].
The progress and Industrialization of straw biochar pyrolysis and carbonisation technologies necessitate a thorough investigation and prudent utilisation of straw biochar to achieve efficient, eco-friendly, and sustainable agricultural development. Despite the positive impacts of biochar’s application on soil carbon sequestration and soil quality, there are knowledge gaps on (1) the management options for biochar in terms of the quantity and type of application used and (2) how the mechanisms of biochar’s impacts on the humic substance of rice soils can contribute to solving environmental problems and promoting sustainable agriculture. In order to address these aforementioned gaps, this study conducted a rice pot experiment by applying varying quantities of biochar to plants. The primary goals were to (1) examine the impact of biochar’s application on SOC and humic substances’ composition; (2) analyse the alterations in HA’s structure following biochar’s application; (3) assess the influence of biochar on rice production; and (4) establish the appropriate application rate of biochar. This study’s findings will establish a theoretical foundation for utilising biochar in rice soils located in Northeast China.
2. Materials and Methods
2.1. Study Site
The experiment took place between 1 April and 25 October 2022, in the rice growing area of the Economic and Technological Development Zone of Jilin City, Jilin Province, China (N 43°57′25″, E 126°28′24″, H 206 m). The climate in this region is categorized as a mesothermal sub-humid monsoon climate, exhibiting four clearly defined seasons. Spring is characterised by aridity and minimal precipitation, summer is characterised by warmth and abundant rainfall, autumn is characterised by cool temperatures and bright weather, and winter is characterised by an extended duration of low temperatures and frigid conditions. The minimum temperature required for the germination of rice seedlings is 15.1 °C, while the maximum temperature tolerated is 24.5 °C. The mean diurnal temperature during the tillering phase was 22.6 °C, while it increased to 25.8 °C during the tasselling phase.
2.2. Experimental Design
2.2.1. Experimental Design
The experiment was conducted across four treatments: control CK (no biochar added); BC1 (5 t ha−1 of biochar return treatment); BC2 (10 t ha−1 of biochar return treatment); and BC3 (20 t ha−1 of biochar return treatment). These experimental treatments were conducted in a series of 40 cm diameter and 55 cm deep plastic drums, as shown in Figure 1. The experiment was conducted by applying biochar in equal area proportions, with a plastic bucket bottom area of 0.126 m2 and BC1, BC2, and BC3 application rates of 0.5, 1, and 2 kg m−2, respectively, resulting in 0.063 kg of biochar applied to BC1, 0.126 kg of biochar applied to BC2, and 0.252 kg of biochar applied to BC1.All treatments utilized surface water, soil, and inverted layers. Three replicates were set up for each treatment, totalling 12 pots, utilising a completely randomized design. We conducted a pre-test before the start of the experiment. After the biochar was applied at a depth of 0–40 cm, some of the biochar floated on the water’s surface and did not enter the soil during irrigation and planting. This phenomenon might have affected the growth of rice seedlings and changed the results of the experiment. Therefore, we chose to apply biochar at 20–40 cm. Therefore, in the application of the biochar treatment, different amounts of biochar were uniformly mixed with the soil in the 20–40 cm soil layer.
The fertilizers used were compound fertilizer (N: P2O5:K2O = 18:18:18) and urea (CO(NH2)2, N content ≥ 46.4%). Compound fertilizer (300 kg ha−1) was used only as a basal fertilizer and was applied to the paddy field 3 days before planting. Urea was applied at 150, 75, and 150 kg ha−1 as re-greening, tillering, and spike fertilizer. The management measures during the rice’s reproductive period were based on local conventional production, and traditional diffuse irrigation was used during the rice’s reproductive period (surface irrigation: water was injected directly into the rice paddy soil).
2.2.2. Experimental Materials
The experiment was performed in 0–40 cm of rice cultivated land in the long-term rice cultivation area of the Jilin Economic and Technological Development Zone; the soil was white slurry soil and the soil texture was sandy loam (Sand: 62%, Silt: 25%, Clay: 13%). According to WRB 2022, the soil type is Haplic Phaeozems. The soil was air-dried to remove plant debris visible to the naked eye and sieved to 2 mm. Alkaline soil N (AH-N), which is ammonium (NH4+-N), was determined following the method described [21], and the Olsen-K and Olsen-P of the soil was determined by conventional methods [22]. The soil pH (soil–water ratio of 1:2.5) was 5.9. Alkaline soil N, Olsen-P, and Olsen-K were 78.7 mg kg−1, 37.0 mg kg−1, and 135.8 mg kg−1, respectively.
Corn stover was collected from the corn cultivation site of Jilin College of Agricultural Science and Technology, and the stover was cut into small 0.5–1 cm sections and dried at 75 °C. The corn stover was carbonized using a conventional commercial process, during which 1/3 of the mass of the stover is expected to be converted into granular biochar [2]. The stover was pyrolyzed in a muffle furnace at 400–500 °C under oxygen-limited conditions. The muffle temperature was raised to 200 °C and the furnace was evacuated and filled with nitrogen. The temperature was then raised to 500 °C and held for 4 h, or until no fumes were emitted. Finally, the heating was turned off and the biochar cooled. The prepared biochar was pulverized and passed through a 0.25 mm sieve. The total carbon content of the biochar was 47%, and its pH was 10.7. The total N, available P, and readily available K contents of the biochar were 8.5 g kg−1, 9.8 mg kg−1, and 51.3 mg kg−1.
The experimental rice was Jike Rice 651, sown on April 15th and harvested on October 10th. Three plants were transplanted into each pot at a spacing of 15 cm between rows, and the distance between the rice plants and the edge of the plastic bucket was 10 cm.
2.2.3. Sample Collection
Rice was harvested in October 2022. After the rice harvest, soil samples were collected using an iron auger (auger 20 cm long with a 3 cm inner diameter). Soil samples were collected from 0–20 cm versus 20–40 cm for each treatment. The iron auger was passed through the deep layer of straw during collection. The depth of the iron auger was maintained during soil collection to prevent the contamination of soil samples across layers. The collected soil samples were air-dried and sieved to 1 mm.
2.3. Sample Determination
2.3.1. Rice Yield
Rice yield and yield components, including the effective number of spikes per spike, weight per spike, and number of grains per spike, were determined. Rice yield and spike weight per spike were calculated after drying at 65 °C for 48 h, where 1000-grain weight was the air-dried weight of 1000 random grains.
2.3.2. SOC and HS Composition
SOC concentration was determined using the potassium dichromate oxidation external heating method [23], where 0.2 g of soil was treated with K2Cr2O7-H2SO4 solution and heated at 180 °C for 5 min.
A modified version of the International Humus Society (IHSS) method was used to isolate and analyse humus components [24]. The C content in HM (HM-C), HA (HA-C), and FA (FA-C) was determined using the potassium dichromate oxidation external heating method. PQ = HA-C/(HA-C + FA-C).
2.3.3. Extraction, Fractionation, and Purification of Humus Fractions
The qualitative extraction of humus components was carried out using the modified IHSS method [25].
2.3.4. Structural Characterization of Soil HA
An elemental analyzer (Vario-EL-III, Hanau, Germany) was used to determine the atomic ratios of solid HA. FTIR spectra of 1.5 mg of solid HA samples mixed with KBr were analysed using an AVATAR 360 FTIR spectrophotometer (Nicolet, Waltham, USA). Fluorescence spectra were obtained after equilibrating the HA solution at a concentration of 100 mg L−1 with 0.05 M NaOH overnight and adjusting to pH 8. The spectra were recorded using a fluorescence spectrometer (FL 6500, Perkin Elmer, Seoul, South Korea).
2.4. Statistical Analysis
All data were preprocessed using Microsoft Excel 2021 and analysed using IBM SPSS Statistics 25 (IBM Corporation, Armonk, NY, USA). Tukey’s test was used to evaluate significant differences between treatment means at the p < 0.05 level. Absorption areas in the FTIR spectra were integrated and defined as intensities using spectrometer software (Omnic, version 6a, Nicolet, USA). Spectrograms were compiled using Origin 2021.
3. Results
3.1. SOC and HS Composition
The SOC content of the treatments varied between 10.7 and 11.7 g kg−1 after one year of the pot experiment, as shown in Figure 2a. No notable disparity in SOC was observed among the treatments in the 0–20 cm soil layer. The SOC content in the 20–40 cm layer increased by 7.1%, 7.0%, and 9.5% in BC1, BC2, and BC3, respectively, compared to the CK. Additionally, BC3 showed a considerably greater SOC content compared to the other treatments. The levels of HM-C and HA-C increased in the following order: BC3 > BC2 > BC1 > CK (Figure 2b,c). BC3 exhibited considerably greater levels of HA-C and HM-C compared to the other treatments. The FA-C exhibited a distinct pattern, as the CK treatment had notably greater FA-C levels compared to the treatment involving the addition of biochar (Figure 2d). The BC3 treatment, with a PQ value of 68.6%, exhibited a considerable increase compared to the CK treatment, which had a PQ value of 52.8% (Figure 2e).
3.2. Elemental Composition of HA
The addition of biochar increased the O/C ratio of the HA in the 20–40 cm soil layer, which increased according to the amount of biochar added (Figure 3). The O/C ratios of the BC1, BC2, and BC3 treatments were increased by 11.2%, 13.72%, and 18.3%, respectively, compared to the CK treatment, in 20–40 cm soil layer, and BC3’s ratio was significantly higher than other treatments’. In addition, the H/C ratios of the HA in the 20–40 cm soil layer showed the following pattern: CK > BC1 > BC2 > BC3.
The addition of biochar resulted in an elevation of the O/C ratio of the HA in the soil layer between 20 and 40 cm. Furthermore, this rise was directly proportional to the quantity of biochar added, as depicted in Figure 3. The O/C ratios of the BC1, BC2, and BC3 treatments in the 20–40 cm soil layer were increased by 11.2%, 13.72%, and 18.3%, respectively, compared to the CK treatment. BC3 had a substantially higher O/C ratio than the other treatments. Furthermore, the O/C ratios of the HA in the soil layer between 20 and 40 cm exhibited the following sequence: CK > BC1 > BC2 > BC3.
3.3. Infrared Spectra of HA
Figure 4 displays the FTIR spectra of the soil’s HA. The BC3 treatment exhibited a greater proportionate abundance at 1620 cm−1, as indicated in Table 1. The terms I2920/I1720 and I2920/I1620 represent the relative strengths and weaknesses of aliphatic C/carboxylic C and aliphatic C/aromatic C, respectively, in the structure of the HA. The findings indicate that the BC3 treatment led to a considerable drop in aliphatic C/aromatic C (Table 1).
3.4. HA’s Fluorescence Spectra
The fluorescence spectra of HA exhibited two distinct fluorophores, namely peaks A and B. Peak A was observed at the excitation/emission matrix (EEM) wavelengths of 460/522–530 nm, while peak B was detected at 280/516–530 nm (Figure 5). There was no notable variation in fluorescence intensity among the treatments in the soil layer between 0 and 20 cm (Table 2). The fluorescence intensity of the soil with additional biochar, particularly in the BC3 treatment, was dramatically reduced compared to the soil without any amendments, specifically in the 20–40 cm soil layer (Table 2).
CK: no biochar added; BC1: 5 t ha−1 of biochar returned to the field; BC2: 10 t ha−1 of biochar returned to the field; BC3: 20 t ha−1 of biochar returned to the field. Different lowercase letters indicate significant differences between treatments (p < 0.05).
3.5. Rice Yield
The application of biochar has a substantial impact on the production of rice. As depicted in Figure 6a–c, the inclusion of biochar treatments resulted in a notable enhancement in the number of spikes, spike weight, and grains per spike. Additionally, there was an increase in the accumulation of dry matter in the spike, leading to a considerable boost in rice production. The rice yield of the BC1, BC2, and BC3 treatments increased by 4.96%, 11.63%, and 13.72%, respectively, compared to the CK. The BC3 treatment had the greatest significant impact on boosting the rice yield.
4. Discussion
4.1. Effect of the Application of Biomass Charcoal on SOC and HS Composition
Organic carbon is a crucial indicator for assessing soil quality, and its concentration and dispersion have a direct and indirect impact on the functioning of soil ecosystems [26]. In general, traditional methods of soil cultivation result in the depletion of SOC, while the use of organic materials is an effective strategy to enhance the storage of SOC. Biochar has the ability to enhance SOC levels [27]. The extent of this increase in rice’s SOC can vary, ranging from 16% to 77%, depending on the quantity of the biochar applied, which typically ranges from 10 to 40 t ha−1. The results of our study (Figure 2a) align with these findings, indicating that the application of the biochar treatment led to a considerable increase in the SOC content compared to the CK. Out of all the treatments, BC3 showed the highest level of significance in enhancing SOC (Figure 2a). The application of biochar enhances the concentration of aromatic compounds and facilitates the breakdown of soluble organic matter in paddy soils. Biochar with a large quantity of aromatic structures in its carbon is created through pyrolysis at high temperatures and low oxygen levels [28]. During a 6-year trial, the application of biochar resulted in a 70% increase in SOC [29]. The low degradability of the aromatic structure of carbon in biochar results in just a small portion, approximately 5%, of the biochar’s carbon being liberated from the soil as carbon dioxide by microbial respiration [30]. Conversely, biochar possesses a substantial specific surface area, enabling it to adsorb organic matter into the soil. This process establishes a protective mechanism that enhances the stability of soil’s carbon [31].
The impact of straw return is evident not only in the alteration of the quantity of SOC but also in the enhancement of the SOM’s quality [32]. The rise in HS fractions is crucial for the process of soil carbon stabilisation. These fractions represent a resistant pool of carbon in the soil, serving as a reliable measure of carbon sequestration in the soil [33]. Corn stover and its biochar are carbon-rich substances [34], which include specific quantities of humus fractions. During the process of humification, the majority of the carbon inputs derived from stover sources undergo conversion into humic compounds [35]. The biochar application treatments resulted in noticeably higher levels of HA-C and HM-C compared to the CK treatment, as seen in Figure 2b,c. This is consistent with the findings of investigations conducted in the northwest and northeast regions of China [36,37]. Both investigations demonstrated a considerable increase in the soil’s HA-C and HM-C content following a treatment of BC3, compared to the application of straw. The reason for this rise can be ascribed to the enhanced stability of biochar’s C, which is due to its abundant quantity of stabilised aromatic components [38]. The aforementioned findings indicate that the use of biochar enhances the process of soil carbon sequestration in rice paddies located in the northeastern region of China.
Conversely, the FA-C content of the soil decreased in both treatments in which biochar was applied. FA has greater solubility and activity compared to HA [39]. The reason for this is that FA consists of a significant amount of unstable constituents, such as carbohydrates and proteins, while HA consists of aliphatic and aromatic molecules. During the initial phases of straw breakdown, biochar either synthesises FA or direct decomposes into CO2. As a result, the production rate of FA is higher than that of HA [40]. As the degradation continues, the FA molecules combine to form larger and more intricate fractions of HA, which are more stable. This results in an increase in the quantity of carbon bonded to HA [41].
The PQ value quantifies the proportion of HA (humic acid) in the HE (humic extract) and serves as an indicator of straw’s humification level [40]. The soil humification degree quantifies the ratio of humus to non-humus substances in the soil [42]. The level of soil humification varies depending on various management approaches [43]. The BC3 treatment resulted in a significant rise of 68.6% in the soil’s PQ value, as seen in Figure 2e. The results demonstrate that the BC3 treatment exhibited a higher degree of humification, which aligns with the findings of prior research [44]. The application of biochar enhanced the composition of HS, leading to an enhancement of the soil’s PQ, specifically by promoting soil humification [45].
4.2. Effect of Biochar’s Application on HA’s Structure
The addition of biochar increased the ratio of O/C in the HA found in the soil layer between 20 and 40 cm. Furthermore, this ratio rose in proportion to the amount of biochar added, as shown in Figure 3. The application of biochar resulted in an increase in the elemental oxygen content of HA and a decrease in its hydrogen content. These findings indicate that the percentage of oxygenated molecules in HA increased following the deep burial of biochar, resulting in an improved level of aromaticity [44]. Aromaticity is a measure of how much the HA’s structure is aromatized. It is well acknowledged that a higher level of aromaticity suggests a more intricate and stable HA structure [46]. The application of biochar leads to an increase in microbial activity. As biochar breaks down, it releases organic compounds into the soil, which then contribute to the process of humification. This results in the formation of immature humus molecules that are abundant in aliphatic compound structures [47]. Simultaneously, the recently established HA exhibits a diminished proportion of carboxyl C and aromatic C, indicating reduced levels of oxidation, condensation, and thermal stability [48]. Over time, soil HA undergoes a progressive rise in its amount of aromatic carbon, as seen in previous studies [49]. The microbial utilisation of soil HA has proven that microorganisms preferentially utilise the aliphatic molecules in HA, while the remaining HA contains a higher concentration of condensed aromatic structures [50]. Zhang et al. decreased the O/C ratio of HA through the addition of biochar to a soil planted with corn, and the reason for this may be the degradation of corn stover residues in the soil accelerating the oxidative degradation of humic substances and the production of aliphatic compounds [44].
Variations in the strength of the FTIR absorption peaks indicate disparities in the structure of HA. The FTIR spectra of soil HA at various depths of the soil horizon were analysed, revealing shared absorption peaks (Figure 4a,b). However, there were variations in the relative strengths of carbon absorption between these depths (Table 1). The peak at 1620 cm−1 corresponds to the vibration of C=C bonds in the HA’s aromatic structure [51]. The presence of organic materials can impact the composition of HA [52], since it accumulates a significant quantity of biodegradable organic matter [53]. This would promote the creation of soluble organic carbon. Aggregating these molecules can result in the production of several aliphatic compounds; however, the humification process is more likely to favour the development of aromatic compounds [53]. The current work validates previous findings, demonstrating that the implementation of biochar treatments enhanced the aromaticity of carbon, leading to a more resilient structure of the humic acid. The greater absorption strength of the peak at 1620 cm−1 on the infrared spectrum of BC3 (Table 1) indicates this.
Fluorescence spectroscopy has been increasingly utilised in recent years to examine the composition of humic compounds [54]. Fluorescence spectroscopy revealed a notable reduction in the fluorescence intensity of peaks A and B following the application of straw, as depicted in Figure 5 and Table 2. The fluorescence intensity of soils treated with biochar, particularly the BC3 treatment, was significantly reduced compared to unamended soils. This effect was observed in the 20–40 cm soil layer (Table 2). Strong fluorescence intensity was linked to the existence of hydroxyl, alkoxy, methoxy, and amino groups in the HA, which are substances with a limited level of aromatic condensation [51]. In soils treated with biochar, the fluorescence intensity dropped as the amount of biochar applied rose (Figure 6). This suggests that the organic matter underwent enhanced humification, resulting in the preservation of complex aromatic structures [53] and their alignment with other resistant molecules. Consequently, the utilisation of biochar improves the aromatic nature of the HA in paddy soil, leading to a sophisticated and enduring HA framework. Liu et al. found three peaks, A, B, and C, in their HA fluorescence spectrum after 3 years of biochar application, and the reason for this difference was the development of the HA structure in a more complex and stabilized direction with an increase in the number of years of application [20].
4.3. Effect of the Application of Biomass Charcoal on Yield and Component Factors
The use of both straw and biochar had a notable impact on the production of rice [55]. Figure 6a–c demonstrate that the inclusion of biochar treatments resulted in a notable rise in the number of spikes, spike weight, and number of grains per spike. Additionally, it led to an increase in the accumulation of dry matter in the spike, ultimately resulting in a large increase in the rice yield. Figure 6e demonstrates that the rice yields of the BC1, BC2, and BC3 treatments saw respective increases of 5.0%, 11.6%, and 13.7% compared to CK. Notably, the BC3 treatment had the most pronounced impact on enhancing rice production. The findings of our study align with those of Liu et al. [56], demonstrating that the correct utilisation of biochar (20 t ha−1) can enhance both the quantity of rice grains and the weight of 1000 grains, resulting in increased crop output.
The increase in crop output due to biochar can be attributed to the enhancement of the growing conditions and physiological traits of rice. As previously stated, biochar is nutrient-rich and possesses a highly developed pore structure, enabling the effective retention of soil nutrients. This, in turn, enhances the availability of nutrients to crops and stimulates crop growth [57]. Biochar enhances plant growth by improving the soil structure, stimulating root development, and increasing the stomatal density, photosynthetic rate, and overall plant productivity [58]. Biochar generated through pyrolysis at lower temperatures exhibits enhanced nutritional efficacy in soil [59]. The use of maize-stover-derived biochar at a lower pyrolysis temperature (500 °C) resulted in a greater enhancement in rice yields [60]. The application of larger amounts of biochar resulted in an increase in the nutrient uptake by plants. This led to a 108% increase in the acquisition of cationic nutrients and a 5.8% rise in the yield of rice [61]. Furthermore, the significant porosity and surface area of biochar enhance its capacity to bind both cations and anions, hence enhancing the storage of soil nutrients [62].
5. Conclusions
The use of biochar led to a substantial increase in SOC, HM-C, and HA-C levels in the 20–40 cm soil layer, resulting in improved soil humification. Biochar increased the aromatic nature of soil HA and resulted in a more intricate and enduring HA structure. Varying levels of biochar dosage resulted in enhanced dry matter accumulation in the spike by augmenting the effective number of spikes, spike weight, and number of grains per spike, hence stimulating rice production. An appropriate application rate of biochar (20 t ha−1) is a highly successful method to enhance the stability of soil organic carbon sequestration, enhance humic acid’s structure, and boost a rice crop’s output. The results of this study provide a theoretical basis for improving soil carbon sequestration, mitigating greenhouse gas emissions, and generating sustainable agricultural development.
Nevertheless, the findings and suggestions of this investigation rely on a controlled experiment conducted in pots. It would be advisable to conduct a field trial in the future to examine the effects of biochar’s application to soils over an extended period of time.
Author Contributions
Conceptualization, S.D. and D.G.; methodology, data curation, C.Y.; formal analysis, C.Y. and H.Z.; resources, C.Y.; investigation, C.Y. and H.Z.; writing—original draft preparation, C.Y.; funding acquisition, C.Y. All authors have read and agreed to the published version of the manuscript.
Funding
This work was supported by the National Key Research and Development Program of China (2022YFD1500304), the National Natural Science Foundation of China (42077022), and the Jilin Province College Student Science and Technology Innovation and Entrepreneurship Training Program Project (S202311439002).
Data Availability Statement
Research data will be made available upon request.
Conflicts of Interest
The authors declare no conflicts of interest.
References
- Ren, X.; Chen, F.; Ma, T.; Hu, Y. Soil Quality Characteristics as Affected by Continuous Rice Cultivation and Changes in Cropping Systems in South China. Agriculture 2020, 10, 443. [Google Scholar] [CrossRef]
- Cui, Y.; Meng, J.; Wang, Q.; Zhang, W.; Cheng, X.; Chen, W. Effects of Straw and Biochar Addition on Soil Nitrogen, Carbon, and Super Rice Yield in Cold Waterlogged Paddy Soils of North China. J. Integr. Agric. 2017, 16, 1064–1074. [Google Scholar] [CrossRef]
- Nardi, S.; Morari, F.; Berti, A.; Tosoni, M.; Giardini, L. Soil Organic Matter Properties after 40 Years of Different Use of Organic and Mineral Fertilisers. Eur. J. Agron. 2004, 21, 357–367. [Google Scholar] [CrossRef]
- Sun, H.; Zhang, Y.; Yang, Y.; Chen, Y.; Jeyakumar, P.; Shao, Q.; Zhou, Y.; Ma, M.; Zhu, R.; Qian, Q.; et al. Effect of Biofertilizer and Wheat Straw Biochar Application on Nitrous Oxide Emission and Ammonia Volatilization from Paddy Soil. Environ. Pollut. 2021, 275, 116640. [Google Scholar] [CrossRef] [PubMed]
- Yang, S.; Jiang, Z.; Sun, X.; Ding, J.; Xu, J. Effects of Biochar Amendment on CO2 Emissions from Paddy Fields under Water-Saving Irrigation. IJERPH 2018, 15, 2580. [Google Scholar] [CrossRef] [PubMed]
- Devêvre, O.C.; Horwáth, W.R. Decomposition of Rice Straw and Microbial Carbon Use Efficiency under Different Soil Temperatures and Moistures. Soil Biol. Biochem. 2000, 32, 1773–1785. [Google Scholar] [CrossRef]
- Jones, D.L.; Rousk, J.; Edwards-Jones, G.; DeLuca, T.H.; Murphy, D.V. Biochar-Mediated Changes in Soil Quality and Plant Growth in a Three Year Field Trial. Soil Biol. Biochem. 2012, 45, 113–124. [Google Scholar] [CrossRef]
- Suliman, W.; Harsh, J.B.; Abu-Lail, N.I.; Fortuna, A.-M.; Dallmeyer, I.; Garcia-Pérez, M. The Role of Biochar Porosity and Surface Functionality in Augmenting Hydrologic Properties of a Sandy Soil. Sci. Total Environ. 2017, 574, 139–147. [Google Scholar] [CrossRef]
- Xie, Z.; Xu, Y.; Liu, G.; Liu, Q.; Zhu, J.; Tu, C.; Amonette, J.E.; Cadisch, G.; Yong, J.W.H.; Hu, S. Impact of Biochar Application on Nitrogen Nutrition of Rice, Greenhouse-Gas Emissions and Soil Organic Carbon Dynamics in Two Paddy Soils of China. Plant Soil 2013, 370, 527–540. [Google Scholar] [CrossRef]
- Mohan, D.; Abhishek, K.; Sarswat, A.; Patel, M.; Singh, P.; Pittman, C.U. Biochar Production and Applications in Soil Fertility and Carbon Sequestration—A Sustainable Solution to Crop-Residue Burning in India. RSC Adv. 2018, 8, 508–520. [Google Scholar] [CrossRef]
- Liu, Y.; Li, J.; Jiao, X.; Li, H.; An, Y.; Liu, K. Effects of Straw Returning Combine with Biochar on Water Quality under Flooded Condition. Water 2020, 12, 1633. [Google Scholar] [CrossRef]
- Yin, X.; Chen, J.; Cao, F.; Tao, Z.; Huang, M. Short-Term Application of Biochar Improves Post-Heading Crop Growth but Reduces Pre-Heading Biomass Translocation in Rice. Plant Prod. Sci. 2020, 23, 522–528. [Google Scholar] [CrossRef]
- Ndzelu, B.S.; Dou, S.; Zhang, X. Changes in Soil Humus Composition and Humic Acid Structural Characteristics under Different Corn Straw Returning Modes. Soil Res. 2020, 58, 452. [Google Scholar] [CrossRef]
- Piccolo, A.; Spaccini, R.; Nieder, R.; Richter, J. Sequestration of a Biologically Labile Organic Carbon in Soils by Humified Organic Matter. Clim. Chang. 2004, 67, 329–343. [Google Scholar] [CrossRef]
- Loke, P.F.; Kotzé, E.; Du Preez, C.C.; Twigge, L. Long-Term Effects of Wheat Production Management Practices on Some Carbon Fractions of a Semiarid Plinthustalfs. Soil Res. 2018, 56, 601. [Google Scholar] [CrossRef]
- Tamura, M.; Suseela, V.; Simpson, M.; Powell, B.; Tharayil, N. Plant Litter Chemistry Alters the Content and Composition of Organic Carbon Associated with Soil Mineral and Aggregate Fractions in Invaded Ecosystems. Glob. Chang. Biol. 2017, 23, 4002–4018. [Google Scholar] [CrossRef] [PubMed]
- De Mastro, F.; Cocozza, C.; Traversa, A.; Savy, D.; Abdelrahman, H.M.; Brunetti, G. Influence of Crop Rotation, Tillage and Fertilization on Chemical and Spectroscopic Characteristics of Humic Acids. PLoS ONE 2019, 14, e0219099. [Google Scholar] [CrossRef]
- Qualls, R.G. Biodegradability of Humic Substances and Other Fractions of Decomposing Leaf Litter. Soil Sci. Soc. Am. J. 2004, 68, 1705–1712. [Google Scholar] [CrossRef]
- Spaccini, R.; Mbagwu, J.S.C.; Conte, P.; Piccolo, A. Changes of Humic Substances Characteristics from Forested to Cultivated Soils in Ethiopia. Geoderma 2006, 132, 9–19. [Google Scholar] [CrossRef]
- Liu, X.; Dou, S.; Zheng, S. Effects of Corn Straw and Biochar Returning to Fields Every Other Year on the Structure of Soil Humic Acid. Sustainability 2022, 14, 15946. [Google Scholar] [CrossRef]
- Ma, R.; Dou, S.; Zhang, Y.; Wu, D.; Ndzelu, B.S.; Xie, S.; YaLiHong, D. Different Soil Particle Size Changes the 15N Retention in Soil and 15N Utilization by Maize. Sci. Total Environ. 2022, 843, 157133. [Google Scholar] [CrossRef] [PubMed]
- Carter, M.R.; Gregorich, E.G. (Eds.) Soil Sampling and Methods of Analysis, 2nd ed.; Canadian Society of Soil Science; CRC Press: Pinawa, MB, Canada; Boca Raton, FL, USA, 2008; ISBN 978-0-8493-3586-0. [Google Scholar]
- Nelson, D.W.; Sommers, L.E. Total Carbon, Organic Carbon, and Organic Matter. In Methods of Soil Analysis; Agronomy Monographs; Wiley: Hoboken, NJ, USA, 1983; pp. 539–579. ISBN 978-0-89118-977-0. [Google Scholar]
- Mi, W.; Sun, Y.; Gao, Q.; Liu, M.; Wu, L. Changes in Humus Carbon Fractions in Paddy Soil given Different Organic Amendments and Mineral Fertilizers. Soil Tillage Res. 2019, 195, 104421. [Google Scholar] [CrossRef]
- Zhang, G.; Dou, S.; Meng, F.; Yin, X.; Zhou, X. Transformation of Biochar into Extracted Humic Substances under Short-Term Laboratory Incubation Conditions: Evidence from Stable Carbon Isotopes. Soil Tillage Res. 2022, 215, 105189. [Google Scholar] [CrossRef]
- Schmidt, M.W.I.; Torn, M.S.; Abiven, S.; Dittmar, T.; Guggenberger, G.; Janssens, I.A.; Kleber, M.; Kögel-Knabner, I.; Lehmann, J.; Manning, D.A.C.; et al. Persistence of Soil Organic Matter as an Ecosystem Property. Nature 2011, 478, 49–56. [Google Scholar] [CrossRef] [PubMed]
- Chen, J.; Liu, X.; Li, L.; Zheng, J.; Qu, J.; Zheng, J.; Zhang, X.; Pan, G. Consistent Increase in Abundance and Diversity but Variable Change in Community Composition of Bacteria in Topsoil of Rice Paddy under Short Term Biochar Treatment across Three Sites from South China. Appl. Soil Ecol. 2015, 91, 68–79. [Google Scholar] [CrossRef]
- Gao, J.; Shi, Z.; Wu, H.; Lv, J. Fluorescent Characteristics of Dissolved Organic Matter Released from Biochar and Paddy Soil Incorporated with Biochar. RSC Adv. 2020, 10, 5785–5793. [Google Scholar] [CrossRef]
- Tian, J.; Wang, J.; Dippold, M.; Gao, Y.; Blagodatskaya, E.; Kuzyakov, Y. Biochar Affects Soil Organic Matter Cycling and Microbial Functions but Does Not Alter Microbial Community Structure in a Paddy Soil. Sci. Total Environ. 2016, 556, 89–97. [Google Scholar] [CrossRef]
- Kuzyakov, Y.; Bogomolova, I.; Glaser, B. Biochar Stability in Soil: Decomposition during Eight Years and Transformation as Assessed by Compound-Specific 14C Analysis. Soil Biol. Biochem. 2014, 70, 229–236. [Google Scholar] [CrossRef]
- Zimmerman, A.R.; Gao, B.; Ahn, M.-Y. Positive and Negative Carbon Mineralization Priming Effects among a Variety of Biochar-Amended Soils. Soil Biol. Biochem. 2011, 43, 1169–1179. [Google Scholar] [CrossRef]
- Ingelmo, F.; Molina, M.J.; Soriano, M.D.; Gallardo, A.; Lapeña, L. Influence of Organic Matter Transformations on the Bioavailability of Heavy Metals in a Sludge Based Compost. J. Environ. Manag. 2012, 95, S104–S109. [Google Scholar] [CrossRef] [PubMed]
- Navarrete, I.A.; Tsutsuki, K.; Navarrete, R.A. Humus Composition and the Structural Characteristics of Humic Substances in Soils under Different Land Uses in Leyte, Philippines. Soil Sci. Plant Nutr. 2010, 56, 289–296. [Google Scholar] [CrossRef]
- Yu, H.; Zou, W.; Chen, J.; Chen, H.; Yu, Z.; Huang, J.; Tang, H.; Wei, X.; Gao, B. Biochar Amendment Improves Crop Production in Problem Soils: A Review. J. Environ. Manag. 2019, 232, 8–21. [Google Scholar] [CrossRef]
- Simonetti, G.; Francioso, O.; Nardi, S.; Berti, A.; Brugnoli, E.; Francesco Morari, E.L. Characterization of Humic Carbon in Soil Aggregates in a Long-Term Experiment with Manure and Mineral Fertilization. Soil Sci. Soc. Am. J. 2012, 76, 880–890. [Google Scholar] [CrossRef]
- Zhang, J.; Wei, Y.; Liu, J.; Yuan, J.; Liang, Y.; Ren, J.; Cai, H. Effects of Maize Straw and Its Biochar Application on Organic and Humic Carbon in Water-Stable Aggregates of a Mollisol in Northeast China: A Five-Year Field Experiment. Soil Tillage Res. 2019, 190, 1–9. [Google Scholar] [CrossRef]
- Zhao, S.; Ta, N.; Li, Z.; Yang, Y.; Zhang, X.; Liu, D.; Zhang, A.; Wang, X. Varying Pyrolysis Temperature Impacts Application Effects of Biochar on Soil Labile Organic Carbon and Humic Fractions. Appl. Soil Ecol. 2018, 123, 484–493. [Google Scholar] [CrossRef]
- Tan, Z.; Lin, C.S.K.; Ji, X.; Rainey, T.J. Returning Biochar to Fields: A Review. Appl. Soil Ecol. 2017, 116, 1–11. [Google Scholar] [CrossRef]
- Rivero, C.; Chirenje, T.; Ma, L.Q.; Martinez, G. Influence of Compost on Soil Organic Matter Quality under Tropical Conditions. Geoderma 2004, 123, 355–361. [Google Scholar] [CrossRef]
- Zhang, Y.; Dou, S.; Hamza, B.; Ye, S.; Zhang, D. Mechanisms of Three Fungal Types on Humic-Like Substances Formation during Solid-State Fermentation of Corn Straw. Int. J. Agric. Biol. 2020, 23, 970–976. [Google Scholar]
- Zhang, X.; Dou, S.; Ndzelu, B.S.; Zhang, Y.; Liu, X. Accumulation of Straw-Derived Carbon and Changes in Soil Humic Acid Structural Characteristics during Corn Straw Decomposition. Can. J. Soil. Sci. 2021, 101, 452–465. [Google Scholar] [CrossRef]
- Masciandaro, G.; Ceccanti, B. Assessing Soil Quality in Different Agro-Ecosystems through Biochemical and Chemico-Structural Properties of Humic Substances. Soil Tillage Res. 1999, 51, 129–137. [Google Scholar] [CrossRef]
- Guimarães, D.V.; Gonzaga, M.I.S.; Da Silva, T.O.; Da Silva, T.L.; Da Silva Dias, N.; Matias, M.I.S. Soil Organic Matter Pools and Carbon Fractions in Soil under Different Land Uses. Soil Tillage Res. 2013, 126, 177–182. [Google Scholar] [CrossRef]
- Zhang, X.; Dou, S.; Ndzelu, B.S.; Guan, X.W.; Zhang, B.Y.; Bai, Y. Effects of Different Corn Straw Amendments on Humus Composition and Structural Characteristics of Humic Acid in Black Soil. Commun. Soil Sci. Plant Anal. 2020, 51, 107–117. [Google Scholar] [CrossRef]
- Zheng, S.; Dou, S.; Duan, H.M. Effects of straw enrichment and deep incorporation on humus composition and humic acid structure of black soil profile in northeast China. Appl. Ecol. Env. Res. 2022, 20, 1051–1063. [Google Scholar] [CrossRef]
- Piccolo, A.; Mbagwu, J.S.C. Role of Hydrophobic Components of Soil Organic Matter in Soil Aggregate Stability. Soil Sci. Soc. Am. J. 1999, 63, 1801–1810. [Google Scholar] [CrossRef]
- Maryganova, V.; Szajdak, L.W.; Tychinskaya, L. Hydrophobic and Hydrophilic Properties of Humic Acids from Soils under Shelterbelts of Different Ages. Chem. Ecol. 2010, 26, 25–33. [Google Scholar] [CrossRef]
- Zhou, Y.; Selvam, A.; Wong, J.W.C. Evaluation of Humic Substances during Co-Composting of Food Waste, Sawdust and Chinese Medicinal Herbal Residues. Bioresour. Technol. 2014, 168, 229–234. [Google Scholar] [CrossRef] [PubMed]
- Zech, W.; Ziegler, F.; Kögel-Knabner, I.; Haumaier, L. Humic Substances Distribution and Transformation in Forest Soils. Sci. Total Environ. 1992, 117–118, 155–174. [Google Scholar] [CrossRef]
- Filip, Z.; Tesařová, M. Microbial Degradation and Transformation of Humic Acids from Permanent Meadow and Forest Soils. Int. Biodeterior. Biodegrad. 2004, 54, 225–231. [Google Scholar] [CrossRef]
- Senesi, N.; D’Orazio, V.; Ricca, G. Humic Acids in the First Generation of EUROSOILS. Geoderma 2003, 116, 325–344. [Google Scholar] [CrossRef]
- Jindo, K.; Sánchez-Monedero, M.A.; Matsumoto, K.; Sonoki, T. The Efficiency of a Low Dose of Biochar in Enhancing the Aromaticity of Humic-Like Substance Extracted from Poultry Manure Compost. Agronomy 2019, 9, 248. [Google Scholar] [CrossRef]
- Bayer, C.; Martin-Neto, L.; Mielniczuk, J.; Ceretta, C.A. Effect of No-till Cropping Systems on Soil Organic Matter in a Sandy Clay Loam Acrisol from Southern Brazil Monitored by Electron Spin Resonance and Nuclear Magnetic Resonance. Soil Tillage Res. 2000, 53, 95–104. [Google Scholar] [CrossRef]
- Yang, Z. Reducing Capacities and Redox Potentials of Humic Substances Extracted from Sewage Sludge. Chemosphere 2016, 144, 902–908. [Google Scholar] [CrossRef] [PubMed]
- Huang, M.; Fan, L.; Jiang, L.; Yang, S.; Zou, Y.; Uphoff, N. Continuous Applications of Biochar to Rice: Effects on Grain Yield and Yield Attributes. J. Integr. Agric. 2019, 18, 563–570. [Google Scholar] [CrossRef]
- Liu, Y.; Li, J.; Jiao, X.; Li, H.; Hu, T.; Jiang, H.; Mahmoud, A. Effects of Biochar on Water Quality and Rice Productivity under Straw Returning Condition in a Rice-Wheat Rotation Region. Sci. Total Environ. 2022, 819, 152063. [Google Scholar] [CrossRef] [PubMed]
- Tanazawa, Y.; Tomotsune, M.; Suzuki, T.; Koizumi, H.; Yoshitake, S. Photosynthetic Response of Young Oaks to Biochar Amendment in Field Conditions over 3 Years. J. For. Res. 2021, 26, 116–126. [Google Scholar] [CrossRef]
- Driesen, E.; Van Den Ende, W.; De Proft, M.; Saeys, W. Influence of Environmental Factors Light, CO2, Temperature, and Relative Humidity on Stomatal Opening and Development: A Review. Agronomy 2020, 10, 1975. [Google Scholar] [CrossRef]
- Purakayastha, T.J.; Bera, T.; Bhaduri, D.; Sarkar, B.; Mandal, S.; Wade, P.; Kumari, S.; Biswas, S.; Menon, M.; Pathak, H.; et al. A Review on Biochar Modulated Soil Condition Improvements and Nutrient Dynamics Concerning Crop Yields: Pathways to Climate Change Mitigation and Global Food Security. Chemosphere 2019, 227, 345–365. [Google Scholar] [CrossRef]
- Gao, J.; Zhao, Y.; Zhang, W.; Sui, Y.; Jin, D.; Xin, W.; Yi, J.; He, D. Biochar Prepared at Different Pyrolysis Temperatures Affects Urea-Nitrogen Immobilization and N 2 O Emissions in Paddy Fields. PeerJ 2019, 7, e7027. [Google Scholar] [CrossRef]
- Wu, L.; Zhang, S.; Chen, M.; Liu, J.; Ding, X. A Sustainable Option: Biochar Addition Can Improve Soil Phosphorus Retention and Rice Yield in a Saline–Alkaline Soil. Environ. Technol. Innov. 2021, 24, 102070. [Google Scholar] [CrossRef]
- Han, L.; Sun, K.; Yang, Y.; Xia, X.; Li, F.; Yang, Z.; Xing, B. Biochar’s Stability and Effect on the Content, Composition and Turnover of Soil Organic Carbon. Geoderma 2020, 364, 114184. [Google Scholar] [CrossRef]
Figure 1.
Design of pot experiment with different treatments.

Figure 2.
Changes in SOC and HS composition with biochar addition. SOC content is shown in (a), HM, HA, and FA contents in (b–d), respectively, and PQ values in (e). CK: no biochar added; BC1: 5 t ha−1 of biochar returned to the field; BC2: 10 t ha−1 of biochar returned to the field; BC3: 20 t ha−1 of biochar returned to the field. Different lowercase letters indicate significant differences between treatments (p < 0.05).

Figure 3.
Van-Krevelen distribution of HA after biochar addition. CK: no biochar added; BC1: 5 t ha−1 of biochar returned to the field; BC2: 10 t ha−1 of biochar returned to the field; BC3: 20 t ha−1 of biochar returned to the field. 0–20 cm and 20–40 cm are the depths of the soil.
Figure 3.
Van-Krevelen distribution of HA after biochar addition. CK: no biochar added; BC1: 5 t ha−1 of biochar returned to the field; BC2: 10 t ha−1 of biochar returned to the field; BC3: 20 t ha−1 of biochar returned to the field. 0–20 cm and 20–40 cm are the depths of the soil.
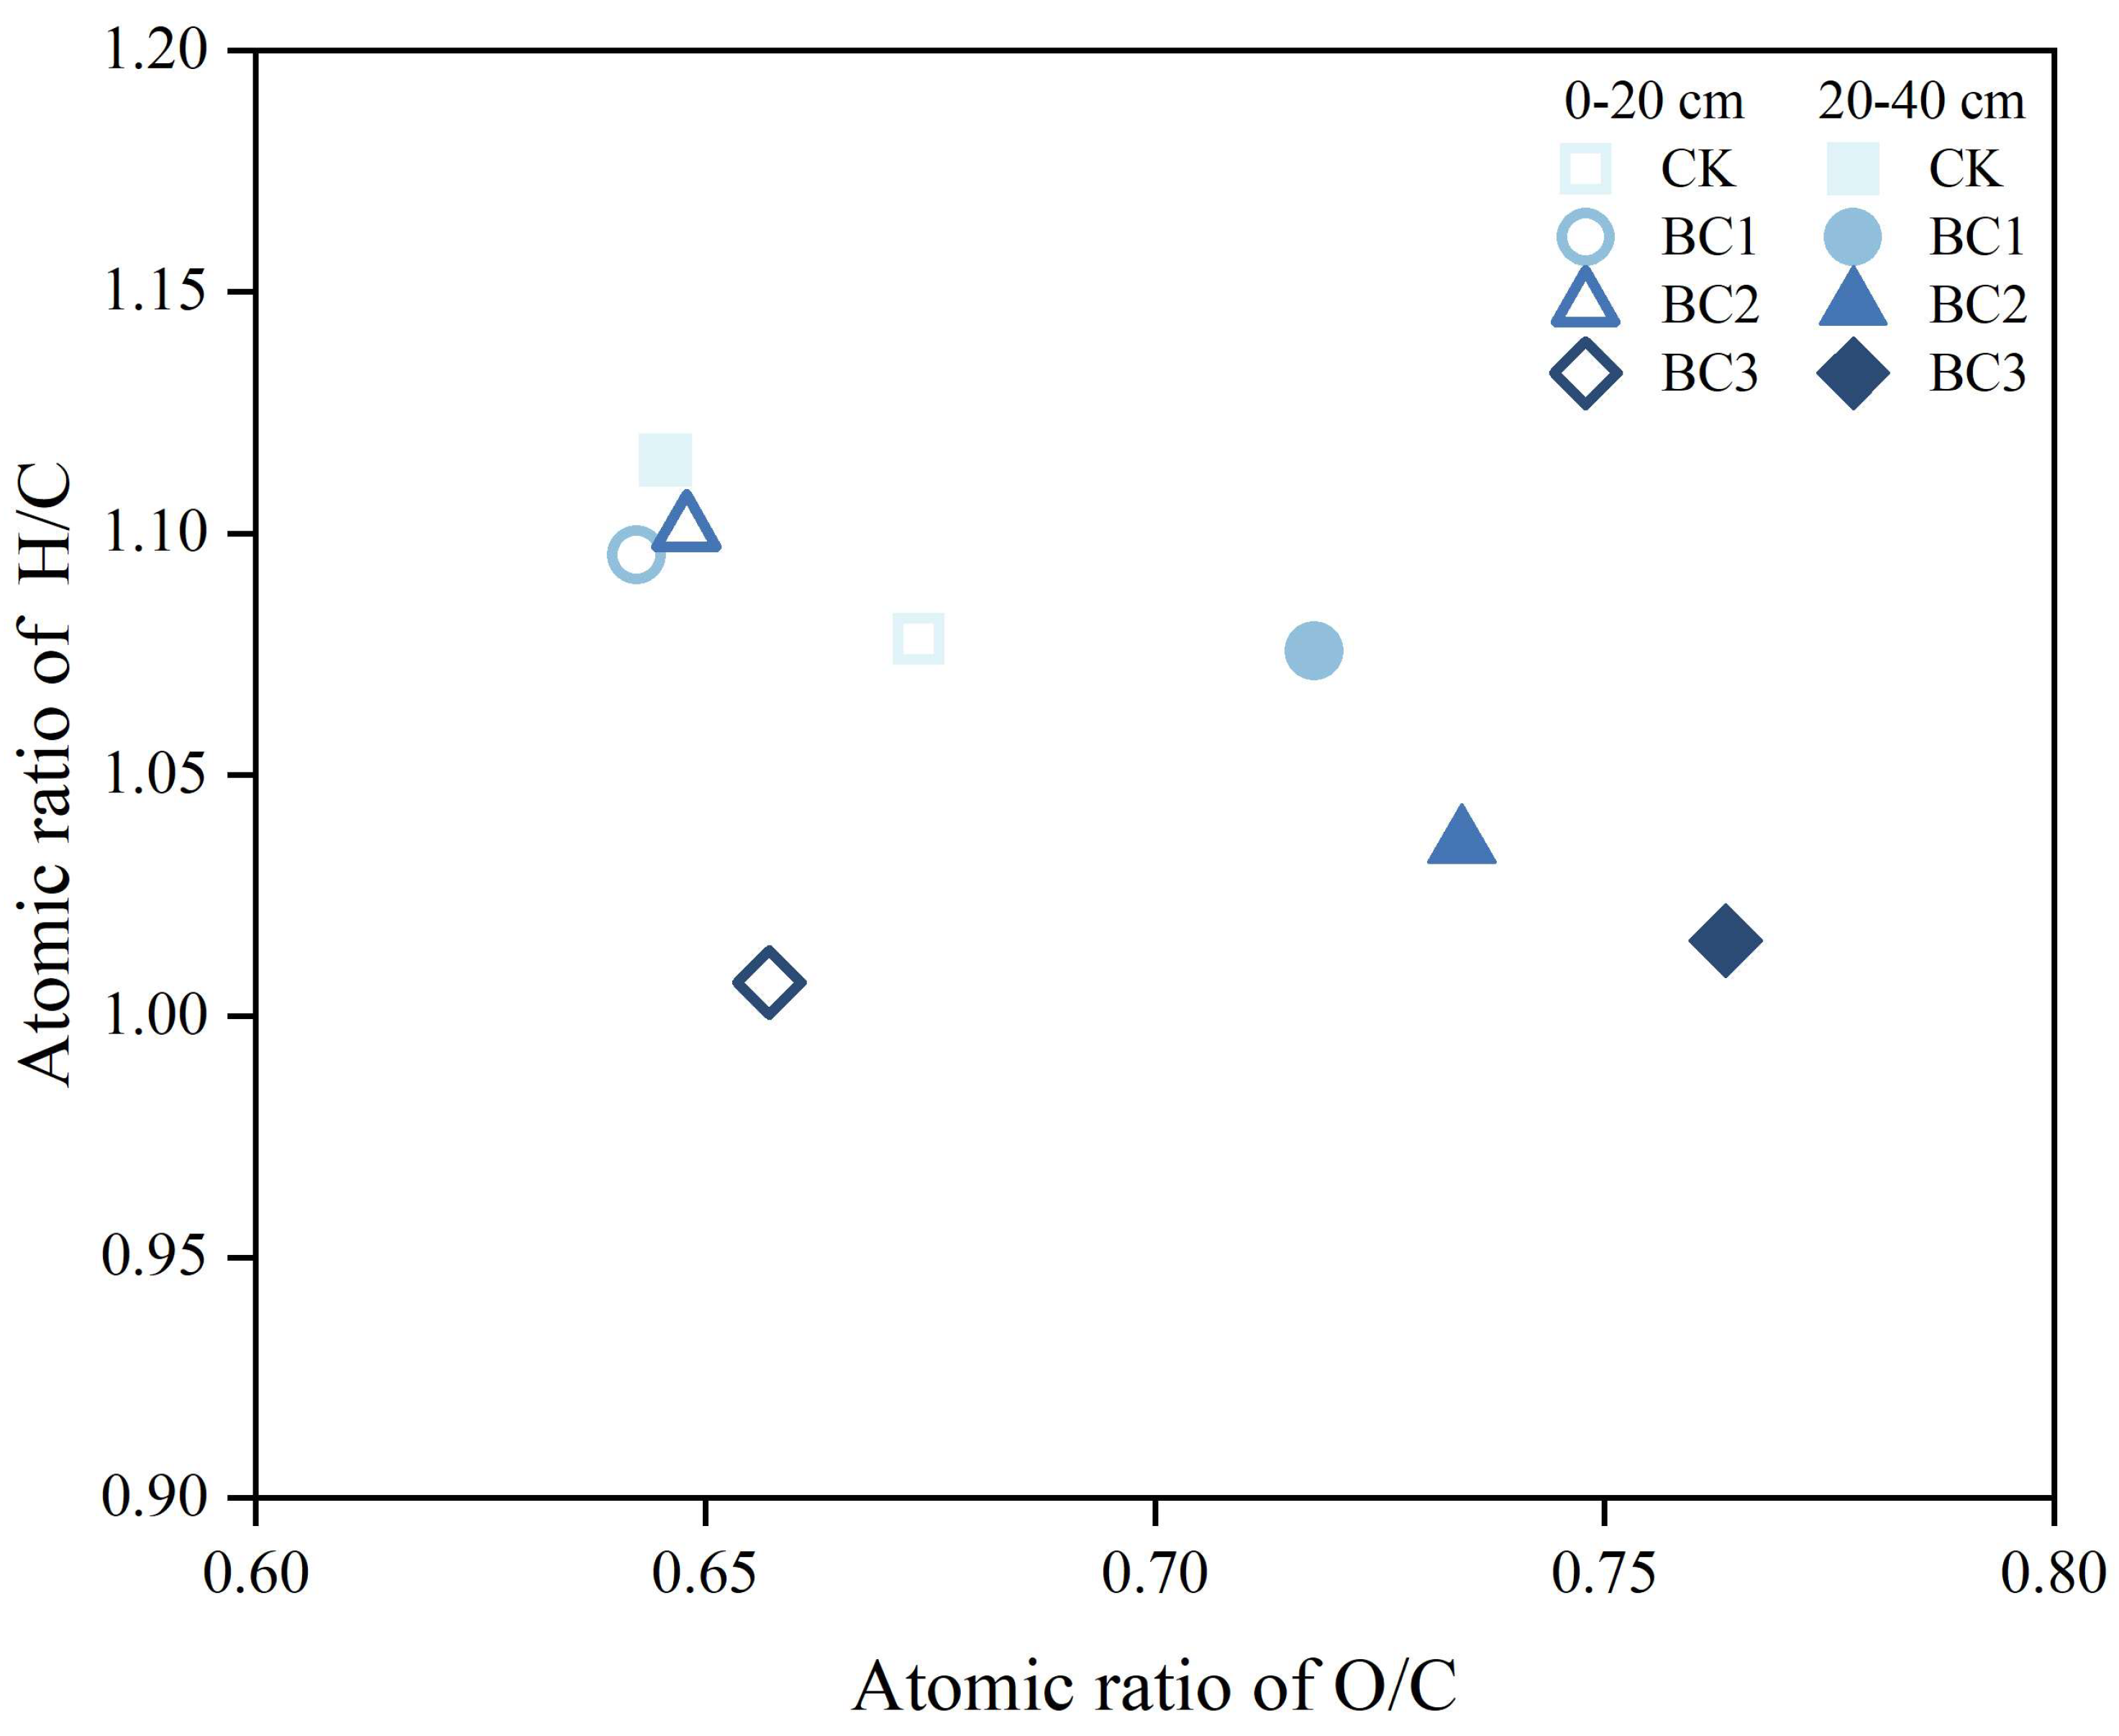
Figure 4.
FTIR spectra of HA after biochar addition. (a) is the 0–20 cm soil layer, and (b) is the 20–40 cm soil layer. CK: no biochar added; BC1: 5 t ha−1 of biochar returned to the field; BC2: 10 t ha−1 of biochar returned to the field; BC3: 20 t ha−1 of biochar returned to the field.
Figure 4.
FTIR spectra of HA after biochar addition. (a) is the 0–20 cm soil layer, and (b) is the 20–40 cm soil layer. CK: no biochar added; BC1: 5 t ha−1 of biochar returned to the field; BC2: 10 t ha−1 of biochar returned to the field; BC3: 20 t ha−1 of biochar returned to the field.

Figure 5.
Fluorescence spectra of HA after biochar addition. CK: no biochar added; BC1: 5 t ha−1 of biochar returned to the field; BC2: 10 t ha−1 of biochar returned to the field; BC3: 20 t ha−1 of biochar returned to the field. 0–20 cm and 20–40 cm are the depths of the soil. Letters A and B indicate that two HA fluorophores.
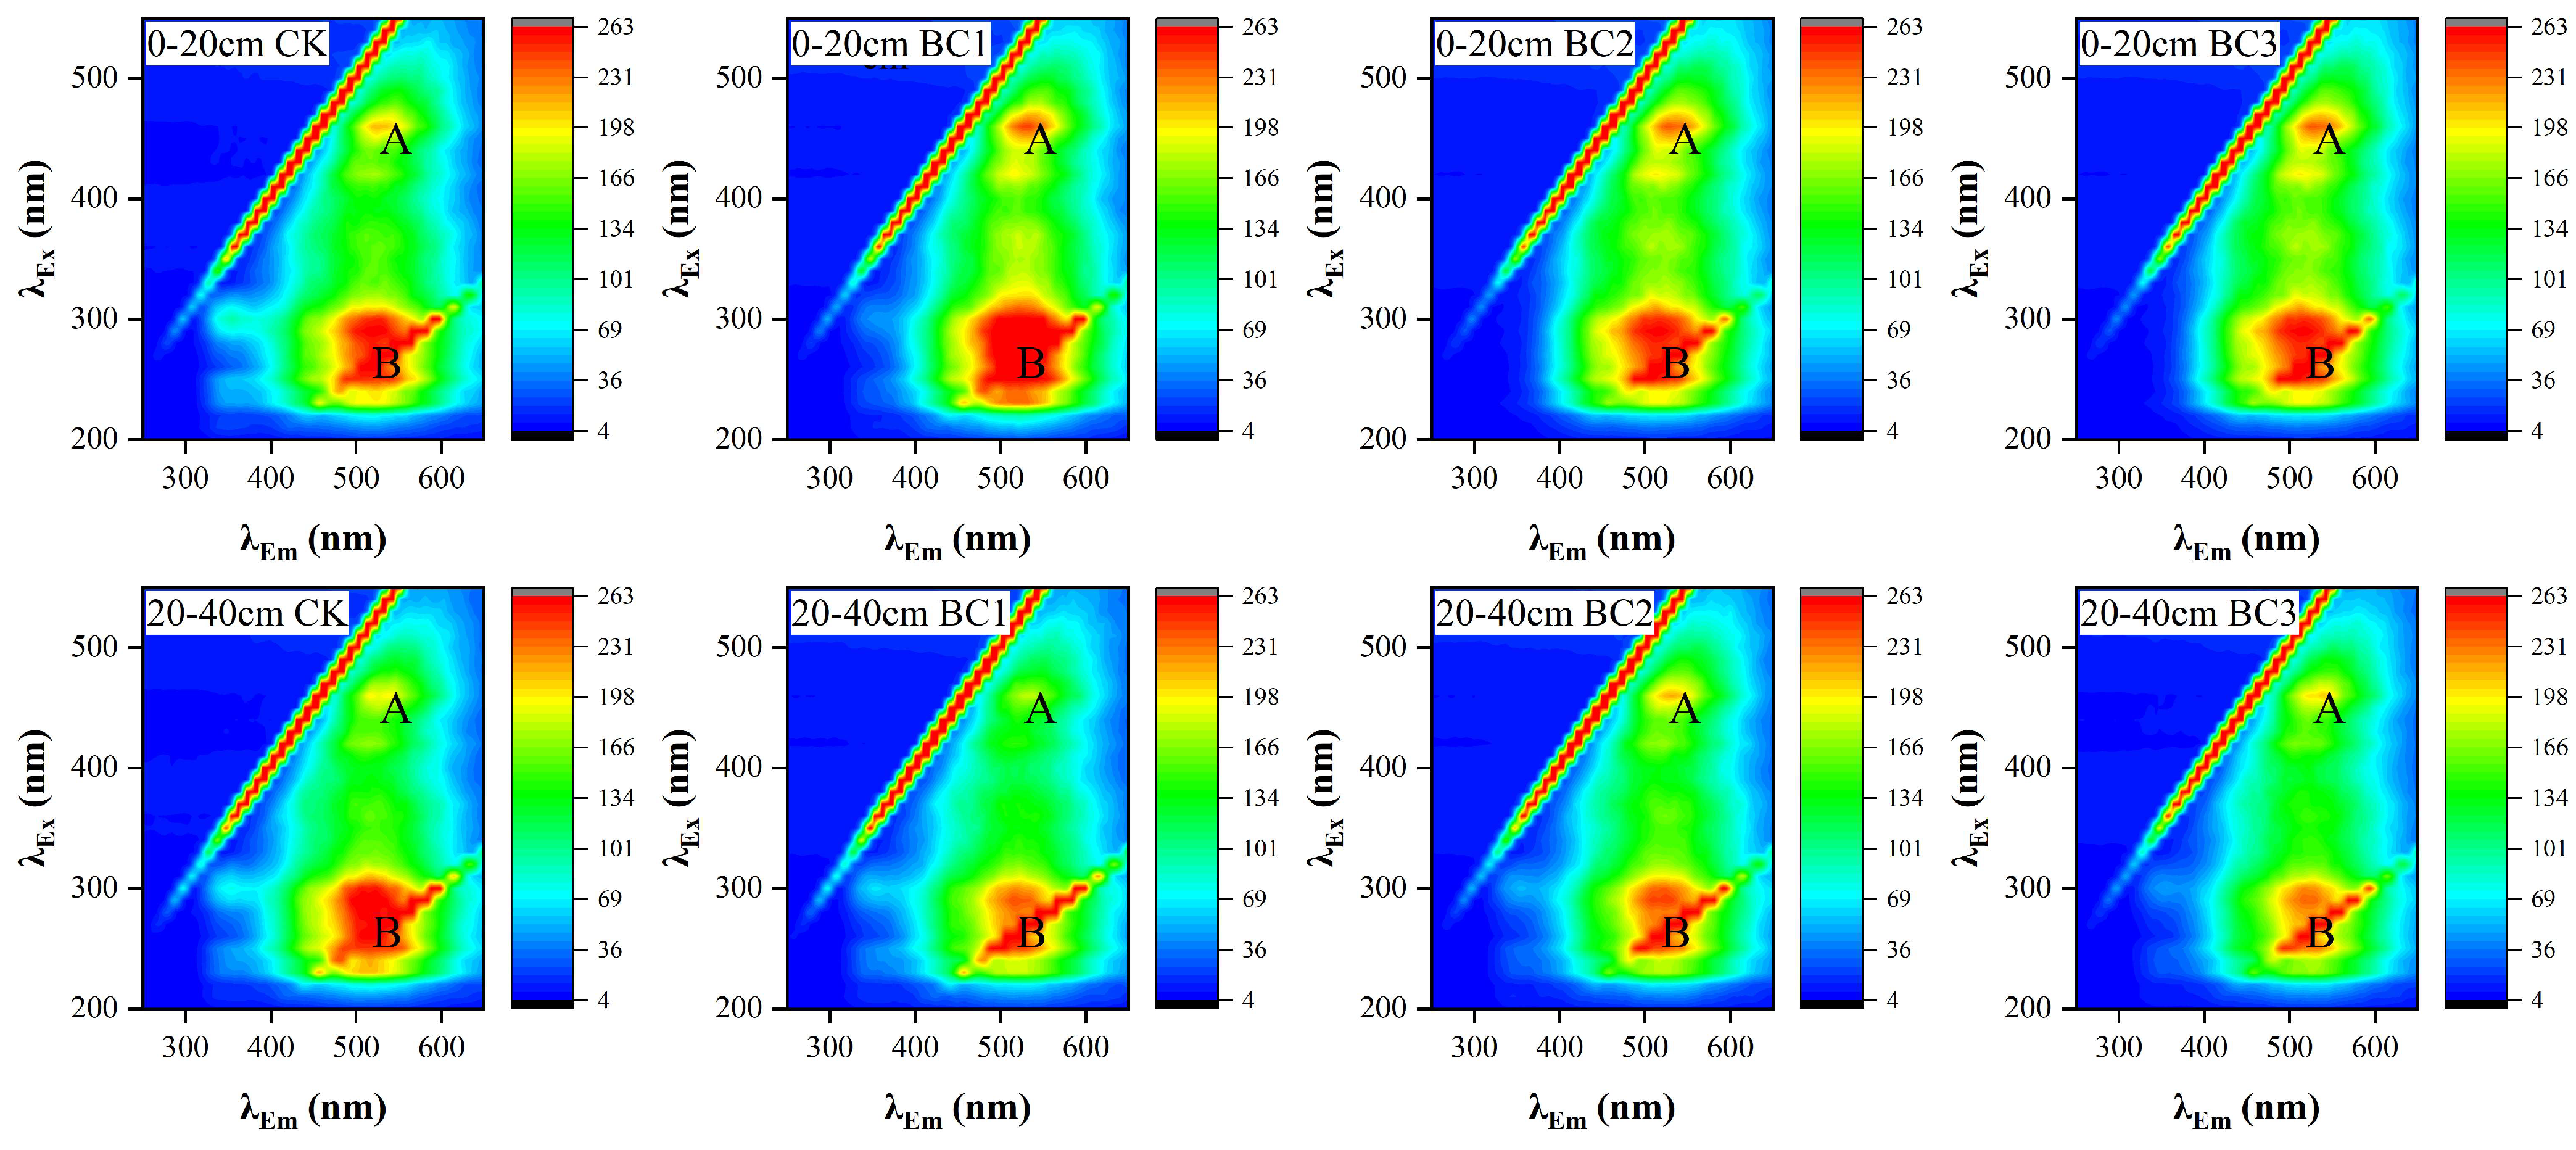
Figure 6.
Changes in rice yield after the addition of biochar. (a): effective number of spikes, (b): spike weight, (c): number of grains per spike, (d): 1000-grain weight, (e): yield. CK: no biochar added; BC1: 5 t ha−1 of biochar returned to the field; BC2: 10 t ha−1 of biochar returned to the field; BC3: 20 t ha−1 of biochar returned to the field. Different lowercase letters indicate significant differences between treatments (p < 0.05).


Table 1.
Relative intensities of the main absorption peaks of HA’s infrared spectra after the addition of biochar.
Table 1.
Relative intensities of the main absorption peaks of HA’s infrared spectra after the addition of biochar.
| Depth (cm) | Treatment | 2920 cm−1 | 2850 cm−1 | 1720 cm−1 | 1620 cm−1 | I2920/I1720 | I2920/I1620 |
|---|---|---|---|---|---|---|---|
| 0–20 | CK | 2.68 ± 0.17 a | 1.00 ± 0.09 a | 10.74 ± 0.55 a | 12.02 ± 1.79 a | 0.25 ± 0.01 a | 0.223 ± 0.03 a |
| BC1 | 2.07 ± 1.02 a | 1.07 ± 0.16 a | 10.26 ± 1.00 a | 12.63 ± 1.04 a | 0.21 ± 0.11 a | 0.17 ± 0.09 a | |
| BC2 | 2.67 ± 0.20 a | 1.02 ± 0.15 a | 11.13 ± 0.63 a | 13.14 ± 1.13 a | 0.24 ± 0.03 a | 0.20 ± 0.03 a | |
| BC3 | 2.61 ± 0.24 a | 1.09 ± 0.13 a | 10.41 ± 0.33 a | 12.45 ± 1.21 a | 0.25 ± 0.02 a | 0.21 ± 0.04 a | |
| 20–40 | CK | 2.70 ± 0.08 b | 1.03 ± 0.02 b | 10.05 ± 0.46 b | 13.01 ± 1.87 d | 0.27 ± 0.02 ab | 0.21 ± 0.04 a |
| BC1 | 2.83 ± 0.11 b | 1.01 ± 0.06 b | 11.22 ± 0.76 a | 16.64 ± 0.81 c | 0.25 ± 0.02 b | 0.17 ± 0.01 ab | |
| BC2 | 2.72 ± 0.48 b | 1.22 ± 0.08 a | 10.30 ± 0.35 ab | 20.70 ± 0.79 b | 0.27 ± 0.05 ab | 0.13 ± 0.03 b | |
| BC3 | 3.37 ± 0.06 a | 1.12 ± 0.13 ab | 10.44 ± 0.33 ab | 24.05 ± 0.36 a | 0.32 ± 0.01 a | 0.14 ± 0.01 b |
CK: no biochar added; BC1: 5 t ha−1 of biochar returned to the field; BC2: 10 t ha−1 of biochar returned to the field; BC3: 20 t ha−1 of biochar returned to the field. Different lowercase letters indicate significant differences between treatments (p < 0.05).
Table 2.
Fluorescence intensity of HA’s excitation/emission (Ex/Em) wavelengths and peaks after the addition of biochar.
Table 2.
Fluorescence intensity of HA’s excitation/emission (Ex/Em) wavelengths and peaks after the addition of biochar.
| Depth (cm) | Treatment | Peak A | Peak B | ||
|---|---|---|---|---|---|
| Ex/Em | FI (a.u.) | Ex/Em | FI (a.u.) | ||
| 0–20 | CK | 460/525 | 243.42 ± 5.92 a | 280/530 | 242.03 ± 17.47 a |
| BC1 | 460/525 | 235.36 ± 5.70 a | 280/525 | 253.95 ± 4.66 a | |
| BC2 | 460/529 | 217.53 ± 5.43 b | 280/522 | 253.56 ± 8.57 a | |
| BC3 | 460/525 | 212.60 ± 2.82 b | 280/516 | 239.64 ± 11.44 a | |
| 20–40 | CK | 460/530 | 243.29 ± 2.15 a | 280/526 | 248.26 ± 16.21 a |
| BC1 | 460/522 | 202.48 ± 3.59 b | 280/516 | 220.18 ± 2.42 b | |
| BC2 | 460/523 | 195.59 ± 4.09 c | 280/530 | 209.89 ± 3.40 bc | |
| BC3 | 460/524 | 152.84 ± 5.52 d | 280/528 | 200.90 ± 4.73 c | |
CK: no biochar added; BC1: 5 t ha−1 of biochar returned to the field; BC2: 10 t ha−1 of biochar returned to the field; BC3: 20 t ha−1 of biochar returned to the field. Different lowercase letters indicate significant differences between treatments (p < 0.05).
Disclaimer/Publisher’s Note: The statements, opinions and data contained in all publications are solely those of the individual author(s) and contributor(s) and not of MDPI and/or the editor(s). MDPI and/or the editor(s) disclaim responsibility for any injury to people or property resulting from any ideas, methods, instructions or products referred to in the content. |
© 2024 by the authors. Licensee MDPI, Basel, Switzerland. This article is an open access article distributed under the terms and conditions of the Creative Commons Attribution (CC BY) license (https://creativecommons.org/licenses/by/4.0/).
Share and Cite
MDPI and ACS Style
Yang, C.; Dou, S.; Guo, D.; Zhao, H. The Application of Biochar Enhances Soil Organic Carbon and Rice Yields. Agronomy 2024, 14, 455. https://doi.org/10.3390/agronomy14030455
AMA Style
Yang C, Dou S, Guo D, Zhao H. The Application of Biochar Enhances Soil Organic Carbon and Rice Yields. Agronomy. 2024; 14(3):455. https://doi.org/10.3390/agronomy14030455
Chicago/Turabian StyleYang, Chuang, Sen Dou, Dan Guo, and Hangjin Zhao. 2024. "The Application of Biochar Enhances Soil Organic Carbon and Rice Yields" Agronomy 14, no. 3: 455. https://doi.org/10.3390/agronomy14030455
Note that from the first issue of 2016, this journal uses article numbers instead of page numbers. See further details here.