Article

Soil Gaseous Carbon Emissions from Lettuce Fields as Influenced by Different Irrigation Lower Limits and Methods

1
College of Horticulture, Fujian Agriculture and Forest University, Fuzhou 350007, China
2
College of Agricultural Science and Engineering, Hohai University, Nanjing 210098, China
3
Nanjing Institute of Environmental Sciences, Nanjing 210042, China
*
Author to whom correspondence should be addressed.
These authors contributed equally to this work.
Agronomy 2024, 14(3), 563; https://doi.org/10.3390/agronomy14030563
Submission received: 28 January 2024 / Revised: 14 February 2024 / Accepted: 10 March 2024 / Published: 11 March 2024

Abstract

:
Lettuce is a water-sensitive stem-used plant, and its rapid growth process causes significant disturbances to the soil. Few studies have focused on the gaseous carbon emissions from lettuce fields under different irrigation methods. Therefore, this study investigated the effect of different drip-irrigation lower limits and methods (drip and furrow irrigation) on greenhouse gas (CO2, CH4) emissions from lettuce fields. Thus, drip irrigation (DI) was implemented using three different lower limits of irrigation corresponding to 75%, 65%, and 55% of the field capacity, and named DR1, DR2, and DR3, respectively. Furrow irrigation (FI) was used as a control treatment. The CO2 and CH4 emission fluxes, soil temperature, and soil enzyme activities were detected. The results showed that the cumulative CO2 emission was highest under DR3 and relatively lower under DR1. For the FI treatment, the cumulative CO2 emission (382.7 g C m−2) was higher than that under DR1 but 20.2% lower than that under DR2. The cumulative CH4 emissions under FI (0.012 g C m−2) were the greatest in the whole lettuce growth period, while DR2 and DR3 treatments emitted lower amounts of CH4. The irrigation method considerably enhanced the activity of urease and catalase, meanwhile promoting CO2 emission. The low irrigation amount each time combined with high irrigation frequency reduced soil CO2 emission while increasing CH4 emission. From the perspective of the total reduction of gaseous carbon, DR1 is the optimal drip irrigation method among all the irrigation lower limits and methods.

1. Introduction

Climate change is a serious global issue due to increasing environmental pollution and the fast expansion of agricultural lands. Gaseous carbon emissions are released continuously into the atmosphere [1]. The carbon cycle in agroecosystems is the most fundamental ecological process and has a crucial impact on greenhouse gas emissions such as CO2 and CH4 [2]. At the 75th United Nations General Congress [1], China proposed that its carbon dioxide emissions would reach a peak by 2030 and it would achieve carbon neutrality by 2060. Therefore, it is urgent to increase crop production by paying more attention to reducing greenhouse gas emissions and increasing their sequestration.
Agricultural soils are the ecosystems most disturbed by human activities. Under the influence of farming activities such as irrigation and fertilization, these soils are the main source of greenhouse gas emissions [3]. Global soil CO2 and CH4 emissions accounted for 25% of the total CO2 and CH4 emissions [4]. The total carbon emission of U.S. agriculture was about 69.5 million tons of CO2 in 2018, according to a survey by the United States Environmental Protection Agency. Israel (another agricultural powerhouse) emitted 64 million tons of CO2 in 2016, according to the Israel Central Bureau of Statistics in 2019. In China, for a long time, unprofessional irrigation techniques and strategies have seriously damaged the dynamic balance of water and soil and increased the soil emission of gaseous carbon. Therefore, water-saving irrigation has become an inevitable choice in China’s current situation.
Water scarcity and long-term drought have had a negative impact on agriculture, resulting in the need for water-saving and water-efficiency actions. Research on water-saving irrigation has focused chiefly on saving water and improving crop yield. Irrigation approaches such as drip irrigation (DI) seek to increase water-use efficiency while warranting adequate irrigation. DI has been widely utilized in recent years; it results in minimum evaporation and increased crop productivity compared with other irrigation methods [5]. Therefore, understanding water management is essential for increasing crop production and reducing carbon emissions. However, little attention has been paid to carbon emissions and their driving mechanisms. Under the conditions of water-saving irrigation, i.e., drip or spray irrigation, the soil micro-environment tends to be changed. For instance, soil microbial communities and heterotrophic respiration are influenced, resulting in continuous soil carbon pool variations and eventually affecting the regional and global carbon cycle [6]. Yerli et al. [7] evaluated the effect of different levels of domestic wastewater irrigation on soil CO2 emissions at the end of the maize vegetation period. They found that soil organic carbon and CO2 emissions were higher than in clean water. Also, Hou et al. [8] detected that deficit irrigation significantly reduced soil CO2 emissions. Moreover, Edwards et al. [9] revealed that the seasonal CO2 emissions from surface drip irrigation were significantly greater than those from subsurface drip irrigation in a two-year field study.
Lettuce is an important vegetable crop worldwide. In China, lettuce is grown in many regions, with Fujian Province being particularly well-known as a major producer of lettuce in China. Every cultivation season, lettuce requires a significant amount of water resources, which is bound to have an impact on the soil, and subsequently, on soil carbon emissions. Although some studies have explored the effects of water-saving irrigation on carbon emissions [3,8], limited attention has been dedicated to soil carbon emissions from cultivated fields of stem-used plants. For stem-used plants such as lettuce, the response of soil carbon emissions to irrigation is inevitably very different compared to other plants due to the more significant soil disturbance during the fleshy stem expansion. Therefore, irrigation plays a crucial role in stem-used vegetable production, and until now, it has not been determined which irrigation strategy will be more effective in reducing CO2 and CH4 emissions. Thus, the present study hypothesizes that drip irrigation, as a water-saving method, affects gaseous carbon emissions mainly by influencing the soil’s environment and properties. Hence, three different drip irrigation methods were designed in a lettuce field to (1) quantitatively investigate the different irrigation effects on soil gaseous carbon emission, (2) evaluate the relationship between gaseous carbon emission and soil properties under different irrigation schemes, (3) and find out the optimal irrigation method that should be employed as an effective irrigation scheme for reduced greenhouse gas emissions. Moreover, furrow irrigation, a traditional irrigation practice locally, was used for comparison to help understand the impact of changing irrigation methods on gaseous carbon emissions. The current study provides a scientific basis for securing an ecological management strategy for the open-field cultivation of lettuce.

2. Materials and Methods

2.1. Experimental Site

The experiment was conducted from 20 September 2021 to 6 January 2022 at the Fruit in Yun Xiao County (Fruit Science and Technology Demonstration of Old Liberated Area), Fujian Province, China. The experimental area has a subtropical climate and is affected by the maritime monsoon. The absolute maximum and minimum temperatures are 38.1 °C and −0.2 °C, respectively. The annual mean temperature is 21.3 °C. The soil in the experiment is classified as ferrallitic soil, with a pH of 5.9, a bulk density of 1.26 g cm−3, an organic matter content of 3.45%, a field capacity of 29.8%, and available N, P, and K of 90.2, 12.2 and 152.3 mg kg−1, respectively. The monthly rainfall during the experiment was 122.9 mm in September 2021, 57.8 mm in October 2021, 46.2 mm in November 2021, 42.7 mm in December 2021, and 77.8 mm in January 2022. During the experiment, the average wind speed was 7.4–12.4 km h−1, the temperature was 15.5–29.1 °C, and the relative humidity was 66–73%.

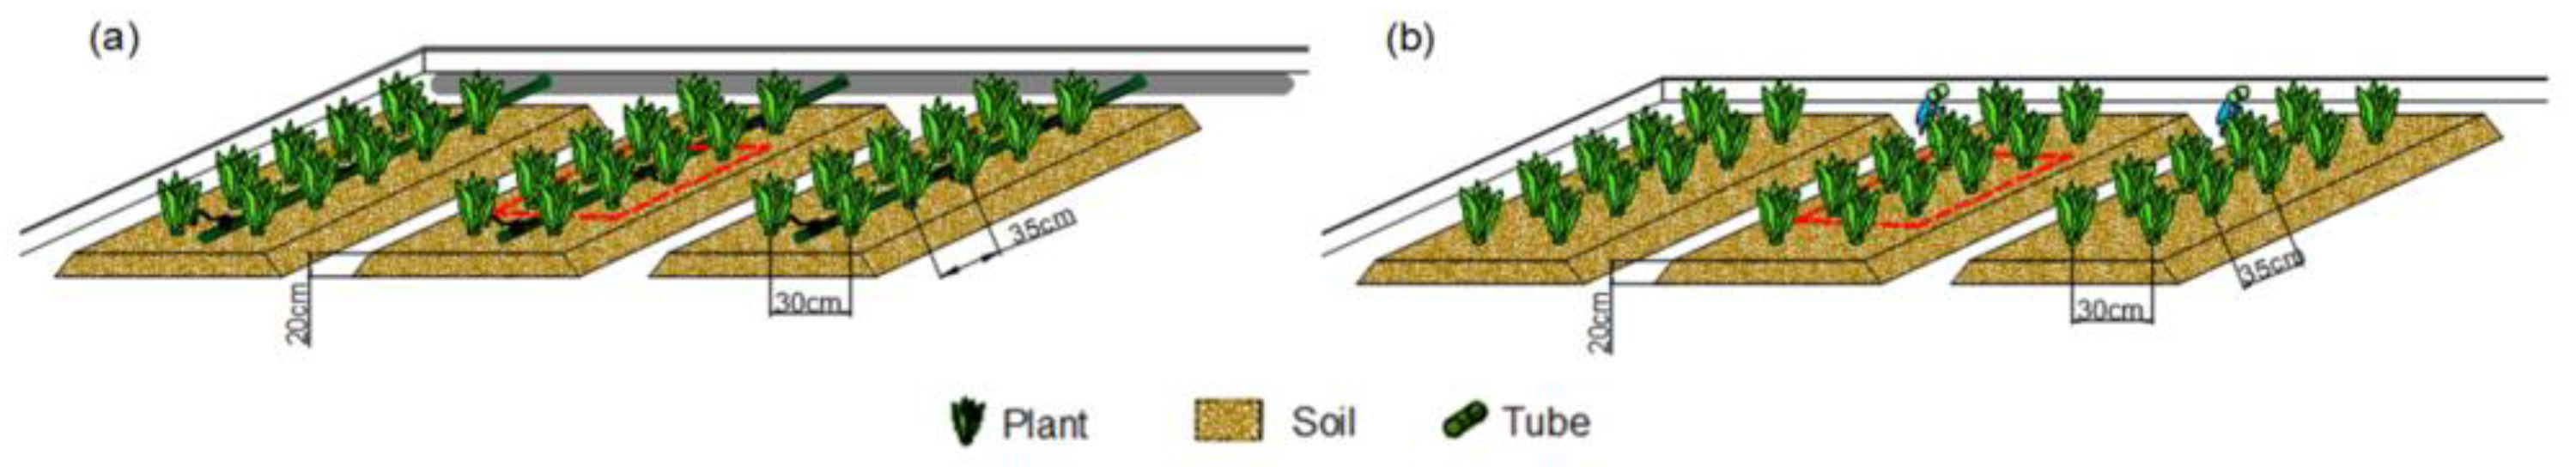
2.2. Experimental Design, Cropping Practices, and Treatments

The open-field experiment used a single-factor randomized block design with four treatments and three replicates. The plot area was 32 m2 (4 m × 8 m), and the total experimental area was divided into 12 blocks. A 0.3 m protection row was set between the plots. Lettuce seedlings (‘Feiqiao No. 1’ species, Lactuca sativa var. angustana Irish) were cultivated for 25 days. Seedlings were transplanted into the field as they had 4–5 true leaves. Each block employed the ridge (width of 60 cm and height of 20 cm) planting method, and the lettuce seedlings were planted at three ridges of lettuce in each plot, with row intervals of 30 cm and planting intervals of 35 cm (Figure 1). A soil ridge was left between treatments to prevent water seepage.
The main plots used the drip irrigation (DI) and furrow irrigation (FI) methods, with four irrigation treatments: DR1, DR2, DR3, and FI, respectively. Irrigation treatments were managed as follows: irrigating until reaching 95% of the field capacity (upper limitation) when the soil water content reached 75% of the field capacity (lower limit)—DR1; irrigating until reaching 95% of the field capacity (upper limitation) when the soil water content reached 65% of the field capacity (lower limit)—DR2; irrigating until reaching 95% of the field capacity (upper limitation) when the soil water content reached 55% of the field capacity (lower limit)—DR3; and the same irrigation quota (amount for each irrigation event) as DR2 but using furrow irrigation—FI. Irrigation events were reiterated during the critical growth stages of lettuce, including the rosette and fleshy stem enlargement stages (Table 1). The soil moisture in each treatment was monitored using the drying method, and once it reached the designed irrigation lower limit, the water was supplied. The irrigation quota was calculated according to the following equation [10]:
M = S × r × h × Q × q 1 q 2 / 0.95
where M is the volume of applied water for each irrigation time (m3); S is the total irrigated area (m2); r is the soil bulk density (kg m−3); h is the intended wetness soil layer (0.2 m); Q is the field capacity (%); q1 is the designed upper irrigation limit (0.95), q2 is the lower limit; and 0.95 is the efficiency of irrigation that considered water loss.
As a local practice, farmers use FI, irrigating until they reach a water level of one-third of the height of the ditch. In their practice, the amount of water supply for FI was similar to the DR2 treatment in this study. The division of lettuce growth stages is shown in Table 2.
The detailed irrigation information for the four irrigation schemes is shown in Table 1.
Chemical fertilizers used in the experiment were applied as topdressing and basal fertilizers. The fertilizers used in this study were urea, calcium superphosphate, and potassium sulfate, with a total dosage of 675 kg/ha, 600 kg/ha, and 375 kg/ha, respectively. As a local practice, superphosphate fertilizer was applied as the base fertilizer. However, the urea and potassium sulfate were supplied as basal fertilizer at a rate of 20%, a first topdressing at a rate of 40%, and a second topdressing at a rate of 40%. The plant disease prevention program was applied during the entire growth period according to the local farmers’ practice, and the same was applied for all the treatments.

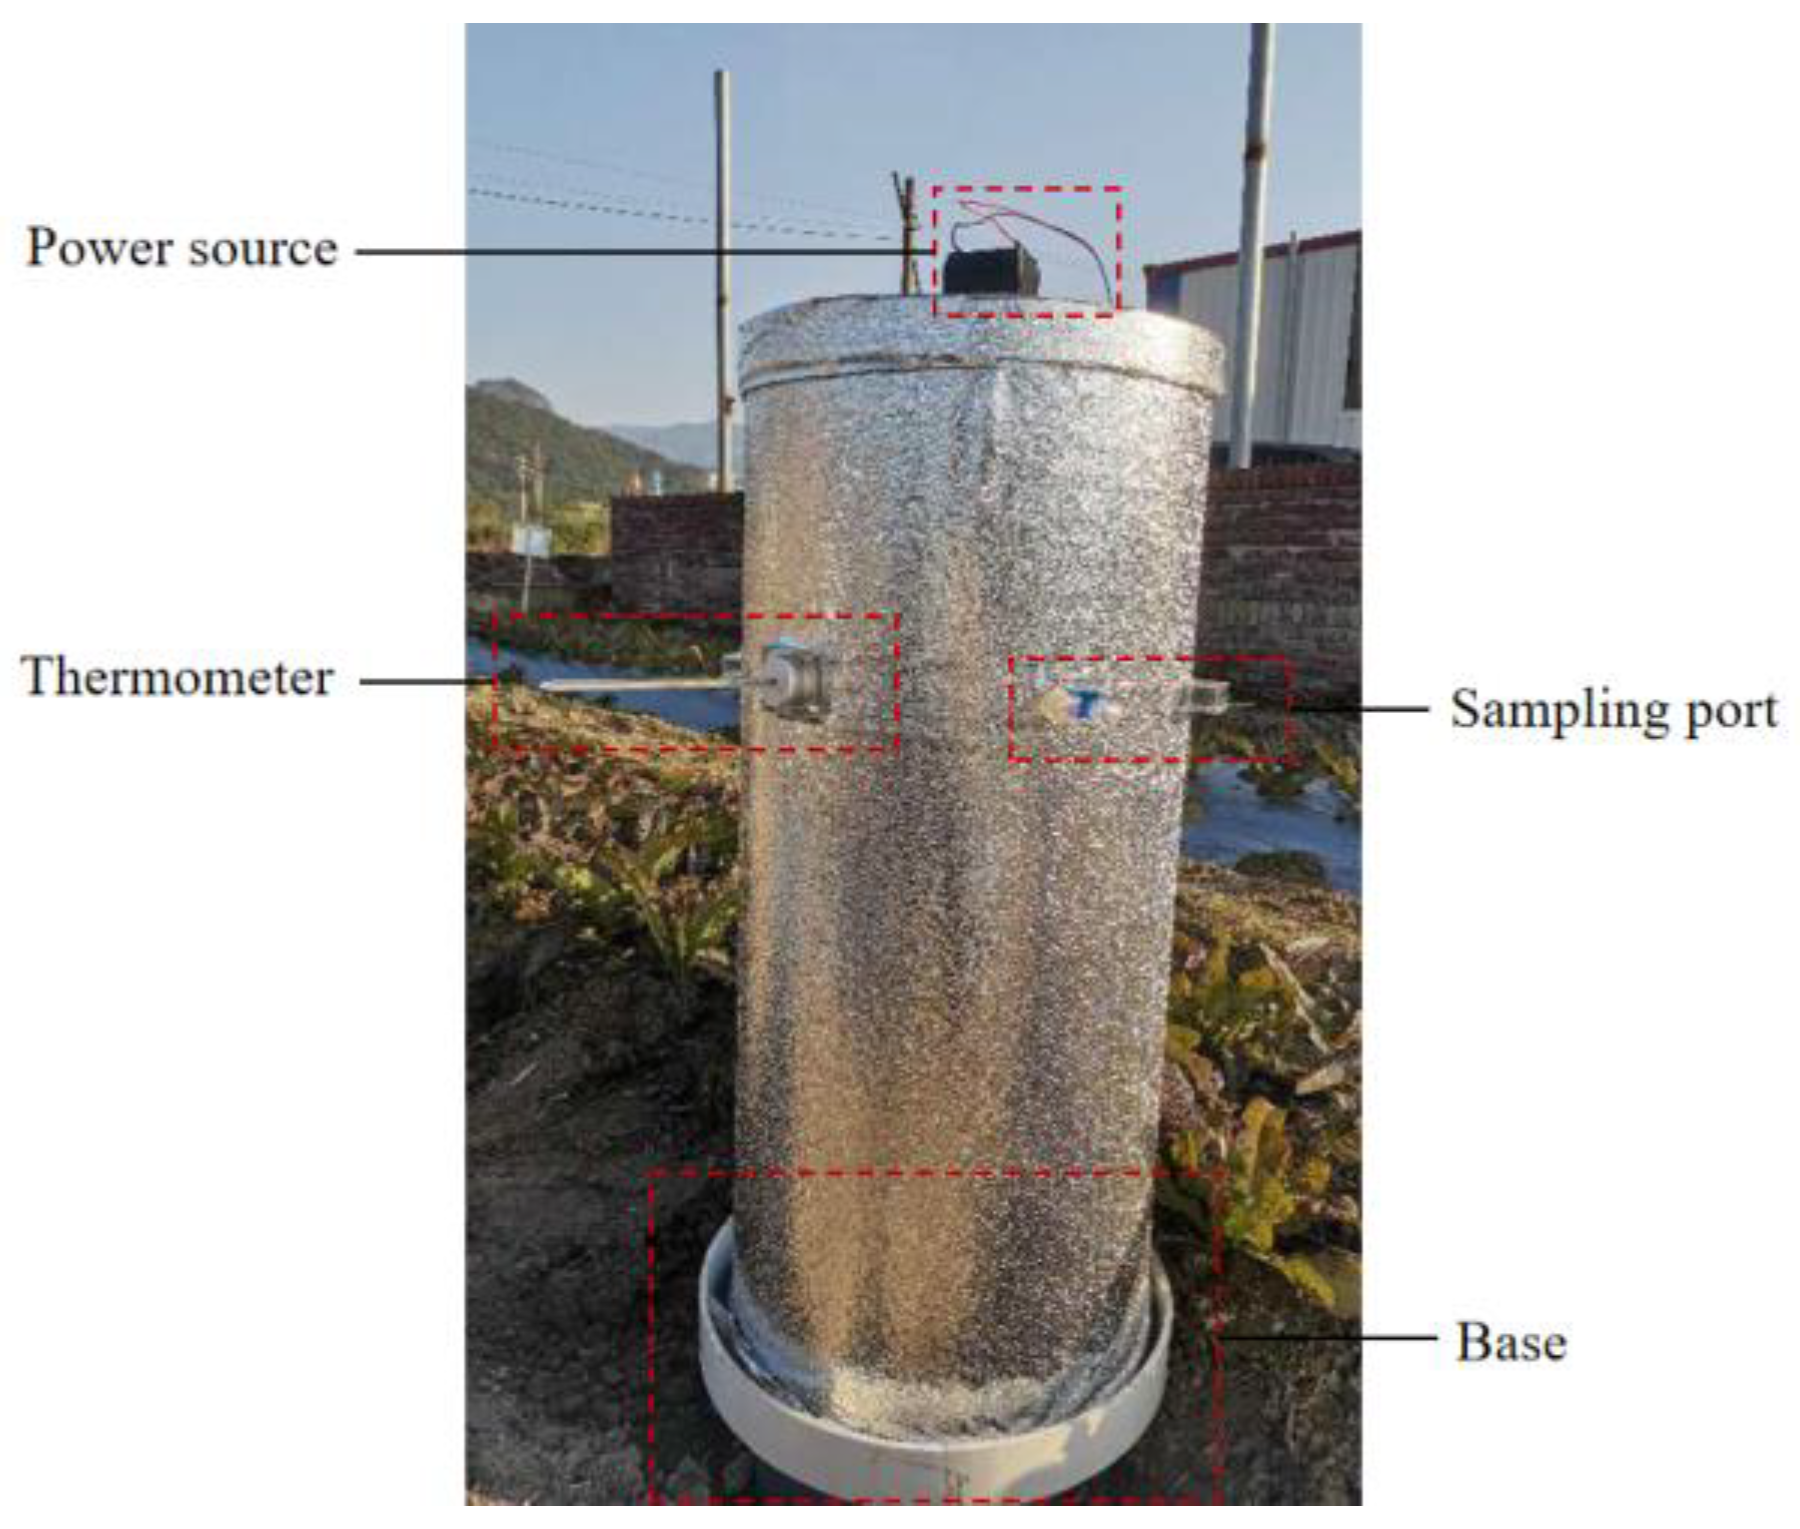
2.3. Sampling and Measurement

A self-made cylindrical collection device (chamber) was used to collect the gas samples. The entire chamber was made of PVC material, with a height of 80 cm and a diameter of 30 cm. This chamber’s principle was that the chamber’s lower base could be buried in the soil and the upper cover could be placed on the base. In contrast, these two could be connected seamlessly by sealing with a water-filled tank before the collection. A layer of reflective film (silver color) was enclosed outside of the chamber. When collecting the gas samples, the upper cover and the lower base were connected, and the small fan inside the chamber was turned on to ensure the even mixing of gas. A rechargeable battery provided the power of the fan. For each replication, three chambers were used.
Each plot’s sampling point was fixed, and 13 collections were conducted throughout the entire lettuce growth period. The first collection date was the second day after transplantation, and the collection interval was seven days. A monitor logged each collection time, and the specific time was from 8:00 to 9:00. Each time the gas was collected, the gas sample was extracted using a 50 mL syringe 0, 10, 20, and 30 min after the chamber was sealed. Then, the gas was pushed into a 40 mL gas-collection bottle. After completing all collections, all gas bottles were taken into the laboratory for CO2 and CH4 emission flux measurement. The instrument used for measurement was the gas chromatograph (Agilent 7890B, produced by Agilent Technologies of America, Santa Clara, CA, USA).
The soil temperature was measured after each gas collection (Figure 2). Moreover, the moisture content was measured using the drying method after collecting the surface soil samples using the five-point method under the base. The moisture data were used to calculate the soil water-filled pore spaces (SWPS, %). Meanwhile, the surface soil samples under the base were collected using the five-point method, 22 and 57 days after transplanting, for the soil chemical indicator analysis. The collected soils were divided into two parts. One part was naturally dried, ground, and passed through a sieve with a 0.15 mm pore size to determine the soil organic matter content using the external heating method of potassium dichromate–sulfuric acid oxidation [11]. The other sample part was used to determine the soil enzyme activity. The dehydrogenase activity was determined by the triphenyl tetrazolium chloride (TTC) colorimetric method using a spectrophotometer: after reacting 1 g of soil sample with 0.5% TTC-Tris buffer, we added 10 mL ethanol and centrifuged at 4000 rpm for 5 min before determining the absorbance of the supernatant (722S Shanghai Chengguang Instrument Co., Ltd., Shanghai, China), and we expressed the result as TPF μg g−1 d−1. The urease activity was determined by the sodium phenol colorimetric method: we added 1 mL toluene to a 5 g soil sample, mixed well, and then added 10 mL urea (10%) solution and 20 mL citrate buffer solution before incubating at 37 °C for 24 h. After filtration, we took 3 mL of the filtrate and added it to a 50 mL volumetric flask to reach a constant volume. Then, we added 4 mL sodium phenolate solution and 3 mL sodium hypochlorite (0.9%) solution and mixed well, measuring the absorbance of the solution using the same instrument as TTC) and expressing the results as NH3-N mg g−1 d−1. The catalase activity was determined by the KMnO4 volumetric method: we took a 5 g soil sample and added 0.5 mL toluene, shaking well; then, we added 25 mL of 3% H2O2 solution and 25 mL of 2 mol L−1 H2SO4 solution before shaking well and filtering. We took 1 mL filtrate, added 5 mL of distilled water and 5 mL of 2 mol/L H2SO4 solution, and then titrated it with KMnO4 solution). The results are expressed as 0.1 mol KMnO4 mL g−1 h−1 [12,13].

2.4. Determination of CO2 and CH4 Emission Fluxes

CO2 and CH4 emission fluxes were calculated according to the following equation:
F = ρ × H × 273 / ( 273 + T ) × d c / d t
where F is the CO2 or CH4 emission flux (mg C m−2 h−1); ρ is the CO2 or CH4 density in standard condition, i.e., 1.977 and 0.717 kg m−3; H is the height of the upper cover (m); T is the actual temperature in the cover when determining (°C); and dc/dt is the variation rate of CO2 or CH4 concentration (mL L−1 h−1). Since the air pressure in the chamber is nearly unchanged, the influence of the air pressure on the emission flux of CO2 or CH4 is neglected.
The following formula calculated the accumulated soil CO2 or CH4 emissions:
M = ( F i + 1 + F i ) / 2 × ( t i + 1 t i ) × 24 × 10 5
where M is the accumulated CO2 or CH4 emissions (g C m−2); F is the ith CO2 or CH4 emission flux (mg C m−2 h−1); i is the number of measurements; and ti+1ti is the number of days between two measurements (d).
The SWPS can be obtained according to the following equation.
S W P S = ( ρ 1 ρ / 2.65 ) × Q w
In the formula, ρ is the bulk density of the experimental soil (g cm−3); 2.65 is the density of the experimental soil (g cm−3); and Qw is the soil mass moisture content (%).

2.5. Statical Analysis

The data were input into SPSS 17.0 software for statistical analysis (0.05 level) according to Duncan’s multiple range test.

3. Results

3.1. Effect of Different Irrigation Schemes on CO2 Emissions

The effects of different irrigation systems on soil CO2 emission flux (a) and cumulative CO2 emission (b) are shown in Figure 3. There was a fluctuating variation in CO2 emission fluxes at the early stage, with a sharp increase 50 to 64 days after transplanting. Moreover, 64 days after transplanting, the fluxes peaked and then gradually decreased. The CO2 emission fluxes for the drip irrigation schemes showed a difference of DR3 > DR2 > DR1 at 2 days after transplant. The fluxes reached 425.6 mg C m−2 h−1 under DR3 treatment, indicating that increased single irrigation would increase the CO2 emission fluxes. Under the same irrigation amount, the emission fluxes under DR2 were 23.3% higher than under FI. The differences in CO2 emission fluxes among the treatments were maintained until 43 days after transplanting. However, from 50 to 64 days after transplanting, the highest CO2 emission flux was observed under the DR2 treatment, with a peak value of 725.4 mg C m−2 h−1 at 64 days. From 64 to 83 days after transplanting, the variation trend of CO2 emission fluxes for the treatments was similar, and the CO2 emission fluxes were found to be highest under DR3 and lowest under DR1.
From 2 to 43 days after transplanting, cumulative CO2 emissions were the highest under DR3. Although some differences were found among DR1, DR2, and FI, the differences were not noticeable. From 50 days after transplanting, the differences in cumulative CO2 emissions under different treatments became clear: DR3 had the highest cumulative emission, followed by DR2, and a relatively low emission amount was detected under DR1. DR2 showed a greater increase than other treatments from 50 to 71 days after transplanting. For FI, the cumulative CO2 emissions were higher than DR1 but 20.2% lower than DR2, indicating that the furrow irrigation reduced the cumulative CO2 emissions under the same irrigation quota.

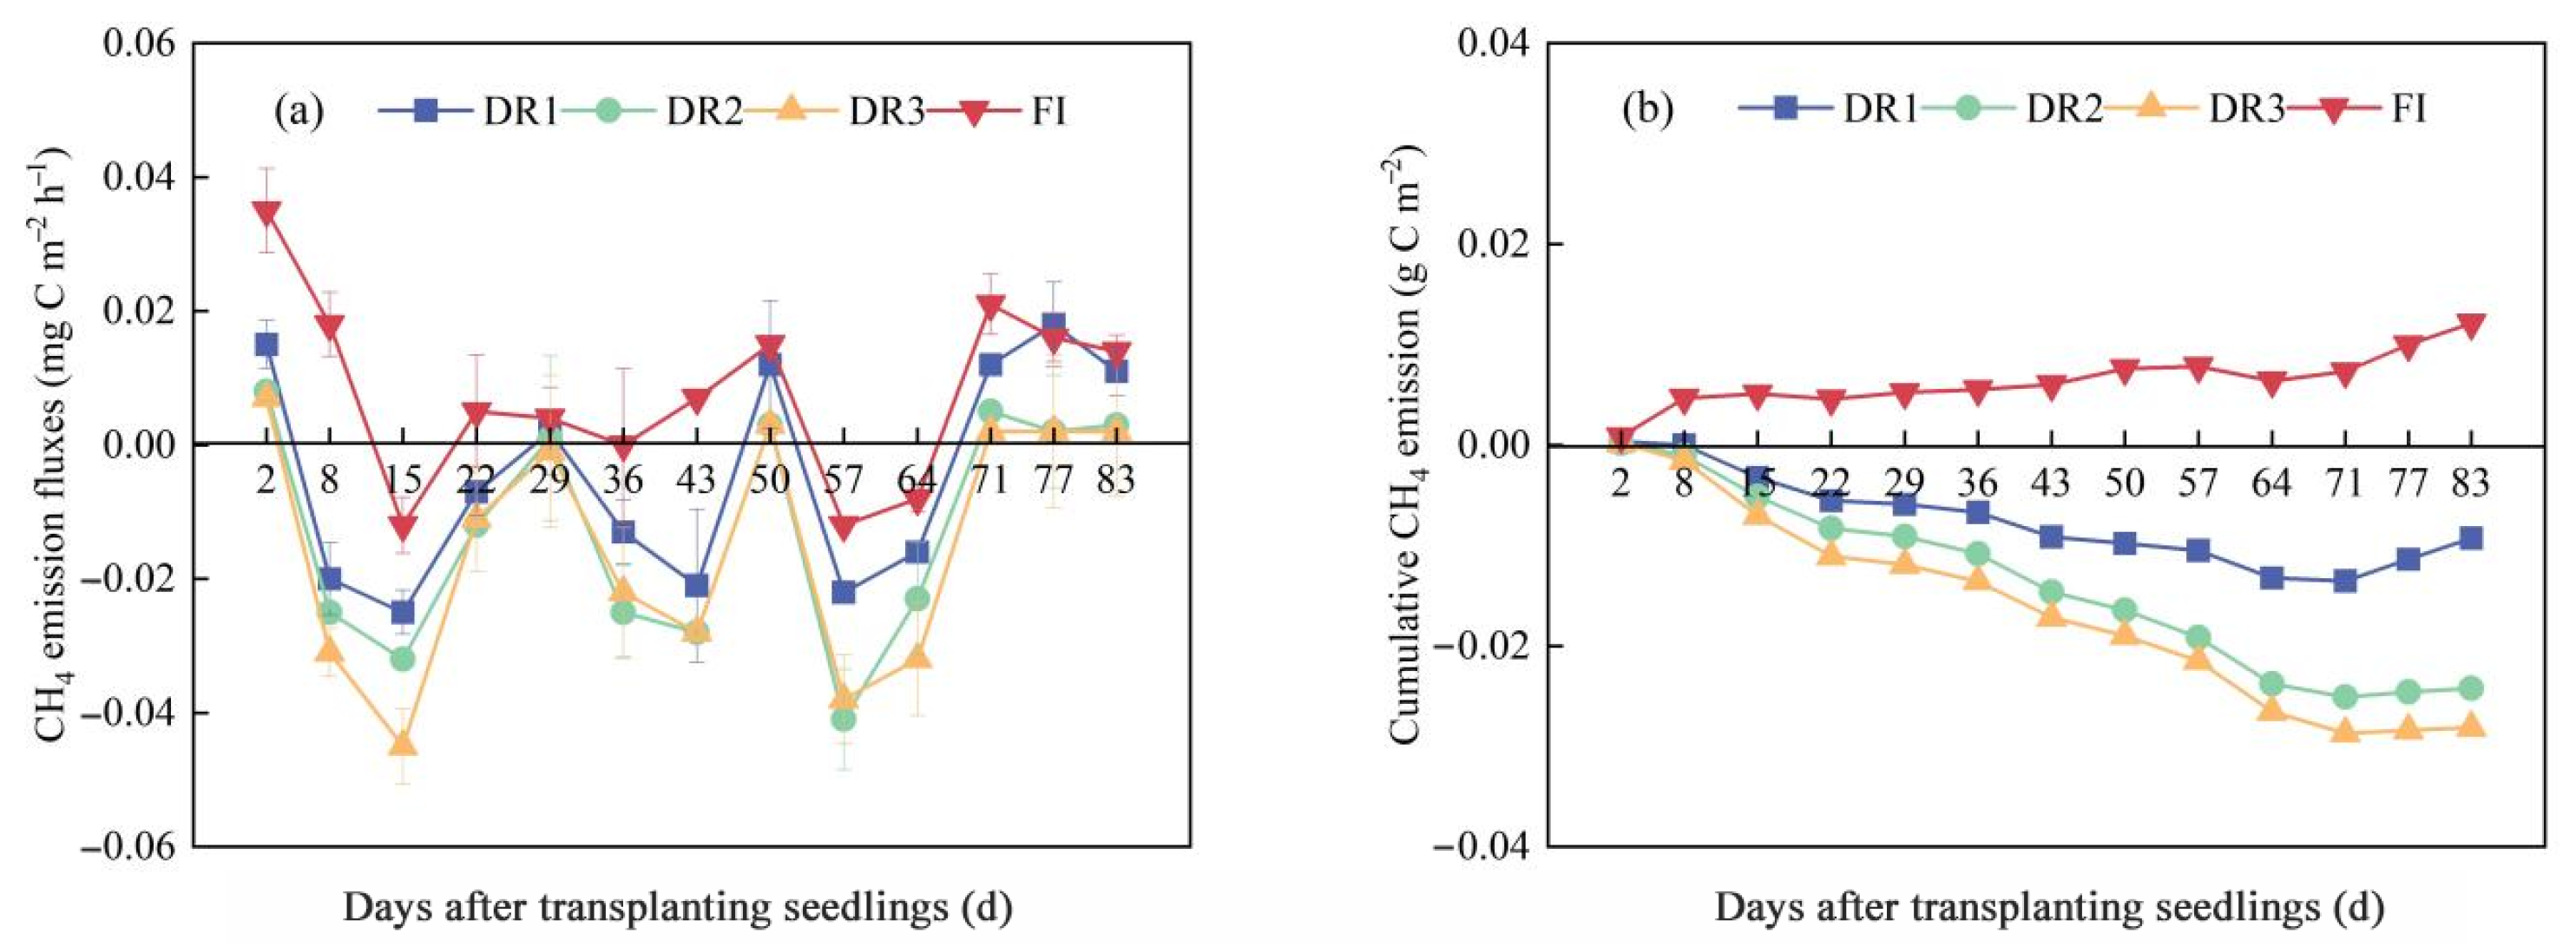
3.2. Effect of Different Irrigation Schemes on CH4 Emissions

The effects of different irrigation schemes on CH4 emission fluxes (a) and cumulative CH4 emissions (b) are shown in Figure 4. The relatively high CH4 emission fluxes occurred at 2, 50, and 71 days, and the low fluxes were observed during 8–15, 36–43, and 57–64 days after transplanting (Figure 4a). The CH4 emission fluxes were overall highest under FI, followed by DR1, and relatively low under DR2 and DR3. The 71–83 days after transplanting were at the end of lettuce growth, when the CH4 emission fluxes under DR2 and DR3 treatments were close to 0, indicating that the soil emission and absorption for CH4 reached a balance.
Unlike the cumulative CO2 emissions, the cumulative CH4 emissions showed both an increase and decrease trend for the different treatments throughout the growth period, mainly due to soil CH4 emission and absorption processes. At 83 days after transplanting, the cumulative CH4 emissions were 0.012 g C m−2 for the FI treatment and −0.009, −0.024, and −0.028 g C m−2 for the DR1, DR2, and DR3 treatments, respectively, indicating that the DR1 treatment had relatively weak absorption or strong emission capacity for CH4, in comparison to other treatments.

3.3. Effect of Different Irrigation Schemes on Soil Enzyme Activity

At 22 days after transplanting, soil dehydrogenase activity was highest in DR3, reached 35.1 TPF μg g−1 d−1, and was significantly (p < 0.05) higher than in DR2 and FI (32.1 and 30.8 μg g−1 d−1). The treatment differences were more pronounced at 57 days after transplanting. At 57 days, the highest dehydrogenase activity was still greatest under DR3, reaching 39.1 μg g−1 d−1, significantly greater than that under DR1 but not significantly (p > 0.05) different from DR2. The lowest dehydrogenase activity was found in FI and was only 29.8 μg g−1 d−1 (Figure 5).
The effect of different irrigation schemes on soil urease activity is shown in Figure 6. The urease activity was at 2.72–2.94 NH3-N mg g−1 d−1 22 days after transplanting. DR3 was slightly higher in urease activity, but the difference among the four treatments was insignificant (p > 0.05). At 57 days after transplanting, the urease activity was observed to be the highest in DR2, reaching 3.91 NH3-N mg g−1 d−1, significantly (p < 0.05) higher than in other treatments; urease activities under DR3 and FI were at intermediate levels and were 3.42 and 3.29 NH3-N mg g−1 d−1 respectively. The urease activity under DR1 was the lowest (3.01 NH3-N mg g−1 d−1).
The effect of different irrigation schemes on soil catalase activity is shown in Figure 7. Similar to urease, soil catalase activity did not show significant (p > 0.05) differences among the different treatments at 22 days after transplanting, with values of 3.81–4.22 0.1 mol KMnO4 mL g−1 h−1 for the different treatments. At 57 days after transplanting, soil urease activity under DR2 was the highest, reaching as high as 4.66 0.1 mol KMnO4 mL g−1 h−1, which was not significantly (p > 0.05) distinct in comparison to DR3 or FI but was significantly (p < 0.05) higher than under DR1 (4.03/0.1 mol KMnO4 mL g−1 h−1).
Under the same irrigation scheme, the activities of enzymes, no matter whether dehydrogenase, urease, or catalase in FI, were lower than those in DR2. This difference was more significant at 57 days after transplanting, indicating that drip irrigation enhanced the soil enzyme activities as lettuce grew into the later stages. Between the two monitoring dates, it was found that the soil urease activity was higher at 57 days than at 22 days, while no similar regularity was found in the dehydrogenase and catalase activity.

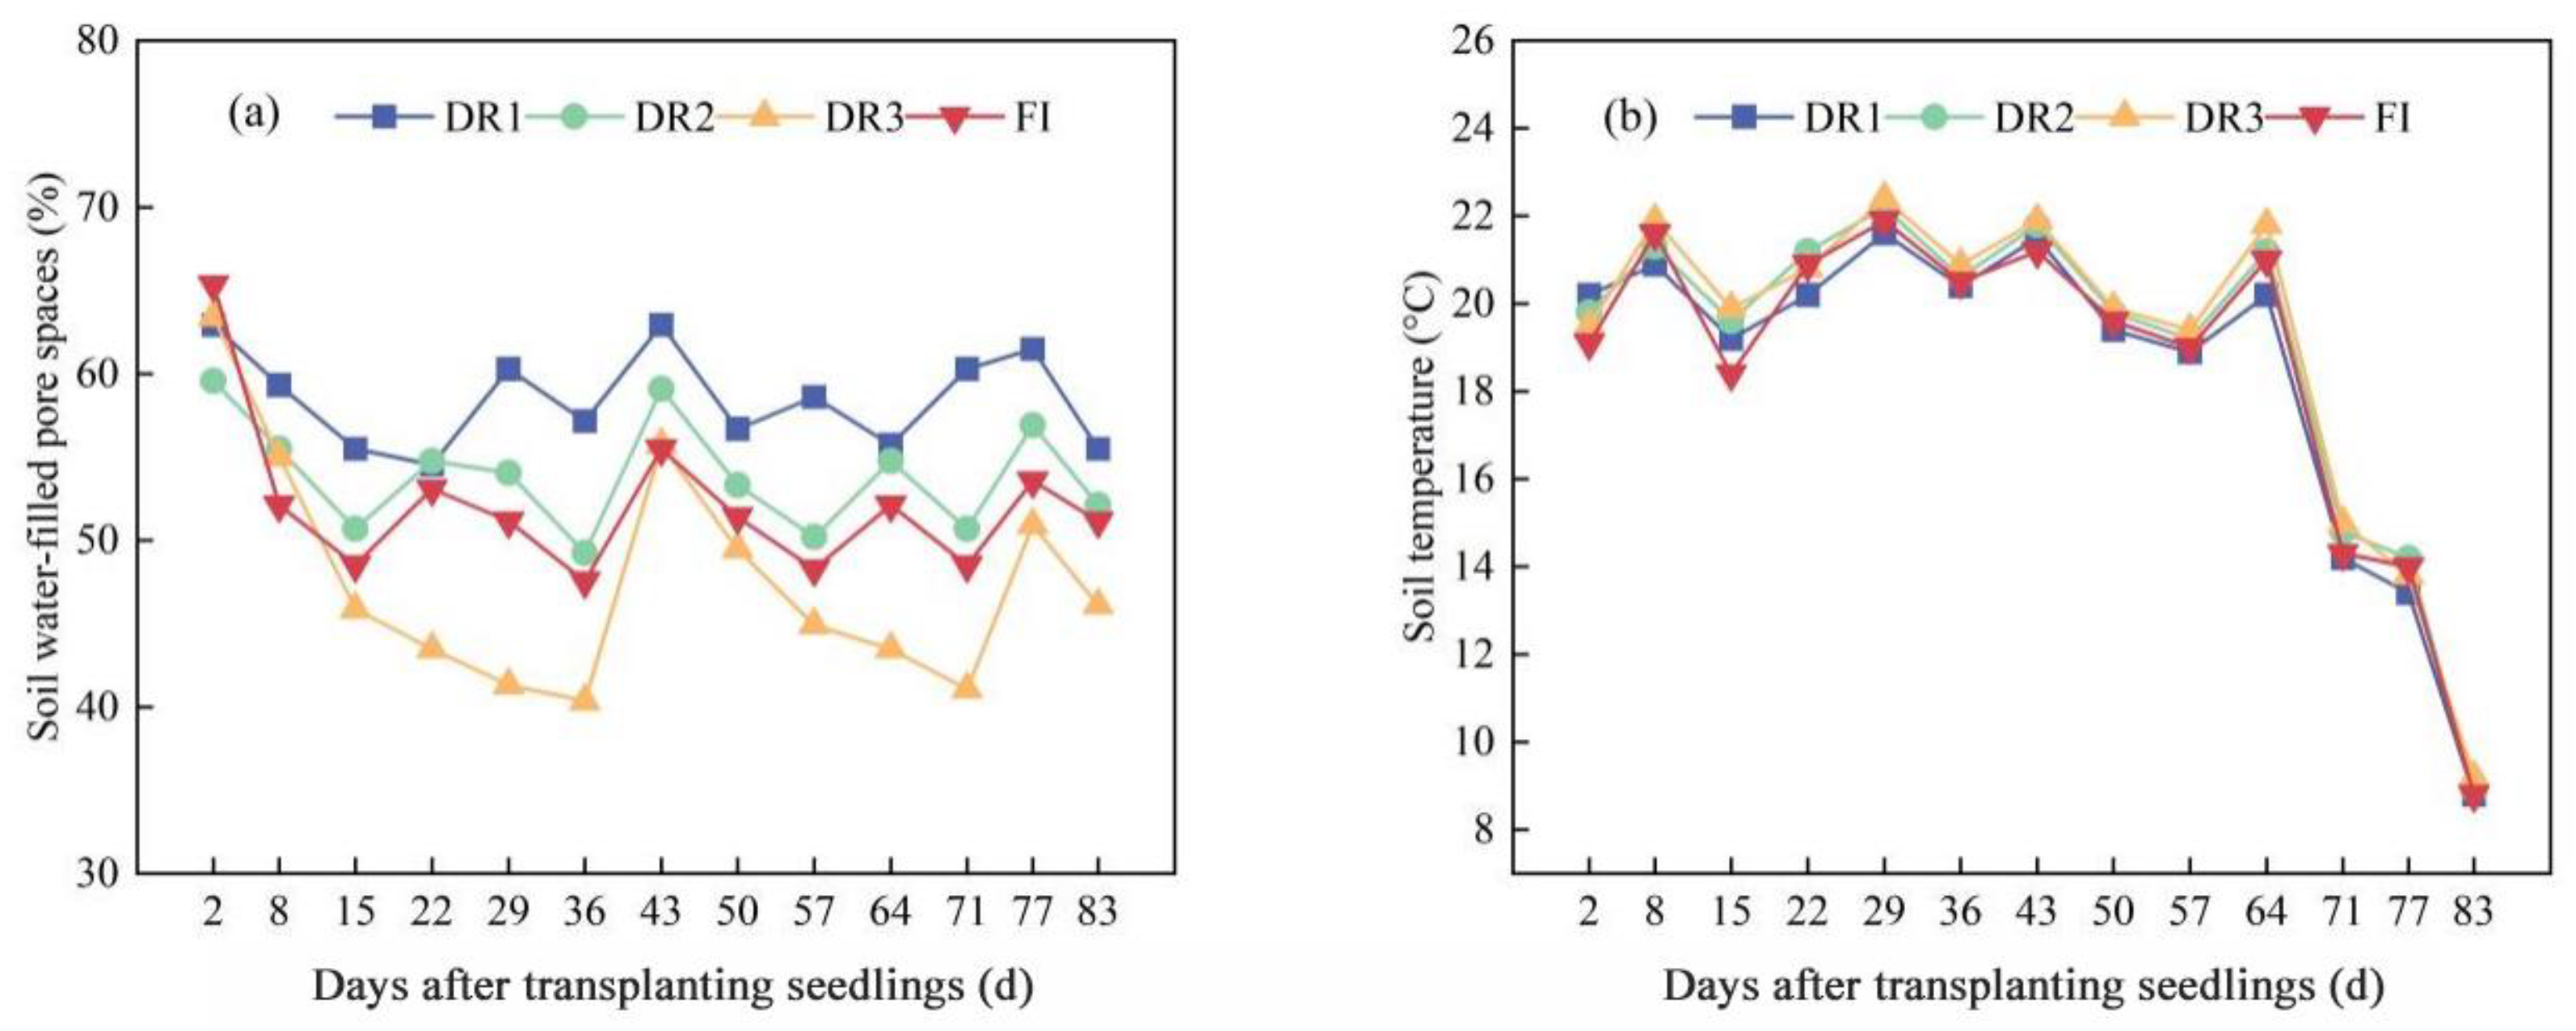
3.4. Effect of Different Irrigation Schemes on Soil Temperature and Moisture

DR1 treatment maintained a relatively high SWPS throughout the growth period, reaching 58.5% on average, while DR3 maintained the lowest level of 47.8% (Figure 8a). The SWPS under DR2 was slightly greater than under FI. The greatest difference in the SWPS among the treatments occurred between 22–36 days and 57–71 days after transplanting throughout the growth period.
Soil temperature remained relatively stable from 2 to 64 days after transplanting and decreased after 64 days, which mainly corresponded to the sharp drop in soil temperature (Figure 8b). The effect of different irrigation schemes on soil temperature was not significant. For the whole period, the mean soil temperatures of DR1, DR2, DR3, and FI treatments were 18.8, 19.3, 19.5, and 19.0 °C, respectively. DR3 treatment was detected in a relatively greater level of soil temperature during the experiment. The mean soil temperature of DR2 was 1.58% higher than FI, and this difference was not obvious.

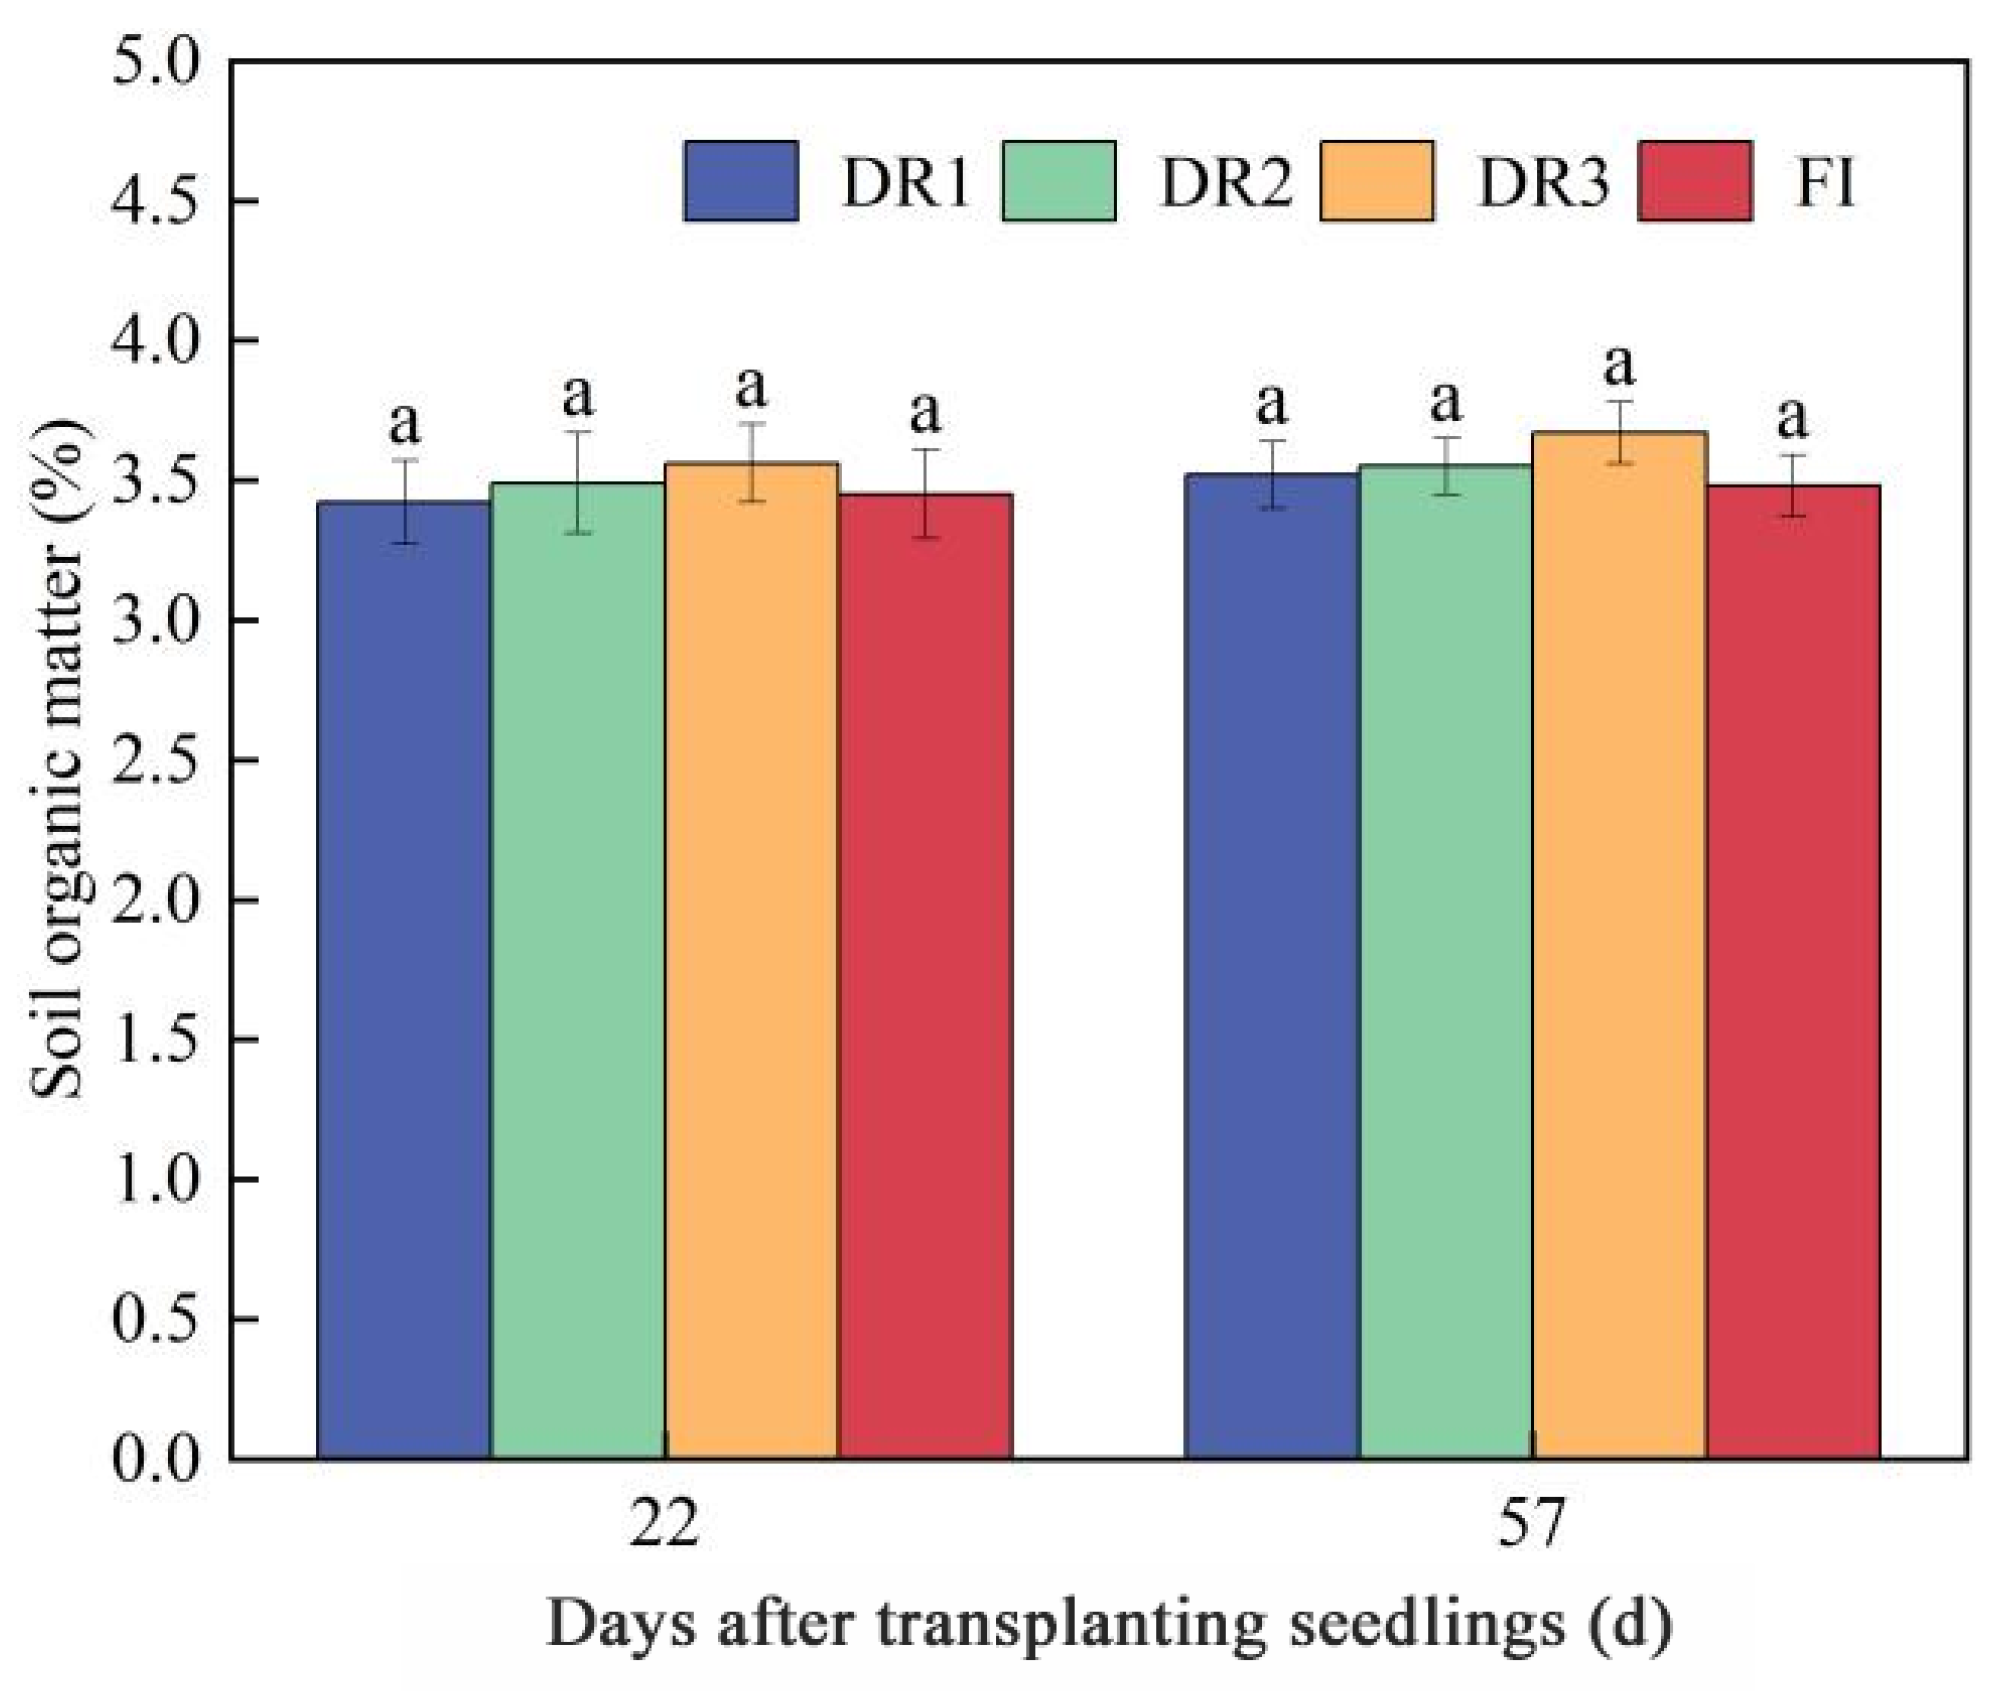
3.5. Effect of Different Irrigation Schemes on Soil Organic Matter Content

The soil organic matter content showed no inter-treatment differences (p > 0.05) at both 22 and 57 days after transplanting, with 3.42–3.56% soil organic matter content at 22 days and 3.48–3.67% at 57 days after transplanting (Figure 9). The soil organic matter contents were very close between the two periods. This showed that the irrigation method or regime does not significantly impact soil organic matter content.

3.6. Correlation Analysis between CO2/CH4 Emission and Possible Impact Factors

The CO2 emission fluxes positively correlated with soil urease and catalase activity (Table 3). The correlations were highly significant (p < 0.01) between CO2 emission fluxes and urease activity and were also significant (p < 0.05) between CO2 emission fluxes and catalase activity. However, the correlation between CO2 emission fluxes and soil temperature, moisture, or organic matter content was insignificant in this experiment. Table 4 displays the correlations between CH4 emission fluxes and possible influencing factors. The CH4 was negatively correlated with soil dehydrogenase, urease, and catalase activities, while it was not significantly correlated with soil temperature, moisture, or organic matter content, respectively.

4. Discussion

The process of soil CO2 emission is also called soil respiration, including plant root respiration, soil animal respiration, soil microbial respiration, and the oxidation of carbon-containing substances [6,14,15]. The soil respiration process is affected by soil temperature, moisture, and external interference [16]. This study detected that the CO2 emission under DR1 treated by high-frequency but low-quota irrigation was the lowest, consistent with Liu et al.’s conclusion [17]. This may be because high-frequency irrigation kept the SWPS at a high level for a longer duration; this reduced the availability of O2 in soil particles, thus decreasing the soil respiration emissions of CO2. The CO2 released from crop roots and their micro-environment accounts for 20–50% of the total [18]. In the early and middle growth stages of this study, the CO2 emission flux under DR2 was in the middle level among the three drip irrigation treatments. However, it increased sharply from 50 to 64 days after transplanting, which might be due to the fact that the rhizosphere soil water conditions created by DR2 were suitable for root growth and development [19], and the increased root biomass promoted the root respiration process that caused the increase in CO2 emission flux.
In this study, there were disputes regarding the influence of different irrigation methods on CO2 emissions. Consistently, Zhang et al. [20] showed that the CO2 emission flux of cotton-field soil under drip irrigation was about 40% higher than that under flood irrigation at the same observation time. On the contrary, Guo et al. [21] found that the CO2 emission flux using drip irrigation during the entire growth period was 36% lower than that using flood irrigation. Zhang et al. [22] also detected that drip irrigation (9.53 t hm−2) was beneficial in reducing CO2 emissions, compared to furrow irrigation with the same quota. Moreover, Wang et al.’s [23] experiment on winter-wheat cultivated soil in the North China Plain discovered that replacing flood irrigation with drip irrigation would not remarkably affect CO2 emissions. Our study was consistent with Zhang et al.’s [22] finding that drip irrigation would increase CO2 emissions compared to furrow irrigation. This might be because under drip irrigation, soil water and pore permeability were appropriate [24], and there was no sharp increase or decrease in soil water and pore O2 content; this created better conditions for plant roots and soil microbial respiration, thus increasing CO2 emissions.
In the current work, there are two main pathways to form CH4. The first pathway is the decomposition of organic matter in soil, which forms an organic acid, and bacteria use organic acid to produce CH4. The second pathway is the decomposition of complex organic matter produced by CO2 and H2, which are converted into CH4 by methanogens under anaerobic conditions [25]. Therefore, the possible factors affecting CH4 emissions might include organic matter, an anaerobic environment, and soil moisture [26]. The irrigation practice has also obvious effects on soil moisture and anaerobic environments. An earlier study showed that the proper control of soil moisture within a certain range was conducive to the absorption of CH4 by soil [27]. However, excessive irrigation will reduce the soil absorption amount of CH4, and continuous irrigation might form positive CH4 emissions [28,29]. In this study, the absorption of CH4 by the DR1 soil was significantly reduced: only about one-third of the DR3 soil. This confirmed previous research conclusions. The reason might be that under the DR1 condition, the anaerobic degree of soil pores was stronger than the other two drip irrigation treatments. This resulted in an increase in soil CH4 emissions and a relatively weaker soil absorption capacity for CH4.
Our study revealed that FI promoted CH4 emission compared to the DI treatments, and FI was the only treatment of positive CH4 emission among the four irrigation treatments, which was in line with previous conclusions [30,31]. This was because the FI treatment made forming a flooded layer on the soil surface easier, and the anaerobic environment caused by the flooded layer promoted the temporary and violent emission of CH4. However, under drip irrigation, the water supply intensity per unit time was lower, the water movement in soil pores was slower, the damage degree of soil structure was lighter, and the root-soil was looser and contained more O2. These factors negatively affected CH4 emissions [32].
In earlier studies, soil temperature, humidity, organic matter, and enzyme activity were found to be important factors responsible for CO2 and CH4 emissions [15,33]. However, no significant correlation between CO2/CH4 emission and soil organic matter was found in this study, and the irrigation had little effect on soil organic matter content (Figure 9). This might be because the previous studies focused more on soils in different regions, while soil organic matter content at the same site has relatively smaller differences. Moreover, forming organic matter requires a complex and long-term biogeochemical process [34], and the change range will not be large when under the influence of irrigation during one crop season. Therefore, the soil organic matter in our study was not the main control factor impacting CO2/CH4 emission under irrigation. We found that a significant correlation exists between the CO2 emission flux and soil urease and catalase. Also, this study agrees with the research conclusion of Zhu et al. [35]. In this study, CH4 emission flux was negatively correlated with soil enzyme activity. Li et al. [36] pointed out that soil dehydrogenase was crucial to the oxidation process of CH4. The decrease in soil dehydrogenase activity would weaken the soil’s ability to oxidize CH4 and decrease the CH4 consumption, thus promoting CH4 emissions.
This study evaluated the differences in CO2/CH4 emission among drip irrigation treatments with different lower limits of soil moisture. Also, CO2/CH4 emission differences between drip and furrow irrigation with the same irrigation amount were quantitatively compared. Furthermore, the correlation between CO2/CH4 emission and possible impact factors was analyzed. However, it is worth noting that the stem expansion process for stem-used vegetables is more intense than for leaf or fruit vegetables, and its impact on soil structure is bound to be more obvious. Therefore, research regarding the impact of the root expansion process of stem-used crops on soil structure is the key to revealing further how irrigation affects gaseous carbon emissions. One of our research shortcomings is the lack of insolation data, as insolation (particularly ultraviolet) has a significant impact on lettuce stem growth, and stem growth has an impact on the soil, which might affect soil gaseous carbon emissions. Another limitation is that we measured the soil chemical indicators 22 and 57 days after transplanting seedlings, and more measurement dates should be added to help deeply reveal the mechanism of how irrigation affects soil carbon emissions.

5. Conclusions

The impact of different irrigation schemes on soil gaseous carbon emissions from fields cultivated with lettuce, a stem-used plant, was quantitatively studied, and the noticeable differences in soil carbon emissions (CO2 and CH4) under different drip-irrigation lower limits were highlighted. The overall results indicated that the cumulative CO2 emission was highest under DR3 and relatively lower under DR1. The cumulative CH4 emissions under FI were the greatest in the whole lettuce growth period, while DR2 and DR3 treatments emitted lower amounts of CH4. The irrigation schemes had a lagging effect on soil enzyme activity. The enhanced activity of urease and catalase promoted CO2 emission. From the perspective of reducing CO2 and CH4 emissions, drip irrigation with a 75% lower limit was recommended as the optimal irrigation scheme.

Author Contributions

Investigation, J.W. and F.Z.; Writing—original draft, J.W., M.H., J.C. and H.S.; Writing—review and editing, Q.Z. and Y.A.H. All authors have read and agreed to the published version of the manuscript.

Funding

The Seed Industry Innovation and Industrialization Project in Fujian Province (zycxny2021009); Rural Revitalization Vegetable Industry Service Project of Fujian Agriculture and Forestry University (11899170118); The Fujian Modern Agricultural Vegetable Industry System Construction Project (2019-897). Facilities green leafy vegetables introduction, screening and demonstration promotion (2022-P-001).

Data Availability Statement

Data are contained within the article.

Conflicts of Interest

The authors declare no conflicts of interest.

References

  1. Hamad, A.A.A.; Ni, L.; Shaghaleh, H.; Elsadek, E.; Hamoud, Y.A. Effect of Carbon Content in Wheat Straw Biochar on N2O and CO2 Emissions and Pakchoi Productivity Under Different Soil Moisture Conditions. Sustainability 2023, 15, 5100. [Google Scholar] [CrossRef]
  2. Yao, Y.; Li, G.; Lu, Y.; Liu, S. Modelling the impact of climate change and tillage practices on soil CO2 emissions from dry farmland in the Loess Plateau of China. Ecol. Model. 2023, 478, 110276. [Google Scholar] [CrossRef]
  3. Zhang, X.; Xiao, G.; Li, H.; Wang, L.; Wu, W.; Meng, F. Mitigation of greenhouse gas emissions through optimized irrigation and nitrogen fertilization in intensively managed wheat–maize production. Sci. Rep. 2020, 10, 5907. [Google Scholar] [CrossRef]
  4. Liu, Y.; Tang, H.; Muhammad, A.; Huang, G. Emission mechanism and reduction countermeasures of agricultural greenhouse gases—A review. Greenh. Gases Sci. Technol. 2019, 9, 160–174. [Google Scholar] [CrossRef]
  5. Alfadil, A.; Xia, J.; Shaghaleh, H.; Hamoud, Y.A.; Ibrahim, J.N.; Hamad, A.A.A.; Fahad, R.; Sheteiwy, M.; Wu, T. Wheat straw biochar application improves the morphological, physiological, and yield attributes of maize and the physicochemical properties of soil under deficit irrigation and salinity stress. J. Plant Nutr. 2021, 44, 2399–2420. [Google Scholar] [CrossRef]
  6. Andrews, H.M.; Homyak, P.M.; Oikawa, P.Y.; Wang, J.; Jenerette, G.D. Water-conscious management strategies reduce per-yield irrigation and soil emissions of CO2, N2O, and NO in high-temperature forage cropping systems. Agric. Ecosyst. Environ. 2022, 332, 107944. [Google Scholar] [CrossRef]
  7. Yerli, C.; Sahin, U.; Kiziloglu, F.M.; Oztas, T.; Ors, S. Deficit irrigation with wastewater in direct sowed silage maize reduces CO2 emissions from soil by providing carbon savings. J. Water Clim. Change 2022, 13, 2837–2846. [Google Scholar] [CrossRef]
  8. Hou, H.; Han, Z.; Yang, Y.; Abudu, S.; Cai, H.; Li, Z. Soil CO2 emissions from summer maize fields under deficit irrigation. Environ. Sci. Pollut. Res. 2022, 27, 4442–4449. [Google Scholar] [CrossRef] [PubMed]
  9. Edwards, K.P.; Madramootoo, C.A.; Whalen, J.K.; Adamchuk, V.I.; Su, A.S.M.; Benslim, H. Nitrous oxide and carbon dioxide emissions from surface and subsurface drip irrigated tomato fields. Can. J. Soil Sci. 2018, 98, 389–398. [Google Scholar] [CrossRef]
  10. Chen, J.; Jin, Q.; Zhu, Q.; Xiao, Y.; Zhu, J.; Shao, X.; Hou, M.; Zhong, F.; Lin, C.; Zhu, L. Fate of Soil Residual Fertilizer-N-15 as Affected by Different Drip Irrigation Regimes. Water 2022, 14, 2281. [Google Scholar] [CrossRef]
  11. Yu, H.; Liu, Y.; Deng, Y.; Lu, G.; Yan, H.; Wang, Y. Effects of the transformation from natural alpine grassland to mixed artificial grassland on the characteristics of soil microbial community. Environ. Sci. 2023, 44, 2928–2935. (In Chinese) [Google Scholar]
  12. Ren, Q.; Sun, R.; Zhang, K.; Liu, Y.; Ruan, X.; Wang, Y. Soil properties, Heavy metal accumulation, and ecological risk in vegetable greenhouses of different planting years. Environ. Sci. 2022, 43, 995–1003. (In Chinese) [Google Scholar]
  13. Gao, Y.; Wang, S.; Wei, M.; Li, J.; Gao, Z.; Meng, L.; Yang, F. Effects of nitrogen phosphorus and potassium dosage on the yield root morphology rhizosphere microbial quantity and enzyme activity of eggplant under substrate cultivation. Sci. Agric. Sin. 2021, 54, 4623–4634. (In Chinese) [Google Scholar]
  14. Shaaban, M.; Khalid, M.S.; Hu, R.; Zhou, M. Effects of water regimes on soil N2O, CH4 and CO2 emissions following addition of dicyandiamide and N fertilizer. Environ. Res. 2022, 212, 113544. [Google Scholar] [CrossRef]
  15. Yerli, C.; Sahin, U.; Oztas, T. CO2 emission from soil in silage maize irrigated with wastewater under deficit irrigation in direct sowing practice. Agric. Water Manag. 2022, 271, 107791. [Google Scholar] [CrossRef]
  16. Bregaglio, S.; Mongiano, G.; Ferrara, R.M.; Ginaldi, F.; Lagomarsino, A.; Rana, G. Which are the most favourable conditions for reducing soil CO2 emissions with no-tillage? Results from a meta-analysis. Int. Soil Water Conserv. Res. 2022, 10, 497–506. [Google Scholar] [CrossRef]
  17. Liu, J.; Zhang, A.; Feng, H.; Zou, X.; Chen, H. Influences of different irrigation amounts on carbon sequestration in wheat-maize rotation system. Chin. J. Appl. Ecol. 2017, 28, 169–179. (In Chinese) [Google Scholar]
  18. Lemon, E.R. CO2 and Plants, 1st ed.; CRC Press: Boca Raton, FL, USA, 1983; pp. 67–69. [Google Scholar]
  19. Lv, G.; Kang, Y.; Li, L.; Wan, S. Effect of irrigation methods on root development and profile soil water uptake in winter wheat. Irrig. Sci. 2010, 28, 387–398. [Google Scholar] [CrossRef]
  20. Zhang, Q.; Yang, L.; Wang, J.; Luo, H.; Zhang, Y.; Zhang, W. Effects of Different Irrigation Methods and Fertilization Measures on Soil Respiration and Its Component Contributions in Cotton Field in Arid Region. Sci. Agric. Sin. 2012, 45, 2420–2430. (In Chinese) [Google Scholar]
  21. Guo, S.; Qi, Y.; Luo, X.; Liu, C.; Peng, Q.; Yan, Z.; Dong, Y. Effects of drip irrigation on soil CO2 and N2O emissions and their global warming potentials of spring wheat field in arid region. J. Agro-Environ. Sci. 2016, 35, 792–800. (In Chinese) [Google Scholar]
  22. Zhang, X.; Ye, X.; Han, B.; Li, W.; Fan, Q.; Zou, H.; Zhang, Y. Effects of irrigation methods on emissions of greenhouse gases from facilities soil. Res. Environ. Sci. 2016, 29, 1487–1496. (In Chinese) [Google Scholar]
  23. Wang, G.; Liang, Y.; Zhang, Q.; Jha, S.K.; Gao, Y.; Shen, X.; Sun, J.; Duan, A. Mitigated CH4 and N2O emissions and improved irrigation water use efficiency in winter wheat field with surface drip irrigation in the North China Plain. Agric. Water Manag. 2016, 163, 403–407. [Google Scholar] [CrossRef]
  24. Sampathkumar, T.; Pandian, B.J.; Mahimairaja, S. Soil moisture distribution and root characters as influenced by deficit irrigation through drip system in cotton-maize cropping sequence. Agric. Water Manag. 2012, 103, 43–53. [Google Scholar] [CrossRef]
  25. Franco-Luesma, S.; Cavero, J.; Plaza-Bonilla, D.; Cantero-Martínez, C.; Arrúe, J.L.; Álvaro-Fuentes, J. Tillage and irrigation system effects on soil carbon dioxide (CO2) and methane (CH4) emissions in a maize monoculture under Mediterranean conditions. Soil Tillage Res. 2020, 196, 104488. [Google Scholar] [CrossRef]
  26. Armwell, S.; Regis, C.; Marc, C.; Johan, S.; Christian, T.; Rémi, C. Long-term tillage, residue management and crop rotation impacts on N2O and CH4 emissions from two contrasting soils in sub-humid Zimbabwe. Agric. Ecosyst. Environ. 2023, 341, 108207. [Google Scholar]
  27. Larisha, T.; Babita, K.; Singh, S. Water management—A tool for methane mitigation from irrigated paddy fields. Sci. Total Environ. 2010, 408, 1085–1090. [Google Scholar]
  28. Rosacker, L.; Kieft, T. Biomass and adenylate energy charge of a grassland soil during drying. Soil Biol. Biochem. 1990, 22, 1121–1127. [Google Scholar] [CrossRef]
  29. Yang, X.; Jiang, B.; Yin, H.; Kang, T.; Gao, Y.; Fan, D. Methane and Nitrous Oxide Emissions in Winter Wheat Fields as Affected by Different Drainage Measure. Chin. J. Soil Sci. 2015, 46, 471–476. (In Chinese) [Google Scholar]
  30. Gao, H.; Zhang, W.; Peng, C.; Zhang, X.; Li, Q.; Zhu, P. Emission Characteristics of Greenhouse Gas from Maize Field of Black Soil Region Under Long-term Fertilization. J. Agric. Resour. Environ. 2017, 34, 422–430. (In Chinese) [Google Scholar]
  31. Wang, M.; Zhang, Z.; Lv, C.; Lin, Y. CH4 and N2O Emissions from Rice Paddy Fields and Their GWPs Reaserch in different irrigation modes in cold rice. Res. Soil Water Conserv. 2016, 23, 95–100. (In Chinese) [Google Scholar]
  32. Zhang, Y.; Niu, H.; Wang, S.; Wilkes, A.; Xu, K.; Wu, X. Effects of Different Irrigation Methods on Carbon Dioxide and Methane Emissions in Ningxia Vineyards. J. Irrig. Drain. 2016, 35, 17–21. (In Chinese) [Google Scholar]
  33. Li, Y.; Ge, Z.; Xie, L.; Li, S.; Tan, L. Effects of waterlogging and salinity increase on CO2 efflux in soil from coastal marshes. Appl. Soil Ecol. 2022, 170, 104268. [Google Scholar] [CrossRef]
  34. Hui, K.; Xi, B.; Tan, W.; Song, Q. Long-term application of nitrogen fertilizer alters the properties of dissolved soil organic matter and increases the accumulation of polycyclic aromatic hydrocarbons. Environ. Res. 2022, 215, 114267. [Google Scholar] [CrossRef] [PubMed]
  35. Zhu, Z.; Ge, T.; Liu, S.; Hu, Y.; Ye, R.; Xiao, M.; Tong, C.; Kuzyakov, Y.; Wu, J. Rice rhizodeposits affect organic matter priming in paddy soil: The role of N fertilization and plant growth for enzyme activities, CO2 and CH4 emissions. Soil Biol. Biochem. 2018, 116, 369–377. [Google Scholar] [CrossRef]
  36. Li, R.; Yang, H.; Tai, J. Effects of Irrigation Methods on Farmland Greenhouse Gas Emissions. J. Inn. Mong. Univ. Natl. 2020, 35, 402–407. (In Chinese) [Google Scholar]
Figure 1. The soil ridges and lettuce planting practice under different irrigation methods ((a) drip irrigation plots, (b) furrow irrigation plots).
Agronomy 14 00563 g001
Figure 2. The gas sampling chamber.
Agronomy 14 00563 g002
Figure 3. Influence of different irrigation schemes on the CO2 emission flux (a) and the accumulated CO2 emission (b) (DR1, DR2, and DR3 were the drip irrigation treatments, and FI was a furrow irrigation treatment. DR1, DR2, and DR3 represent soil moisture content at the lower limits of irrigation, which corresponded to 75%, 65%, and 55% of the field capacity. The irrigation amount each time for FI was the same as the DR2 treatment. The data in the figure are average values ± standard deviation (SD).
Agronomy 14 00563 g003
Figure 4. Influence of different irrigation schemes on the CH4 emission flux (a) and the accumulated CH4 emission (b) (DR1, DR2, and DR3 were the drip irrigation treatments, and FI was a furrow irrigation treatment. DR1, DR2, and DR3 represent soil moisture content at the lower limits of irrigation, which corresponded to 75%, 65%, and 55% of the field capacity. The data in the figure are average values ± SD.
Agronomy 14 00563 g004
Figure 5. Effect of different irrigation schemes on soil dehydrogenase activity (DR1, DR2, and DR3 were the drip irrigation treatments, and FI was a furrow irrigation treatment. DR1, DR2, and DR3 represent soil moisture content at the lower limits of irrigation, which corresponded to 75%, 65%, and 55% of the field capacity. The data are average values ± SD. The different values (a, b, c) mean significant difference at 0.05 level within a day. The 22 and 57 days after transplant correspond to the middle time point of the rosette and stem expansion stages, respectively.
Agronomy 14 00563 g005
Figure 6. Effect of different irrigation schemes on soil urease activity (DR1, DR2, and DR3 were the drip irrigation treatments, and FI was a furrow irrigation treatment. DR1, DR2, and DR3 represent soil moisture content at the lower limits of irrigation, which corresponded to 75%, 65%, and 55% of the field capacity. The irrigation amount each time for FI was the same as the DR2 treatment. The data are average values ± SD. The different values (a, b, c) represent significant differences at 0.05 level within a day. The 22 and 57 days after transplant correspond to the middle time point of the rosette and stem expansion stages, respectively.
Agronomy 14 00563 g006
Figure 7. Effect of different irrigation schemes on soil catalase activity (DR1, DR2, and DR3 were the drip irrigation treatments, and FI was a furrow irrigation treatment. DR1, DR2, and DR3 represent soil moisture content at the lower limits of irrigation, which corresponded to 75%, 65%, and 55% of the field capacity. The data are average values ± SD. The different values (a, b, c) represent significant differences at 0.05 level within a day. 22 and 57 days after transplant correspond to the middle time point of the rosette and stem expansion stages, respectively.
Agronomy 14 00563 g007
Figure 8. Effect of different irrigation schemes on soil humidity (a) and temperature (b) (DR1, DR2, and DR3 were the drip irrigation treatments, and FI was a furrow irrigation treatment. DR1, DR2, and DR3 represent soil moisture content at the lower limits of irrigation, which corresponded to 75%, 65%, and 55% of the field capacity. The irrigation amount for FI each time was the same as for DR2 treatment.
Agronomy 14 00563 g008
Figure 9. Effect of different irrigation schemes on soil organic matter (DR1, DR2, and DR3 were the drip irrigation treatments, and FI was a furrow irrigation treatment. DR1, DR2, and DR3 represent soil moisture content at the lower limits of irrigation, which corresponded to 75%, 65%, and 55% of the field capacity. The irrigation amount each time for FI was the same as the DR2 treatment. The data are average values ± SD. The value (a) represents significant differences at 0.05. 22 and 57 days after transplant correspond to the middle time point of the rosette and stem expansions.
Agronomy 14 00563 g009
Table 1. The different irrigation schemes according to different irrigation lower limits.
TreatmentDuring Two Stages of the Rosette and the Fleshy Stem ExpansionTotal Irrigation Amount during the Growing Period (mm)
Irrigation Amount Each Time (mm)Irrigation Interval (d)Irrigation
Numbers
Irrigation Amount (mm)
DR115.89.58126.5284.1
DR223.715.25118.6276.2
DR331.625.3394.9252.5
FI23.715.25118.6276.2
Note: DR1, DR2, and DR3 are drip irrigation treatments, and FI is furrow irrigation.
Table 2. Division of lettuce growth stages.
YearPeriodGrowth StagesMoisture Treatment
2021September 20–September 22Seed germination
2021September 23–October 15Seedling
2021October 16–November 21Rosette
2021–2022November 22–January 2Stem expansion
2022January 3–January 6Harvest
Note: √ indicates that different irrigation treatments were implemented at this stage.
Table 3. Correlation analysis between CO2 emission flux and possible impact factors.
CO2 Emission FluxSoil TemperatureSoil MoistureDehydrogenase ActivityUrease ActivityCatalase ActivityOrganic Matter
CO2 emission flux1−0.608−0.3340.4660.947 **0.775 *0.584
Soil temperature 1−0.6300.5260.796 *0.738 *0.581
Soil moisture 1−0.503−0.381−0.448−0.613
Dehydrogenase activity 10.5290.6090.876 **
Urease activity 10.860 **0.568
Catalase activity 10.540
Organic matter 1
Note: * indicates a significant correlation at the 0.05 level, ** indicates a significant correlation at the 0.01 level.
Table 4. Correlation analysis between CH4 emission flux and possible impact factors.
CH4 Emission FluxSoil TemperatureSoil MoistureDehydrogenase ActivityUrease ActivityCatalase ActivityOrganic Matter
CH4 emission flux1−0.5700.263−0.791 *−0.839 **−0.838 **−0.766
Soil temperature 1−0.6300.5260.796 *0.738 *0.581
Soil moisture 1−0.503−0.381−0.448−0.613
Dehydrogenase activity 10.5290.6090.876 **
Urease activity 10.860 **0.568
Catalase activity 10.540
Organic matter 1
Note: * indicates a significant correlation at the 0.05 level, ** indicates a significant correlation at the 0.01 level.
Disclaimer/Publisher’s Note: The statements, opinions and data contained in all publications are solely those of the individual author(s) and contributor(s) and not of MDPI and/or the editor(s). MDPI and/or the editor(s) disclaim responsibility for any injury to people or property resulting from any ideas, methods, instructions or products referred to in the content.

