
Study on the Mechanism of Slow-Release Fertilizer and Nitrogen Fertilizer on the Senescence Characteristics of Quinoa Leaves
Abstract
:1. Introduction
2. Materials and Methods
2.1. Overview of the Test Site
2.2. Experimental Materials
2.3. Test Methods
2.4. Measurement Indicators and Methods
2.4.1. Blade Sampling and Instrumentation
2.4.2. Determination of CAT Enzyme Activity
2.4.3. Determination of SOD Enzyme Activity
2.4.4. Determination of POD Enzyme Activity
2.4.5. Determination of MDA Content
2.4.6. Determination of Yield and Its Components
2.5. Data Processing
3. Results and Analysis
3.1. Characterization of Quinoa Leaf Senescence
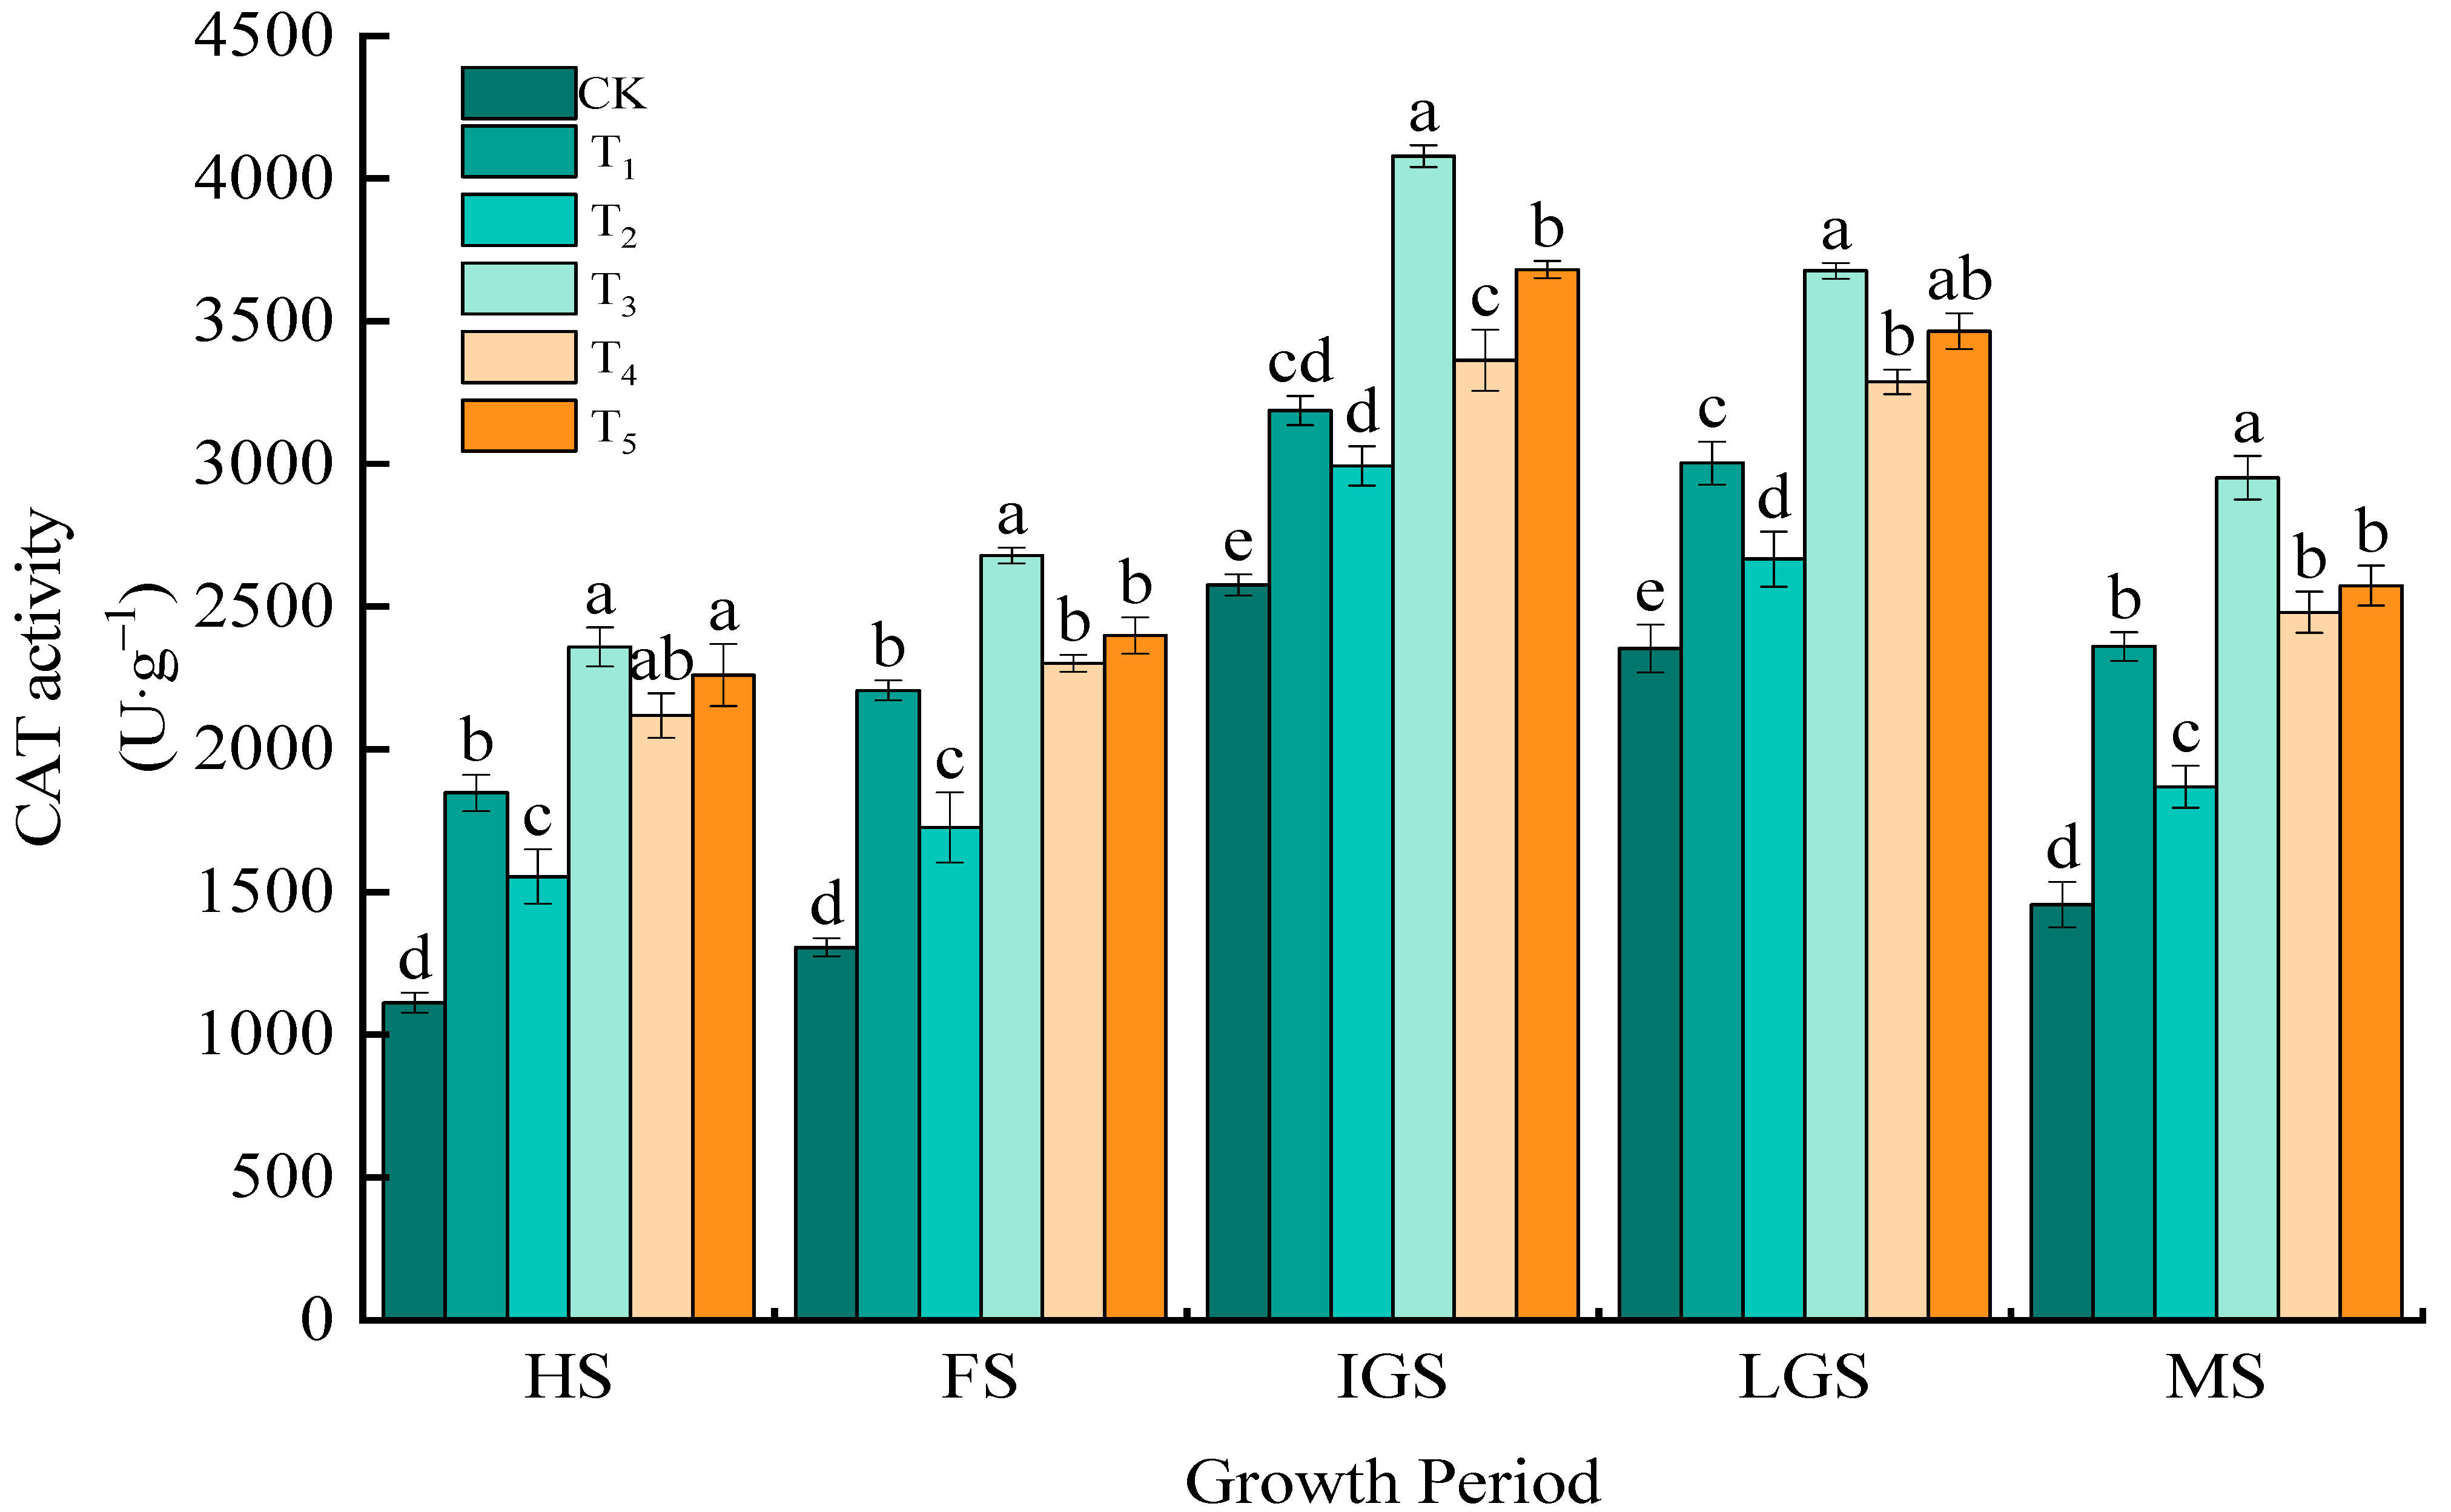
3.1.1. CAT Activity
3.1.2. POD Activity
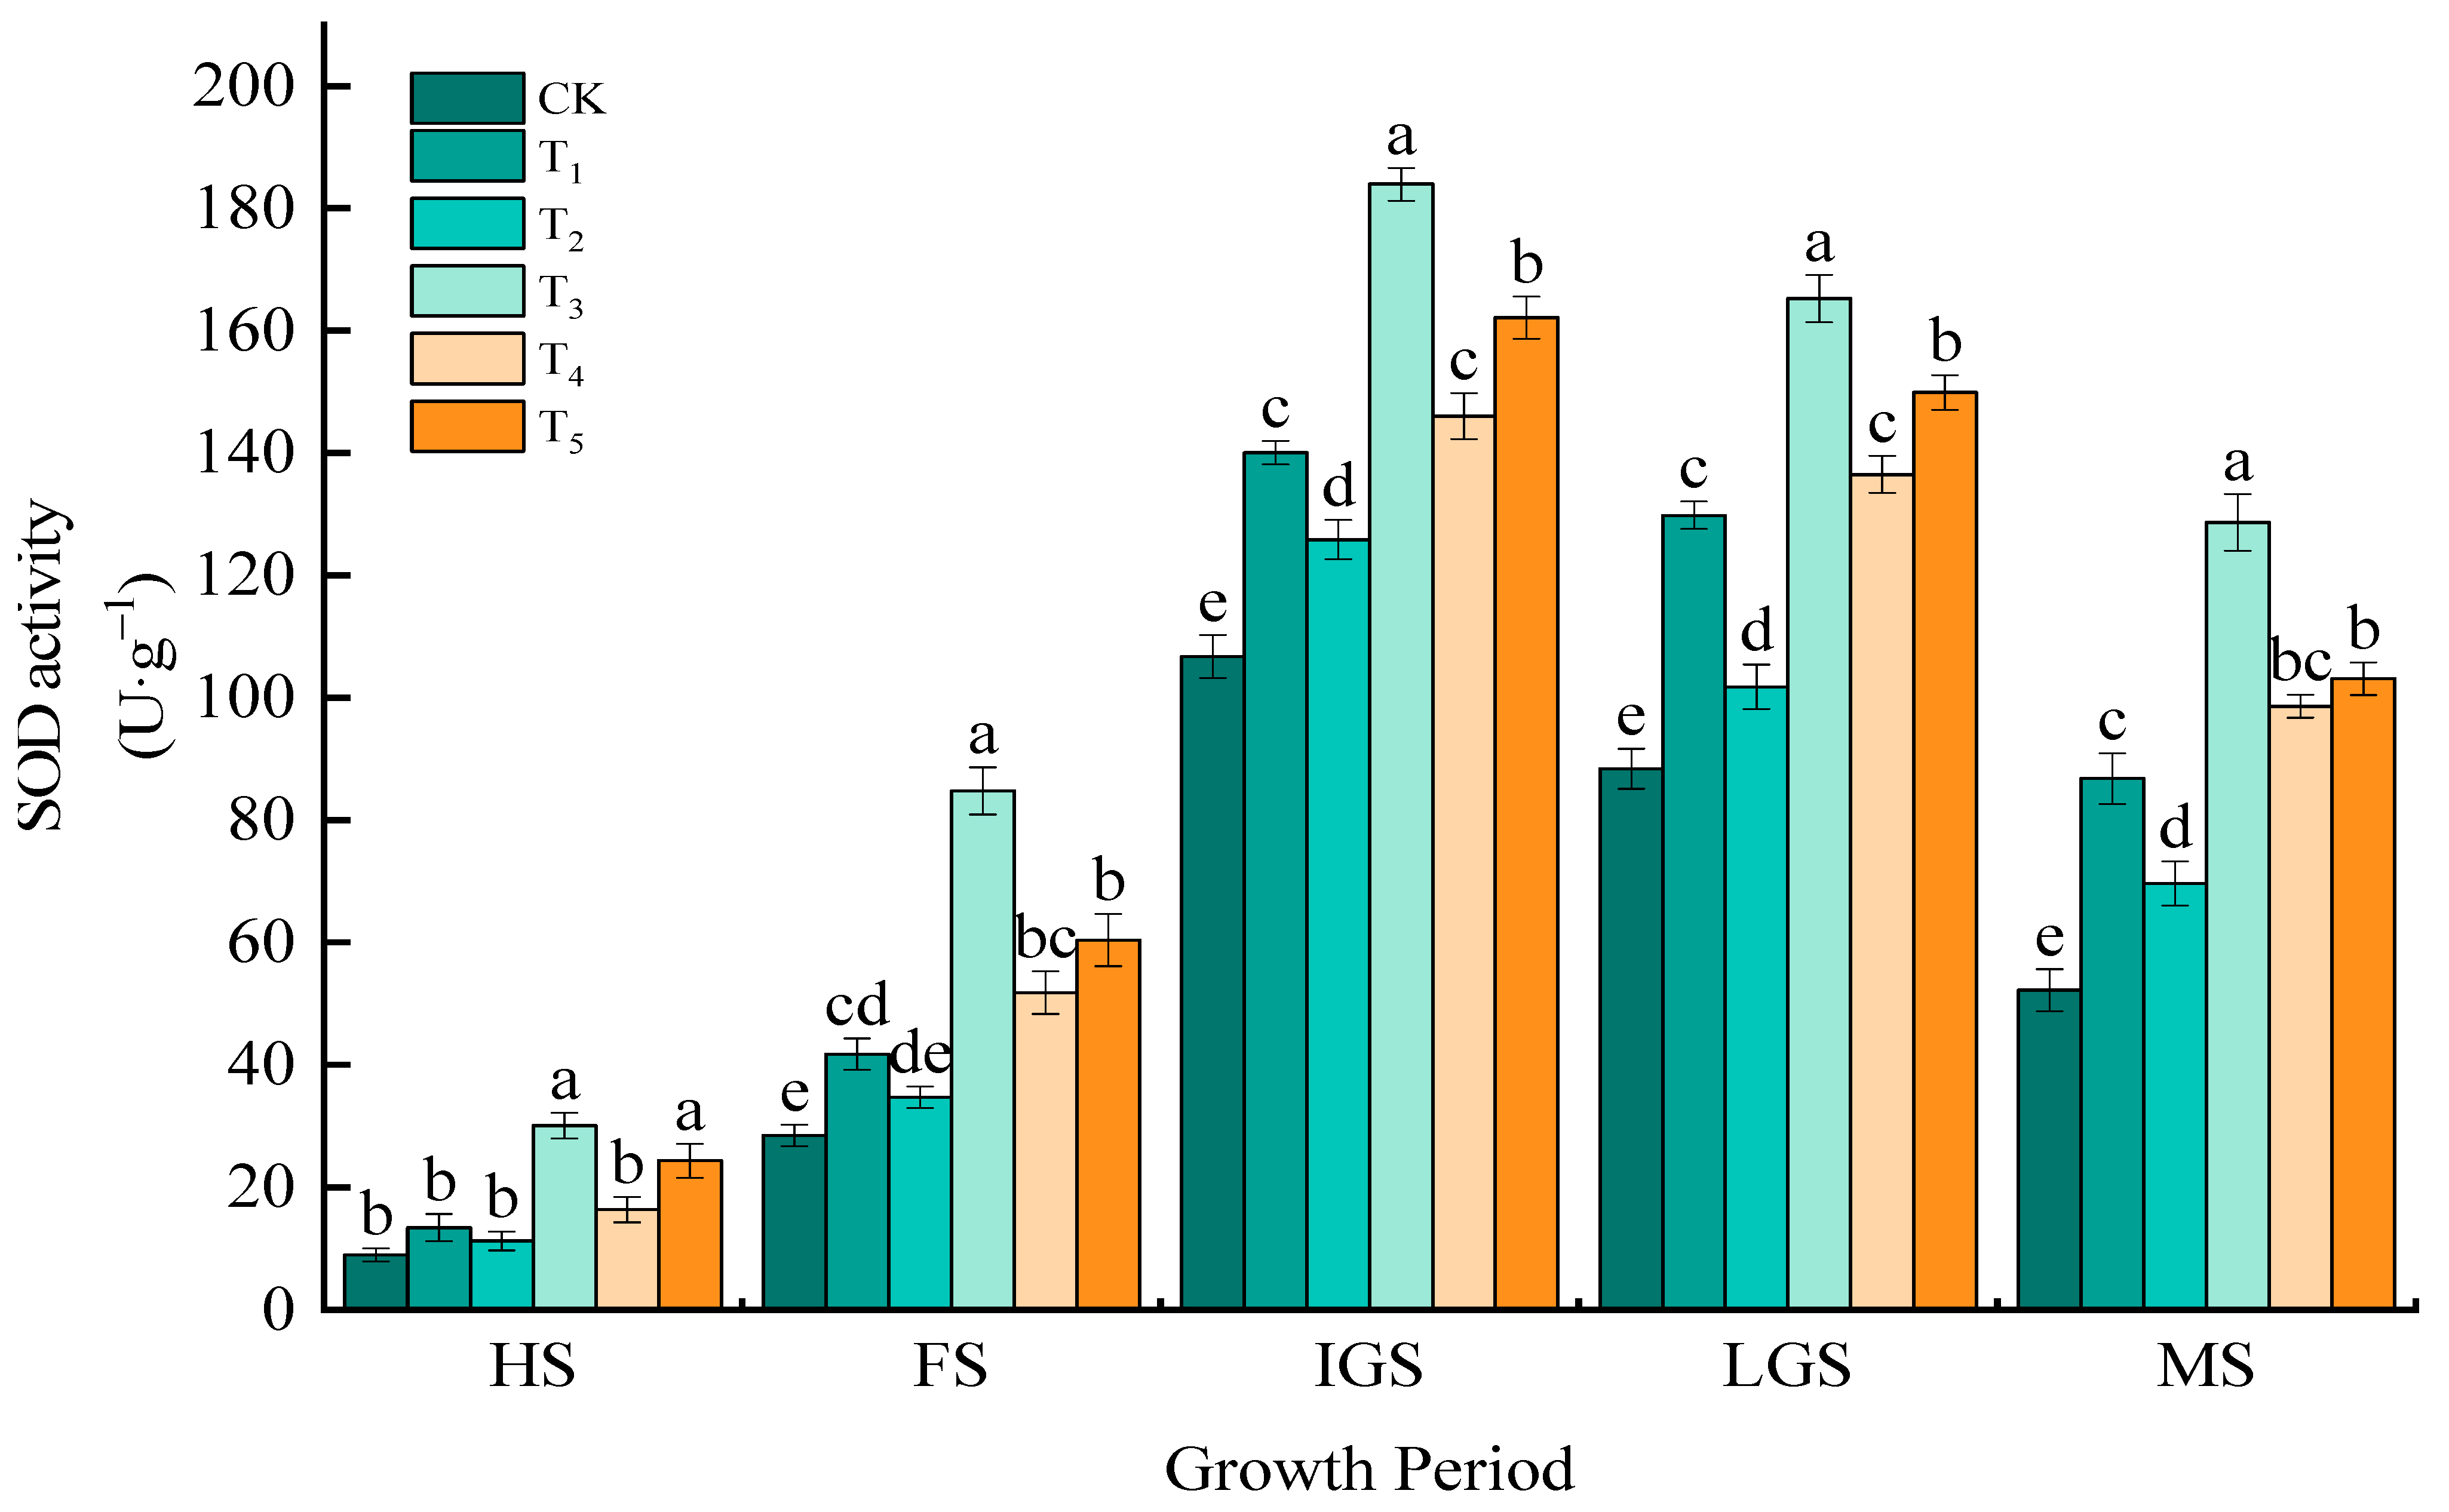
3.1.3. SOD Activity
3.1.4. MDA Content
3.2. Analysis of Yield and Its Components
3.3. Analysis of the Correlation between Leaf Physiological Indexes, Spike Biological Characters, and Yield of Quinoa at the IGS
4. Discussion
4.1. Mechanistic Study of Anti-Aging Properties
4.2. Yield
5. Conclusions
Author Contributions
Funding
Data Availability Statement
Conflicts of Interest
References
- Bhargava, A.; Shukla, S.; Ohri, D. Chenopodium ouinoa: An Indian perspective. Ind. Crop. Prod. 2006, 23, 73–87. [Google Scholar] [CrossRef]
- Wei, Z.; Li, S.; Xia, X.; Liu, F.; Liu, M.; Zhao, Y.; Zhou, H. Characterization of quinoa and its development suggestions. Hebei Agric. Sci. 2016, 20, 14–17. [Google Scholar]
- White, P.L.; Alvistur, E.; Diaz, C.; Tian, Y. Nutrient content and protein quality of quinua and cafiihua, edible seed produets of the Andes mountains. J. Agricul.-Tural Food Chem. 1955, 3, 351–355. [Google Scholar]
- Wang, Y.; Shao, X.; Huang, X.; Wang, K. Research progress on nitrogen uptake by plant roots. Pratacultural Sci. 2010, 27, 105–111. [Google Scholar]
- Zhang, Y.; Dong, Y.; Shen, Q.; Duan, Y. Characteristics of NH4+ and NO3− uptake by rices of different genotypes. Acta Pedol. Sin. 2004, 41, 918–923. [Google Scholar]
- Cui, P.; Ding, Y.; Jiao, X.; Wu, A.; Wang, J.; Dong, E.; Guo, J.; Wang, L. Research progress on the effect of nitrogen fertilizer on crops. Shanxi Agric. Sci. 2017, 45, 663–668. [Google Scholar]
- Zhang, X.; Sun, Z.; Shen, L.; Zhang, W.; Yang, H. Application status and prospect of slow-release fertilizer in facility agriculture. Agric. Dev. Equip. 2021, 33–34. [Google Scholar] [CrossRef]
- Jin, X.; Li, C.; Wang, C.; Yang, L.; Guo, H.; Wang, W. Effects of combined application of slow-release nitrogen fertilizer on the yield of different barley varieties. Barley Cereal Sci. 2021, 38, 34–38+42. [Google Scholar]
- Lei, H.; Wang, S.; Wang, H.; Yang, Y.; Zheng, R.; Liu, W. Research status and prospect of urea sustained-release fertilizer in crop production in China. J. Tianjin Agric. Coll. 2023, 30, 80–85. (In Chinese) [Google Scholar]
- Zhou, A. Application research and development suggestions of slow-controlled release fertilizer in China. Phosphorus Fertil. Compd. Fertil. 2019, 35, 16–19. [Google Scholar]
- Huang, H.; Li, L.; Lu, X.; Yang, S. Experimental report on yield comparison between slow-release fertilizer and conventional fertilizer for rice. Agric. Dev. Install. 2019, 126–127. (In Chinese) [Google Scholar] [CrossRef]
- Wang, H. Study on Fertilizer Utilization efficiency of Maize slow-release Fertilizer in Jieshou City. Mod. Agric. Sci. Technol. 2023, 32–34. [Google Scholar] [CrossRef]
- Xie, P.; Ma, D.; Zhang, X.; Liu, C. Nutrient release and yield-increasing effect of coated slow-release fertilizer. Soil Fertilizer. 2005, 23–28. [Google Scholar] [CrossRef]
- Wu, L.; Li, Z.; Ge, Z.; Huang, S.; Pan, X.; Bao, R.; Kong, L. Effects of different slow-release fertilizers on growth, yield and quality of tomato in greenhouse. Southwest Chin. J. Agric. Sci. 2015, 28, 2605–2609. [Google Scholar]
- Chen, J.; Li, Y.; Liao, X.; Fan, M.; Wang, Z.; Zhao, J. Effects of base application slow-release fertilizer substituting nitrogen fertilizers on nitrogen loss along with runoff and silage maize growth. Soil Water Conserv. Res. 2023, 188–194. [Google Scholar] [CrossRef]
- Guo, J.J. Effects of Urea Mixed Slow-Release Nitrogen Fertilizer on Growth and Nitrogen Use of Summer Maize/Winter Wheat. Master’s thesis, Northwest A & F University, Xianyang, China, 2018. [Google Scholar]
- Zhang, S.; Wu, F.; Niu, J. Effects of different slow release fertilizers on the yield of spring wheat. Soil Fertil. 2004, 23–25. [Google Scholar] [CrossRef]
- Qiu, H.; Ji, H.; Gu, J.; Gu, J.; Jia, Q.; Dong, Y.; Shen, F.; Shen, H. Effects of slow-release fertilizer on rice yield and nitrogen use efficiency. Shanghai Agric. Sci. Technol. 2023, 101–102+105. [Google Scholar] [CrossRef]
- Gu, R. Effects of Combined Application of Slow and Controlled Release Fertilizer and Urea on Yield, Quality and Nitrogen Use of Wheat in Huaibei Rice Stubble. Master’s thesis, Yangzhou University, Yangzhou, China, 2020. [Google Scholar]
- Xu, L.; Li, D.; Wang, H.; Wang, Z.; Lu, X. Effects of slow-release fertilizer on nutrient absorption and utilization and yield of fresh maize. Acta Agric. Sin. Shanghai 2023, 39, 21–25. [Google Scholar]
- Yang, J.; Li, Y.; Wang, K.; Du, L.; Fang, H.; Zhang, T. Effects of combined application ratio and methods of controlled release nitrogen fertilizer and common urea on grain filling characteristics of winter wheat. J. Plant Nutr. Fertil. 2020, 26, 442–452. [Google Scholar]
- Ji, J.; Li, Y.; Liu, S.; Tong, Y.; Liu, Y.; Zhang, M.; Li, J.; Zheng, Y. Effects of controlled release mixed fertilizer on yield, photosynthetic characteristics and nitrogen use efficiency of spring maize. Soil Bull. 2015, 46, 669–675. [Google Scholar]
- Zou, Q.; Gu, X.; Li, Y.; Chen, P.; Cao, J. Effects of slow-release nitrogen fertilizer application ratio on yield and nitrogen use efficiency of winter wheat. J. Water Resour. Water Eng. 2022, 33, 217–224. (In Chinese) [Google Scholar]
- Lu, J.; Kou, C.; Yu, D. Effects of different proportions of polyurea formaldehyde slow-release fertilizer and urea on yield and nitrogen use efficiency of wheat in aqua-soil. Phosphorus Compd. Fertil. 2021, 36, 45–48. [Google Scholar]
- Liu, F.; Meng, Z.; Jiang, X.; Li, J.; Liu, J.; Wang, J.; Li, Y.; Sun, Q. Effects of different ratios of slow-release fertilizer on yield and quality of flue-cured tobacco in Chenzhou. Hunan Agric. Sci. 2023, 33–38. [Google Scholar]
- Qiu, L.; Zhao, L.; Xie, Y.; Xiong, H.; Gu, J.; Bi, X.; Liu, L.; Guo, H. Research progress of plant premature senescence. J. Plant Genet. Resour. 2022, 323, 346–357. [Google Scholar]
- Foyer, C.H.; Noctor, G. Stress-triggered redox signalling: What’s in pROSpect? Plant Cell Environ. 2016, 39, 951–964. [Google Scholar] [CrossRef]
- Yordanova, R.Y.; Christov, K.N.; Popova, L.P. Antioxidative enzymes in barley plants subjected to soil flooding. Environ. Exp. Bot. 2004, 51, 93–101. [Google Scholar] [CrossRef]
- Tanase, C.; Popa, V. Peroxidase, Superoxide-Dismutase and Catalase Activity in Corn Plants Developed under the Influence of Polyphenolic Compounds and Deuterium Depleted Water. Analele Ştiinţifice Ale Univ. Alexandru Ioan Cuza Din Iași Sect. II A Genet. Si Biol. Mol. 2014, 15, 7–12. [Google Scholar]
- Wei, J.; Xu, C.; Li, K.; He, H.; Xu, Q. Research progress of superoxide dismutase and plant stress resistance. Acta Physiol. Sin. 2020, 56, 2571–2584. [Google Scholar]
- Wang, Y.; Liang, C.; Huang, J. Characteristics, gene expression and regulation of plant leaf senescence. J. South China Agric. Univ. 2002, 87–90. [Google Scholar] [CrossRef]
- Wei, H.; Zhang, H.; Ma, Q.; Dai, Q.; Huo, Z.; Xu, K.; Zhnag, Q.; Huang, L. Leaf senescence characteristics of rice genotypes with different nitrogen absorption and utilization efficiency. Acta Agron. Sin. 2010, 36, 645–654. [Google Scholar] [CrossRef]
- Dong, S. Study on Extraction Technology, Antioxidant Activity and Anti-Aging of Flavonoids from Chenopodium Quinoa. Master’s thesis, Beijing Forestry University, Beijing, China, 2016. [Google Scholar]
- Chugh, V.; Kaur, N.; Gupta, A. Evaluation of oxidative stress tolerance in maize (Zea Mays L.) seedlings in response to drought. Indian J. Biochem. Biophys. 2011, 48, 47–53. [Google Scholar] [PubMed]
- Chen, J.; Ren, B.C.; Zhao, B.; Liu, P.; Zhang, J. Effect of foliar spraying betaine on yield formation and antioxidant capacity of summer maize at different sowing dates. Acta Agron. Sin. 2022, 48, 1502–1515. [Google Scholar] [CrossRef]
- Liu, G.; Zhao, C.; Jiang, Y.; Zhao, L.; Liao, P.; Wang, W.; Huo, Z. Effect of nitrogen application rate on synergistic senescence of rice source-sink. Acta Physiol. Sin. 2022, 58, 173–185. [Google Scholar]
- Lei, H.; Jiang, X.; Zhang, J. Effects of down-regulation of deficit irrigation on photosynthesis and senescence of tomato leaves in high temperature and humidity environment. Chin. Melon Veg. 2023, 36, 58–63. [Google Scholar]
- Liu, S.; Xu, X.; Zhao, J.; Qu, W.; Hao, T.; Meng, F.; Jia, J.; Zhao, C. Effects of nitrogen application rate and frequency on photosynthetic characteristics, protective enzyme activity and yield of summer maize under drip irrigation. Acta Agron. Sin. 2022, 37, 114–123. [Google Scholar]
- Zhao, J.; Xu, X.; Qu, W.; Liu, S.; Xu, Y.; Meng, F.; Jia, J.; Zhao, C. Effects of water and nitrogen treatments at different stages on photosynthetic characteristics, activities of protective enzymes and yield of winter wheat flag leaves under drip irrigation. J. Irrig. Drain. 2022, 41, 43–51. [Google Scholar]
- Duan, P.; Du, M.; Yang, F.; Duan, L.; Li, Z.; Tian, X. Effects of controlled loss fertilizer on cotton leaf senescence, yield and fiber quality. J. Agric. Sci. Technol. 2013, 15, 157–165. [Google Scholar]
- Wang, Y.; Shi, Y. Effects of Different Fertilizer Ratio on Senescence of Flag Leaf in Winter Wheat. Bangladesh J. Bot. 2020, 49, 85–90. [Google Scholar] [CrossRef]
- Bai, Y.; Zhao, Y.; Wei, Y. Effect of slow-release fertilizer combined with nitrogen fertilizer on gas exchange characteristics of Marigold. Shaanxi Agric. Sci. 2022, 68, 52–59. [Google Scholar]
- Yan, D.; He, L.; Li, H.; Ma, M.; Wang, Y.; Shao, R.; Yang, Q.; Guo, J. Effects of controlled release urea and common urea ratio on leaf senescence characteristics and soil enzyme activities of maize with different nitrogen efficiency. J. Ecol. 2021, 41, 9410–9421. [Google Scholar]
- Wang, Z. Plant Physiology; China Agricultural Publishing House: Beijing, China, 2010; pp. 451, 512. [Google Scholar]
- Yang, S.; Gao, J. Active oxygen, free radicals and plant senescence. Acta Bot. Sin. 2001, 215–220. [Google Scholar] [CrossRef]
- Du, X.M.; Yin, W.X.; Zhao, Y.X.; Zhang, H. The production and scavenging of reactive oxygen species in plants. Sheng Wu Gong Cheng Xue Bao = Chin. J. Biotechnol. 2001, 17, 121–125. [Google Scholar]
- Bai, Y.J.; Li, G.R.; Huang, F.L.; Li, W.; Cong, A.Q.; Chen, Y.S. Research progress of reactive oxygen species and plant antioxidant system. J. Anhui Agric. Sci. 2017, 45, 1–3. [Google Scholar]
- Xu, J.; Zheng, W.; Sun, X.; Li, Y.; Chai, S. Effects of foliar fertilization on anti-aging characteristics and yield of wheat variety Xinong 2000. J. Northwest Agric. 2012, 21, 74–78. [Google Scholar]
- Zhu, K.; Jin, L.; Dong, S.; Zhao, B.; Zhang, J. Effects of comprehensive agronomic management on leaf senescence characteristics of summer maize. Chin. Agric. Sci. 2014, 47, 2949–2959. [Google Scholar]
- Yu, H.; Chu, Z.; Wang, S.; Guo, Y.; Ren, W.; Zhang, J. Effects of different controlled release nitrogen ratios on leaf senescence and grain filling characteristics of summer maize. Chin. Agric. Sci. 2023, 56, 3511–3529. [Google Scholar]
- Cheng, L. Effects of Nitrogen Fertilizer Application Ratio and Slow-Release Fertilizer on Growth, Development and Yield of Millet. Master’s thesis, Qingdao Agricultural University, Qingdao, China, 2018. [Google Scholar]
- Wang, J. Formation Mechanism of Yield Difference of Summer Maize in Jiangsu Province and Ways to Reduce Yield Difference and Increase Efficiency. Ph.D. thesis, Yangzhou University, Yangzhou, China, 2023. [Google Scholar]
- Chen, Y. Formula fertilization improves anti-aging physiological characteristics of maize. Soil Crop. 2016, 5, 166–170. [Google Scholar]
- Li, G.; Liu, Z.; Peng, A. Effects of different fertilization treatments on activities of protective enzymes and membrane lipid peroxide in leaves of maize at late growth stage. Heilongjiang Sci. Technol. Inf. 2008, 125. [Google Scholar] [CrossRef]
- Zhan, X.; Han, X.; Yang, J.; Wang, S.; Gao, M.; Zhao, L. Effects of different fertilization treatments on the activities of protective enzymes and membrane lipid peroxidation in maize leaves at late growth stage. Corn Sci. 2007, 123–127. [Google Scholar] [CrossRef]
- Zhang, Z.; Jia, C.; Ren, B.C.; Liu, P.; Zhao, B.; Zhang, J. Effects of combined application of nitrogen and phosphorus on yield and leaf senescence characteristics of summer maize. J. Phys. Sci. 2023, 49, 1616–1629. [Google Scholar]
- Dou, K.L. Effects of Fertilization Methods on Growth and Development, Accumulation and Distribution of Nitrogen, Phosphorus and Potassium in Spring Maize. Master’s thesis, Hebei Normal University of Science and Technology: Qinhuangdao, China, 2022. [Google Scholar]
- Guo, W.; Fan, C. A brief discussion on the utilization of nitrogen fertilizer in China. South Agric. Mach. 2021, 552, 18–20. [Google Scholar]
- Chen, Y.; Yan, Q.; Zhang, L.; Liu, W.; Liu, H.; Yan, Y. Research progress of nitrogen and plant growth. J. Northeast. Agric. Univ. 2013, 44, 144–148. (In Chinese) [Google Scholar]
- Zhang, P.; Zhang, K.; Chen, Y.; Chen, J.; Luo, J.; Wang, Z. Analysis of the effect of nitrogen, phosphorus and potassium formula fertilization on oat under irrigation and the establishment of regression model with yield. Crop Mag. 2021, 101–107. [Google Scholar] [CrossRef]
- Chen, F.; Quan, X.; Zhang, X.; Jia, R.; Zhao, X.; Liu, J.; Ma, N. Effects of combined application of fertilizer on yield and agronomic characters of quinoa. Agric. Sci. Technol. Bull. 2018, 65–68. [Google Scholar] [CrossRef]
- Yu, Z.; Shen, Z.; Xu, L.; Yu, J.; Zhang, L.; Wang, X.; Yin, G.; Zhang, W.; Li, Y.; Zuo, W. Effect of Combined Application of Slow-Release and Conventional Urea on Yield and Nitrogen Use Efficiency of Rice and Wheat under Full Straw Return. Agronomy 2022, 12, 998. [Google Scholar] [CrossRef]
- Li, Z.; Zhang, R.; Chen, F.; Jiang, M.; Wang, L.; Liu, C.; Zhang, R.Q.; Liu, Y. Effect of controlled release urea combined application with common urea on yield and nitrogen utilization efficiency of rice in paddy-upland rotation. Soil Fertil. Sci. China 2018, 23–27. [Google Scholar]
- Gu, X.; Song, H.; Bai, D.; Du, Y.; Chang, T.; Lu, S.; Cai, W. Optimizing the ratio of slow-release nitrogen fertilizer to urea to improve the yield and nitrogen use efficiency of winter wheat. Trans. Chin. Soc. Agric. Eng. 2019, 39, 56–65. [Google Scholar]
- Li, L.; Hong, J.; Wang, H.; Xie, Y. Effects of Controlled Release Urea Combined with Conventional Urea on Grain Yield and Nitrogen Use Efficiency of Winter Wheat. J. Shanxi Agric. Univ. 2012, 32, 492–497. [Google Scholar]
- Zhao, Z.; Zhao, B.; Xie, M.; Sheng, Y.; Zhang, Y. Effects of combined application of nitrogen, phosphorus and potassium on yield and nutrient absorption and utilization of quinoa. Resour. Environ. Arid. Areas 2023, 37, 157–164. [Google Scholar]


| Treatment | Application of N kg/hm2 | Fertilizer Proportioning Method | One-Time Basal Application kg/hm2 |
|---|---|---|---|
| CK | 0 | 0 | 0 |
| T1 | 82.8 | 100% N | 13.5 N |
| T2 | 82.8 | 100% C | 23.85 C |
| T3 | 82.8 | C:N = 5:5 | 12 C + 6.75 N |
| T4 | 82.8 | C:N = 3:7 | 7.2 C + 9.45 N |
| T5 | 82.8 | C:N = 7:3 | 16.65 C + 4.05 N |
| Treatment | Main Spike Length/cm | Grain Number per Plant | Effective Branch Number per Plant | 1000-Grain Weight/g | Yield (kg/hm2) |
|---|---|---|---|---|---|
| CK | 63.60 ± 0.66 b | 7068.43 ± 19.95 d | 20.4 ± 0.95 bc | 3.93 ± 0.06 d | 1952.05 ± 80.07 e |
| T1 | 59.80 ± 0.37 c | 8477.39 ± 42.67 c | 21.60 ± 0.75 b | 4.56 ± 0.04 bc | 2711.89 ± 66.81 cd |
| T2 | 59.40 ± 0.88 c | 8189.05 ± 260.29 c | 18.40 ± 0.96 c | 4.47 ± 0.03 c | 2668.55 ± 97.79 d |
| T3 | 66.60 ± 1.47 a | 12199.96 ± 28.28 a | 25.20 ± 1.16 a | 4.85 ± 0.07 a | 3829.43 ± 30.07 a |
| T4 | 62.20 ± 0.86 b | 8321.45 ± 75.90 c | 19.00 ± 0.71 c | 4.51 ± 0.01 c | 2847.47 ± 82.65 c |
| T5 | 62.80 ± 0.31 b | 10460.30 ± 32.27 b | 19.8 ± 0.57 bc | 4.64 ± 0.06 b | 3313.52 ± 40.57 b |
Disclaimer/Publisher’s Note: The statements, opinions and data contained in all publications are solely those of the individual author(s) and contributor(s) and not of MDPI and/or the editor(s). MDPI and/or the editor(s) disclaim responsibility for any injury to people or property resulting from any ideas, methods, instructions or products referred to in the content. |
© 2024 by the authors. Licensee MDPI, Basel, Switzerland. This article is an open access article distributed under the terms and conditions of the Creative Commons Attribution (CC BY) license (https://creativecommons.org/licenses/by/4.0/).
Share and Cite
Lu, J.; Zhang, Q.; Sun, X.; Deng, Y.; Guo, H.; Wang, C.; Zhao, L. Study on the Mechanism of Slow-Release Fertilizer and Nitrogen Fertilizer on the Senescence Characteristics of Quinoa Leaves. Agronomy 2024, 14, 884. https://doi.org/10.3390/agronomy14050884
Lu J, Zhang Q, Sun X, Deng Y, Guo H, Wang C, Zhao L. Study on the Mechanism of Slow-Release Fertilizer and Nitrogen Fertilizer on the Senescence Characteristics of Quinoa Leaves. Agronomy. 2024; 14(5):884. https://doi.org/10.3390/agronomy14050884
Chicago/Turabian StyleLu, Jingying, Qi Zhang, Xiaojing Sun, Yan Deng, Hongxia Guo, Chuangyun Wang, and Li Zhao. 2024. "Study on the Mechanism of Slow-Release Fertilizer and Nitrogen Fertilizer on the Senescence Characteristics of Quinoa Leaves" Agronomy 14, no. 5: 884. https://doi.org/10.3390/agronomy14050884