Article

Evaluation of the Best Management Practices for Reducing Phosphorus Load in a Watershed in Terms of Cost and Greenhouse Gas Emissions

1
School of Environment and Energy Engineering, Gwangju Institute of Science and Technology, 123 Cheomdan-gwagi-ro, Gwangju 61005, Republic of Korea
2
Department of Civil and Environmental Engineering, Konkuk University-Seoul, 120, Neungdong-ro, Gwangjin-gu, Seoul 05029, Republic of Korea
*
Author to whom correspondence should be addressed.
Agronomy 2024, 14(5), 906; https://doi.org/10.3390/agronomy14050906
Submission received: 3 April 2024 / Revised: 22 April 2024 / Accepted: 23 April 2024 / Published: 26 April 2024

Abstract

:
Effective management of water quality in watersheds is crucial because it is directly linked to the sustainability of aquatic ecosystems. In conventional watershed management, best management practices (BMPs) have been instrumental in addressing deteriorating water quality issues caused by non-point source pollution. Greenhouse gas (GHG) emissions have emerged as a global concern, necessitating immediate and diverse environmental actions to mitigate their impacts. This study aims to explore BMPs that maximize total phosphorus (TP) load removal efficiencies, while minimizing costs and GHG emissions within watersheds, using the Soil and Water Assessment Tool (SWAT) and non-dominated sorting genetic algorithm III (NSGA-III). The Yeongsan River Watershed between 2012 and 2021 was selected as the study area. Hydrological and BMP data were analyzed. Applying identical BMPs to the watershed showed that the BMPs with high TP removal efficiency may not be effective in terms of cost and GHG emissions. Therefore, the optimal combination of BMPs for the Yeongsan River Watershed was determined using NSGA-III considering TP removal efficiency, cost, and GHG emissions. This study is the first to consider GHG emissions at the watershed level when applying BMPs and is expected to contribute to the development of BMP implementation incorporating GHG emissions.

1. Introduction

Clean water is a fundamental resource vital for sustaining life, and its impact on human life and the environment is significant. Securing water resources and maintaining their purity are the first steps toward sustaining ecological health. However, accelerated industrialization and urbanization have led to the degradation of watershed water quality [1,2,3]. Efforts have been made to maintain watershed water quality through various methodologies, including establishing wastewater treatment systems and managing pollutants [4]. Despite these efforts, non-point source pollution in urban and agricultural areas continues to be a major factor contributing to the degradation of watershed water quality [5,6].
The increasing impact of climate change, along with rising greenhouse gas (GHG) emissions, is emerging as a significant factor accelerating watershed water pollution [7,8]. Urban drainage systems in many cities globally are designed based on historical observations of precipitation amounts and patterns [9,10]. However, with the changing climate, precipitation patterns have also shifted. Notably, the occurrence of concentrated heavy rainfall differs significantly from past patterns [11]. This shift poses challenges in effectively responding to precipitation and flooding, leading to water pollution incidents that adversely affect humans and aquatic ecosystems [11]. Therefore, reducing GHG emissions to combat climate change is a critical imperative that is directly linked to maintaining ecosystem sustainability.
South Korea has set the objective of achieving carbon neutrality by 2050, as outlined in the ‘2050 National Carbon Neutrality Scenario’ introduced in 2021 [12]. The agriculture, forestry, and fisheries sectors aim to reduce their emissions from 24.7 million tons of CO2 eq. in 2018 to 15.4 million tons CO2 eq. by 2050, thereby achieving a reduction of 62.3% [12]. One proposed strategy to achieve this objective involves reducing the utilization of chemical fertilizers. Such reduction could lead to decreased energy consumption during production and lowered emissions of greenhouse gases from transportation and distribution processes [13,14]. Moreover, reducing the usage of chemical fertilizer may help to mitigate the influx of nutrients such as phosphorus into water bodies during rainfall events. Phosphorus serves as a primary contributor to algal blooms in inland waters. Consequently, reducing chemical fertilizer application may lower the phosphorus concentration entering lakes, potentially resulting in a reduction in algal blooms [14,15]. Nevertheless, according to Jeong et al., the use of chemical fertilizers increased by 13.3% in 2019 compared to 2011, with an annual average rise of 1.8% per hectare thereafter [16]. Thus, curbing chemical fertilizer usage emerges as a critical measure capable of concurrently reducing nutrient runoff in agricultural practices and mitigating GHG emissions during fertilizer production, highlighting the necessity of addressing both nutrient and GHG reduction in agricultural practices.
Best management practices (BMPs) improve the water quality of watersheds while minimizing their impact on the surrounding environment [6]. Many researchers have proposed policies to improve watershed water quality via the application of BMPs and have provided examples of cases demonstrating improvements in water quality [17,18]. When applying new water quality improvement measures, such as BMPs, it is necessary to consider trade-offs such as the effectiveness of BMPs in improving water quality, expected costs, and familiarity of the stakeholders with the BMPs [18]. Therefore, many researchers have applied methodologies specializing in multi-objective optimization to address these complex problems and resolve the tradeoff problems attributed to the application of BMPs [19,20,21,22,23,24,25]. Pyo et al. [20] conducted a study on the application of BMPs for the Lake Erie watershed, considering total phosphorus (TP) removal efficiency, stakeholder familiarity with BMPs, and costs. Similarly, Jeon [21] conducted a study on the Yeongsan River Watershed by applying climate change scenarios and analyzing the efficiency of TP removal and associated costs in relation to the implementation of BMPs.
In the context of watershed pollution exacerbated by climate change, which makes watershed management increasingly challenging, GHG emissions should be considered a critical factor. When applying BMPs, it is essential to consider not only the TP removal efficiency and expected costs but also GHG emissions. Although previous studies have evaluated the cost and water quality improvement effects associated with BMP application at the watershed level, studies assessing GHG emissions are lacking. Therefore, this study aimed to perform a multi-objective optimization, considering factors such as costs and GHG emissions when applying BMPs to reduce TP loads at the study site. The specific objectives were to (1) evaluate the effects of BMPs applied to watershed management using a watershed model, and (2) derive optimal BMP scenarios that simultaneously optimize water quality improvement effects, costs, and GHG emissions, using a multi-objective optimization algorithm.

2. Materials and Methods
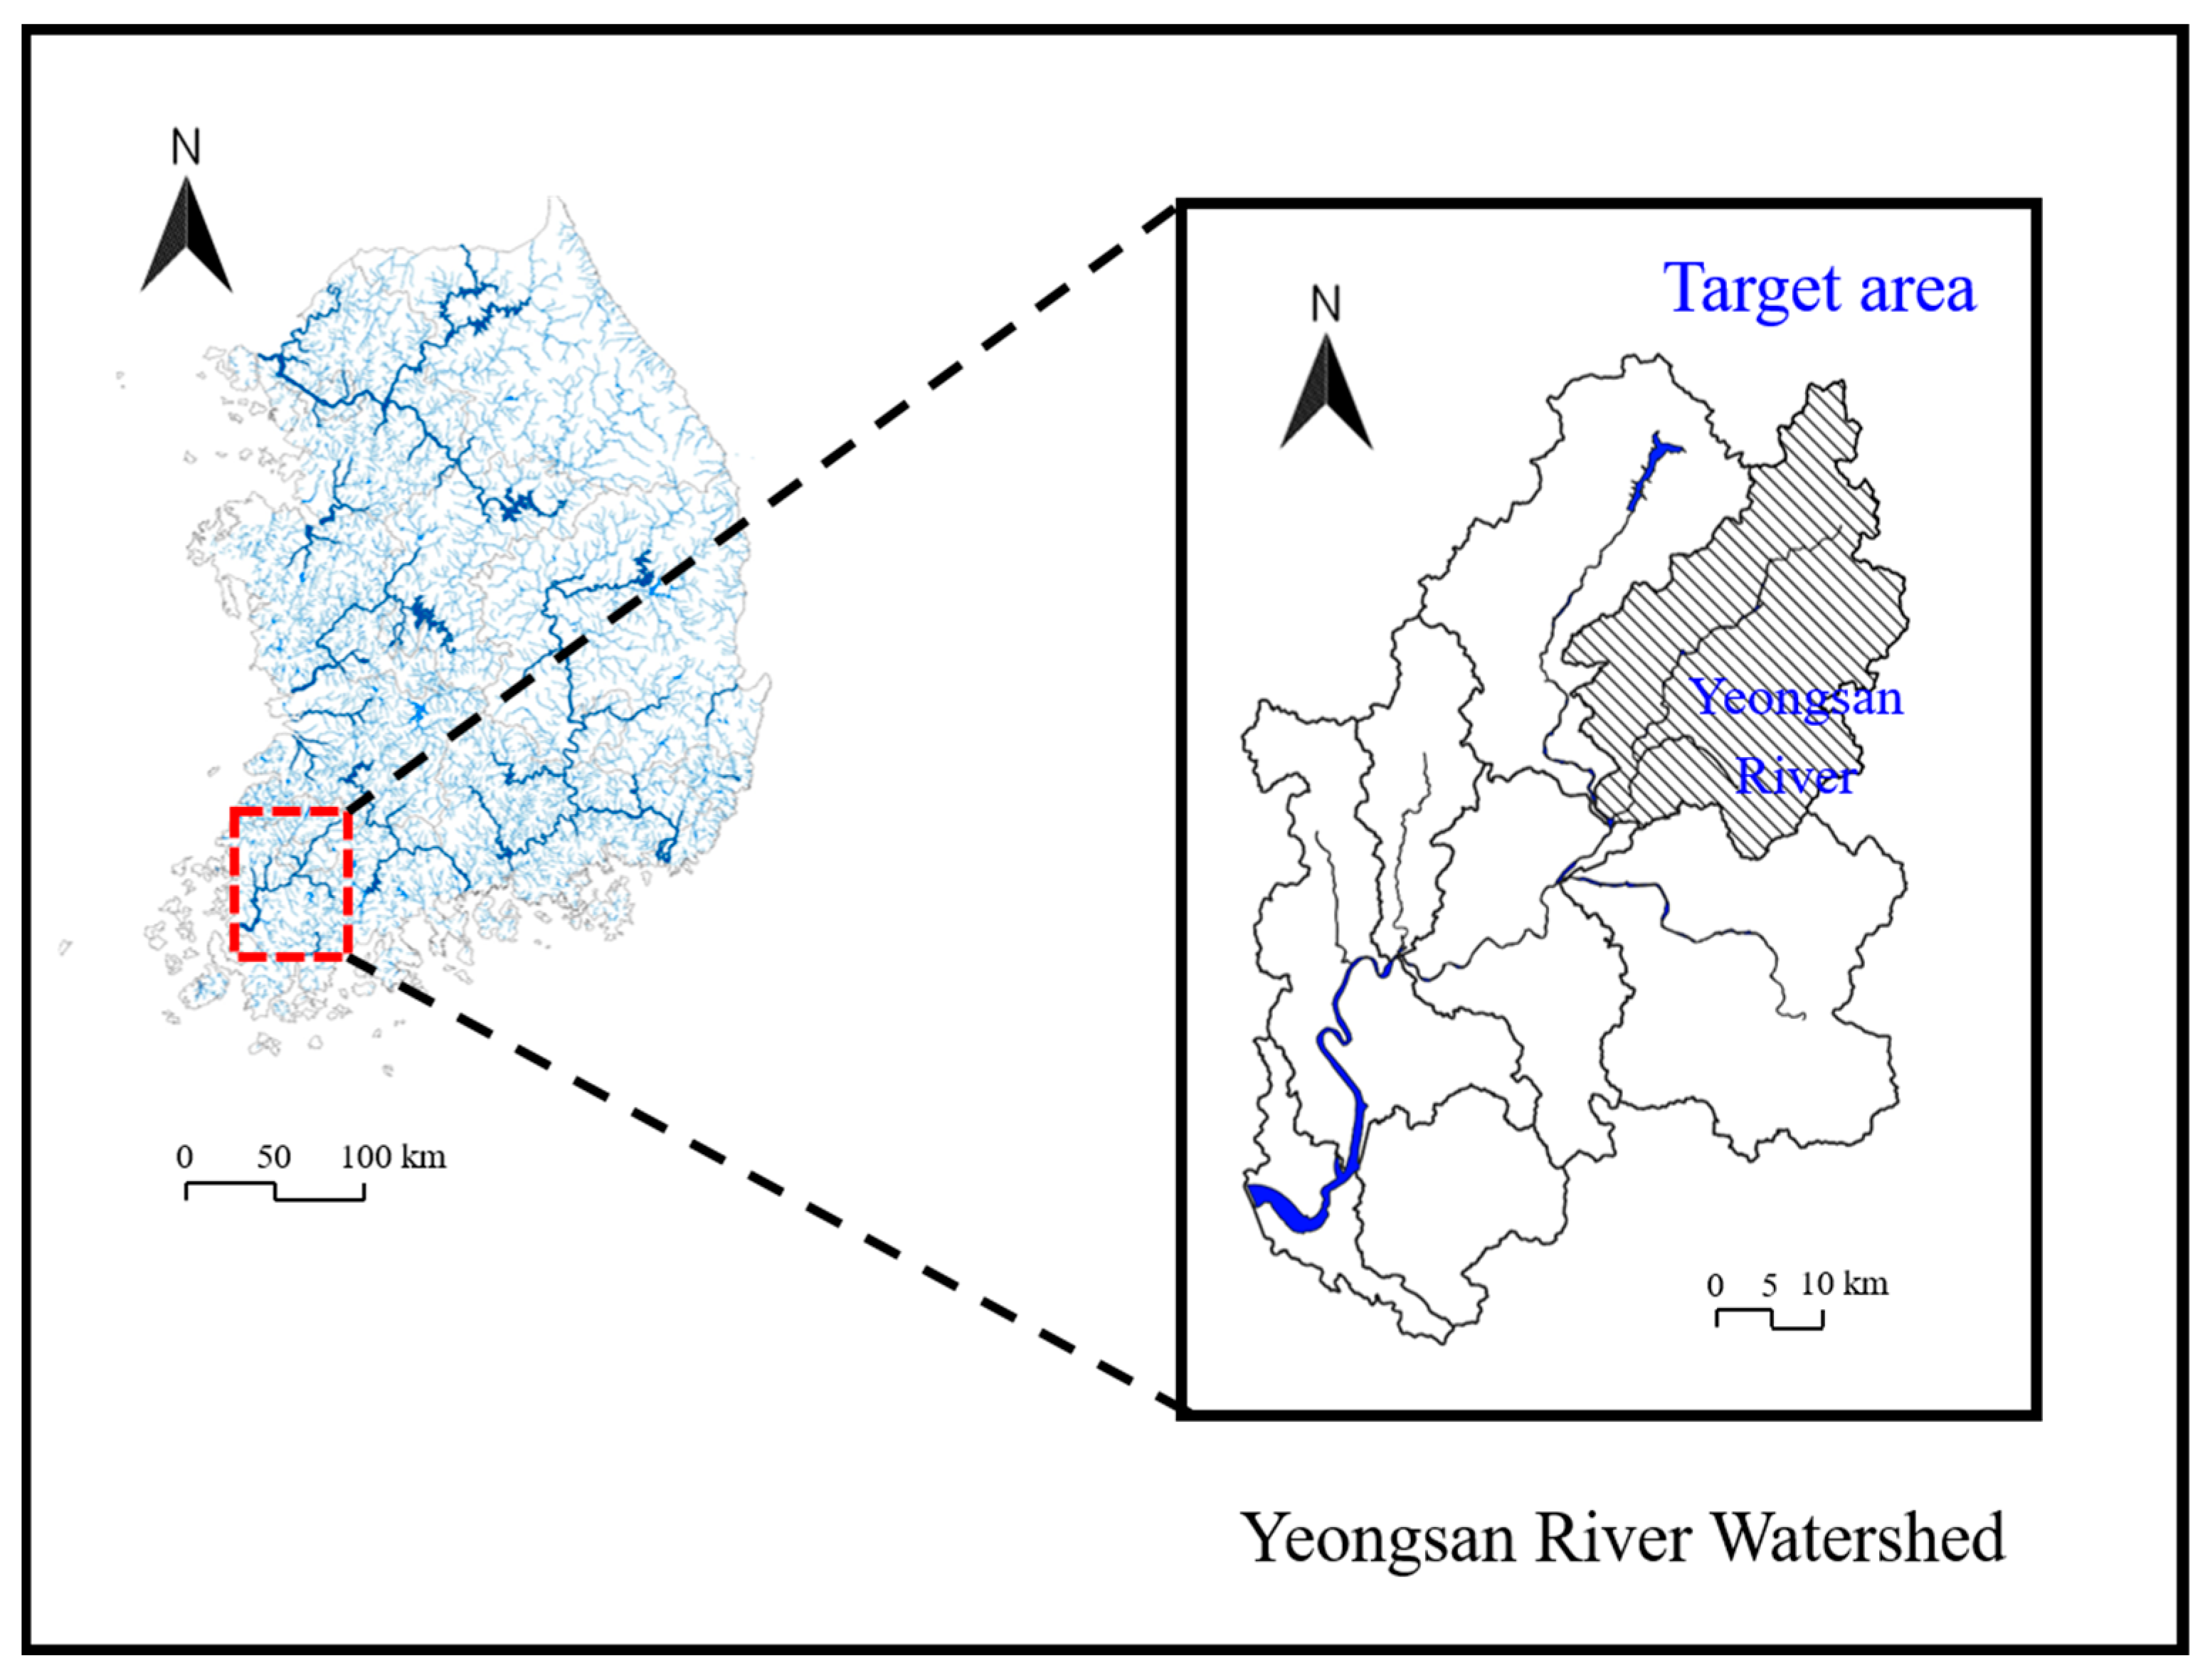
2.1. Study Site

The Yeongsan River, originating in Damyang County, Jeollanam-do, and flowing to Mokpo City, Jeollanam-do, is a national river that serves as a vital water resource for the Jeollanam-do and Gwangju metropolitan city (Figure 1). The Yeongsan River watershed is located in southwestern part of South Korea (N 34°40′16″–35°29′01″, E 126°26′12″–127°06′07″). Historically, the Honam region, where the Yeongsan River is located, has been a key agricultural hub on the Korean Peninsula, with a relatively high emphasis on farming activities compared with other regions. Consequently, the Yeongsan River watershed has encountered significant non-point source pollution damage from agricultural activities, surpassing other major river watersheds in Korea [9,26].
In this study, we focused on the upper watershed of the Yeongsan River (Figure 1). Given its combination of urban and agricultural zones, it is necessary to consider the various sources of water pollution from urban and agricultural areas. The target area, spanning from Yong-myeon in Damyang County to Mareuk-dong in Seo-gu, Gwangju City, covers approximately 714.8 km2. As of 2021, the agricultural area within this watershed was approximately 139.2 km2, accounting for 19.5% of the total watershed area. Of this, rice farming occupies 75.9 km2 (10.6% of the watershed), and field farming covers 63.3 km2 (8.9% of the watershed). The annual rainfall in the watershed is 1380.6 mm, which is predominantly concentrated in the summer.

2.2. Soil and Water Assessment Tool (SWAT)

SWAT, a watershed model developed by the United States Department of Agriculture, was used to simulate the behavior of streamflow, nutrients, and sediments within the watershed [27,28]. SWAT is predominantly used for simulating areas with a high agricultural presence or regions where agricultural and urban areas are intermixed.
Watershed modeling encompasses an initial phase of delineating the watershed using tools such as a digital elevation model (DEM), land-use map, and soil map. This procedure subdivides the watershed into multiple sub-basins, each subsequently classified into hydrological response units (HRUs) [29]. Following watershed delineation, meteorological data is incorporated to simulate the atmospheric conditions. The SWAT model also integrates data pertaining to point sources, dam releases, and agricultural practices to replicate real-world conditions. Then, the parameters of the SWAT undergo calibration and validation.
The SWAT model requires various types of data for watershed modeling [28], and the following data were obtained in this study: the DEM was acquired from the National Spatial Information Portal, the land-use map from the Environmental Spatial Information Service, and the soil map from the Soil Information System of the Rural Development Administration. Meteorological data were obtained from the Korean Meteorological Administration, and discharge data for the wastewater treatment plant were obtained from the Water Emission Management System of the National Institute of Environmental Research, Korea.

2.3. Non-Dominated Sorting Genetic Algorithm III (NSGA-III)

The genetic algorithm (GA) is an optimization algorithm inspired by natural selection and genetics and is used to find solutions or optimize given problems [30]. NSGA-III is one of the GAs particularly suited to solving multi-objective optimization problems [31,32]. NSGA-III, an improved version of NSGA-II, aims to balance various optimization objectives using a non-dominated sorting mechanism and a reference point approach [25,31,33].
The multi-objective optimization process utilizing NSGA-III was initiated by generating an initial population. Each individual within this population was assessed based on fitness values. The subsequent steps involved the selection of individual parents that undergo crossover and mutation operations, leading to the creation of new offspring. The algorithm evaluated these individuals via processes such as non-dominated sorting and crowding distance calculations, ensuring a balance between Pareto optimality and population diversity. This iterative process continued, governed by hyperparameters such as population size, crossover rate, and mutation rate, until preset termination criteria, such as the number of generations or convergence threshold, were met. Upon completion of these steps, NSGA-III facilitated the execution of multi-objective optimization on the selected criteria, effectively balancing multiple conflicting objectives.

2.4. Description of BMPs

The Yeongsan River watershed is a region with a high proportion of agricultural activities, such as paddy and soybean fields [9,26]. Therefore, it was anticipated that addressing non-point source pollution from agricultural activities would be crucial for reducing TP loads in this area. Consequently, BMPs that could improve watershed water quality in response to agricultural activities were selected for adaptation. The selected BMPs are listed in Table 1.
HRUs are the basic units used to simulate the behavior of materials within a watershed in the SWAT model [29]. Therefore, when applying BMPs, it is necessary to implement them at the HRU level. This requires adjusting the parameter values for the HRUs corresponding to the agricultural areas. In this study, we focused on paddy and soybean fields, which are representative agricultural types in the Yeongsan River watershed [41]. The parameters that require adjustment for the application of BMPs to the HRUs of paddy and soybean fields are listed in Table 1.
To apply the BMPs presented in Table 1 to research studies, it is necessary to categorize them into individual scenarios, as shown in Table 2. The BMP scenarios were divided into 18 fields, including 7 paddy fields and 11 soybean fields. Specifically, conservation tillage (CT), detention pond (DP), and reduction of fertilizer (RF) were applied to the paddy fields, and CT, no-tillage (NT), DP, RF, and riparian buffer (RB) were applied to the soybean fields. The costs and GHG emissions for each BMP scenario are summarized in Table 2. NT is considered unsuitable for paddy fields because rice farming necessitates tilling [41]. Furthermore, RB was not utilized because runoff from paddy fields typically flows directly into drainage channels, leading to rivers bypassing RBs [41]. Therefore, NT and RB do not apply to paddy fields.

2.5. Methodology for Exploring the Optimal BMPs for the Yeongsan River Watershed

Figure 2 shows the schematic diagram for exploring the optimal BMPs. First, the necessary input data for constructing the SWAT model were secured, and the SWAT model for the Yeongsan River watershed was constructed. Following the model construction, calibration and validation of the SWAT model were conducted using the SWAT Calibration and Uncertainty Program (SWAT-CUP) [42]. The modeling period encompassed 2012–2021, with 2012–2016 as the setup period, 2017–2019 as the calibration period, and 2020–2021 as the validation period. After calibration and validation of the SWAT model, the TP removal efficiency was simulated by applying individual BMP scenarios via the adjustment of the SWAT parameters (Table 1). Concurrently, the costs and GHG emissions associated with BMP applications were also estimated. Based on these results, the NSGA-III algorithm was used as an optimization methodology across the three factors.
For this optimization process, hyperparameters within the NSGA-III algorithm were meticulously tuned using a random search method [43]. This fine-tuning of hyperparameters established the foundation for generating an initial population, comprising a diverse array of feasible solutions. Each solution within this population represents a unique combination of TP removal efficiency, cost, and GHG emissions. Individuals within the population were evaluated and selected based on their fitness, which reflects the equilibrium between TP removal efficiency, cost, and minimal GHG emissions. Through iterative cycles of selection, crossover, mutation, and ranking via non-dominated sorting, the process continued until reaching the predetermined number of iterations or convergence. The outcome yielded a set of optimal solutions from the non-dominated front, delineating effective BMP scenarios that optimize the competing objectives of efficiency, cost, and emissions within the watershed management strategy.

3. Results and Discussion

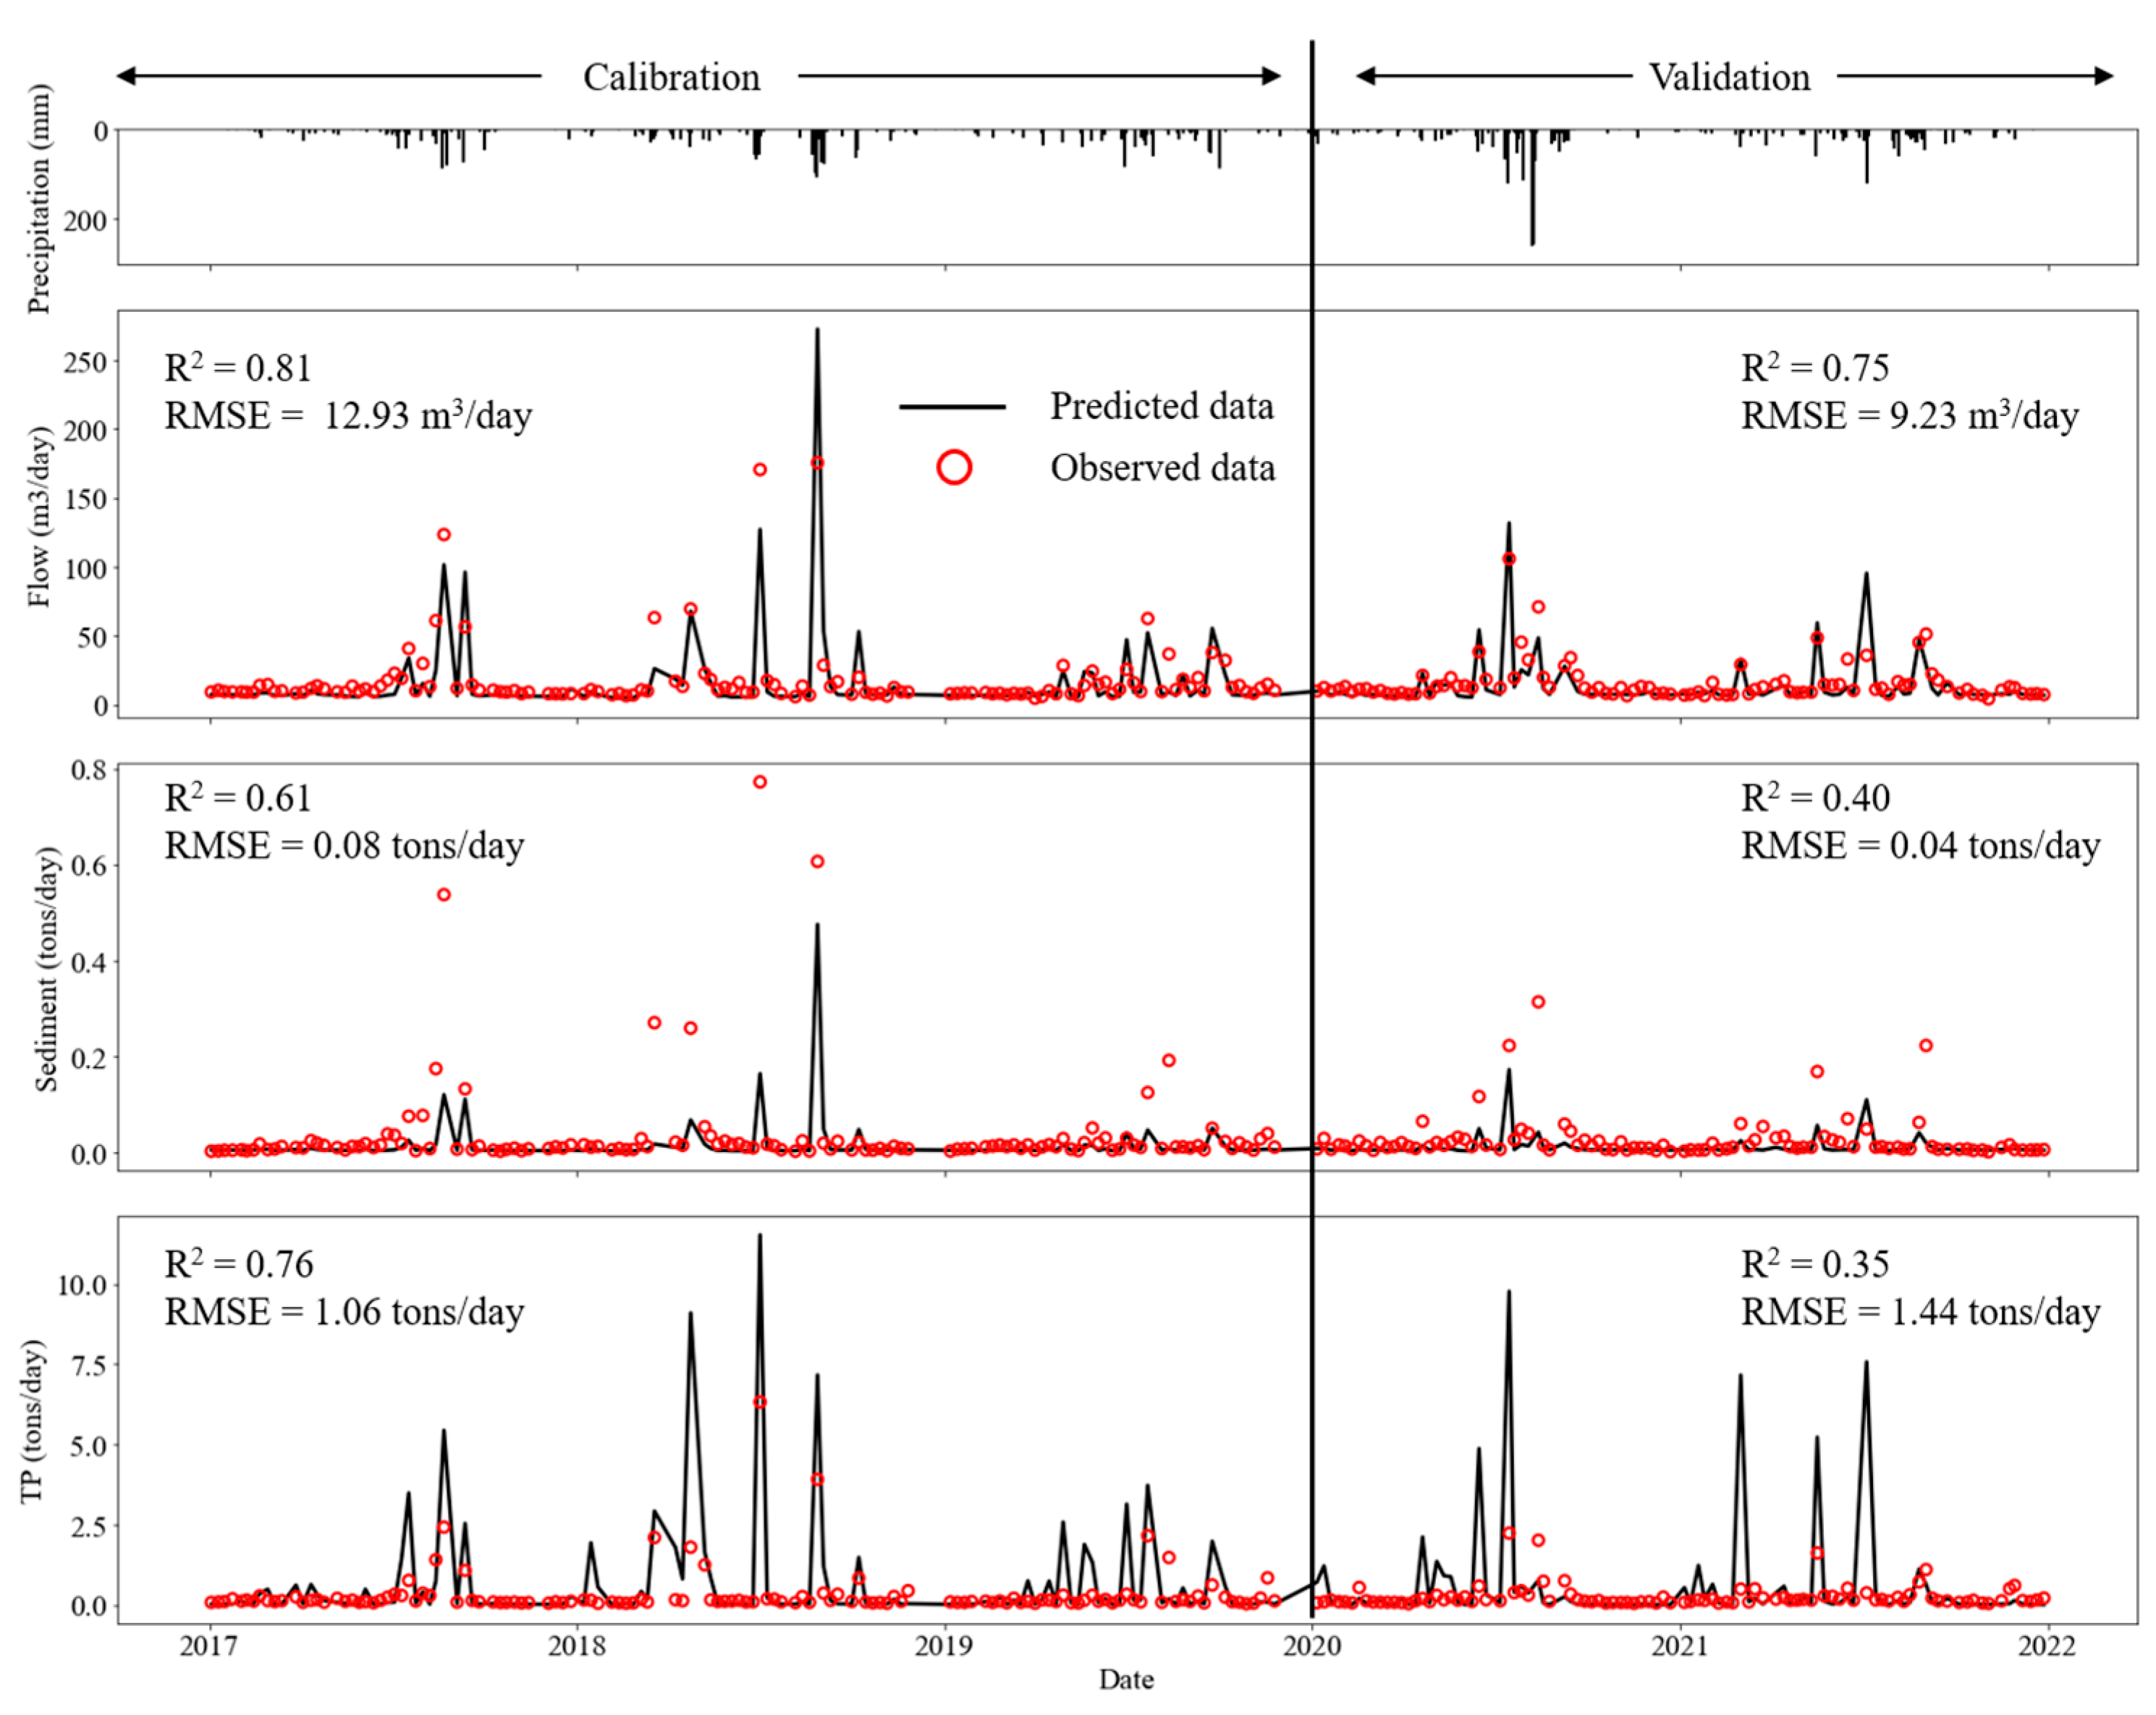
3.1. Calibration and Validation of the SWAT Model

The SWAT model constructed for the Yeongsan River watershed comprised 52 sub-basins. In total, 965 HRUs were delineated, with 150 corresponding to paddy fields and 75 corresponding to soybean fields. The proportion of HRUs for paddy fields was approximately 12.48%, and HRUs for soybean fields accounted for approximately 4.77%. The status of the HRUs for the paddy and soybean fields is shown in Figure 3.
After constructing the SWAT model for the Yeongsan River watershed, parameter calibration and validation were performed. The SWAT calibration and uncertainty programming (SWAT-CUP) method was used to calibrate and validate the streamflow, sediment, and TP load parameters, and the results are shown in Figure 4. The performance evaluation of SWAT was based on R2 and root-mean-squared error (RMSE). The calibration for streamflow showed an R2 value of 0.81 and RMSE of 12.93 m3/day during the calibration period, and an R2 of 0.75 and RMSE of 9.23 m3/day during the validation period. For sediments, the calibration period results showed an R2 value of 0.61 and RMSE of 0.08 tons/day, whereas the validation period had an R2 of 0.40 and RMSE of 0.04 tons/day. The model exhibited an R2 value of 0.76 and RMSE of 1.06 tons/day during calibration for TP. Subsequently, during validation, the R2 value was 0.35 and RMSE was 1.44 tons/day. The results demonstrated that the SWAT model generally reflected the observed pattern; however, instances of overestimation or underestimation were noted compared with the observed values, particularly during monsoon periods, for streamflow, sediment, and TP load. Despite these discrepancies, the SWAT model exhibited sufficient predictive accuracy to simulate the behavior of these variables, enabling the subsequent evaluation of BMPs.

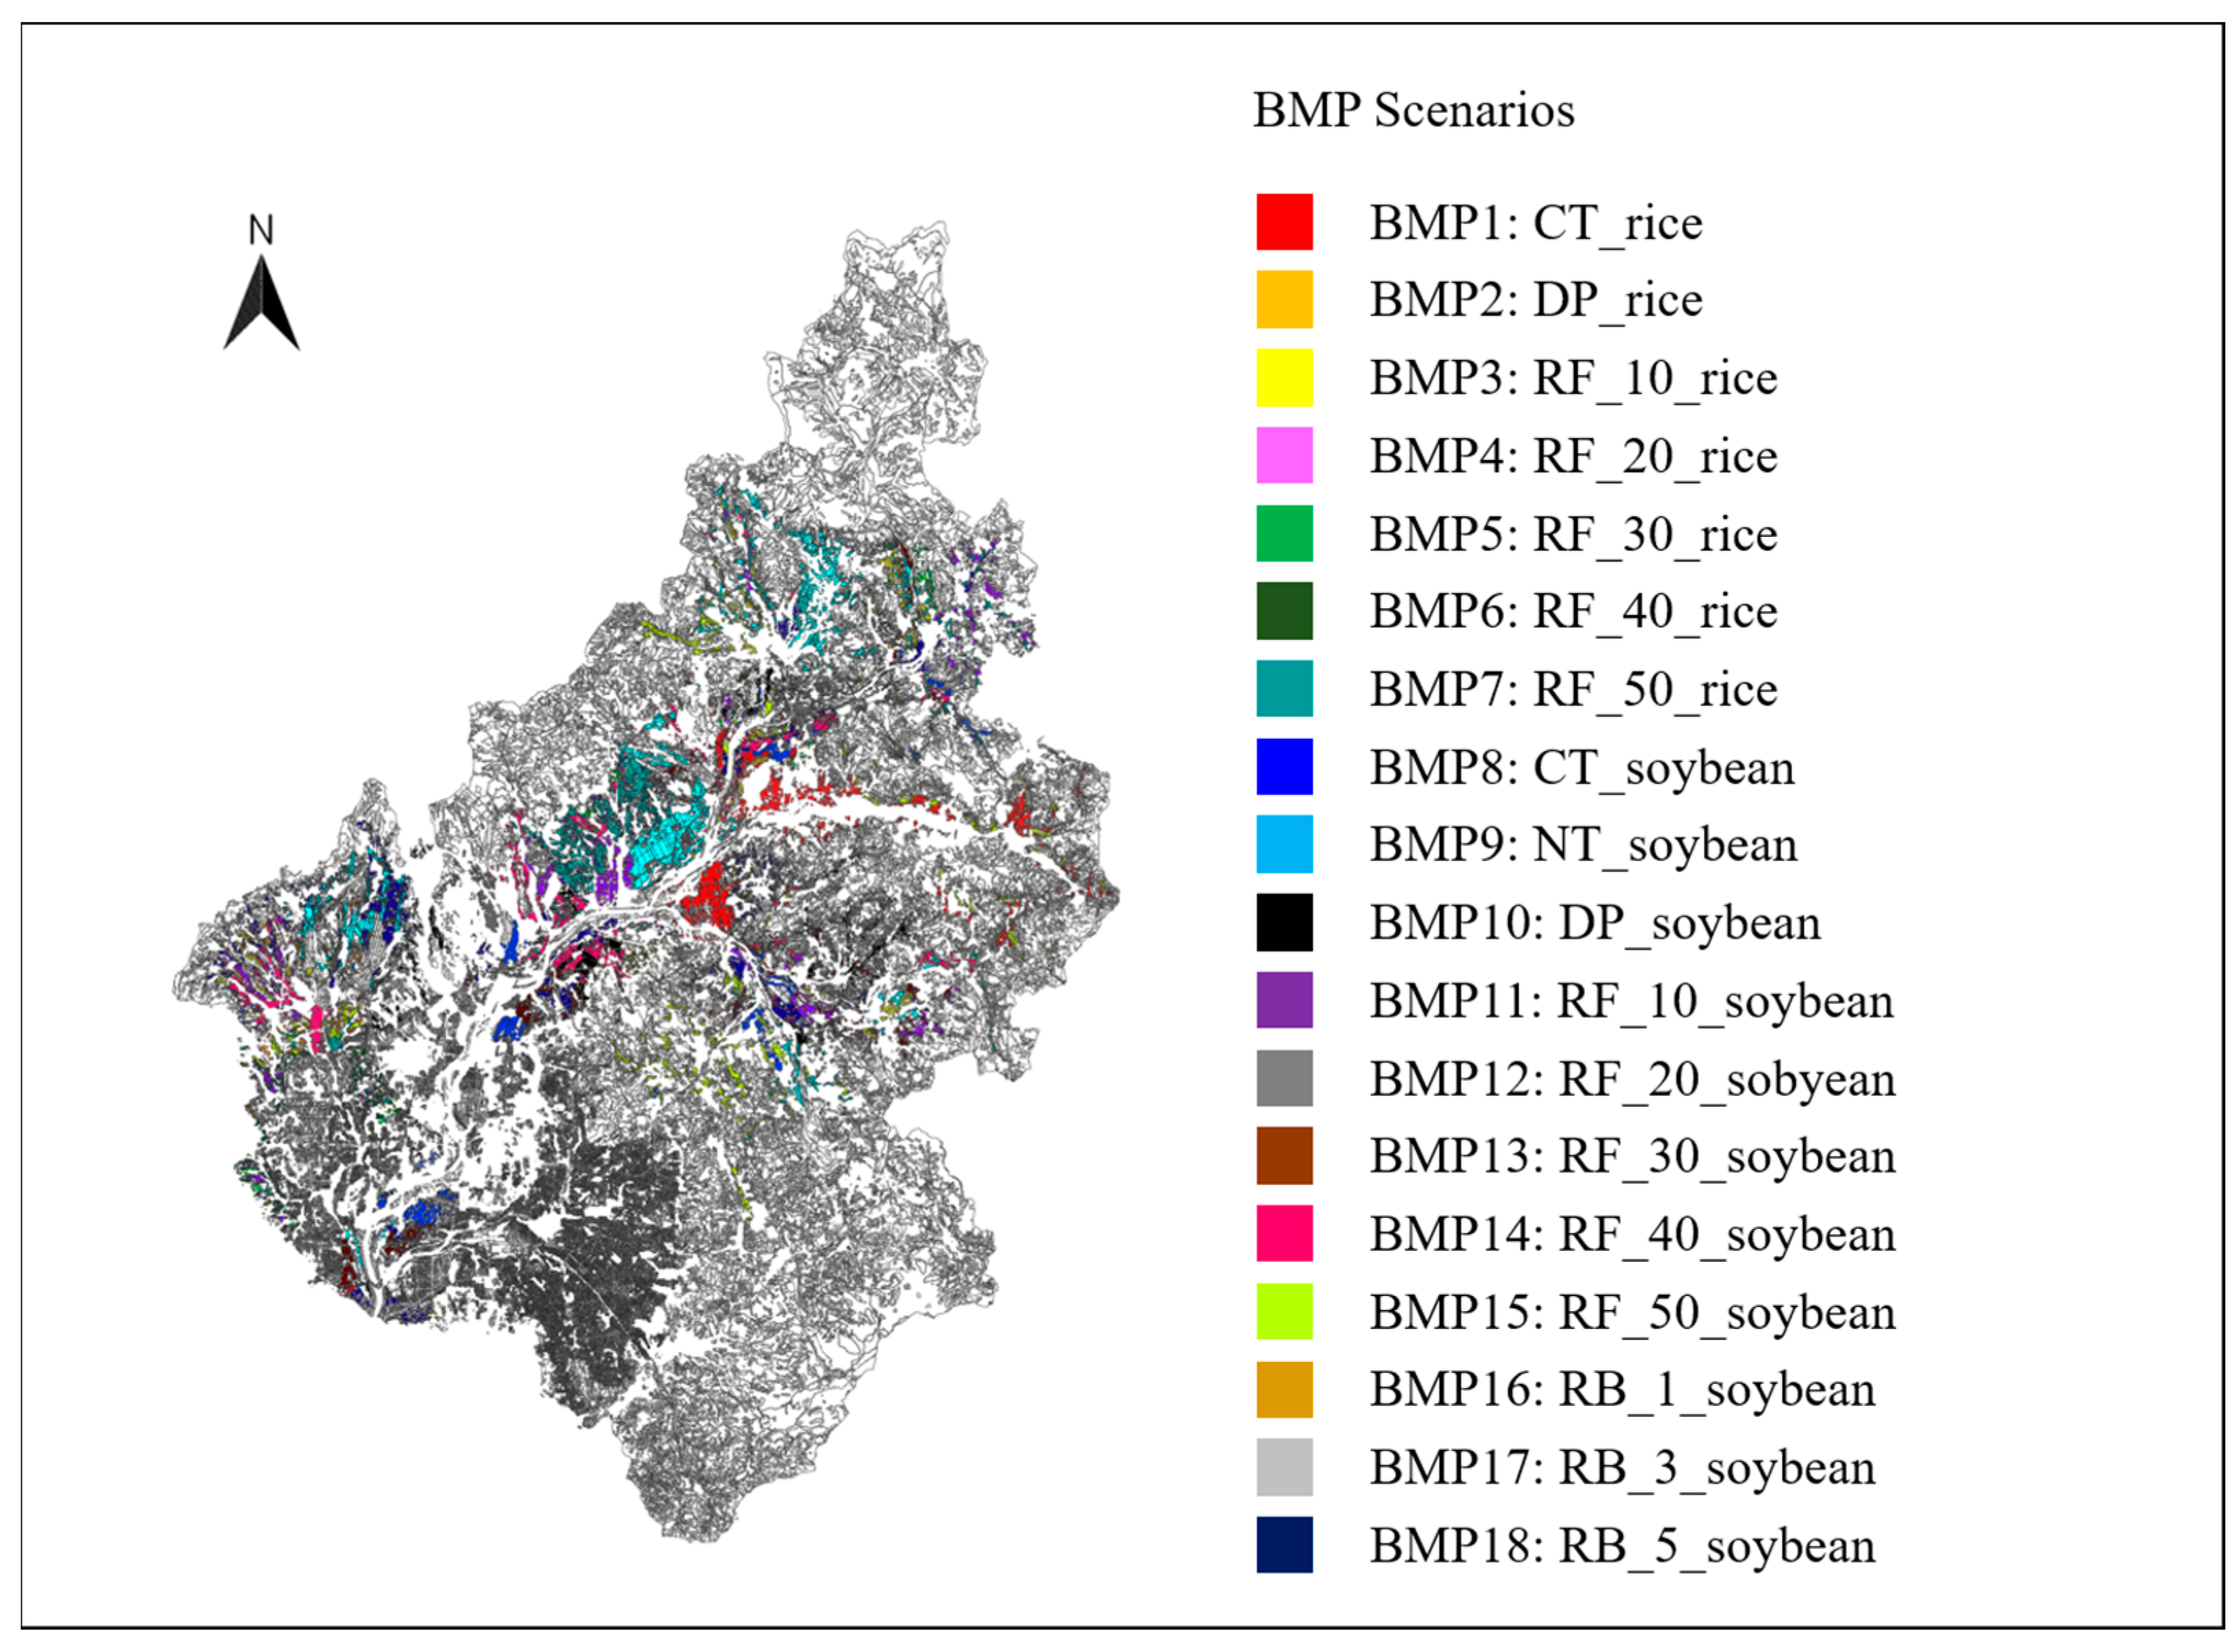
3.2. Effects of Application of BMP Scenarios

A total of 18 BMP scenarios, presented in Table 2, were applied to evaluate TP removal efficiency, costs, and GHG emissions. The TP removal efficiencies of the BMP scenarios are shown in Figure 5a and Table 3. The costs associated with the implementation of BMPs depicted in Figure 5a and Table 3 were computed by multiplying the area of the HRUs corresponding to paddy and soybean fields by the cost per unit area associated with each BMP. Jeon [41] reported that, in the Yeongsan River watershed, a 50% reduction in fertilizer and a 5 m RB are the most effective methodologies in terms of TP removal efficiency. Pyo et al. [20] indicated that in the Lake Erie watershed, RB and contour cropping were the most effective methodologies, whereas NT and nutrient management were relatively less effective. In this study, for paddy fields BMP7 showed the highest efficiency, at 26.87%, whereas BMP2 displayed the lowest efficiency, at 0.53%. In soybean fields, BMP18 exhibited the highest reduction efficiency of 7.17%, whereas BMP9 showed the lowest efficiency of 0.04%. This indicates that to maximize TP removal efficiency in the Yeongsan River watershed, a 50% reduction in fertilizer application for paddy fields and the establishment of a 5 m RB zone for soybean fields is the most effective strategy.
The costs incurred from the application of the BMP scenarios can be examined using Figure 5b and Table 3. Pyo et al. [20] reported that CT, NT, and contour cropping methods are the most cost-effective methodologies for the Lake Erie watershed. In this study, for the BMP scenarios applied to paddy fields, BMP2 required the highest cost of 1.09 million dollars, whereas BMP1 had no associated costs. In the case of BMP scenarios for soybean fields, BMP10 incurred the highest cost at 0.16 million dollars, and the BMP8 application did not necessitate any costs. Researchers in previous studies have indicated that the cost of implementing CT was considered as zero because farmers were already utilizing this method and it was deemed feasible to adopt without requiring additional subsidies. This rationale was also adopted for use in the current study [44].
The anticipated GHG emissions from the BMP scenarios are shown in Figure 5c and Table 3. Similar to the cost calculations, the GHG emissions presented in Figure 5c and Table 3 were calculated by multiplying the GHG emissions per unit area associated with the BMPs by the area of HRUs corresponding to paddy and soybean fields. For paddy fields, BMP1 showed the highest emissions at 60.49 kt CO2 eq., and BMP7 showed the lowest at 7.44 kt CO2 eq. For soybean fields, BMP10 showed the highest emissions at 9.13 kt CO2 eq., and BMP15 showed the lowest emissions at 1.13 kt CO2 eq. As presented in Table 2, the GHG emissions of the CT and DP were higher than those of the other BMPs. Given the larger area of paddy fields compared with soybean fields, it is expected that the application of BMP1 and BMP2 would result in higher GHG emissions. As mentioned previously, BMP1 is effective in terms of TP removal efficiency and cost; however, its application may require careful consideration because of the significant amount of GHG emissions recorded upon application.
We found that the optimal BMP scenarios differed in terms of TP removal efficiency, cost, and GHG emissions during application. To maximize the TP removal efficiency, BMP7 was optimal in paddy fields, and BMP18 was optimal in soybean fields. BMP1 and BMP8 were the most effective methods for reducing costs in both paddy and soybean fields. To minimize GHG emissions, BMP7 and BMP18 were the most effective in both paddy and soybean fields. However, implementing a 50% reduction in fertilizer usage may not be the most cost-effective BMP application. Drastically cutting fertilizer usage by such a margin may indeed improve water quality and GHG emissions, but it could also potentially decrease agricultural production. Consequently, unilaterally reducing fertilizer usage could lead to conflicts among stakeholders. Pyo et al. [20] has shown that while contour cropping may excel in terms of cost-effectiveness, it may also result in a perception gap among stakeholders, indicating the presence of tradeoffs that need to be carefully considered. Therefore, instead of applying a single BMP with high efficiency throughout the entire watershed, this study determined that it is necessary to identify the optimal BMPs by comprehensively considering TP removal efficiency, cost, and GHG emissions. Through this approach, the research aimed to explore a combination of optimized BMP scenarios across the entire watershed.

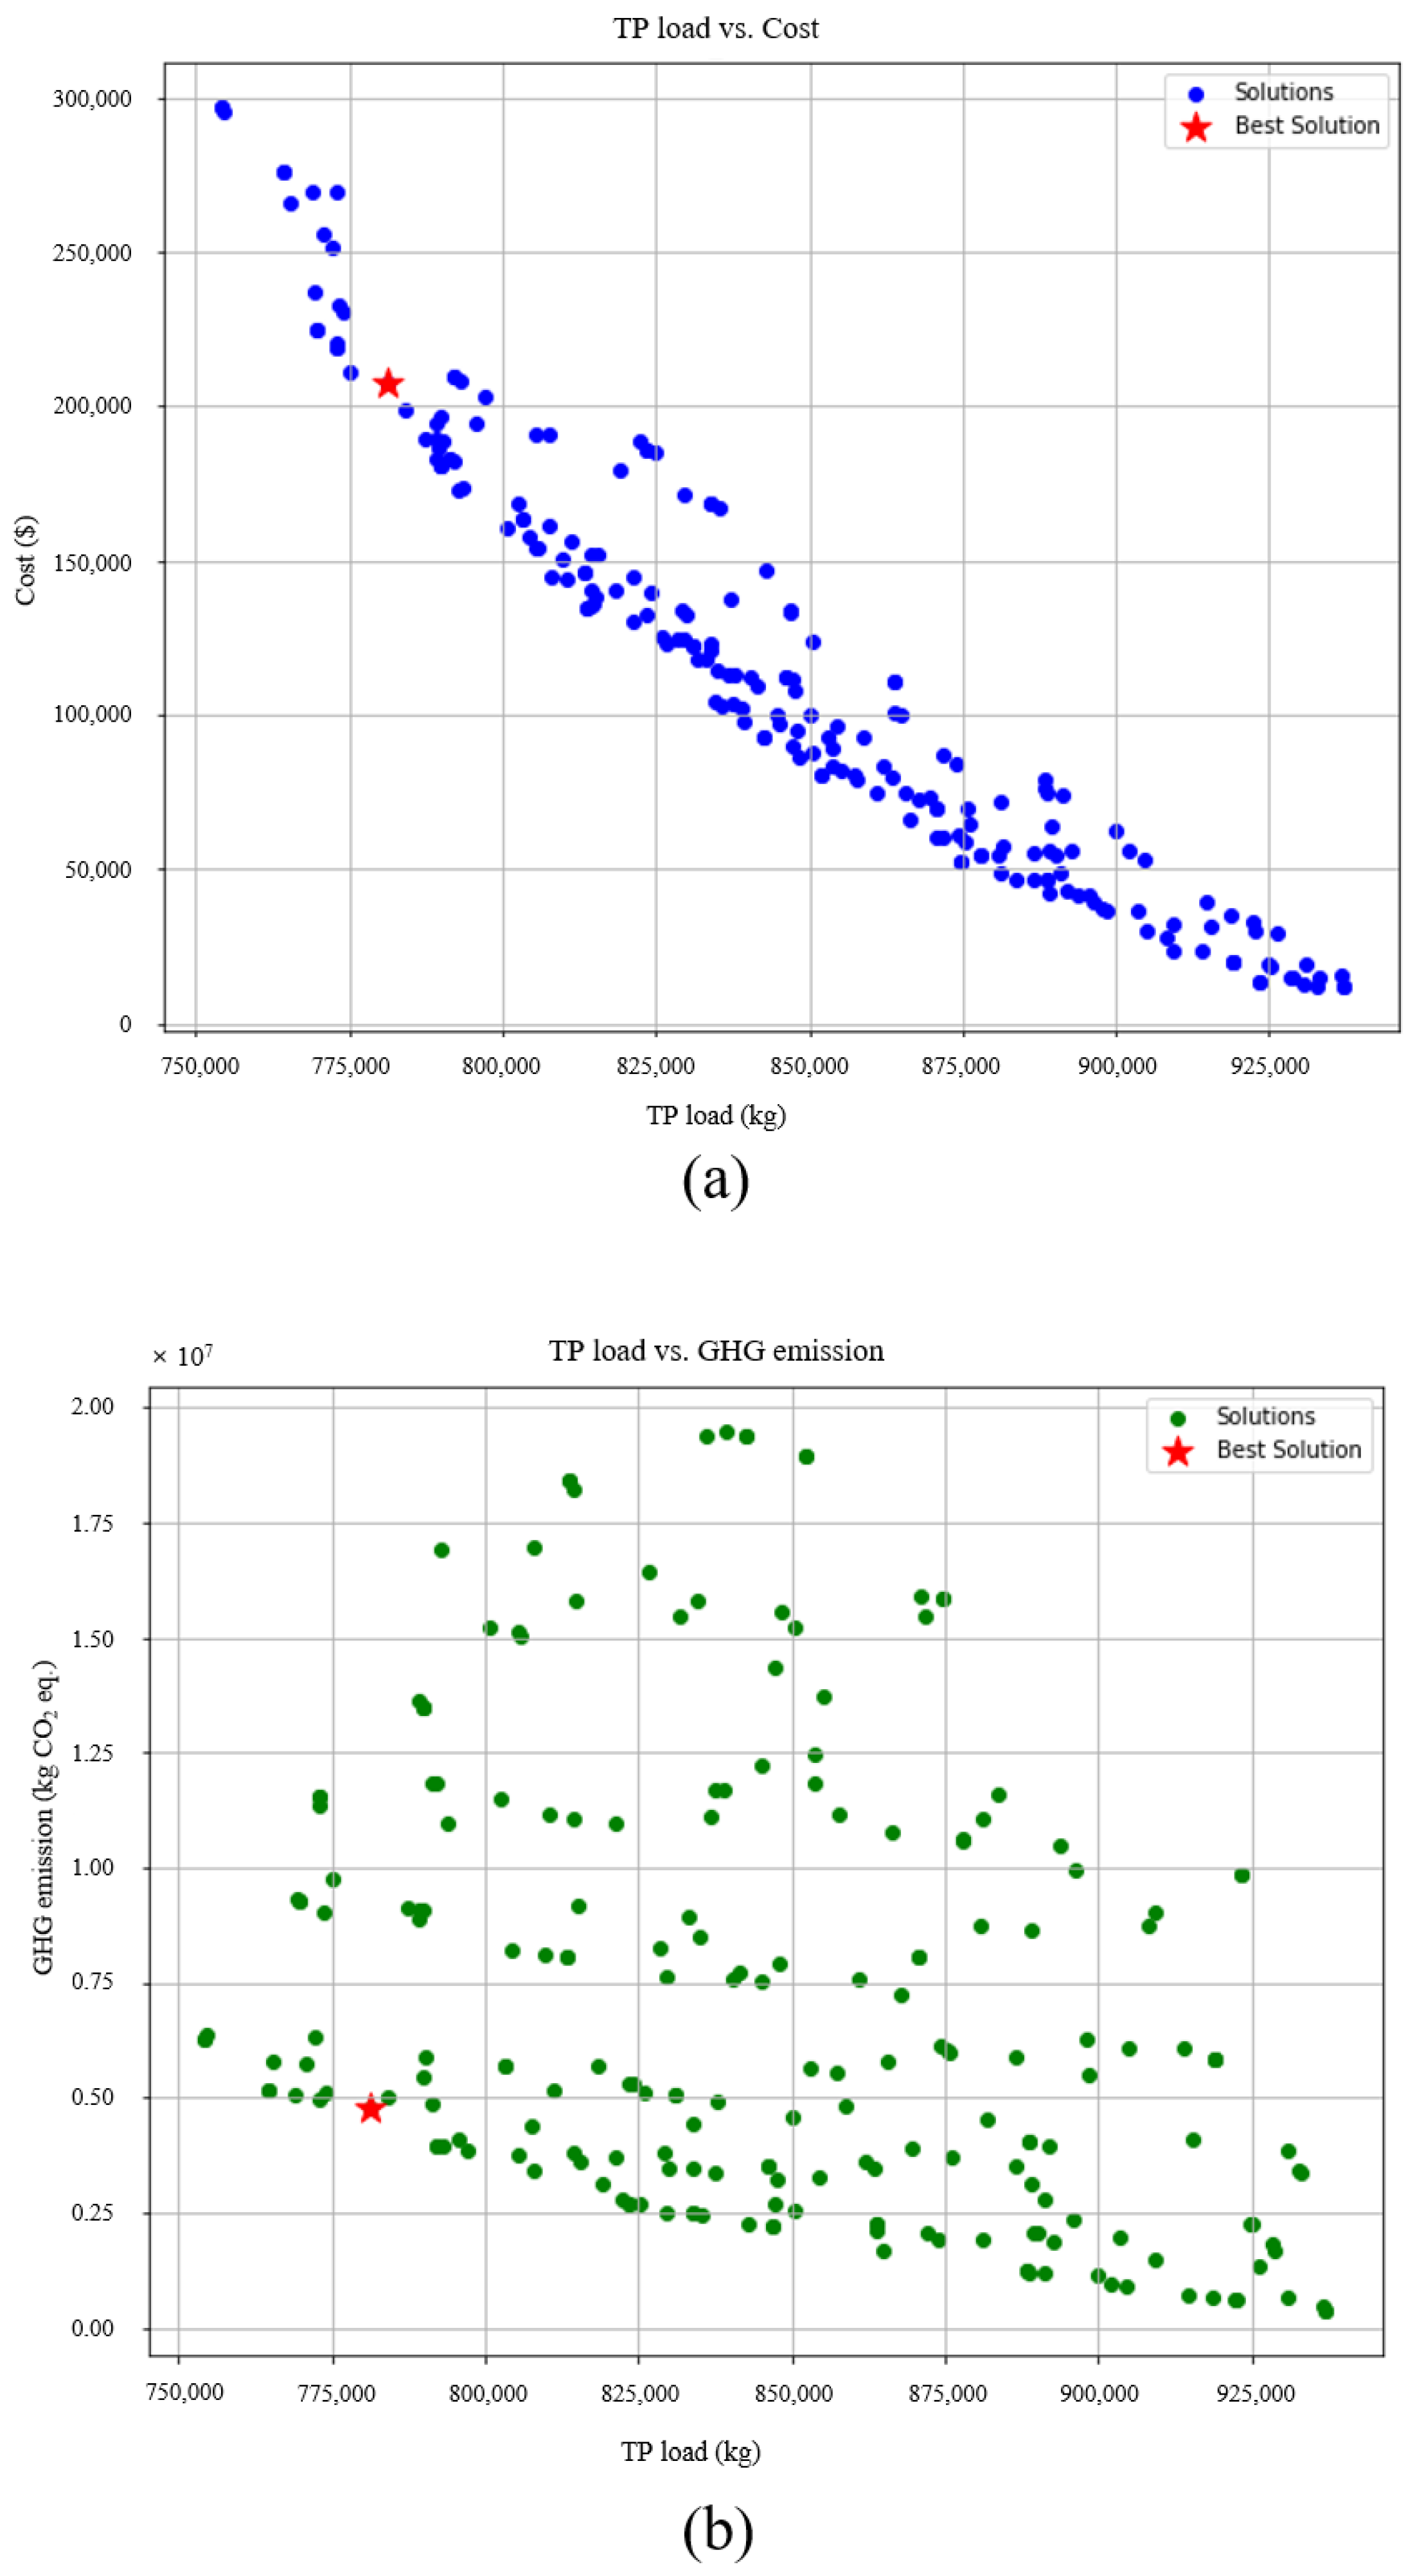
3.3. Exploration of the Optimal BMPs for the Yeongsan River Watershed

The TP removal efficiency, cost, and GHG emissions were evaluated for individual BMP scenarios. Uniform application of the same BMPs across an entire watershed can lead to suboptimal TP removal efficiency, cost, and GHG emissions. Hence, multi-objective optimization using NSGA-III was employed in this study. For this optimization, the hyperparameters embedded in the algorithm were fine-tuned [45]. Hyperparameter values were explored using the random search method [38]. The optimized hyperparameters, discernible in Table 4, were determined to be a population size of 210, a total of 524 iterations, a crossover rate of 0.5631, and a mutation rate of 0.2083.
The results of the multi-objective optimization for TP removal efficiency, cost, and GHG emissions using the NSGA-III algorithm based on optimized hyperparameters are shown in Figure 6. These results represent the simultaneous optimization of the TP removal efficiency, cost, and GHG emissions for the Yeongsan River watershed. Among the solutions obtained through the NSGA-III algorithm, the best solution indicated a TP load of 781.1 tons, a cost of 0.2 million dollars, and GHG emissions of 4.8 kt CO2 eq. This reflects a reduction of 21.3% in the TP load compared to the original discharge amount for the watershed.
The results of the multi-objective optimization for the TP removal efficiency, expected cost, and expected GHG emissions are represented in 2D in Figure 7. Figure 7a illustrates the relationship between the TP removal efficiency and cost. An increase in the TP removal efficiency corresponded to an increase in cost, and vice versa. Figure 7b shows the relationship between the TP removal efficiency and GHG emissions, wherein an increase in the TP removal efficiency led to higher GHG emissions and a decrease in efficiency resulted in lower emissions. Figure 7c shows the correlation between cost and GHG emissions, indicating that increases in GHG emissions were accompanied by rising costs and reductions in GHG emissions led to lower costs.
Figure 8 shows the exploration results of the optimal BMP scenarios for the Yeongsan River watershed. Our findings identified BMP7 and BMP18 as the most effective strategies for enhancing TP removal efficiency, whereas BMP1 and BMP8 emerged as the most cost-efficient approaches. In addition, BMP7 and BMP15 demonstrated superior performance in minimizing GHG emissions. Upon optimizing the BMP scenarios for the watershed, BMP7 constituted approximately 62.5% of the paddy fields, followed by BMP1 (37.5%). BMP18 and BMP17 were predominant in soybean fields, accounting for 29.4% and 27.5%, respectively. The analysis of the best BMP scenarios for the Yeongsan River watershed revealed that BMP scenarios showing high efficiency individually did not necessarily perform best when considering the TP removal efficiency, cost, and GHG emissions comprehensively. This highlights that a comprehensive approach that considers all three factors simultaneously is more important than an individual approach that focuses on each factor. In particular, BMP1 was associated with significant GHG emissions when applied. However, the optimized BMP scenario showed that 37.5% of BMPs were utilized in paddy fields. Therefore, we found that it is important to consider the evaluation factors comprehensively when applying BMPs at the watershed level, rather than adopting a singular approach.

3.4. Recommendations for Future Research

In this study, we sought to determine the optimal BMP scenarios that would simultaneously reduce the cost and GHG emissions of TP removal in the Yeongsan River watershed. This study represents the first attempt to consider GHG emissions at the watershed level when applying BMPs, suggesting that this methodology could be used to find optimal, region-specific BMPs in other watersheds that also consider GHG emissions. Although this study focused on TP load reduction, other water quality factors, such as total nitrate load or sediment, could also be considered. Additionally, exploring parameters, such as water usage and soil health indicators, along with water quality improvement, could potentially lead to more sophisticated applications of BMPs.
Future studies should consider incorporating actual watershed conditions when approaching costs and GHG emissions. In this study, the numerical data regarding the cost and GHG emissions were derived from previous studies. These data, which reflect the environment and circumstances specific to the researchers, may differ from the actual conditions in the Yeongsan River watershed. Therefore, future research could benefit from utilizing data derived from actual watershed conditions.

4. Conclusions

Ensuring the sustainability of aquatic ecosystems hinges on maintaining watershed water quality, with BMPs serving as pivotal tools to enhance water quality while mitigating environmental impacts. This study leveraged the SWAT model alongside the NSGA-III multi-objective optimization algorithm to concurrently optimize water quality improvement, cost, and GHG emission reduction through BMP application at the watershed scale. Notably, this research represents the first endeavor at the watershed level to integrate GHG emissions alongside TP removal efficiency and cost considerations in BMP application. The findings revealed an optimal BMP configuration, enhancing water quality by 21.3% relative to baseline conditions, incurring a cost of 0.2 million dollars, and resulting in 4.8 kt CO2 eq. of GHG emissions. This delicate balance between cost and environmental impact underscores the economic and sustainable viability of BMPs in watershed management, offering crucial insights for stakeholders and decision-makers engaged in resource management.
While this study focused on enhancing TP removal efficiency, it provides a foundation for future research to assess improvements in water quality concerning total nitrogen load and sediment dynamics. Such endeavors promise a more comprehensive evaluation of the impacts of agricultural practices on aquatic ecosystems, facilitating the formulation of tailored management strategies specific to watershed requirements. Furthermore, by integrating additional environmental indicators such as water usage and soil health in subsequent investigations, optimal solutions spanning a broader spectrum of factors can be explored, culminating in more efficacious watershed management outcomes. This holistic approach not only aids in regulatory compliance but also fosters stakeholder engagement by elucidating the trade-offs and synergies between diverse management alternatives.
Through this study, we underscore the value of integrating cost, TP removal efficiency, and GHG emission considerations into BMP application decision-making processes, aligning with overarching environmental sustainability objectives. Such an approach promotes collaborative and informed decision-making among stakeholders, potentially fostering increased community involvement and support for sustainable agricultural and environmental policies.

Author Contributions

Conceptualization, D.S.J. and Y.P.; methodology, D.S.J. and J.H.K. (Jin Hwi Kim); data curation, J.H.K. (Jin Hwi Kim); writing—original draft preparation, D.S.J.; writing—review and editing, J.H.K. (Joon Ha Kim) and Y.P.; supervision, Y.P.; funding acquisition, Y.P. All authors have read and agreed to the published version of the manuscript.

Funding

This paper was supported by Konkuk University in 2022.

Institutional Review Board Statement

Not applicable.

Informed Consent Statement

Not applicable.

Data Availability Statement

The data that support the findings in this study are available from the corresponding author upon reasonable request.

Acknowledgments

We would like to thank the Ministry of Environment and the Korea Meteorological Administration for sharing data.

Conflicts of Interest

The authors declare no conflicts of interest.

References

  1. Fang, C.; Cui, X.; Li, G.; Bao, C.; Wang, Z.; Ma, H.; Sun, S.; Liu, H.; Luo, K.; Ren, Y. Modeling regional sustainable development scenarios using the Urbanization and Eco-environment Coupler: Case study of Beijing-Tianjin-Hebei urban agglomeration, China. Sci. Total Environ. 2019, 689, 820–830. [Google Scholar] [CrossRef] [PubMed]
  2. Huang, G.; Zhang, M.; Liu, C.; Li, L.; Chen, Z. Heavy metal (loid) s and organic contaminants in groundwater in the Pearl River Delta that has undergone three decades of urbanization and industrialization: Distributions, sources, and driving forces. Sci. Total Environ. 2018, 635, 913–925. [Google Scholar] [CrossRef] [PubMed]
  3. Priyadarshini, I.; Alkhayyat, A.; Obaid, A.J.; Sharma, R. Water pollution reduction for sustainable urban development using machine learning techniques. Cities 2022, 130, 103970. [Google Scholar] [CrossRef]
  4. Mao, Y.; Zhang, H.; Cheng, Y.; Zhao, J.; Huang, Z. The characteristics of nitrogen and phosphorus output in China’s highly urbanized Pearl River Delta region. J. Environ. Manag. 2023, 325, 116543. [Google Scholar] [CrossRef]
  5. Ongley, E.D.; Xiaolan, Z.; Tao, Y. Current status of agricultural and rural non-point source Pollution assessment in China. Environ. Pollut. 2010, 158, 1159–1168. [Google Scholar] [CrossRef] [PubMed]
  6. Busico, G.; Fronzi, D.; Colombani, N.; Mastrocicco, M.; Tazioli, A. Identification and quantification of nutrients sources in the Aspio watershed (Italy). Insight from geogenic mineralization and anthropogenic pressure. Catena 2024, 236, 107759. [Google Scholar] [CrossRef]
  7. Solomon, S.; Qin, D.; Manning, M.; Chen, Z.; Marquis, M.; Averyt, K.B.; Tignor, M.; Miller, H.L. Climate Change 2007: The Physical Science Basis; Cambridge University Press: Cambridge, UK; New York, NY, USA, 2007. [Google Scholar]
  8. Stocker, T.F.; Qin, D.; Plattner, G.-K.; Tignor, M.; Allen, S.K.; Boschung, J.; Nauels, A.; Xia, Y.; Bex, V.; Midgley, P.M. Summary for Policymakers; Cambridge University Press: Cambridge, UK; New York, NY, USA, 2013; pp. 1–30. [Google Scholar]
  9. Kang, J.-H.; Lee, S.W.; Cho, K.H.; Ki, S.J.; Cha, S.M.; Kim, J.H. Linking land-use type and stream water quality using spatial data of fecal indicator bacteria and heavy metals in the Yeongsan river basin. Water Res. 2010, 44, 4143–4157. [Google Scholar] [CrossRef] [PubMed]
  10. Gooré Bi, E.; Gachon, P.; Vrac, M.; Monette, F. Which downscaled rainfall data for climate change impact studies in urban areas? Review of current approaches and trends. Theor. Appl. Climatol. 2017, 127, 685–699. [Google Scholar] [CrossRef]
  11. Salerno, F.; Gaetano, V.; Gianni, T. Urbanization and climate change impacts on surface water quality: Enhancing the resilience by reducing impervious surfaces. Water Res. 2018, 144, 491–502. [Google Scholar] [CrossRef] [PubMed]
  12. Korean Government. 2050 Carbon Neutrality Scenario; Korean Government: Seoul, Republic of Korea, 2021. Available online: https://www.2050cnc.go.kr/storage/board/base/2021/12/07/BOARD_ATTACH_1638853060035.pdf (accessed on 18 April 2024).
  13. Wang, Z.; Chen, J.; Mao, S.; Han, Y.; Chen, F.; Zhang, L.; Li, Y.B.; Li, C. Comparison of greenhouse gas emissions of chemical fertilizer types in China’s crop production. J. Clean. Prod. 2017, 141, 1267–1274. [Google Scholar] [CrossRef]
  14. Singh, B.; Craswell, E. Fertilizers and nitrate pollution of surface and groundwater: An increasingly pervasive global problem. SN Appl. Sci. 2021, 3, 518. [Google Scholar] [CrossRef]
  15. Schindler, D.W. The effect of fertilization with phosphorus and nitrogen versus phosphorus and nitrogen versus phosphorus alone on eutrophication of experimental lake. Limnol. Ocean. 1980, 25, 1149–1152. [Google Scholar] [CrossRef]
  16. Jeong, H.K.; Im, Y.A.; Kang, K.S. Analysis of the Integrated Crop Livestock Farming System and Improvement Ways; Korea Rural Economic Institute: Naju, Republic of Korea, 2021. [Google Scholar]
  17. Bracmort, K.S.; Arabi, M.; Frankenberger, J.R.; Engel, B.A.; Arnold, J.G. Modeling long-term water quality impact of structural BMPs. Trans. ASABE 2006, 49, 367–374. [Google Scholar] [CrossRef]
  18. Geng, R.; Yin, P.; Sharpley, A.N. A coupled model system to optimize the best management practices for nonpoint source pollution control. J. Clean. Prod. 2019, 220, 581–592. [Google Scholar] [CrossRef]
  19. Arabi, M.; Govindaraju, R.S.; Hantush, M.M. Cost-effective allocation of watershed management practices using a genetic algorithm. Water Resour. Res. 2006, 42, W10429. [Google Scholar] [CrossRef]
  20. Pyo, J.; Baek, S.-S.; Kim, M.; Park, S.; Lee, H.; Ra, J.-S.; Cho, K.H. Optimizing Agricultural Best Management Practices in a Lake Erie Watershed. JAWRA J. Am. Water Resour. Assoc. 2017, 53, 1281–1292. [Google Scholar] [CrossRef]
  21. Jeon, D.J.; Ki, S.J.; Cha, Y.; Park, Y.; Kim, J.H. New methodology of evaluation of best management practices performances for an agricultural watershed according to the climate change scenarios: A hybrid use of deterministic and decision support models. Ecol. Eng. 2018, 119, 73–83. [Google Scholar] [CrossRef]
  22. Kaini, P.; Artita, K.; Nicklow, J.W. Optimizing Structural Best Management Practices Using SWAT and Genetic Algorithm to Improve Water Quality Goals. Water Resour. Manag. 2012, 26, 1827–1845. [Google Scholar] [CrossRef]
  23. Ullrich, A.; Volk, M. Application of the Soil and Water Assessment Tool (SWAT) to predict the impact of alternative management practices on water quality and quantity. Agric. Water Manag. 2009, 96, 1207–1217. [Google Scholar] [CrossRef]
  24. Maringanti, C.; Chaubey, I.; Arabi, M.; Engel, B. Application of a Multi-Objective Optimization Method to Provide Least Cost Alternatives for NPS Pollution Control. Environ. Manag. 2011, 48, 448–461. [Google Scholar] [CrossRef]
  25. Wang, S.; Wang, Y.; Wang, Y.; Wang, Z. Comparison of multi-objective evolutionary algorithms applied to watershed management problem. J. Environ. Manag. 2022, 324, 116255. [Google Scholar] [CrossRef] [PubMed]
  26. Ki, S.J.; Lee, Y.G.; Kim, S.-W.; Lee, Y.-J.; Kim, J.H. Spatial and temporal pollutant budget analyses toward the total maximum daily loads management for the Yeongsan watershed in Korea. Water Sci. Technol. 2007, 55, 367–374. [Google Scholar] [CrossRef] [PubMed]
  27. Arnold, J.G.; Srinivasan, R.; Muttiah, R.S.; Williams, J.R. Large Area Hydrologic Modeling and Assessment Part I: Model Development1. JAWRA J. Am. Water Resour. Assoc. 1998, 34, 73–89. [Google Scholar] [CrossRef]
  28. Arnold, J.G.; Moriasi, D.N.; Gassman, P.W.; Abbaspour, K.C.; White, M.J.; Srinivasan, R.; Santhi, C.; Harmel, R.D.; van Griensven, A.; Van Liew, M.W.; et al. SWAT: Model Use, Calibration, and Validation. Trans. ASABE 2012, 55, 1491–1508. [Google Scholar] [CrossRef]
  29. Gitau, M.W.; Veith, T.L.; Gburek, W.J. Farm-level optimization of BMP placement for cost-effective pollution reduction. Trans. Am. Soc. Agric. Eng. 2004, 47, 1923–1931. [Google Scholar] [CrossRef]
  30. Bekele Elias, G.; Demissie, M.; Lian, Y. Optimizing the Placement of Best Management Practices (BMPs) in Agriculturally-Dominated Watersheds in Illinois. In Proceedings of the World Environmental and Water Resources Congress 2011: Bearing Knowledge for Sustainability, Palm Springs, CA, USA, 22–26 May 2011. [Google Scholar] [CrossRef]
  31. Ciro, G.C.; Dugardin, F.; Yalaoui, F.; Kelly, R. A NSGA-II and NSGA-III comparison for solving an open shop scheduling problem with resource constraints. IFAC-Pap. 2016, 49, 1272–1277. [Google Scholar]
  32. Ishibuchi, H.; Imada, R.; Setoguchi, Y.; Nojima, Y. Performance comparison of NSGA-II and NSGA-III on various many-objective test problems. In Proceedings of the 2016 IEEE Congress on Evolutionary Computation, CEC, Vancouver, BC, Canada, 24–29 July 2016; pp. 3045–3052. [Google Scholar]
  33. Jain, H.; Deb, K. An evolutionary many-objective optimization algorithm using reference-point based nondominated sorting approach, Part II: Handling constraints and extending to an adaptive approach. IEEE Trans. Evol. Comput. 2014, 18, 602–622. [Google Scholar] [CrossRef]
  34. Rabotyagov, S.S.; Jha, M.; Campbell, T.D. Nonpoint-Source Pollution Reduction for an Iowa Watershed: An Application of Evolutionary Algorithms. Can. J. Agric. Econ. /Rev. Can. D’agroeconomie 2010, 58, 411–431. [Google Scholar] [CrossRef]
  35. Król-Badziak, A.; Pishgar-Komleh, S.H.; Rozakis, S.; Księżak, J. Environmental and socio-economic performance of different tillage systems in maize grain production: Application of Life Cycle Assessment and Multi-Criteria Decision Making. J. Clean. Prod. 2021, 278, 123792. [Google Scholar] [CrossRef]
  36. Heister, C. Examining the Tradeoffs of Green Infrastructure for Stormwater Management: Ecosystem Services vs. Environmental and Human Health Impacts; Rochester Institute of Technology: Rochester, NY, USA, 2021. [Google Scholar]
  37. Gorsky, A.L.; Racanelli, G.A.; Belvin, A.C.; Chambers, R.M. Greenhouse gas flux from stormwater ponds in southeastern Virginia (USA). Anthropocene 2019, 28, 100218. [Google Scholar] [CrossRef]
  38. Park, K.; Oa, S.; Kim, S.; Kim, K. A study on the Carbon. Neutral Effect and Improvement of River Water Quality through Non-point Source Pollution Control in Farmland. J. Korean Soc. Hazard. Mitig. 2022, 22, 25–31. [Google Scholar] [CrossRef]
  39. Maringanti, C.; Chaubey, I.; Popp, J. Development of a multiobjective optimization tool for the selection and placement of best management practices for nonpoint source pollution control. Water Resour. Res. 2009, 45. [Google Scholar] [CrossRef]
  40. Livingstone, D.; Smyth, B.M.; Lyons, G.; Foley, A.M.; Murray, S.T.; Johnston, C. Life cycle assessment of a short-rotation coppice willow riparian buffer strip for farm nutrient mitigation and renewable energy production. Renew. Sustain. Energy Rev. 2022, 158, 112154. [Google Scholar] [CrossRef]
  41. Jeon, D.J. Simulation Study on Watershed Management Using High Resolution Weather Data; Gwangju Institute of Science and Technology: Gwangju, Republic of Korea, 2017; Available online: https://library.gist.ac.kr/#/librarySearchDetails?book_no=216000 (accessed on 7 March 2024).
  42. Abbaspour, K.C.; Rouholahnejad, E.; Vaghefi, S.; Srinivasan, R.; Yang, H.; Kløve, B. A continental-scale hydrology and water quality model for Europe: Calibration and uncertainty of a high-resolution large-scale SWAT model. J. Hydrol. 2015, 524, 733–752. [Google Scholar] [CrossRef]
  43. Ojha, V.; Timmis, J.; Nicosia, G. Assessing Ranking and Effectiveness of Evolutionary Algorithm Hyperparameters Using Global Sensitivity Analysis Methodologies. arXiv 2022, arXiv:2207.04820. [Google Scholar] [CrossRef]
  44. Kurkalova, L.A.; Kling, C.; Zhao, J. Green subsidies in agriculture: Estimating the adoption cost of conservation tillage form observed behavior. Can. J. Agric. Econ. 2006, 54, 247–267. [Google Scholar] [CrossRef]
  45. Bergstra, J.; Bengio, Y. Random search for hyper-parameter optimization. J. Mach. Learn. Res. 2012, 13, 281–305. [Google Scholar]
Figure 1. Description of the Yeongsan River Watershed.
Agronomy 14 00906 g001
Figure 2. Schematic diagram of this study.
Agronomy 14 00906 g002
Figure 3. Status of HRUs for paddy and soybean fields in the Yeongsan River watershed.
Agronomy 14 00906 g003
Figure 4. Results of calibration and validation of the SWAT model.
Agronomy 14 00906 g004
Figure 5. Comparative analysis of TP removal efficiency, cost, and GHG emissions when applying individual BMP scenarios: (a) expected TP removal efficiencies, (b) expected cost, (c) expected GHG emissions when applying individual BMP scenarios.
Agronomy 14 00906 g005
Figure 6. Multi-objective optimization results using NSGA-III (3D).
Agronomy 14 00906 g006
Figure 7. Multi-objective optimization results using NSGA-III (2D). (a) TP removal efficiency vs. cost; (b) TP removal efficiency vs. GHG emissions; (c) cost vs. GHG emissions.
Agronomy 14 00906 g007aAgronomy 14 00906 g007b
Figure 8. Optimized BMP implementation for the Yeongsan River watershed.
Agronomy 14 00906 g008
Table 1. Overview of BMP parameters and values.
Types of BMPsDescriptionParametersValuesSources
Conservation Tillage (CT)An agricultural management approach that emphasizes minimizing the frequency or intensity of tillage operations to promote various economic and environmental benefitsCN2−3[23,34,35]
OV_N0.30
TILL_IDConservation tillage
No Tillage (NT)An agricultural management approach wherein the soil is not distributed between harvesting and plantingCN_2−2[23,34,35]
OV_N0.30
TILL_IDNo tillage
Detention Pond (DP)An engineered structure designed to manage excess stormwater and reduce pollution from runoffPND_K0[22,36,37]
PND_FR0.75
PND_ESA0.01
Reduction of Fertilizer (RF)Optimization of fertilizer application to minimize its excessive use, thereby reducing the environmental impact, particularly in terms of water pollution and eutrophication in water bodiesFertilizer application−10~−50%[37,38]
Riparian Buffer (RB)Vegetated areas near rivers and streams that play a critical role in maintaining the health of aquatic ecosystemsFILTERW10[24,39,40]
Table 2. Comparative analysis of BMP scenarios with respect to cost and GHG emissions.
BMP ScenariosDescriptionCost ($/ha)GHG Emissions (kg CO2 eq./ha)Cultivation
BMP1: CT_riceConservation tillage0 [34]5514.80 [35]Rice
BMP2: DP_riceDetention pond99 [22]5480.00 [37]
BMP3: RF 10_rice10% reduction of fertilizer usage92.17 [41]1221.61 [38]
BMP4: RF 20_rice20% reduction of fertilizer usage81.93 [41]1085.87 [38]
BMP5: RF 30_rice30% reduction of fertilizer usage71.69 [41]950.14 [38]
BMP6: RF 40_rice40% reduction of fertilizer usage61.45 [41]814.40 [38]
BMP7: RF 50_rice50% reduction of fertilizer usage51.20 [41]678.67 [38]
BMP8: CT_soybeanConservation tillage0 [34]5514.80 [35]Soybean
BMP9: NT_soybeanNo tillage17.25 [34]3827.92 [35]
BMP10: DP_soybeanDetention pond99.00 [22]5480.00 [37]
BMP11: RF 10_soybean10% reduction of fertilizer usage68.83 [41]1221.61 [38]
BMP12: RF 20_soybean20% reduction of fertilizer usage61.18 [41]1085.87 [38]
BMP13: RF 30_soybean30% reduction of fertilizer usage53.53 [41]950.14 [38]
BMP14: RF 40_soybean40% reduction of fertilizer usage45.89 [41]814.40 [38]
BMP15: RF 50_soybean50% reduction of fertilizer usage38.24 [41]678.67 [38]
BMP16: RB 1_soybeanWidth of riparian buffer zone: 1 m29.00 [39]778.00 [40]
BMP17: RB 3_soybeanWidth of riparian buffer zone: 3 m32.00 [39]1556.00 [40]
BMP18: RB 5_soybeanWidth of riparian buffer zone: 5 m35.00 [39]2334.00 [40]
Table 3. Expected effects when applying BMP scenarios.
BMP ScenariosTP Removal Efficiency (%)Costs (Million Dollars)GHG Emissions (kt CO2 eq.)
BMP1: CT_rice2.360.0060.49
BMP2: DP_rice0.531.0960.11
BMP3: RF 10_rice5.361.0113.40
BMP4: RF 20_rice10.730.9011.91
BMP5: RF 30_rice15.980.7910.42
BMP6: RF 40_rice21.430.678.93
BMP7: RF 50_rice26.870.567.44
BMP8: CT_soybean0.210.009.18
BMP9: NT_soybean0.040.036.38
BMP10: DP_soybean0.340.169.13
BMP11: RF 10_soybean0.220.112.03
BMP12: RF 20_soybean0.450.101.81
BMP13: RF 30_soybean0.660.091.58
BMP14: RF 40_soybean0.880.081.36
BMP15: RF 50_soybean1.090.061.13
BMP16: RB 1_soybean4.450.051.30
BMP17: RB 3_soybean6.170.052.59
BMP18: RB 5_soybean7.170.063.89
Table 4. Results of optimal hyperparameter search for NSGA-III [45].
No.HyperparametersDescriptionMinimum ValueMaximum ValueOptimized Value
1Population_sizeNumber of solutions in a single generation501000210
2Num_iterationTotal number of generations of iterations5001000524
3Crossover_rateFraction of genetic information passed from parents to offspring during reproduction0.10.90.5631
4Mutation_rateFrequency of random alterations in the genetic information of solutions0.11.00.2083
Disclaimer/Publisher’s Note: The statements, opinions and data contained in all publications are solely those of the individual author(s) and contributor(s) and not of MDPI and/or the editor(s). MDPI and/or the editor(s) disclaim responsibility for any injury to people or property resulting from any ideas, methods, instructions or products referred to in the content.

