Article

Characterization and Mineralization Rates of Low Temperature Peanut Hull and Pine Chip Biochars

1
The University of Georgia, Department of Crop and Soil Sciences, Miller Plant Sciences, Athens, GA 30602, USA
2
The University of Georgia, Department of Biological and Agricultural Engineering, Driftmier Engineering Center, Athens, GA 30602, USA
*
Author to whom correspondence should be addressed.
Agronomy 2013, 3(2), 294-312; https://doi.org/10.3390/agronomy3020294
Submission received: 30 November 2012 / Revised: 23 January 2013 / Accepted: 7 April 2013 / Published: 16 April 2013
(This article belongs to the Special Issue Biochar as Option for Sustainable Resource Management)

Abstract

:
Biochar can potentially increase soil fertility and sequester carbon by incorporating nutrients and stable black carbon into the soil; however its effect on soil nitrogen (N) and carbon (C) processes is not well understood. A defined methodology to characterize biochar is necessary to predict how specific biochars will affect C and N mineralization. We amended a Tifton soil (Fine-loamy, siliceous, thermic Plinthic Kandiudults) with peanut hull (Arachis hypogaea; PH; 2.1% N) and pine chip (Pinus taeda; PC: 0.4% N) biochar at application rates of 1% and 2% (w/w) and performed a 136-day mineralization study. A companion 24-day mineralization study amended Tifton soil with PH and PC biochar at 2% and their respective feedstocks at equal C rates. Soil C mineralization rates were monitored periodically throughout each study and total N mineralization rates were also measured. In addition, we characterized each biochar using thermogravimetric analysis with mass spectrometer (TGA-MS), proximate analysis, Fourier transform infrared spectroscopy (FTIR), and total mineral analysis to identify biochar characteristics that might correlate with mineralization properties. Limited C (<2%) mineralized from both biochars, but mineralization rates of soil amended with PH biochar were higher than PC biochar. Carbon mineralization correlated well with estimated aliphatic content determined by TGA-MS but not with volatile content indicated by proximate analysis. Nitrogen was not mineralized from either biochar, indicating that plant-based biochar should not be considered a source of N for plant growth. The N in biochar may be contained in the stable aromatic structure of the biochar, as indicated by TGA-MS, and not available to soil microbes.

Graphical Abstract

1. Introduction

Pyrolysis, an alternative energy process, converts biomass feedstock into syngas, bio-oil, and biochar through rapid heating in the absence of oxygen [1]. It potentially provides carbon-negative, renewable energy if biochar is land applied [2]. Biochar is a black, amorphous carbon similar to charcoal with a polycyclic structure and varying degrees aromaticity and surface oxidation [3]. Evidence from black-carbon-rich Terra Preta soils in the tropics indicates black carbon resists mineralization [4] while increasing soil fertility and productivity [5,6,7]. Many researchers have proposed that land application of biochar from industrial pyrolysis may create a carbon sink as well as providing productivity benefits [8].
The physical and chemical characteristics of biochars vary depending on the feedstock selected and pyrolysis conditions. Feedstock affects nutrient concentration, cation exchange capacity (CEC), and soluble carbon [9]. For example, at a similar pyrolysis temperature, a manure-based poultry litter biochar contains greater amounts of nutrients and a higher CEC than a pine chip biochar. Also, higher pyrolysis temperature (500 °C) compared to lower temperature (400 °C) decreases the CEC and increases most macronutrient concentrations in the biochar. Varying production temperature [10] and feedstock [11] result in biochars with varying concentrations of ash, volatiles, and fixed carbon content. Aromaticity of the carbon fraction in fast and slow pyrolysis biochars appears to increase with reaction time [12]. Characterization of chars from ponderosa pine shavings and tall fescue straw, each pyrolyzed from 100 to 700 °C in 100 °C increments for 1 h, indicates that as production temperature rises, aromaticity increases followed by condensation into turbostratic crystallites [13]. Temperature and oxidation during or after the pyrolysis process can increase the size and continuity of pores in biochars [14]. Biochars produced from eight different species of hard and soft wood varied in porosity and pore size distribution, resulting in different adsorption capacities of phenolic compounds [15] which could potentially influence soil microbial populations [16]. Production temperature may also determine the quantity and structure of cyclic aromatic hydrocarbons contained in biochar. For example, straw, poplar, and spruce feedstocks each contained an increasing concentration of naphthalene and decreasing concentrations of fluorene with increasing production temperatures from 400 to 525 °C [17].
Black carbon has long been understood to be the most stable form of carbon in soil [4,5] because of its aromatic structure [3,4]; however, a small fraction of biochar, especially if produced at lower temperatures, may be mineralizable [18]. Low temperature biochars may have an aliphatic fraction that is microbially available [19,20,21,22] and typically undergoes a period of rapid mineralization the first few days to weeks after incorporation into soil [18,19,20,21,23,24]. The short term flush of CO2 from biochar-amended soils has been attributed to the mineralization of soluble organic C contained in fresh biochar [25]. Following this initial flush of activity, mineralization of black carbon is primarily an abiotic process over the course of months [3]; however, this loss only accounts for a few percent per year and some biochars may persist over millennia [19]. The soil type and its use may also affect mineralization rates. Soils and loess amended with C-14 labeled biochar showed an increased rate of black carbon decomposition with addition of glucose and mechanical disturbance [19], indicating labile C sources and disturbance may accelerate biochar loss.
While biochar itself may be largely unavailable for microbial mineralization, the effects on native and added organic matter are still unclear. The presence of biochar has been shown to stimulate the mineralization of native soil organic matter in boreal forest soils [16]. In southeastern United States soils, isotope analysis of respired C indicates whether the addition of biochar increases mineralization of native soil organic matter depends on the type of biochar and the organic C content of the soil. The addition of grass-derived biochar to soils from the southeastern United States with organic C contents of 14 and 55 mg g−1 resulted in a greater amount of pyrogenic C respired than soil organic C during the third week of incubation [26]. Black carbon in anthrosols has been shown to increase incorporation of added organic matter into aggregates and organo-mineral fractions, compared to adjacent soils, without affecting the mineralization rate of the added organic matter [27]. Charcoal may provide habitat [28] and act as an absorbent for substrates, including phenolic compounds, promoting certain microbial populations [16,28,29].
Biochars effects on N cycling are also complex. Corn did not respond to the 209 kg ha−1 N in peanut hull biochar applied to a loamy sand soil [30]; however, broiler litter biochar has been shown to provide N to plants [31,32]. Carbonized broiler litter can have a similar effect on soil fertility as uncarbonized broiler litter [32]. Adsorption of phenolic compounds may also boost nitrification in pine forest ecosystems [33], yet some biochar can contain ethylene that inhibits nitrifying bacteria [34]. Acidified biochars can be used to sorb ammonia-N then incorporated into soil as a fertilizer source [35] while high ash alkaline biochars may result in ammonia volatilization [36]. Biochars with a large mineralizable fraction [24] or the stimulated mineralization of co-applied biomass [37] may result in N immobilization.
Biochars recalcitrance coupled with improved fertility seen in charcoal-amended tropical soils may make biochar an appealing amendment to sequester C in low fertility soils; however, we need to understand how biochar characteristics will affect various soil systems and practical ways to estimate these effects. Our objective was to characterize two biochars from Gaskin et al. [30], derived from peanut hull (PH) and pine chip (PC), and correlate those characteristics with C and N mineralization rates in a 136-day study using the following hypotheses.
  • Peanut hull and PC biochar will mineralize at different rates that will correlate to an aliphatic and volatile matter concentration in the biochar.
  • Aging in soil will decrease aliphatic and volatile matter as well as C and H concentrations in biochars, and will increase oxygen-containing functionalities on the surface of biochars.
  • Biochar will affect the N status of the soil by either immobilizing mineralized soil N or mineralizing biochar N depending on the C to N ratio of the biochar.

2. Materials and Methods

2.1. Biochar Production

EPRIDA Inc. (Athens, GA, USA) produced biochar from pelletized PH and PC feedstocks in an auger-fed pyrolysis reactor at approximately 400 °C with steam as the carrier gas. The pelletized biochars were ground using a roller mill to a mean particle size of 425 µm.

2.2. Soil

The soil used for each study was a Tifton series (Fine-loamy, siliceous, thermic Plinthic Kandiudults). The top 15 cm of soil was collected from an agricultural field near Tifton, GA, air dried, and screened to 2 mm. Total soil C and N were 4.94 and 0.25 g kg−1, respectively, or a C:N ratio of approximately 20:1.

2.3. Mineralization Studies

Two laboratory mineralization studies were conducted. The first study tested the effect of biochar feedstock and application rate on soil respiration and N mineralization. Soil (50 g) mixed with 0%, 1%, and 2% (w/w) biochar, which equates to application rates of 22 or 44 Mg ha−1, was packed in 50-mL beakers to a bulk density of 1.33 g cm−3. Water was added to bring the water content to 0.21 kg kg−1 (approximately field capacity, 33 kPa). The biochar rates selected were based on what could be realistically applied on an agronomic scale. The beakers of wetted soils were placed in 0.95-L Mason jars with a vial of DI water to maintain moisture and a vial of 1 M NaOH to trap CO2. Blanks for CO2 contained only water and a NaOH trap. The Mason jars were placed in an incubator at 25 °C. Four replications of each treatment were arranged in a completely randomized design. Respired C was determined by titrating NaOH traps to a pH 7 endpoint at day 3, 10, 25, and every two weeks up to 136 days. The study was terminated once respiration rates were static over several weeks (approximately 4.5 months).
The second study was to test the immediate N availability in the feedstock compared to the respective biochar over 24 days. Peanut hull and PC biochars were applied at the 44 Mg ha−1 and the feedstocks applied at equal C rates with an unamended soil as the control. Samples were prepared and measured using the same methodology and replication as the 136-day study. Respired C was measured at day 3, 10, and 24.
A 10-g subsample from d 0 and 136 from the long-term study and d 0 and 24 from the short-term study was extracted with 2 M KCl for 1 hour and filtered through Whatman 1 filter papers. Filtrate was frozen until NH4+-N and NO3+-N analysis on an autoanalyzer using cadmium reduction and phenate colorimetric methods (EnviroFlow 3,000, Perstorp, Toledo, Ohio). Inorganic N (sum of NH4+-N and NO3-N) at the beginning of each study was subtracted from inorganic N at the end of each study to estimate net N mineralized.
After incubation, aged biochar particles from the 44 Mg ha−1 treatments of the long-term respiration study were handpicked from soil for characterization and comparison to fresh biochar. Fresh and aged biochar was ground to a consistent particle size (<0.05 mm) using a mortar and pestle. A ball mill grinder was used to grind raw PH and PC feedstock into a fine powder (<0.05 mm).

2.4. Thermogravimetric Analysis

Temperature-controlled combustion and combustion gas analysis of the raw feedstock, fresh biochar, and aged biochar were analyzed on a thermogravimetric analyzer (Mettler Toledo TGA/SDTA 851 Columbus, OH, USA) with a mass spectrometer used to analyze gas composition (Pfeiffer Vacuum Thermostar, Square Nashua, NH). Approximately 5 mg of sample was weighed into an alumina crucible and evenly distributed across the bottom of the pan. The temperature program included a 3-min isothermal stage at 30 °C followed by a constant heating rate of 5 °C min−1 to 700 °C in 79% Ar and 21% O2. The gas flow rate was 40 mL min−1. The mass spectrometer was programmed to measure m/z ratio 30, the mass of nitric oxide. Nitric oxide (m/z 30) was selected as the analyte because it is the only nitrogen containing combustion by-product with a unique mass and is therefore the only gas species that will accurately represent the combustion of nitrogen-containing compounds. The percent mass remaining after temperature-controlled combustion is reported as the ash content as determined by TGA.
Isothermal decomposition was measured on fresh and aged PH and PC biochar using the same instrumentation as combustion samples and only Ar as the flow through gas. The temperature program consisted of four isothermal stages in the following order: 3-min at 25 °C, 60-min at 200 °C and 400 °C each, followed by 7-min at 950 °C. Mass loss at 200 °C is an estimate of moisture content of the biochar as determined by TGA. Aliphatic content of the biochar was determined by calculating the amount of mass lost between 200 and 400 °C during thermal decomposition [38]. Volatile content was considered the mass lost from the 200 °C stage to the 950 °C stage.
Moisture, volatile, fixed carbon, and ash content of the fresh PH and PC biochar were measured by proximate analysis using ASTM D5142 (2004) on a LECO TGA 701 (St. Joseph, MI). Moisture content is based on the amount of mass lost from the biochar at 110 °C. After the moisture measurement is complete, the biochar is heated to 950 °C under N2 gas for 7 m and the mass loss at this stage is considered volatile matter content. The samples are then combusted in O2 at 750 °C to measure ash content. The sum of moisture, volatile, and ash is subtracted from 100 and the remaining mass is considered fixed C.

2.5. Laboratory Analysis

Peanut hull and PC biochars and their respective feedstock were analyzed for total elemental composition. Samples were digested with nitric acid, USEPA Method 3050 [39], and elements were analyzed by inductively coupled plasma spectrophotometer (ICP, Thermo Jarrell-Ash model 61E,Thermo Fisher Scientific, Waltham, MA, USA). Carbon, N, and H were determined on the feedstock, fresh, and aged biochars by combustion (LECO CHNS-932, St. Joseph, MI, USA). Carbon, N, and H data were analyzed in two blocks based on the experiment: one comparing fresh biochar to the original feedstock, the second comparing fresh biochar to aged biochar.
Fourier transform infrared spectra were measured by a Varian 2000 FTIR (Palo Alto, CA, USA). Fresh and handpicked biochars were finely ground and coated on KBr at a rate of 2% biochar. The spectra were recorded from 4400 to 400 cm−1 by averaging 200 scans at 2 cm−1 resolution.

2.6. Statistical Analysis

Proximate and thermal decomposition data comparing fresh PH and PC biochar were analyzed using a standard t-test. Carbon and N content of fresh feedstock and biochars were analyzed using PROC GLM (SAS Institute, Inc. 2008, Cary, NC, USA) with means separated using Waller-Duncan K-ratio t test (K = 100). Factorial analysis was performed on all other data using PROC MIXED with the SIMULATE option to compare least square means when interactions were significant.
PROC NLIN in SAS was used to fit the C respiration data (Cresp) from the 136-day mineralization to the following formula to estimate maximum respired C (rmax) and rate (k):
Agronomy 03 00294 i001
Parameters rmax and k, and mineralized NH4+-N and NO3+-N were analyzed using PROC MIXED with means separated using orthogonal contrasts to test for the effect of feedstock, rate, and interaction. Analysis was performed with and without the control treatment. Statistical tests with p < 0.05 level were considered significant.
Dunnett-Hsu mean comparison (alpha = 0.05) was used to compare the treatment means to the control of the 136-day and 24-day mineralization studies. The control was then dropped from analysis and cumulative respiration and mineralized N were analyzed using PROC MIXED with feedstock, condition (fresh vs. aged) or state (feedstock vs. biochar), and interaction. Linear regression analysis was used to determine the relationship between the aliphatic and volatile matter added to soil and estimated maximum respired C for both PH and PC biochars.

3. Results

3.1. Feedstock and Biochar Analysis

Peanut hull feedstock had a greater concentration of major and minor nutrients than PC feedstock (Table 1). Nitrogen and K were an order of magnitude greater while other nutrients are approximately two to five times greater. The C:N ratio in the feedstock was statistically the same in the PH biochar and significantly greater in PC. With the exception of N and S, feedstock nutrient concentrations were considerably less than the respective biochar, ranging from 24% to 41% of the biochar concentration. Nitrogen and S concentrations in the feedstocks were similar to that in the biochars produced from that feedstock.
Similarly, the PH biochar contained larger concentrations of major and minor nutrients than PC biochar (Table 1). Nitrogen, P, and K concentrations were approximately an order of magnitude larger, Mg and S double, and Ca 34% greater. Peanut hull and PC biochar C to N ratios were 35 and 214, respectively.
Proximate analysis of fresh biochar measured larger moisture and volatile contents and smaller ash contents than the thermogravimetric analysis; however, overall trends when comparing the PC to PH were similar (Table 2). Peanut hull biochar contained significantly more moisture, three times more ash, and approximately 12 g kg−1 more estimated aliphatic compounds than the PC biochar. However, the PC contained more volatile matter and fixed C.
Table 1. Total concentrations of selected major and minor nutrients from peanut hull (PH) and pine chip (PC) biochars and their respective feedstock.
C:NCNPKSCaMg
----------------------------------------mg kg−1---------------------------------------
Biochar
PH 35 C729,000 B21,000 A218019,00085254102720
PC 214 B785,000 A3,710 C5772,82035040301230
Feedstock
PH 38 C504,000 C14,000 B8937,5109001560790
PC 259 A503,000 C1,870 C181877200930296
Different letters indicate means are statistically different (K = 100) based on Waller-Duncan K-ratio t Test.
Table 2. Proximate analysis (ASTM D5142) and estimated parameters from isothermal decomposition (TGA) of fresh biochar.
ASTM D5142TGA
MoistureVolatilesFixed CAshMoistureAliphaticVolatileAsh
--------------------------g kg−1--------------------------------------------------g kg−1----------------------
PH biochar81252598695662219102
PC biochar74278630183754235 38

3.2. Carbon and Nitrogen Mineralization

High variability in the control treatment resulted in the rate constant “k” being the same as in the other treatments and only the 44 Mg ha−1 treatments had a greater rmax than the control according to the Dunnett-Hsu mean comparison. Univariate analysis of the long-term respiration data confirmed a large standard deviation in the control compared to other treatments for both k and rmax. Mineralized N from the control also had a large standard deviation compared to other treatments. Control means were as follows: rmax = 527 mg kg−1, k = 0.001 day−1, mineralized N = 28.2 mg kg−1.
Maximum respired carbon was significantly larger (p < 0.0411) from soils amended with 44 Mg ha−1 biochar (Table 3). Feedstock had no significant effect (p < 0.0642) on rmax. The inverse was true for rate, k, where PH mineralized at a faster rate (p < 0.0007) than PC biochar and feedstock had no significant effect (p < 0.0637). There was no interaction between feedstock and rate either for rmax or k.
Peanut hull and PC biochar had no significant effect on N mineralization rates (Table 3). Mineralization rates were no different than the control and there was no effect of biochar feedstock or application rate in the 136-day mineralization study.
Dunnett-Hsu mean comparison of treatments to the control of the 24-day respiration study showed cumulative respiration of the PC char treatment was statistically the same as the control (Table 4). The PH feedstock was the only treatment to mineralize more N than the control (p < 0.0450). Control means were as follows: cumulative respired C = 150 mg kg−1, mineralized N = 9.55 mg kg−1.
Factorial analysis of the 24-day respiration data showed a significant interaction between feedstock and state (feedstock vs. biochar) for cumulative respiration (p < 0.0001) and mineralized N (p < 0.0431) (Table 4). There was no significant difference in cumulative respiration of the PH and PC biochar treatments. Each feedstock respired at a greater rate than their respective biochar; however, the PH feedstock at a much larger rate, 2277 mg C kg−1 soil, than PC feedstock, 692 mg C kg−1 soil. Pine chip feedstock, −1.43 mg N kg−1 soil, showed signs of immobilized N compared to the PH feedstock, 26.8 mg N kg−1 soil (p < 0.0103). There was no significant difference (p < 0.1923) between PH feedstock and biochar, 26.8 and 13.5 mg kg−1 soil respectively, due to high variability in NO3-N in the feedstock amended soils.
Table 3. Effect means and probabilities of estimated maximum respired carbon (rmax), rate (k), mineralized NH4+-N, and NO3-N from 136-day respiration study.
C respirationN mineralization
Rmaxk
mg C kg−1 soilday−1mg kg−1 soil
Effect means
Feedstock
PH biochar7350.012730.2
PC biochar6200.008626.5
Application Rate
22 Mg ha−16500.009728.2
44 Mg ha−17400.011228.7
Pr > FPr > F
Feedstock0.06420.00070.1157
Application rate0.04110.06370.7789
Interaction0.58750.35510.3620
Table 4. Treatment and selected effect means and probabilities of cumulative C respiration, mineralized NH4+-N, and NO3-N from 24-day respiration study.
C respirationN mineralization
cum. resp.
mg C kg−1 soilmg kg−1 soil
Treatment means
PH feedstock2277A26.8A
PH biochar222C13.5AB
PC feedstock692B−1.4B
PC biochar171C7.9AB
Effect means
Feedstock
PH125020.2
PC4323.3
Pr > FPr > F
Feedstock<0.00010.0065
State<0.00010.6941
Interaction<0.00010.0431
Letters indicate treatment means are significantly different based on comparison of LSM at alpha 0.05.

3.3. Ultimate Analysis and Thermal Decomposition of Fresh and Aged Biochars

Incubating biochar in a soil matrix (aging) had a significant effect on several measured characteristics (Table 5). There was a significant interaction (p < 0.0011) between the feedstock, PH and PC, and condition, fresh and aged, for C:N ratio, C, and N content. The PH biochar showed a significant decrease in C, 730 to 663 g kg−1 char, and N, 20.9 to 17.1; however, there was no effect on the C:N ratio. PC biochar showed a significant decrease in C content, 795 to 697 g kg−1 char, and C:N ratio, 216 to 155 g kg−1 char, but no difference in N content. Aging resulted in a significant decrease in H concentration.
Table 5. Treatment and effect means and probabilities from ultimate and thermogravimetric analysis comparing fresh and aged peanut hull and pine chip biochars.
Combustion TGA
C:NCNHMoistureAliphaticVolatileAsh
g kg−1 charg kg−1 char
Treatment means
PH fresh35C730B21A34.6A56A62C219B102B
PH aged39C663D17B31.9B58A77A241A155A
PC fresh216A795A3.8C35.7A37C54D235AB38C
PC aged155B697C4.6C31.9B45B68B252A122B
Effect means
Feedstock
PH3769719335770230128
PC185746434416124380
Condition
Fresh 1267631235475822770
Aged9768011325173247139
Pr > FPr > F
Feedstock<0.0001<0.0001<0.00010.2165<0.0001<0.00010.0473<0.0001
Condition<0.0001<0.00010.0002<0.00010.0715<0.00010.0065<0.0001
Interaction<0.0001 0.0011<0.00010.40390.26700.93800.72480.0235
Different letters indicate treatment means are significantly different based on comparison of LSM at alpha 0.05.
Surprisingly, aging resulted in a significant increase in aliphatic content (p < 0.0001) and volatile matter (p < 0.0065). As indicated in Table 5, PH contained significantly more moisture (p < 0.0001) and aliphatic compounds (p < 0.0001) while PC contained more volatile compounds (p < 0.0473). Ash content had a significant interaction (p < 0.0001) between feedstock and condition with PC accumulating 84 g ash kg−1 char while PH only accumulated 53 g ash kg−1 char. Aging increased the ash concentration of PC biochar to the same level, statistically, as the fresh PH biochar.

3.4. Controlled Combustion Analysis

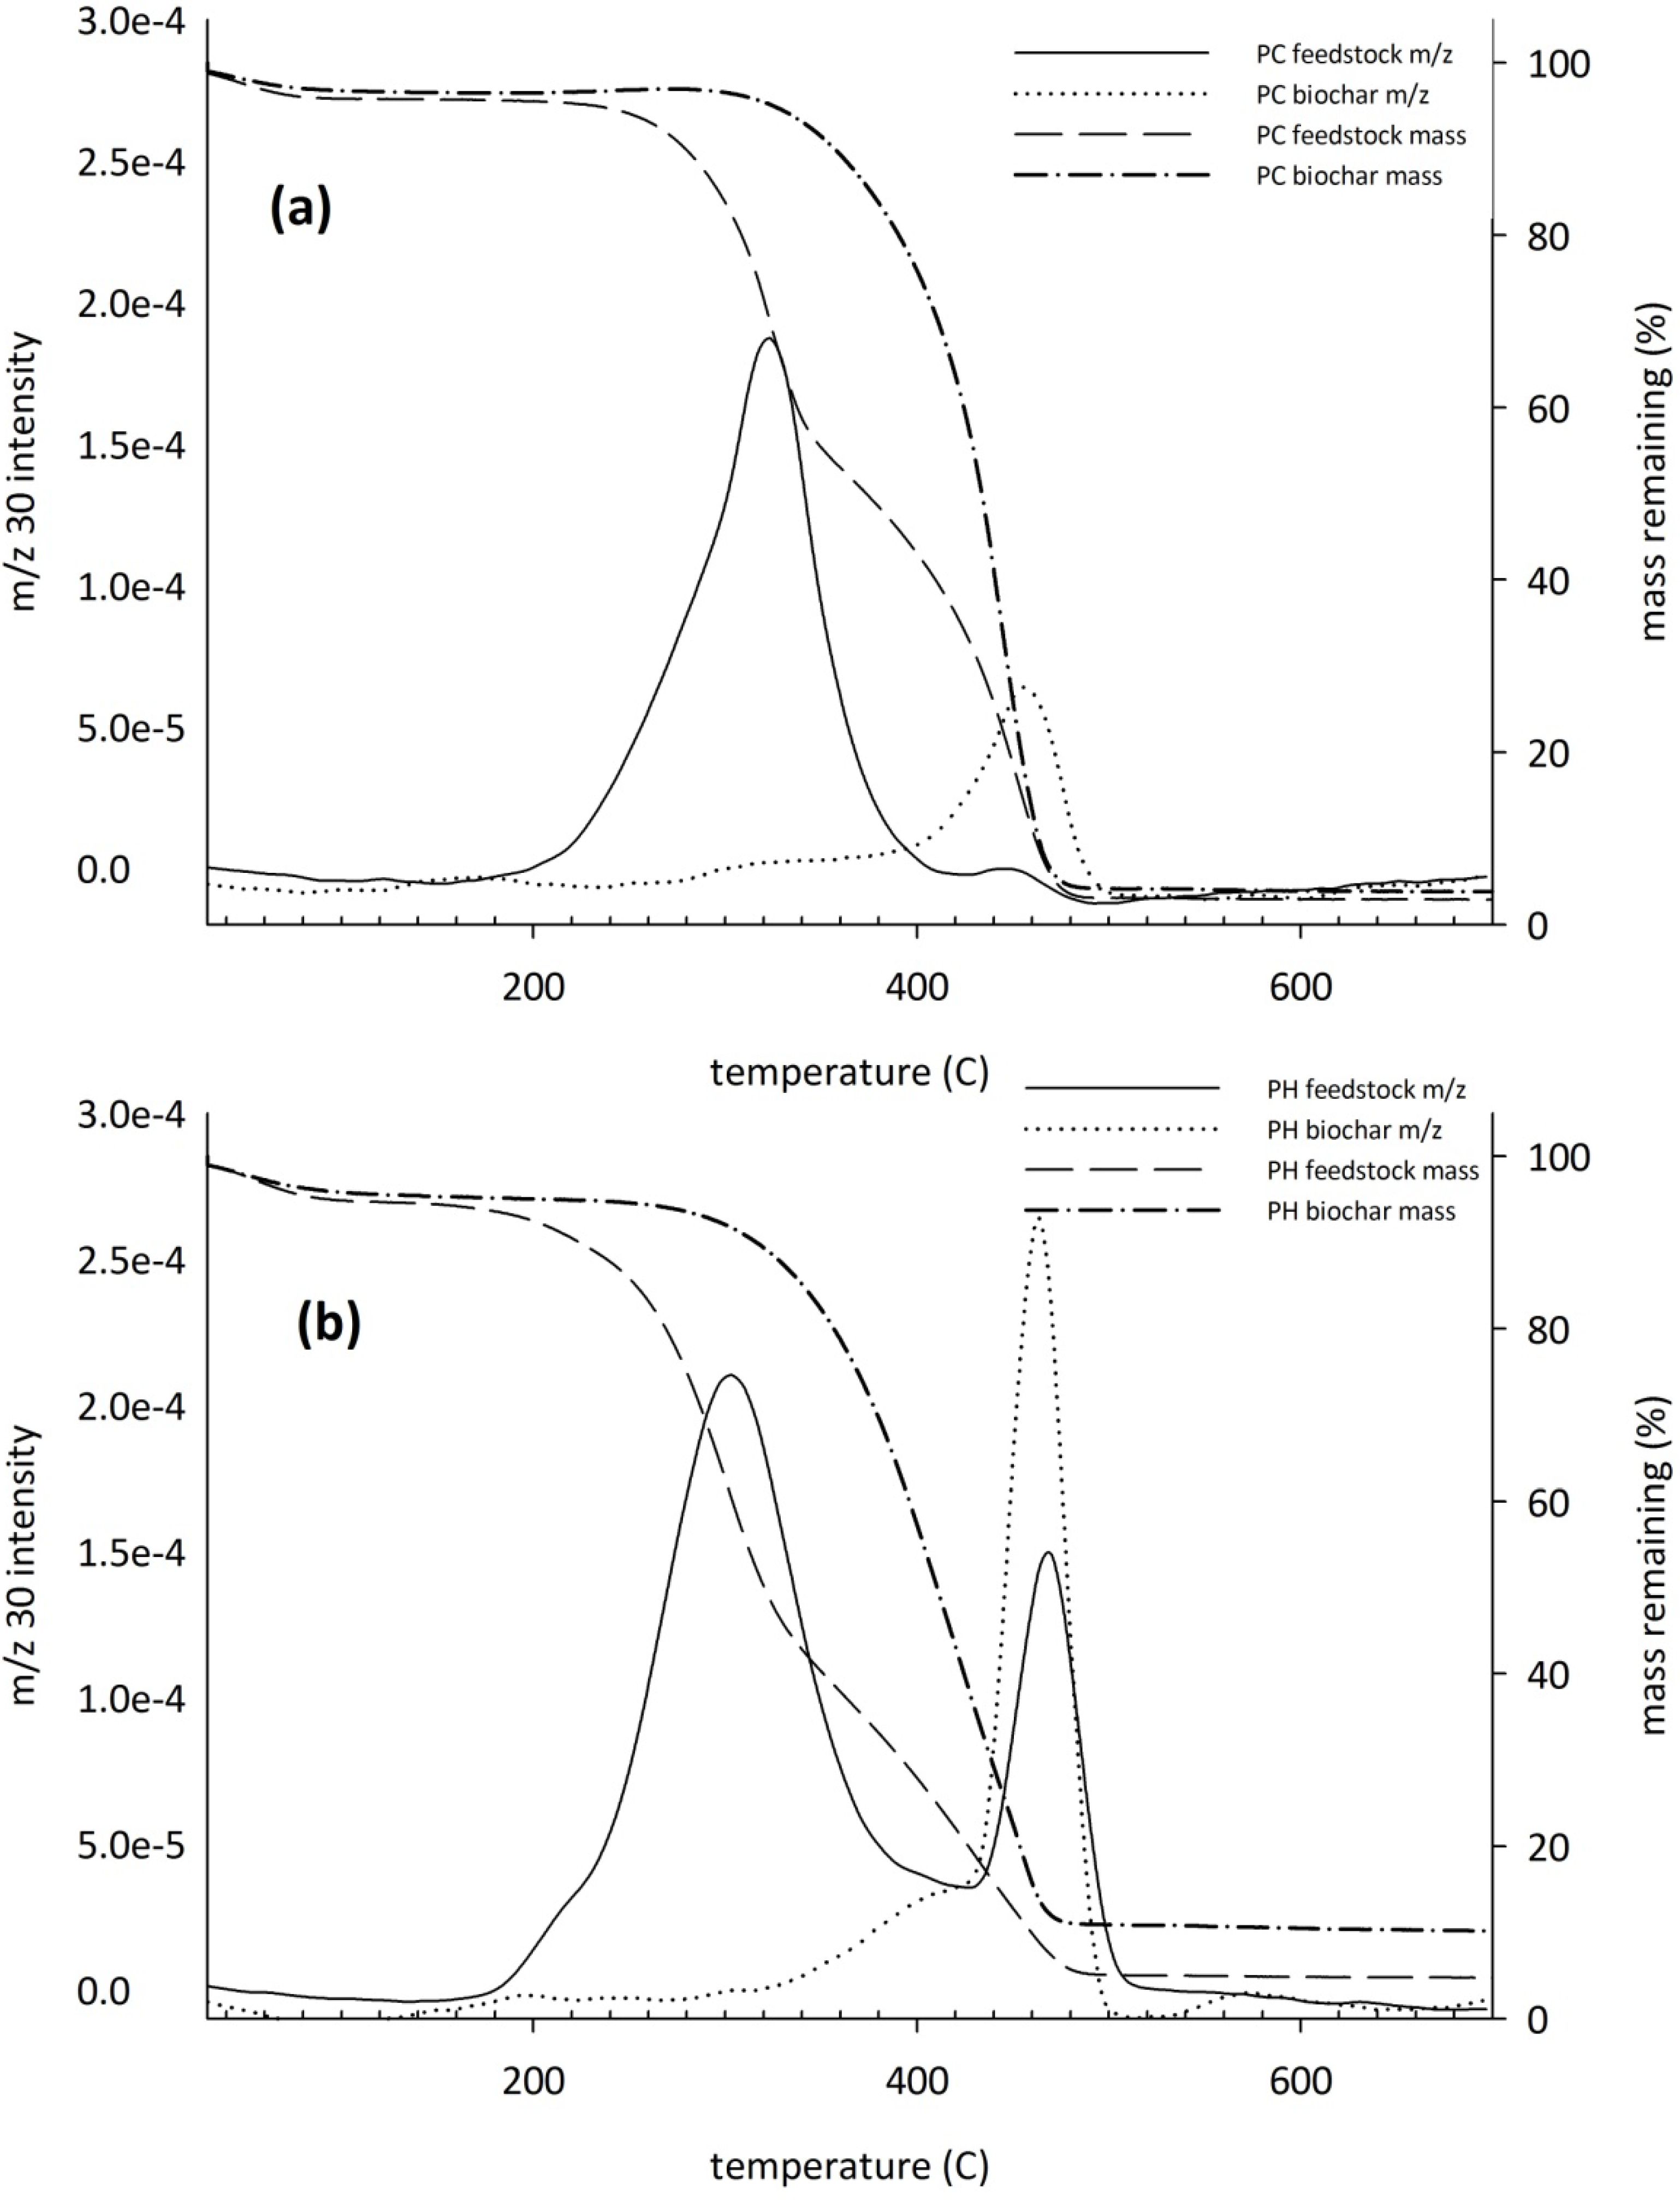
Temperature-controlled combustion of PC and PH biochar and their respective feedstocks showed distinct differences in mass loss patterns and gas evolution. Mass loss curves show both PC and PH feedstock began to lose mass at approximately 200 °C with both losing approximately 40% of their mass by 300 °C, the approximate temperature where biochars began to lose mass (Figure 1). Feedstocks appeared to have two distinct combustion events, indicated by a break in the slope, while biochars exhibited a single event. Peanut hull biochar began to lose mass at 280 °C and lost mass at a slower rate than PC which began to lose mass at 300 °C. All samples (feedstock and biochars) were completely combusted by 500 °C.
Figure 1. Combustion mass loss curve and intensity of m/z 30 (NO+) of pine chip (a) and peanut hull; (b) biochars and feedstock.
Agronomy 03 00294 g001
Combustion gas analysis of PC data shows a shift of m/z 30 (NO+) evolution peaks from approximately 300 °C to 470 °C indicating biochar N is strongly bonded compared to N in the respective feedstock (Figure 1) . Peanut hull feedstock contained two separate N pools represented by peaks at 300 and 470 °C, while PH biochar only contains one peak (470 °C) that was similar to the second feedstock peak. Both PC and PH appear to lose a significant amount of N during the pyrolysis process with the cumulative area under the biochar curves being less than the feedstock curves.

3.5. Fourier Transform Infrared Analysis
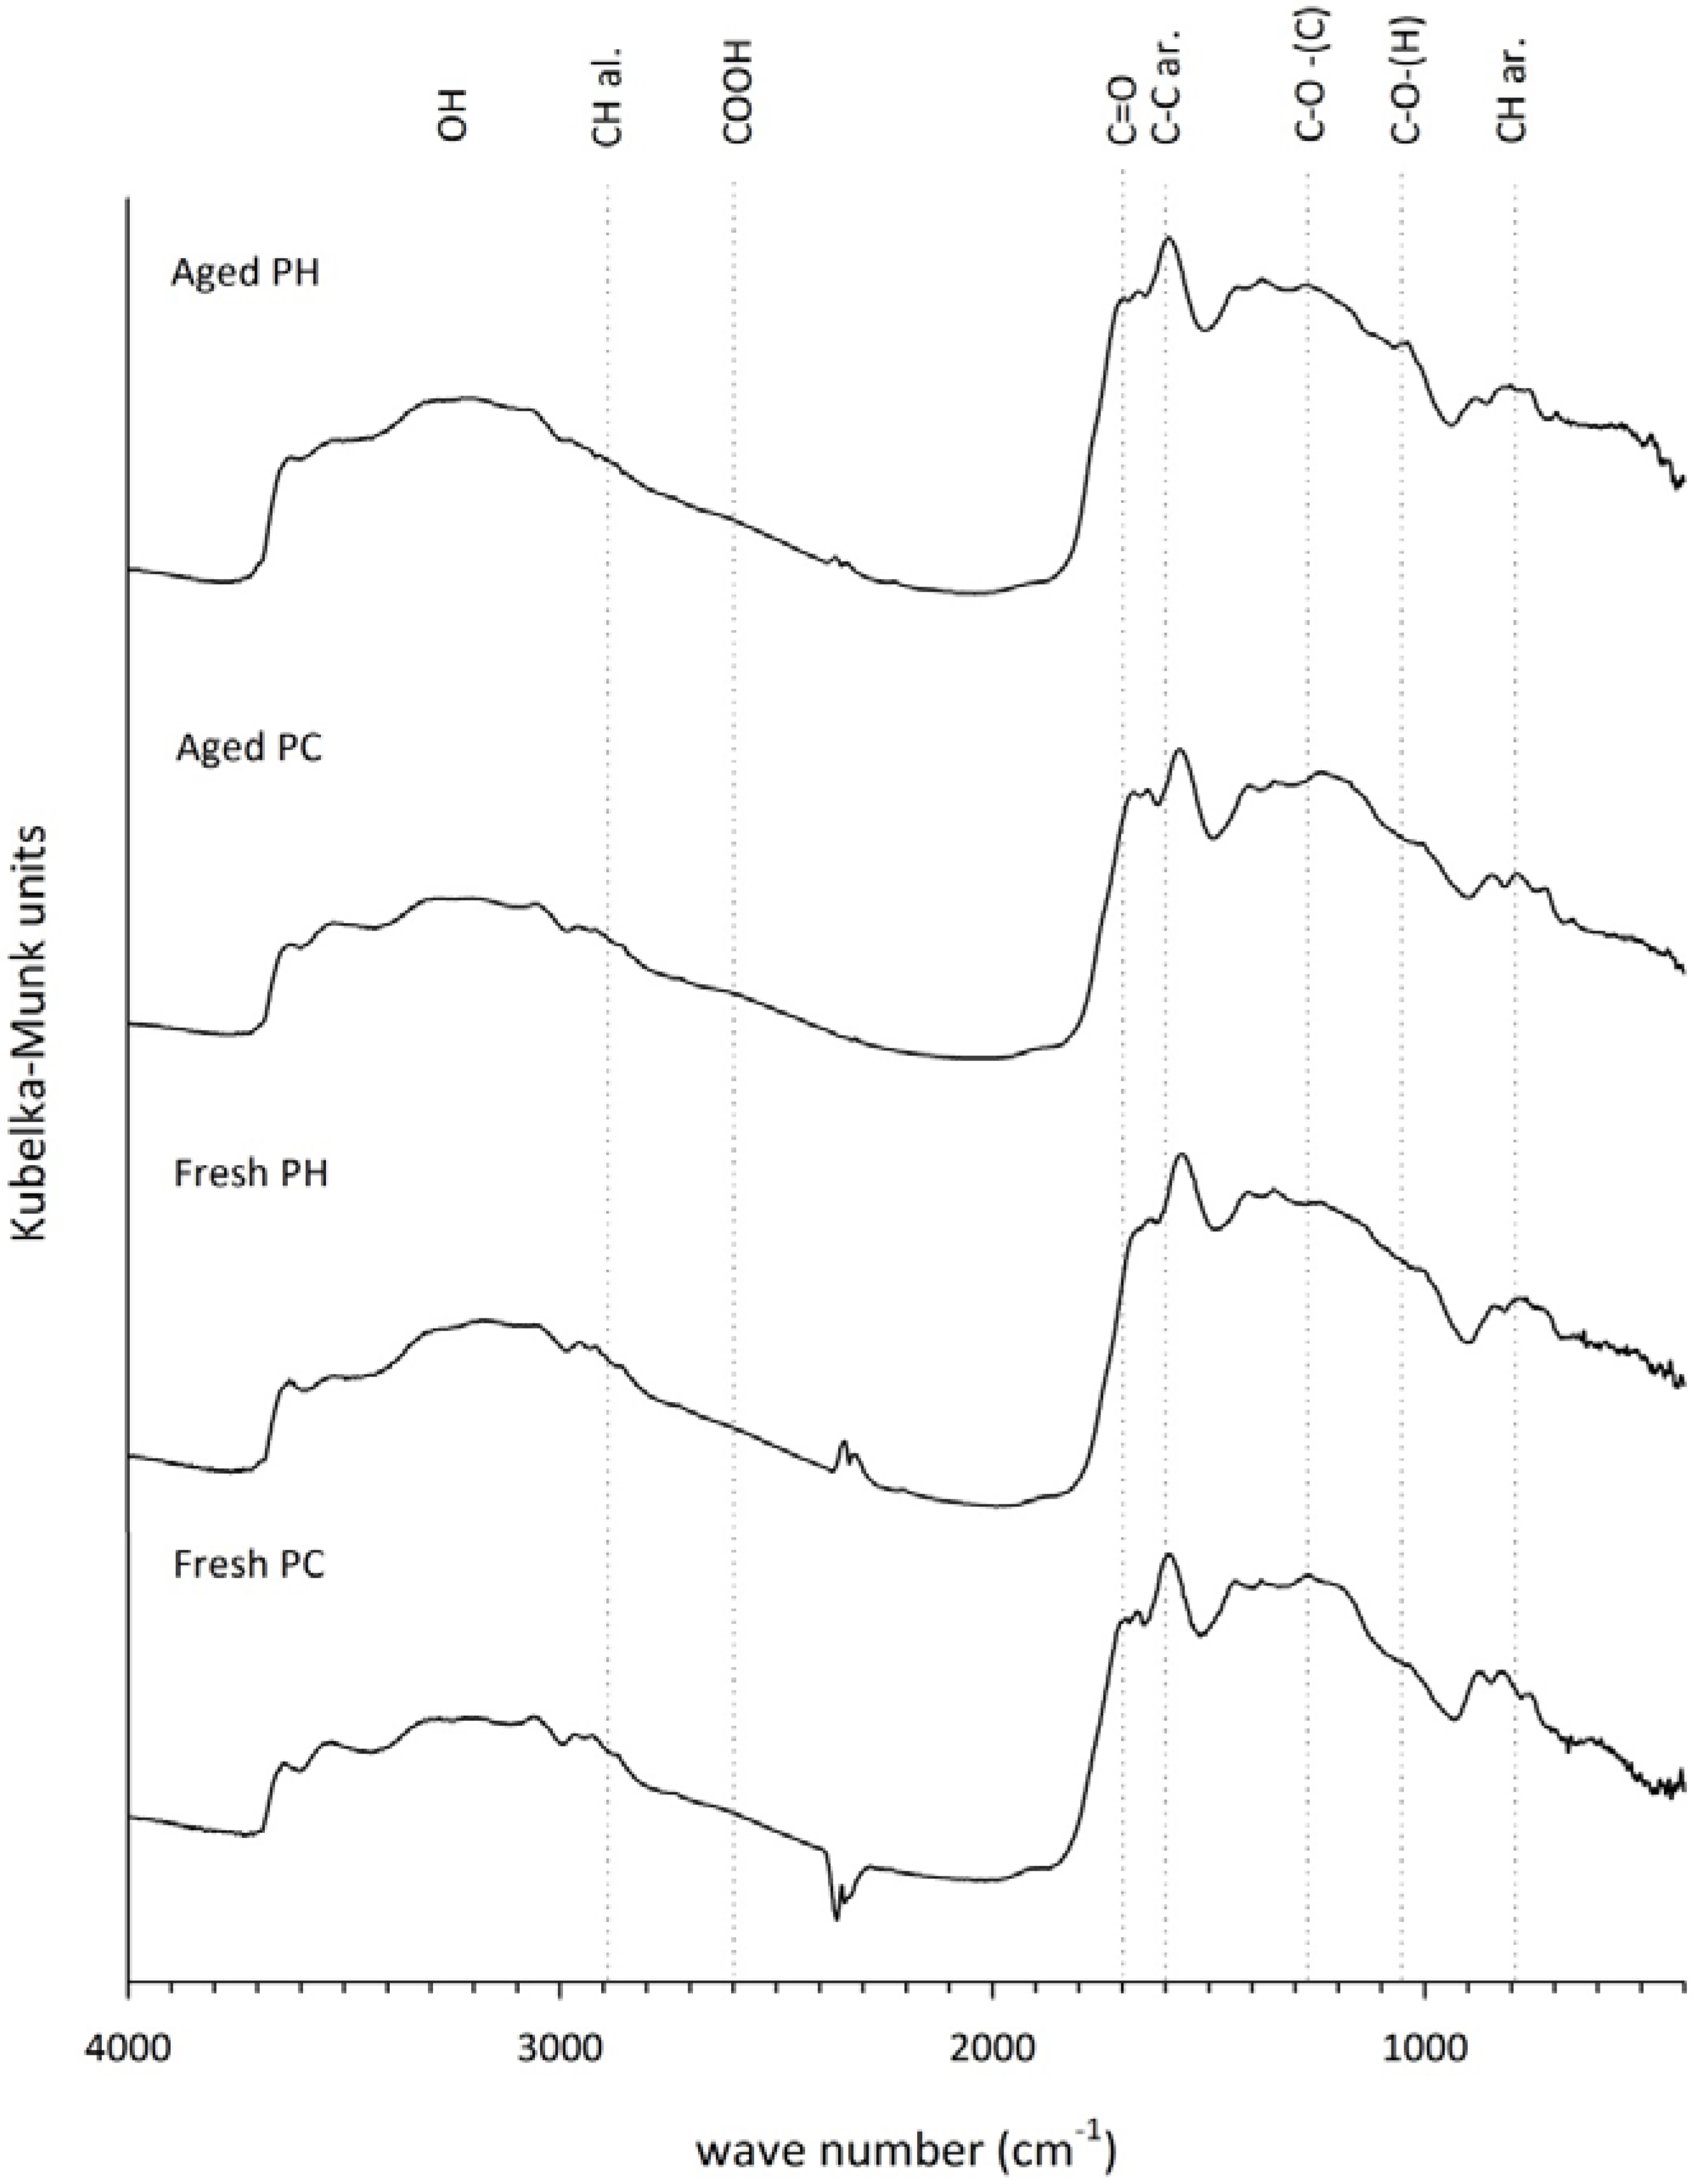
Aged PH and PC biochars had a reduced peak intensity between 3000 and 2800 cm−1 compared to their respective fresh biochars indicating a reduction in aliphatic C-H bonds (Figure 2). This was more apparent in the PH biochar. Aging also increased the concentration of oxygen containing groups. Carbonyl (1700 cm−1) and C-O-(H) (1050 cm−1) increased in PH and PC and C-O-(C) (1275 cm−1) in PH. The aging process did not affect the concentration of aromatic bonds (1600 cm−1) and associated aromatic C-H groups (900–700 cm−1).
Figure 2. FTIR spectra of fresh PH and PC biochars, before incubation, and aged PH and PC biochars that were incubated in soil for 136-d. Dotted lines emphasize spectra of interest.
Agronomy 03 00294 g002

4. Discussion

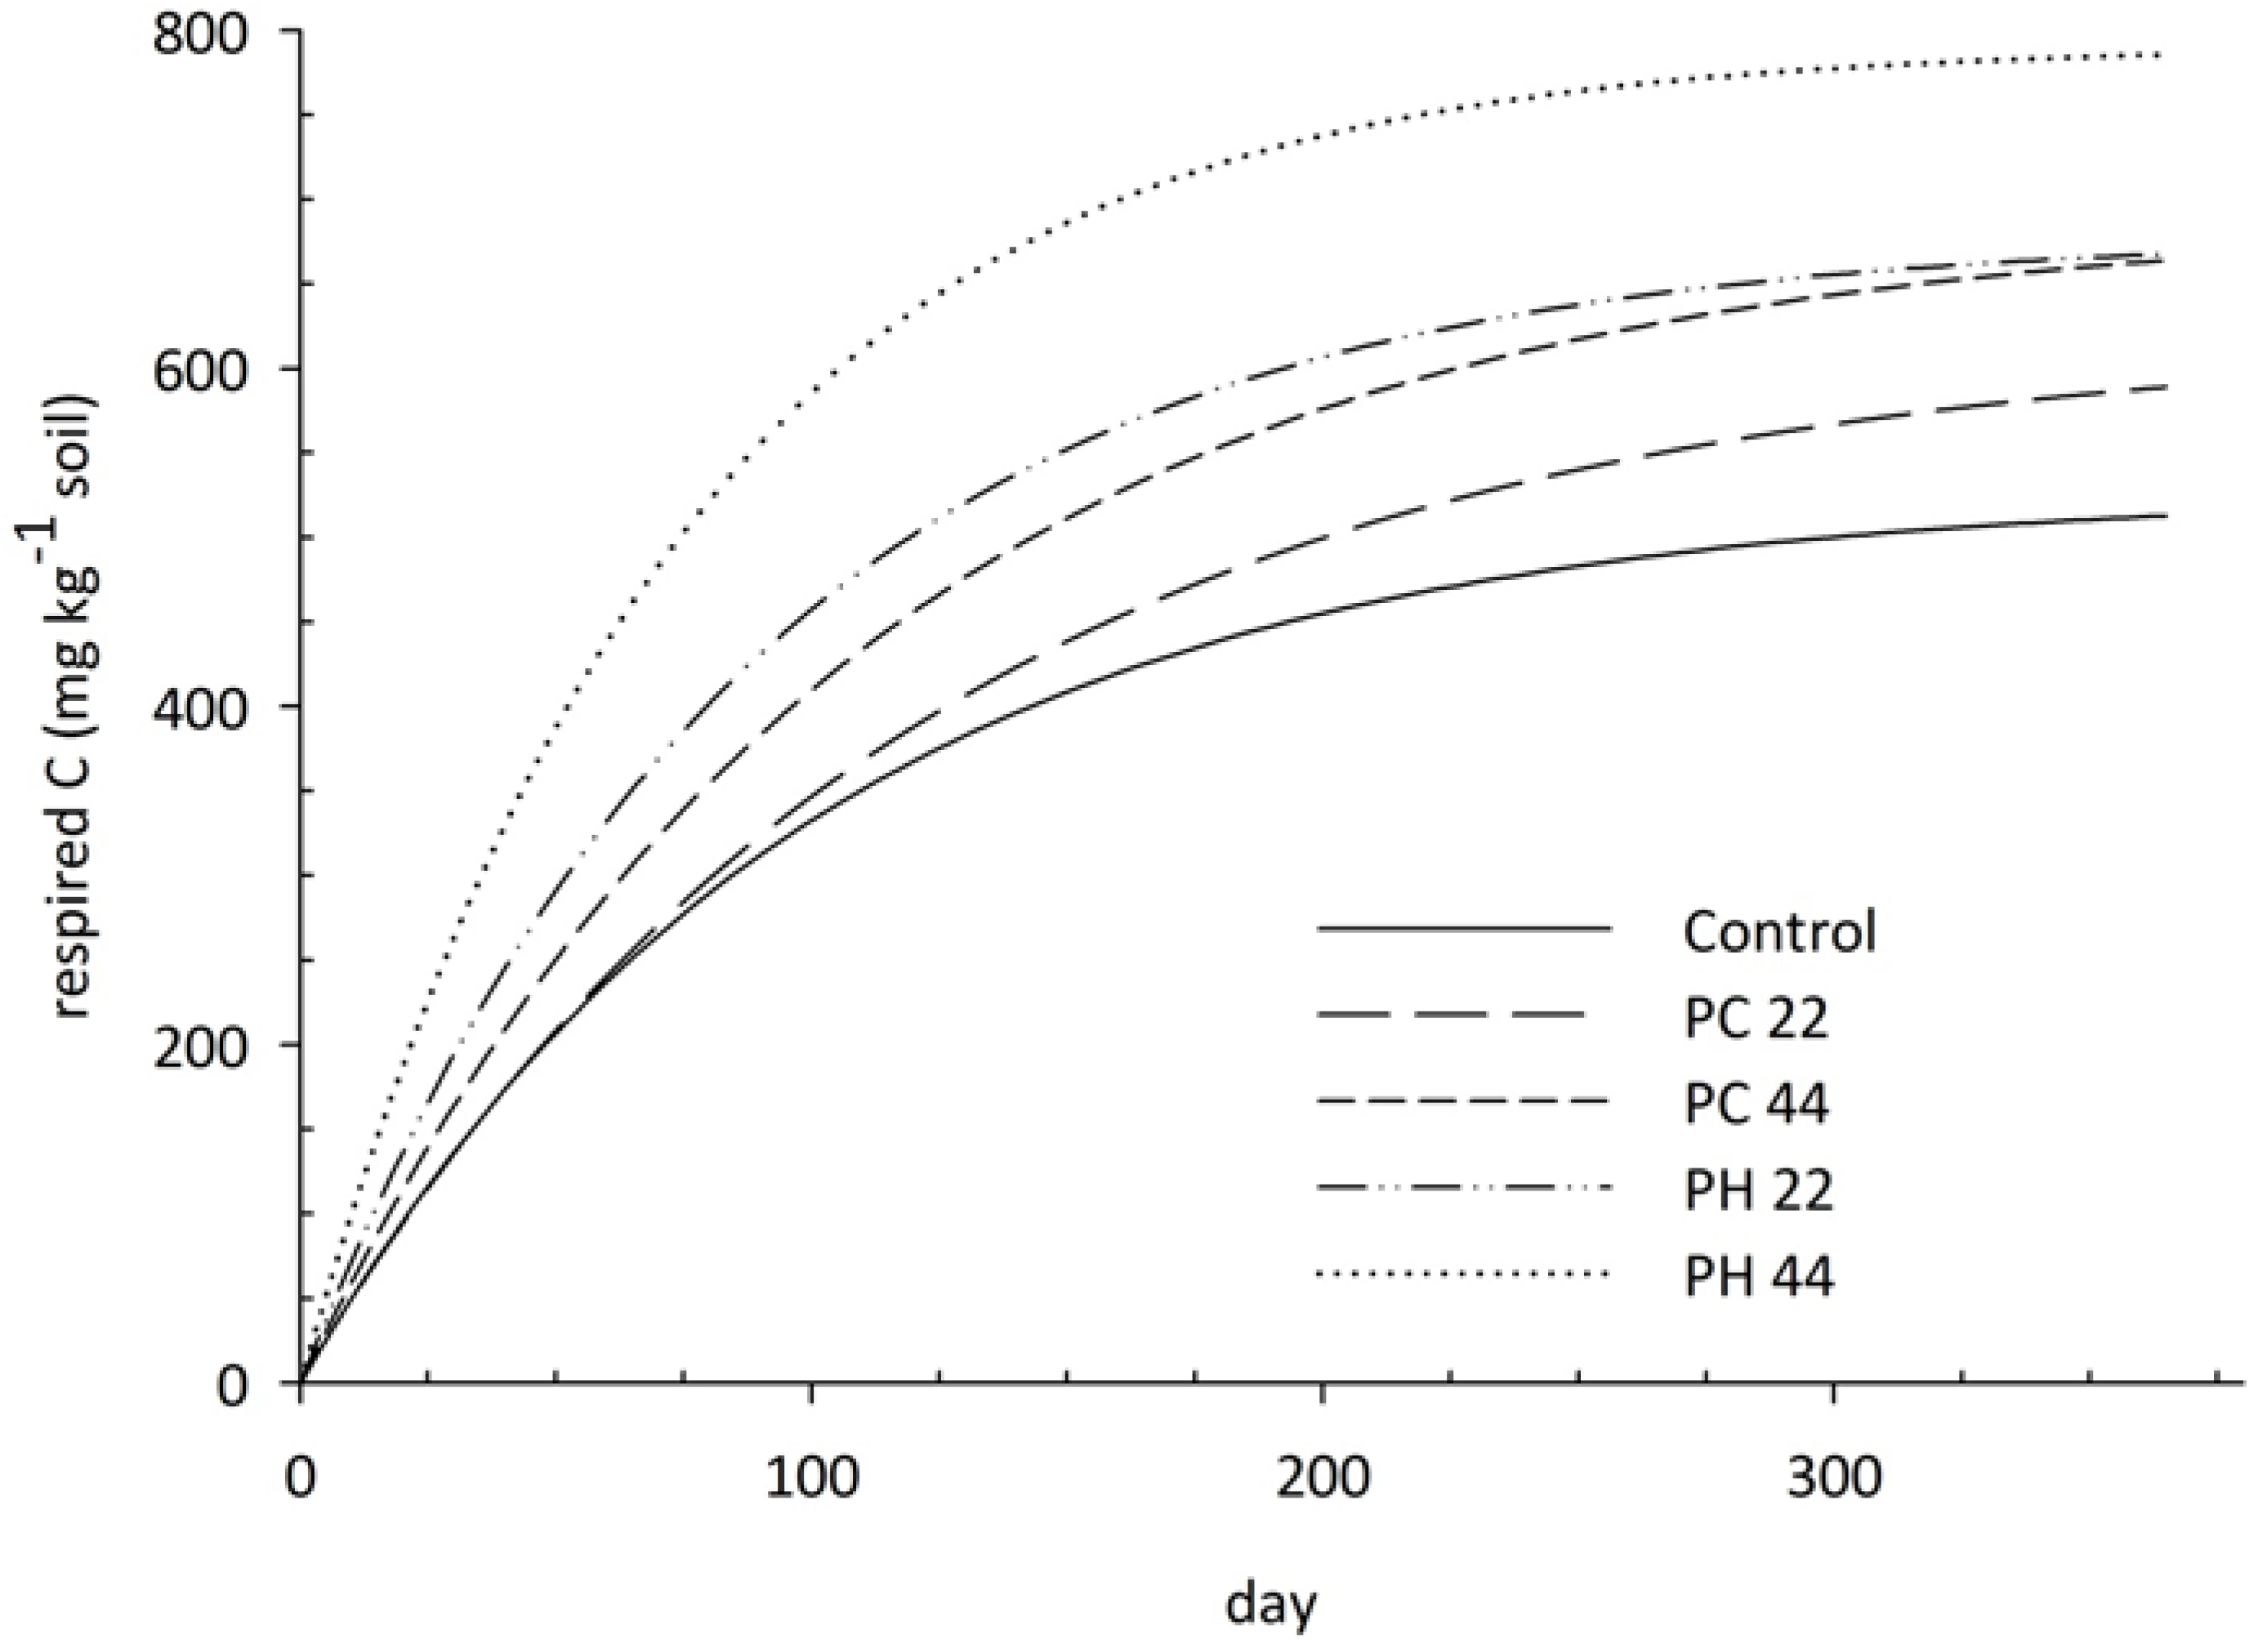
Carbon mineralization rates of biochar varied by feedstock; however, C mineralization rates were small considering the amount of C added to the system. Using the estimated rmax and subtracting the control rmax from the treatment rmax to correct for native organic matter mineralization, approximately 2% of the applied C from the PH and 1% of the PC would be mineralized over several years, with a majority of the C mineralized within the first 100 days (Figure 3). This PC mineralization rate is similar to that of oak wood pyrolyzed at 400 °C which mineralized 1% of biochar C over 100-day mineralization rate [20]. Peanut hull mineralization rates are slightly lower than rye grass produced at 350 °C and applied to a Cambisol [23]. As seen in several other studies, biochar samples underwent a brief period, approximately 2 w, of rapid mineralization [18,19,20,21,23,24] that gradually diminished to rates similar to the control soil [21].
Figure 3. Estimated C respired over 365 days to reflect maximum respired C at 25 °C based on average k and rmax for each treatment.
Agronomy 03 00294 g003
Volatile matter content, material thermally decomposed at 900 °C, has been proposed as an indicator of mineralizable C in biochar [20]. High volatile matter content macadamia nut biochar (225 g kg−1) maintained a higher respiration rate over 14-day than the low volatile matter content biochar (63.0 g kg−1) [24]; however, this component of biochar may contain aromatic compounds [40] which may not be easily decomposed by soil biota. More volatile matter was added with the PC than the PH biochar (Table 2), yet there was lower estimated maximum respired C (p < 0.0642) from PC treatments (Table 3). Conversely, more aliphatic C was added with PH than the PC biochar, which also had higher maximum respired C. The reduction in aliphatic C-H bonds indicated by FTIR (Figure 2), coupled with the reduction in biochar hydrogen content after incubation (Table 5), suggests that this fraction might have been the constituent of biochar degraded by microorganisms in soil and responsible for the initial flush of CO2 seen in other studies [18,19,20,21]. Peanut hull amended soils received a higher load of aliphatic C and also respired more C than PC amended soils; therefore, aliphatic matter content of biochar may be a better indicator of potentially mineralizable C in biochar than volatile matter content. The aliphatic content, material thermally decomposed at 400 °C and a component of the volatile matter, consists mainly of single bonded C structures and may represent compounds with a greater bioavailability than volatile matter.
Contrary to the hypothesis, PH and PC biochar handpicked from incubated soils showed an increase in aliphatic and volatile content as estimated by TGA (Table 5). The small increase in aliphatic and volatile contents may be attributed to soil microbial biomass. Charcoal has been shown to adsorb substrate and provide habitat for soil microbes [28]. Substrate induced respiration and basal respiration both increased with increasing levels of biochar application across several soil types and appeared only limited by soil fertility [41]. Soils from a burned pine plantation in Turkey showed an increase in fungal and bacterial populations; however, there was no significant increase in microbial biomass C compared to the control [42]. Kolb et al. [41] suggest biochar may increase microbial habitat based on seeing the largest increase in an Entisol with sandy structure and low fertility.
Biochar characteristics can have an effect on soil microbial biomass. Peanut hull biochar has dissolved organic C content of 0.20 g kg−1 compared to PC’s 0.12 g kg−1 [9] as well as significantly more P, K, and micronutrients (Table 1). Leached C from biochar may provide a food source for soil microbes [24,25] in addition to the substrate adsorbed by charcoal [28]. Excess major and micro- nutrients from biochar may also stimulate microbial populations [31,41]. Biochars produced from different feedstocks can have a range of surface areas even when produced under the same conditions [13] meaning the PH biochar may have provided more habitat than the PC biochar. Given that PH biochar contains higher dissolved organic C, major and micro- nutrients, surface area, and aliphatic C we would expect to see a greater increase in aliphatic content as result of increased microbial biomass; however, there was no interaction between feedstock and condition (Table 5).
As expected, C, N, and H concentrations decreased due to aging (Table 5). An unexpected increase in ash content may account for a portion of the decrease. Handpicked biochar samples had a brown tint similar to the soil matrix color which may have been the result of soil minerals attached to the biochar surface [43]. The cumulative concentration of C, N, and H was 811 g kg−1 in the fresh biochar and 723 g kg−1 in the aged. Moisture and ash accounted for 117 and 190 g kg−1 of the remaining mass of fresh and aged biochars, respectively, for a total of 928 and 913 g kg−1. The remaining mass of the biochar is most likely attributed to oxygen [23,44,45]. Fourier transform infrared spectroscopy spectra indicate the fresh PH and PC biochars have similar surface structures to other wood and nut shell derived black carbon reported in the literature [3,46] and oxygen containing functionalities, specifically carboxylic groups, on biochars increased (Figure 2) during incubation. Surface oxidation of black carbon can occur within six months when incubated in soil at 30 °C [45]. Black locust biochar incubated in soil at 30 °C for 4 months showed a slight increase in oxygen content most likely attributed to the formation of carboxylic functional groups [3].
There is no evidence that the biochar stimulated mineralization of the native organic matter as seen in other studies [16]. The control soil used in the respiration study is defined by a low organic matter content and fertility. As a result, the microbial populations in the soils vary greatly based on the substrate available. Control samples in the 136-day respiration had an inverse relationship between k and rmax which indicates the samples may have been substrate limited (Fisher, personal communication, August, 2008). The control soil would respire less C, on average, than biochar treatments (Figure 3) but soil organic matter would still account for a significant amount of C respired from biochar treatments if that rate remained consistent between treatments. The estimated rmax of the control soil predicts that approximately 10% of the soil C will mineralize; however, due to variability, the estimate may not accurately represent the amount of C respired from the native organic matter in biochar amended samples.
Surprisingly, PH and PC biochar had little effect on net N mineralization rates, even in PC treatments due to the high C:N ratio. High volatile matter (225 g kg−1) macadamia nut shell applied to soil and incubated reduced extractable NH4-N concentrations indicating immobilization [24]. Manure derived chars have been shown to be provide N to plants [31,32] so we expected to see at least some N mineralized from the PH biochar. There were no signs of N mineralization or immobilization in biochar treatments of the long term incubation study (Table 3). Peanut hull biochar has been shown to emit ethylene which can inhibit nitrification [34]; however, we saw higher nitrate, on average, in PH treatments (data not shown). Higher application rates of biochar may have stimulated nitrifying bacteria compared to the control and 22 Mg ha−1 but this effect wasn’t evident based on the statistical analysis of NH4+-N and NO3-N data.
The short-term incubation study offered insight into why biochar had no effect on N dynamics. Peanut hull biochar and feedstock have the same C:N ratio (Table 1) which is only slightly higher than the 20:1 ratio of the soil; therefore, equal mineralization would be expected if biochar N was available as in manure chars [31,32]. Peanut hull and PC feedstocks mineralized 16% and 5.5% of applied C while PH and PC biochars only mineralized 1.5% and 1.1% over the 24-day incubation (Table 4). Only PH feedstock mineralized a significant amount of N compared to the control, 9.55 mg kg−1. High variability in the NO3-N data resulted in no differences compared to the control; however, PC feedstock appeared to immobilize N as expected. The chemical stability of N in biochar increases with increasing biochar production temperature by becoming incorporated in the aromatic structure as heteroatoms [23,47,48,49]; therefore, N in biochar samples may have been incorporated into the biologically unavailable C complexes where N in the feedstock was still contained in mineral form or within decomposable proteins. Nitric oxide emission during controlled combustion of chars is a qualitative method that can determine the thermal stability of N compounds [46]. Nitric oxide analysis shows two N pools in PH feedstock but only one stable pool in PH biochar (Figure 1). Pine chip feedstock had a single N pool most likely associated with aliphatic compounds; however, the high C:N ratio caused PC feedstock systems to be N limited.
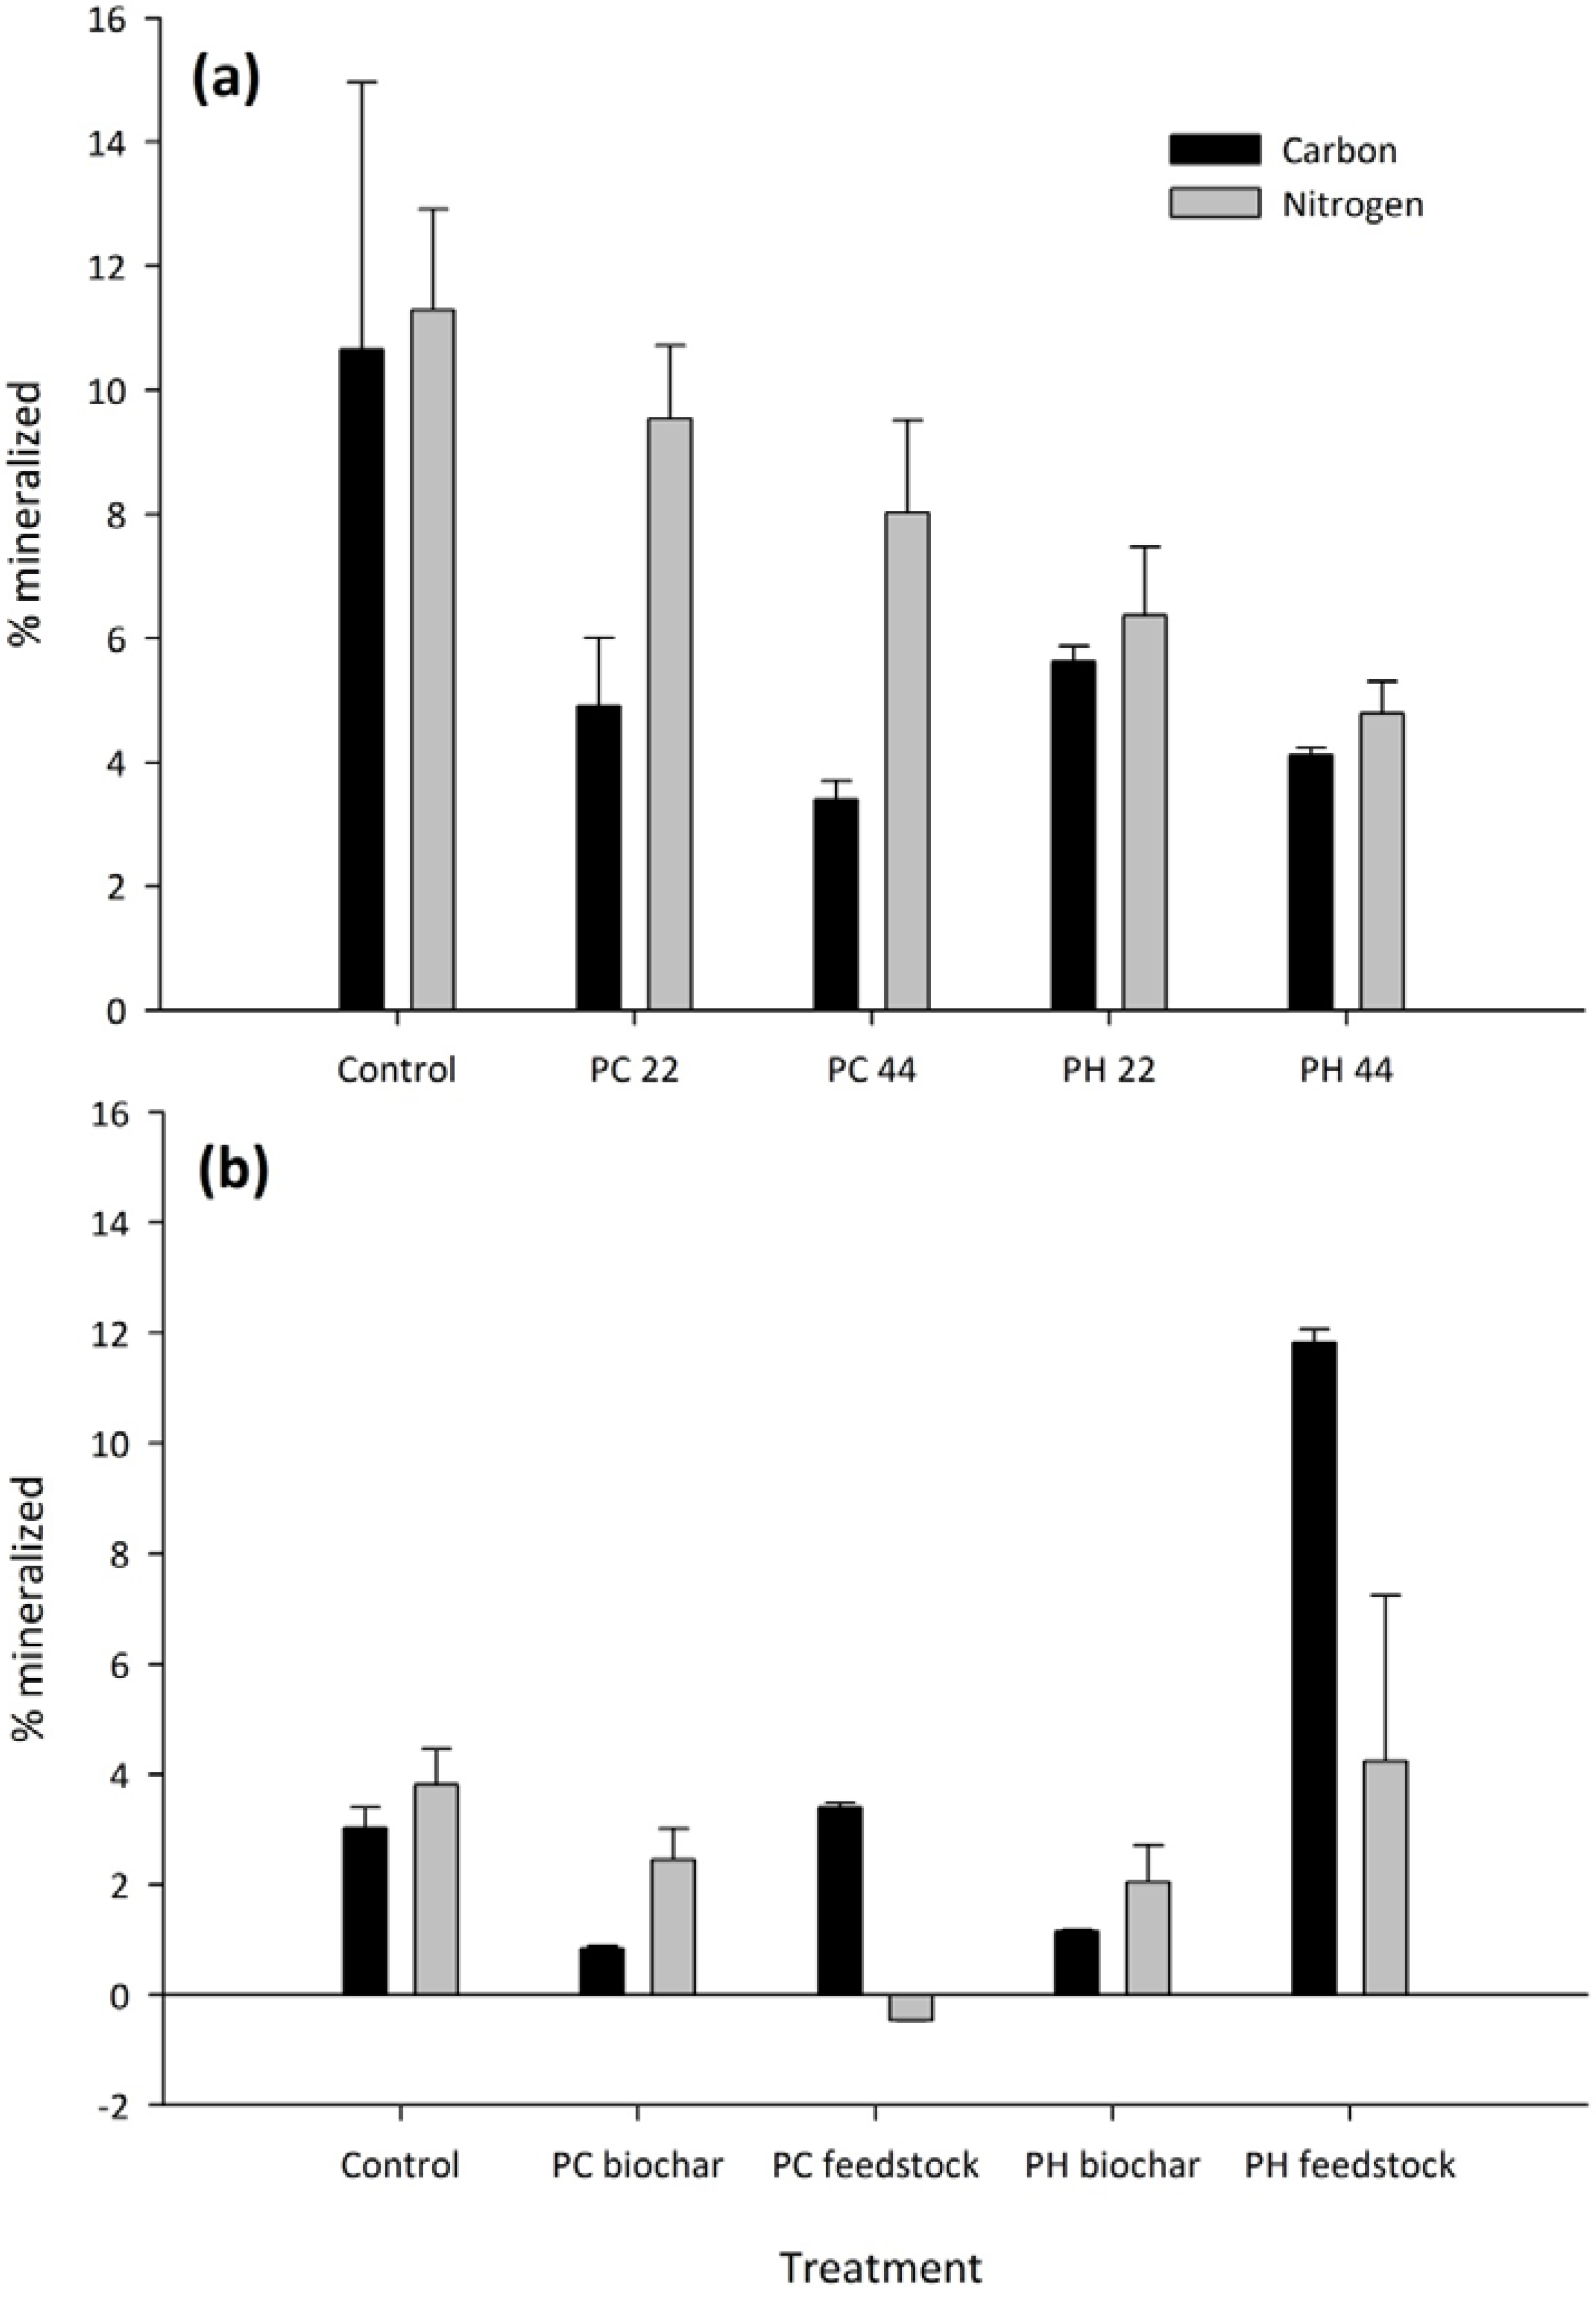
Summing total C and N in soil with the total C and N added with each biochar and feedstock application and comparing that value to the rmax and mineralized N of the 136-day study and the cumulative respired C and mineralized N of the 24-day study, we see that native and applied unaltered organic matter C and N is more labile than biochar (Figure 4). The control mineralized both more net C and N on a percentage basis than biochar treatments in each study. The PC treatment N mineralization rates were similar to the control because a majority of the N in those systems was from the native organic matter and in a labile form; however, a greater load of fixed C (Table 1) was applied with PC biochar therefore less C was mineralized in those treatments. Peanut hull treatments received a significant load of biochar N and aliphatic C and in turn less N and more C was mineralized from PH systems.
Figure 4. Net mineralization of total C and N, with standard deviation, from each treatment of the (a) 136-day and (b) 24-day mineralization studies.
Agronomy 03 00294 g004

5. Conclusions

Aliphatic content of biochar as measured by TGA may be a better indicator of mineralizable C than volatile matter content as measured by ASTM D5142 method. Our data show that more C would be mineralized from PH biochar amended samples that received a higher load of aliphatic C than volatile matter. Both aliphatic and volatile matter content may be useful factors for modeling maximum respired C though more research is needed testing several feedstocks with a wide range of aliphatic and volatile matter concentration coupled with respiration studies to insure the models accuracy. If aliphatic content is shown to be a better indicator on mineralizable C in biochar, ASTM D5142 could be easily modified by lowering the hold temperature from 900 °C to 400 °C under N2 gas.
Aging biochar in soil did not result in lower aliphatic and volatile matter concentrations most likely because soil microbial biomass interfered with analysis of aged samples; however, aged biochar did have reduced concentrations of aliphatic C-H bonds on the surface. Carbon and N concentrations did decrease partly due to an increase in mineral/biochar complexes but also due to formation of oxygen containing functionalities.
Plant feedstock derived biochar did not have a significant effect on the N mineralization of the soil. We did not see N mineralization from the PH biochar even though it had a favorable C:N ratio. There were also no significant signs of immobilization from either biochar. Biochar N is bound in compounds that are more thermally stable than the N in its respective feedstock and may not be available to soil microbes. Additional research to investigate biochars with a range of C:N ratios, including manure derived biochars that have been shown to contain available N, is necessary to validate N characterization by TGA-MS.

References

  1. Czernik, S.; Bridgwater, A.V. Overview of applications of biomass fast pyrolysis oil. Energy Fuels 2004, 18, 590–598. [Google Scholar] [CrossRef]
  2. Gaunt, J.L.; Lehmann, J. Energy balance and emissions associated with biochar sequestration and pyrolysis bioenergy production. Environ. Sci. Technol. 2008, 42, 4152–4158. [Google Scholar] [CrossRef]
  3. Cheng, C.H.; Lehmann, J.; Thies, J.E.; Burton, S.D.; Engelhard, M.H. Oxidation of black carbon by biotic and abiotic processes. Org. Geochem. 2006, 37, 1477–1488. [Google Scholar] [CrossRef]
  4. Liang, B.; Lehmann, J.; Solomon, D.; Sohi, S.; Thies, J.E.; Skjemstad, J.O.; Luizão, F.J.; Engelhard, M.H.; Neves, E.G.; Wirick, S. Stability of biomass-derived black carbon in soils. Geochimica Et Cosmochimica Acta 2008, 72, 6069–6078. [Google Scholar] [CrossRef]
  5. Glaser, B.; Lehmann, J.; Zech, W. Ameliorating physical and chemical properties of highly weathered soils in the tropics with charcoal—A review. Biol. Fertil. Soils 2002, 35, 219–230. [Google Scholar] [CrossRef]
  6. Lehmann, J.; da Silva, J.P.; Steiner, C.; Nehls, T.; Zech, W.; Glaser, B. Nutrient availability and leaching in an archaeological anthrosol and a ferralsol of the central amazon basin: Fertilizer, manure and charcoal amendments. Plant Soil 2003, 249, 343–357. [Google Scholar] [CrossRef]
  7. Steiner, C.; Glaser, B.; Teixeira, W.G.; Lehmann, J.; Blum, W.E.H.; Zech, W. Nitrogen retention and plant uptake on a highly weathered central amazonian ferralsol amended with compost and charcoal. J. Plant Nutr. Soil Sci. Zeitschrift Fur Pflanzenernahrung Und Bodenkunde 2008, 171, 893–899. [Google Scholar] [CrossRef]
  8. Laird, D.A.; Brown, R.C.; Amonette, J.E.; Lehmann, J. Review of the pyrolysis platform for coproducing bio-oil and biochar. Biofuels Bioprod. Biorefin. 2009, 3, 547–562. [Google Scholar] [CrossRef]
  9. Gaskin, J.W.; Steiner, C.; Harris, K.; Das, K.C.; Bibens, B. Effect of low-temperature pyrolysis conditions on biochar for agricultural use. Trans. ASABE 2008, 51, 2061–2069. [Google Scholar]
  10. Antal, M.J.; Gronli, M. The art, science, and technology of charcoal production. Ind. Eng. Chem. Res. 2003, 42, 1619–1640. [Google Scholar] [CrossRef]
  11. Guerrero, M.; Ruiz, M.P.; Millera, A.; Alzueta, M.U.; Bilbao, R. Characterization of biomass chars formed under different devolatilization conditions: Differences between rice husk and eucalyptus. Energy Fuels 2008, 22, 1275–1284. [Google Scholar] [CrossRef]
  12. Brewer, C.E.; Schmidt-Rohr, K.; Satrio, J.A.; Brown, R.C. Characterization of biochar from fast pyrolysis and gasification systems. Environ. Prog. Sustain. Energy 2009, 28, 386–396. [Google Scholar] [CrossRef]
  13. Keiluweit, M.; Nico, P.S.; Johnson, M.G.; Kleber, M. Dynamic molecular structure of plant biomass-derived black carbon (biochar). Environ. Sci. Technol. 2010, 44, 1247–1253. [Google Scholar] [CrossRef]
  14. Bird, M.I.; Ascough, P.L.; Young, I.M.; Wood, C.V.; Scottc, A.C. X-ray microtomographic imaging of charcoal. J. Archaeol. Sci. 2008, 35, 2698–2706. [Google Scholar] [CrossRef]
  15. Keech, O.; Carcaillet, C.; Nilsson, M.C. Adsorption of allelopathic compounds by wood-derived charcoal: The role of wood porosity. Plant Soil 2005, 272, 291–300. [Google Scholar] [CrossRef]
  16. Wardle, D.A.; Nilsson, M.C.; Zackrisson, O. Fire-derived charcoal causes loss of forest humus. Science 2008, 320, 629. [Google Scholar] [CrossRef]
  17. Kloss, S.; Zehetner, F.; Dellantonio, A.; Hamid, R.; Ottner, F.; Liedtke, V.; Schwanninger, M.; Gerzabek, M.H.; Soja, G. Characterization of slow pyrolysis biochars: Effects of feedstocks and pyrolysis temperature on biochar properties. J. Environ. Qual. 2012, 41, 990–1000. [Google Scholar] [CrossRef]
  18. Bruun, S.; Jensen, E.S.; Jensen, L.S. Microbial mineralization and assimilation of black carbon: Dependency on degree of thermal alteration. Org. Geochem. 2008, 39, 839–845. [Google Scholar] [CrossRef]
  19. Kuzyakov, Y.; Subbotina, I.; Chen, H.Q.; Bogomolova, I.; Xu, X.L. Black carbon decomposition and incorporation into soil microbial biomass estimated by c-14 labeling. Soil Biol. Biochem. 2009, 41, 210–219. [Google Scholar] [CrossRef]
  20. Zimmerman, A.R. Abiotic and microbial oxidation of laboratory-produced black carbon (biochar). Environ. Sci. Technol. 2010, 44, 1295–1301. [Google Scholar] [CrossRef]
  21. Smith, J.L.; Collins, H.P.; Bailey, V.L. The effect of young biochar on soil respiration. Soil Biol. Biochem. 2010, 42, 2345–2347. [Google Scholar] [CrossRef]
  22. Steinbeiss, S.; Gleixner, G.; Antonietti, M. Effect of biochar amendment on soil carbon balance and soil microbial activity. Soil Biol. Biochem. 2009, 41, 1301–1310. [Google Scholar] [CrossRef]
  23. Hilscher, A.; Heister, K.; Siewert, C.; Knicker, H. Mineralisation and structural changes during the initial phase of microbial degradation of pyrogenic plant residues in soil. Org. Geochem. 2009, 40, 332–342. [Google Scholar] [CrossRef]
  24. Deenik, J.L.; McClellan, T.; Uehara, G.; Antal, M.J.; Campbell, S. Charcoal volatile matter content influences plant growth and soil nitrogen transformations. Soil Sci. Soc. Am. J. 2010, 74, 1259–1270. [Google Scholar] [CrossRef]
  25. Jones, D.L.; Murphy, D.V.; Khalid, M.; Ahmad, W.; Edwards-Jones, G.; DeLuca, T.H. Short-term biochar-induced increase in soil co2 release is both biotically and abiotically mediated. Soil Biol. Biochem. 2011, 43, 1723–1731. [Google Scholar] [CrossRef]
  26. Zimmerman, A.R.; Gao, B.; Ahn, M.Y. Positive and negative carbon mineralization priming effects among a variety of biochar-amended soils. Soil Biol. Biochem. 2011, 43, 1169–1179. [Google Scholar] [CrossRef]
  27. Liang, B.Q.; Lehmann, J.; Sohi, S.P.; Thies, J.E.; O'Neill, B.; Trujillo, L.; Gaunt, J.; Solomon, D.; Grossman, J.; Neves, E.G.; Luizao, F.J. Black carbon affects the cycling of non-black carbon in soil. Org. Geochem. 2010, 41, 206–213. [Google Scholar] [CrossRef]
  28. Pietikainen, J.; Kiikkila, O.; Fritze, H. Charcoal as a habitat for microbes and its effect on the microbial community of the underlying humus. Oikos 2000, 89, 231–242. [Google Scholar]
  29. Zackrisson, O.; Nilsson, M.C.; Wardle, D.A. Key ecological function of charcoal from wildfire in the boreal forest. Oikos 1996, 77, 10–19. [Google Scholar] [CrossRef]
  30. Gaskin, J.W.; Speir, R.A.; Harris, K.; Das, K.C.; Lee, R.D.; Morris, L.A.; Fisher, D.S. Effect of peanut hull and pine chip biochar on soil nutrients, corn nutrient status, and yield. Agron. J. 2010, 102, 623–633. [Google Scholar] [CrossRef]
  31. Chan, K.Y.; Zwieten, L.V.; Meszaros, I.; Downie, A.; Joseph, S. Using poultry litter biochars as soil amendments. Aust. J. Soil Res. 2008, 46, 437–444. [Google Scholar] [CrossRef]
  32. Tagoe, S.O.; Horiuchi, T.; Matsui, T. Effects of carbonized and dried chicken manures on the growth, yield, and n content of soybean. Plant Soil 2008, 306, 211–220. [Google Scholar] [CrossRef]
  33. DeLuca, T.H.; MacKenzie, M.D.; Gundale, M.J.; Holben, W.E. Wildfire-produced charcoal directly influences nitrogen cycling in ponderosa pine forests. Soil Sci. Soc. Am. J. 2006, 70, 448–453. [Google Scholar] [CrossRef]
  34. Spokas, K.A.; Baker, J.M.; Reicosky, D.C. Ethylene: Potential key for biochar amendment impacts. Plant Soil 2010, 333, 443–452. [Google Scholar] [CrossRef]
  35. Taghizadeh-Toosi, A.; Clough, T.J.; Sherlock, R.R.; Condron, L.M. Biochar adsorbed ammonia is bioavailable. Plant Soil 2012, 350, 57–69. [Google Scholar] [CrossRef]
  36. Schomberg, H.H.; Gaskin, J.W.; Harris, K.; Das, K.C.; Novak, J.M.; Busscher, W.J.; Watts, D.W.; Woodroof, R.H.; Lima, I.M.; Ahmedna, M.; et al. Influence of biochar on nitrogen fractions in a coastal plain soil. J. Environ. Qual. 2012, 41, 1087–1095. [Google Scholar] [CrossRef]
  37. Novak, J.M.; Busscher, W.J.; Watts, D.W.; Laird, D.A.; Ahmedna, M.A.; Niandou, M.A.S. Short-term CO2 mineralization after additions of biochar and switchgrass to a typic kandiudult. Geoderma 2010, 154, 281–288. [Google Scholar] [CrossRef]
  38. Lyons, G.; Kilpatrick, M.; Sharma, H.S.S.; Noble, R.; Dobrovin-Pennington, A.; Hobbs, P.; Andrews, F.; Carmichael, E. Characterization of recycled mushroom compost leachate by chemical analysis and thermogravimetry-mass spectrometry. J. Agric. Food Chem. 2008, 56, 6488–6497. [Google Scholar] [CrossRef]
  39. USEPA, Methods for Determination of Metals in Environmental Smples, Supplement 1; Environment Monitoring Systems Laboratory, Office of Research and Development: Cincinnati, OH, USA, 1994.
  40. Deenik, J.L.; Diarra, A.; Uehara, G.; Campbell, S.; Sumiyoshi, Y.; Antal, M.J. Charcoal ash and volatile matter effects on soil properties and plant growth in an acid ultisol. Soil Sci. 2011, 176, 336–345. [Google Scholar] [CrossRef]
  41. Kolb, S.E.; Fermanich, K.J.; Dornbush, M.E. Effect of charcoal quantity on microbial biomass and activity in temperate soils. Soil Sci. Soc. Am. J. 2009, 73, 1173–1181. [Google Scholar] [CrossRef]
  42. Kara, O.; Bolat, I. Short-term effects of wildfire on microbial biomass and abundance in black pine plantation soils in turkey. Ecol. Indic. 2009, 9, 1151–1155. [Google Scholar] [CrossRef]
  43. Joseph, S.D.; Camps-Arbestain, M.; Lin, Y.; Munroe, P.; Chia, C.H.; Hook, J.; van Zwieten, L.; Kimber, S.; Cowie, A.; Singh, B.P.; et al. An investigation into the reactions of biochar in soil. Aust. J. Soil Res. 2010, 48, 501–515. [Google Scholar] [CrossRef]
  44. Cheng, C.H.; Lehmann, J.; Engelhard, M.H. Natural oxidation of black carbon in soils: Changes in molecular form and surface charge along a climosequence. Geochimica Et Cosmochimica Acta 2008, 72, 1598–1610. [Google Scholar] [CrossRef]
  45. Cheng, C.H.; Lehmann, J. Ageing of black carbon along a temperature gradient. Chemosphere 2009, 75, 1021–1027. [Google Scholar] [CrossRef]
  46. Varhegyi, G.; Szabo, P.; Till, F.; Zelei, B.; Antal, M.J.; Dai, X.F. Tg, tg-ms, and ftir characterization of high-yield biomass charcoals. Energy Fuels 1998, 12, 969–974. [Google Scholar] [CrossRef] [Green Version]
  47. Stanczyk, K.; Dziembaj, R.; Piwowarska, Z.; Witkowski, S. Transformation of nitrogen structures in carbonization of model compounds determined by xps. Carbon 1995, 33, 1383–1392. [Google Scholar] [CrossRef]
  48. Schmiers, H.; Friebel, J.; Streubel, P.; Hesse, R.; Kopsel, R. Change of chemical bonding of nitrogen of polymeric n-heterocyclic compounds during pyrolysis. Carbon 1999, 37, 1965–1978. [Google Scholar] [CrossRef]
  49. Knicker, H. How does fire affect the nature and stability of soil organic nitrogen and carbon? A review. Biogeochemistry 2007, 85, 91–118. [Google Scholar] [CrossRef]