Article

Effects of Long Term Application of Inorganic and Organic Fertilizers on Soil Organic Carbon and Physical Properties in Maize–Wheat Rotation

1
Department of Soils, Punjab Agricultural University, Ludhiana 141 004, India
2
Department of Forestry, Southern Illinois University, Carbondale, IL 62901, USA
3
Department of Soil, Environmental and Atmospheric Science, University of Missouri, Columbia, MO 65211, USA
*
Authors to whom correspondence should be addressed.
Agronomy 2015, 5(2), 220-238; https://doi.org/10.3390/agronomy5020220
Submission received: 16 March 2015 / Revised: 29 May 2015 / Accepted: 16 June 2015 / Published: 18 June 2015
(This article belongs to the Special Issue Advanced Agronomy with Impact for Food Security)

Abstract

:
Balanced and integrated use of organic and inorganic fertilizers may enhance the accumulation of soil organic matter and improves soil physical properties. A field experiment having randomized complete block design with four replications was conducted for 36 years at Punjab Agricultural University (PAU), Ludhiana, India to assess the effects of inorganic fertilizers and farmyard manure (FYM) on soil organic carbon (SOC), soil physical properties and crop yields in a maize (Zea mays)–wheat (Triticum aestivum) rotation. Soil fertility management treatments included were non-treated control, 100% N, 50% NPK, 100% NP, 100% NPK, 150% NPK, 100% NPK + Zn, 100% NPK + W, 100% NPK (-S) and 100% NPK + FYM. Soil pH, bulk density (BD), electrical conductivity (EC), cation exchange capacity, aggregate mean weight diameter (MWD) and infiltration were measured 36 years after the initiation of experiment. Cumulative infiltration, infiltration rate and aggregate MWD were greater with integrated use of FYM along with 100% NPK compared to non-treated control. No significant differences were obtained among fertilizer treatments for BD and EC. The SOC pool was the lowest in control at 7.3 Mg ha−1 and increased to 11.6 Mg ha−1 with 100%NPK+FYM. Improved soil physical conditions and increase in SOC resulted in higher maize and wheat yields. Infiltration rate, aggregate MWD and crop yields were positively correlated with SOC. Continuous cropping and integrated use of organic and inorganic fertilizers increased soil C sequestration and crop yields. Balanced application of NPK fertilizers with FYM was best option for higher crop yields in maize–wheat rotation.

1. Introduction

Fertilizers are usually applied to soil for increasing or maintaining crop yields to meet the increasing demand of food [1]. Application of inorganic fertilizers results in higher soil organic matter (SOM) accumulation and biological activity due to increased plant biomass production and organic matter returns to soil in the form of decaying roots, litter and crop residues [2,3,4,5,6]. Addition of SOM enhances soil organic carbon (SOC) content, which is an important indicator of soil quality and crop productivity [7]. Sequestration of SOC is key to reduce greenhouse gas emissions and lower the carbon footprint of farming [8]. Fertilizer applications could affect soil physical properties directly or indirectly such as aggregate stability, water holding capacity, porosity, infiltration rate, hydraulic conductivity and bulk density due to increases in SOM and SOC content [1]. The SOM components such as humic molecules and polysaccharides increased aggregate stability by binding mineral particles into aggregates and reduced their susceptibility to erosion by wind or water [9]. In turn, formation of stable aggregates enhances physical protection of SOM against microbial decomposition [10]. Fertilizer additions also affect the chemical composition of soil solution which can be responsible for dispersion/flocculation of clay particles and thus, affects the soil aggregation stability [1]. Beneficial effects of increasing SOM concentration on enhancing soil structural stability have been widely documented [9,11,12]. Reduction in SOM can degrade soil quality and fertility resulting in reduced agronomic productivity [13]. The SOM lowered the soil bulk density [14] and compaction [12], resulting in increased total porosity and water infiltration rate [11,15,16].
A traditional agricultural practice of applying nutrients was through organic manures such as green manures, farmyard manure (FYM). Organic manure applications improved soil physical properties through increased soil aggregation [2,17,18], improved aggregate stability [19,20,21,22,23], decrease in the volume of micropores while increasing macropores [24], increased saturated hydraulic conductivity [16,25] and water infiltration rate [26,27,28], and improved soil water-holding capacity at both field capacity and wilting point [2,18,22,29,30,31]. Organic manures and compost applications resulted in higher SOC content compared to same amount of inorganic fertilizers applications [32]. Although, the accumulation of SOM through applied organic manures depends upon the rate of decomposition process [1]. Significantly higher SOM content was found from depth 0–20 cm in winter wheat and summer maize rotation after 13 years of manure application along with NPK compared to non-treated control and only NPK treatment [31]. Several studies have reported that FYM plus inorganic N applications in irrigated systems resulted in reduced bulk density, higher SOC and hydraulic conductivity and improved soil structure and microbial communities [26].
Soil management practices greatly affect the SOM and soil fertility. The SOM levels depend upon factors such as crop rotation, tillage methods, fertility management including use of inorganic fertilizers and organic manures and other components of cropping system [33]. Continuous cultivation of crops has resulted in reduction in SOC and soil physical properties in general [26]. Maintaining SOM concentration above the threshold level is critical for improving soil quality [34]. A judicious combination of organic amendments and inorganic fertilizers is widely recognized strategy of integrated nutrient management (INM) to sustain agronomic productivity and improve soil fertility [4,13,35]. Fertilizer applications and crop rotation can regulate C cycling dynamics and soil C storage through its effects on biological activity in soil and the amount and quality of residue returned to the soil [32]. Crop productivity can be enhanced by increases in SOC concentration in soils with a clay content lower than 20 per cent, and in soils of sandy–loam and loamy–sand [36]. It is difficult to detect changes in SOC in short term due to slow formation of SOM [37]. Long-term experiments can be more useful for studying the changes in soil properties and processes over time and for obtaining information on sustainability of agricultural systems for developing future strategies to maintain soil health [1]. Therefore, the objectives of this study were to assess the effect of long-term (36 years) use of farmyard manure and inorganic fertilizers in maize–wheat rotation on SOC, soil physical properties and crop yields.

2. Materials and Methods

A long term field experiment was conducted for 36 years from 1971 to 2007 at Punjab Agricultural University (PAU), Ludhiana, Punjab, India. The experimental field was located at 75°48′ E, 30°54′ N at an altitude of about 247 m asl. The experimental design was completely randomized block with four replications and plot size was 12 × 15 m2. The nine fertilizer treatments included in the experiment were: 100% N (150 kg N ha−1), 100% NP (150 kg N ha−1, 32.70 kg P ha−1), 100% NPK (150 kg N, 32.70 kg P and 31.20 kg K ha−1), 50% NPK (75 kg N ha−1, 16.35 kg P ha−1, 15.6 kg K ha−1), 100% NPK + FYM (150 kg N, 32.7 kg P and 31.2 kg K ha−1, 10 Mg ha−1 FYM), 100% NPK + Zn, 150% NPK (225 kg N ha−1, 49.05 kg P ha−1 and 46.8 kg K ha−1), 100%NPK + W (Weeding was done only by herbicide use) and 100% NPK(-S). A non-treated control (no fertilizer applied) was included to compare increases in yield due to fertilizer treatments. The crop rotation was maize–wheat–cowpea initially, but the cowpea cultivation was discontinued after 2000. Soil fertilizer rates for cowpea (Vigna unguiculata L.) were 20 kg N, 17.5 kg P and 16.6 kg K ha−1. The NPK fertilizer rates were reduced to 120 kg N, 26.2 kg P and 25 kg K for maize and wheat after 1998. Nitrogen was applied as urea, P as single superphosphate (SSP) and K as muriate of potash. The source of P was diammonium phosphate (DAP) for the 100% NPK (-S) treatment. Farmyard manure (FYM) at 10 Mg ha−1 was applied once a year before sowing maize. Zinc sulphate at 50 kg ha−1 was applied once every three years in treatment 100% NPK + Zn. The FYM used in this experiment had an average 14.8% organic C, 0.9% N, 0.5% P and 1.1% K. The experimental site had sandy loam soil texture (Typic Ustochrepts), characterized by pH of 8.2, electrical conductivity (EC) of 0.30 dS m−1 (1:2 soil water suspension) and cation exchange capacity (CEC) of 5.1 cmol (+) kg−1 soil. Surface soil (0–15 cm) tested had 2.4 g kg−1 total C, 87 kg ha−1 available N, 9 kg ha−1 Olsen P and 88 kg ha−1 NH4OAc extractable K.
Maize was generally planted in between 1–15 June and harvested in October. Different maize cultivars used during the study were Ganga 5 from 1971 to 1983, Partap from 1984 to 2000, JH 3459 from 2001 to 2004 and F9572A from 2004 onward. Following the harvest of maize in October, wheat was generally sown from 1–15 November and harvested in the month of April. Wheat was followed by cowpea planting and harvesting for fodder after about 50 days. The wheat cultivars used were Kalyan Sona from 1971 to 1978, WL 711 from 1978 to 1989, HD 2329 from 1989 to 1997 and PBW 343 from 1997 onwards. The cowpea cultivars used were FS1 from 1971 to 1976 and FS 68 from 1977 onwards. All crops were adequately irrigated using canal and ground water. Agronomic and crop management practices followed were those recommended by Punjab Agricultural University (PAU). Weeds were controlled by hand-weeding and herbicide use in all the treatments except 100% NPK+ W where only herbicides were used. Atrazine at 1.25 kg ha−1 (a.i.) in 200 liters of water was sprayed on the soil within 10 days after sowing of maize. Similarly, 2-4-D sodium salt at 675 g ha−1 (commercial) and Topic (15 WP) at 400 g ha−1 in 200 liters of water were sprayed after 35 days of sowing of wheat.
Soil samples were collected from depth of 0–15 cm before sowing of maize in 1971 and after 36 annual cycles of cropping in 2007. Sample was collected from six spots in each plot and mixed to obtain a composite sample needed for analysis. The collected soil samples were air-dried, ground to pass through 2mm sieve and analyzed for pH, electrical conductivity (EC), cation exchange capacity (CEC), bulk density (BD) and SOC [38]. Soil pH and EC were measured by using a soil water suspension ratio of 1:2 [39]. Electrical conductivity less than 0.8 dS m−1 is considered safe for all types of crops, 0.8–1.6 is considered marginal, where only moderately salt-tolerant crops such as barley, wheat, millet, mustard and spinach can be grown, and EC more than 1.6 dS m−1 is considered harmful for all types of crops [40]. The soil BD was measured by taking additional samples from 0–15 cm soil depth using an 8.0 cm core sampler [41]. The SOC carbon was determined by Walkley and Black’s titration method [42]. The SOC pool was calculated as given below:
SOC pool (SOCP) (Mg ha−1) = SOC Concentration (g kg−1) × Soil depth (m) × Bulk Density (Mg m−3) ×10
The carbon sequestration rates were calculated as [43]:
SOCSR (Mg C ha−1year−1) = (SOCPi − SOCPo)/T
where SOCSR is SOC sequestration rate, SOCPi is soil organic pool in 2007 and SOCPo was soil organic carbon pool in 1971 and T is years of experiment (36 years). According to soil fertility recommendations in Punjab, soils containing less than 4.0 g kg−1 organic carbon are classified as low, 4.0–7.5 g kg−1 medium and greater than 7.5 g kg−1 as high in fertility, particularly for supplying nitrogen to the growing crops.
Soil samples from 0–15 cm depth were used for aggregate analysis by the wet sieving method [44]. Aggregate samples were sieved in water using double stage Yodder’s apparatus which have a series of sieves to obtain the following aggregates size fractions: 2 to 1 mm, 1.0 to 0.5 mm, 0.5 to 0.25 mm and 0.25 to 0.10 mm. Aggregate fractions retained on each sieve were transferred into a container and oven-dried at 65 °C. The aggregate mean weight diameter (MWD) was determined by using the following relationship [45]:
M W D = Σ X i Y i
where, Xi is the mean diameter (mm) of soil aggregate size fractions and Yi is the mass of the aggregates as a fraction of the total dry mass of the sample analyzed.
Water infiltration characteristics were measured in May, 2007 using a double ring infiltrometer [46]. The diameters of the inner and outer rings were 20 cm and 30 cm, respectively with 30 cm depth. Both rings were inserted 10 cm into the soil leaving 20 cm above the ground surface. Crop residues were left intact while installing these rings. A constant head was maintained in outer ring for the entire 360 min duration of the experiment. The infiltration data were analyzed according to Kostiakov [47] model. This model uses a regression equation and is applicable for a wide range of soils. It was chosen due to its simplicity and wide applicability. The model equations are shown below:
I = a t b
Infiltration rate = dI/dt = abt(b−1) = a'tb'
where I is cumulative infiltration (cm), t is time (min), a, b, a' and b' are empirically determined constants which are site specific and depends on soil properties such as soil texture, moisture and bulk density [48]. The constant b' is also called as decay constant for the infiltration rate. The cumulative infiltration at different times was computed from the original data and fitted to the derivative (dI/dt) as shown in Equation (5). The parameters a and b were calculated by plotting cumulative infiltration with respect to time after taking log on both sides of Equation (4) The plot of log I versus log t provided a straight line whose slope and intercept gives value for b and a. Similarly, the parameters a' and b' were also obtained by plotting infiltration rate with respect to time.
Crop yields were obtained separately from each plot at harvest and analyzed for N, P and K uptake. Total N concentration in both grain and straw samples were analyzed using distillation and subsequent titration with standard acid [49]. Available P and K was determined by method of Vandomolybedo phosphoric yellow color and flame photometer respectively [49]. The nutrient uptake by crop was computed by multiplying concentration of the specific element with their respective yield. For maize and wheat, total nutrient uptake was calculated as the sum of nutrients harvested in both grains and straw.
All the collected data were analyzed using analysis of variance (ANOVA) with statistical software SAS v9.3. The means were separated with least significant difference (LSD) with p < 0.05. A linear regression analysis was done to obtain the relationship of crop yields, aggregate MWD and infiltration rates with respect to SOC.

3. Results and Discussion

3.1. Soil pH, Bulk Density, Electrical Conductivity and Cation Exchange Capacity

The soil pH ranged from 7.25 to 7.90 among different fertilizer treatments after 36 years of fertilizer and FYM application (Table 1). Soil pH decreased from 8.20 to 7.25 in 36 years. The highest pH was in the non-treated control plots. The soil pH decreased with application of different fertilizers compared to non-treated control. Decline in pH might have resulted from build-up of organic matter with time in fertilizer plots [49]. The pH was significantly reduced to 7.25 with 150% NPK application compared to 50% NPK treatment. No significant decrease in pH was observed with increase in fertilizer rate from 50% NPK to 100% NPK. Addition of FYM showed no significant changes in pH compared to other fertilizer treatments except non-treated control. Decline in soil pH can have positive impacts on availability of nutrients such as phosphorus, zinc, iron and manganese [49]. The availability of phosphorus is more in the pH range from 6.5 to 7.5. Use of urea fertilizer and build-up of organic matter might have resulted in decrease in pH [49]. No significant differences were found among fertilizers treatments for EC and BD after long-term application of fertilizers and FYM for 36 years (Table 1). In contrast, significant decrease in bulk density was reported in maize–wheat rotation in China after 13 years of application of NPK+ manure compared to non-treated control and NPK treatment [31]. The FYM application did not help in decreasing soil bulk density in rice–wheat and maize–wheat system after 32 years of application compared to non-treated control and NPK fertilizer application on sandy loam soil in Northern India [42]. The EC values in all treatments were less than 0.8 dS m−1, which is considered safe for growth of all crops. Hati et al., (2006) reported increase in soil EC with 100% NPK + FYM compared to non-treated control and other fertilizer treatments over a period of 28 years in soybean-wheat-maize rotation. Annual additions of barnyard manure for 100 years in continuous wheat, corn and timothy cropping systems resulted in decline in BD on average, by 0.12 g cm−3 compared to unfertilized plots due to increased SOM and soil structure [50]. The CEC significantly varied among different fertilizer treatments. The lowest CEC was found in the non-treated control and 100% N. Applications of fertilizers increased the CEC of soil compared to non-treated control except for 100% N, 50% NPK, 100% NPK + W, 100% NPK and 100% N treatments. The highest CEC was found in 150% NPK treatment, but it was not significantly different compared to CEC of 100% NPK (-S) treatment. The CEC of 150% NPK treatment was 14% higher compared to 100% NPK + FYM. The higher CEC due to NPK fertilizer application compared to FYM might be due to more aromatic nature of organic matter produced under NPK fertilizer treatments compared to FYM [1].
Table 1. Physical and chemical characteristics of the soil among different fertilizer treatments in 2007.
Fertilizer TreatmentspH (1:2)EC (dS m−1)Bulk Density (Mg m−3)CEC (C molc kg−1)
50% NPK7.49b0.21a1.57a5.7bc
100% NPK + W7.39bc0.20a1.56a5.8bc
150% NPK7.25c0.20a1.56a6.7a
100% NPK7.39bc0.19a1.53a5.8bc
100% NPK + Zn7.38bc0.21a1.56a5.9bc
100% NP7.30bc0.18a1.53a5.8bc
100% N7.40bc0.20a1.54a5.2c
100% NPK + FYM7.37b0.20a1.49a5.9bc
100% NPK(-S)7.38b0.17a1.55a6.4ab
Control7.90a0.20a1.59a5.2c
Same letter within each column indicate no significant differences among the treatments (P ≤ 0.05).

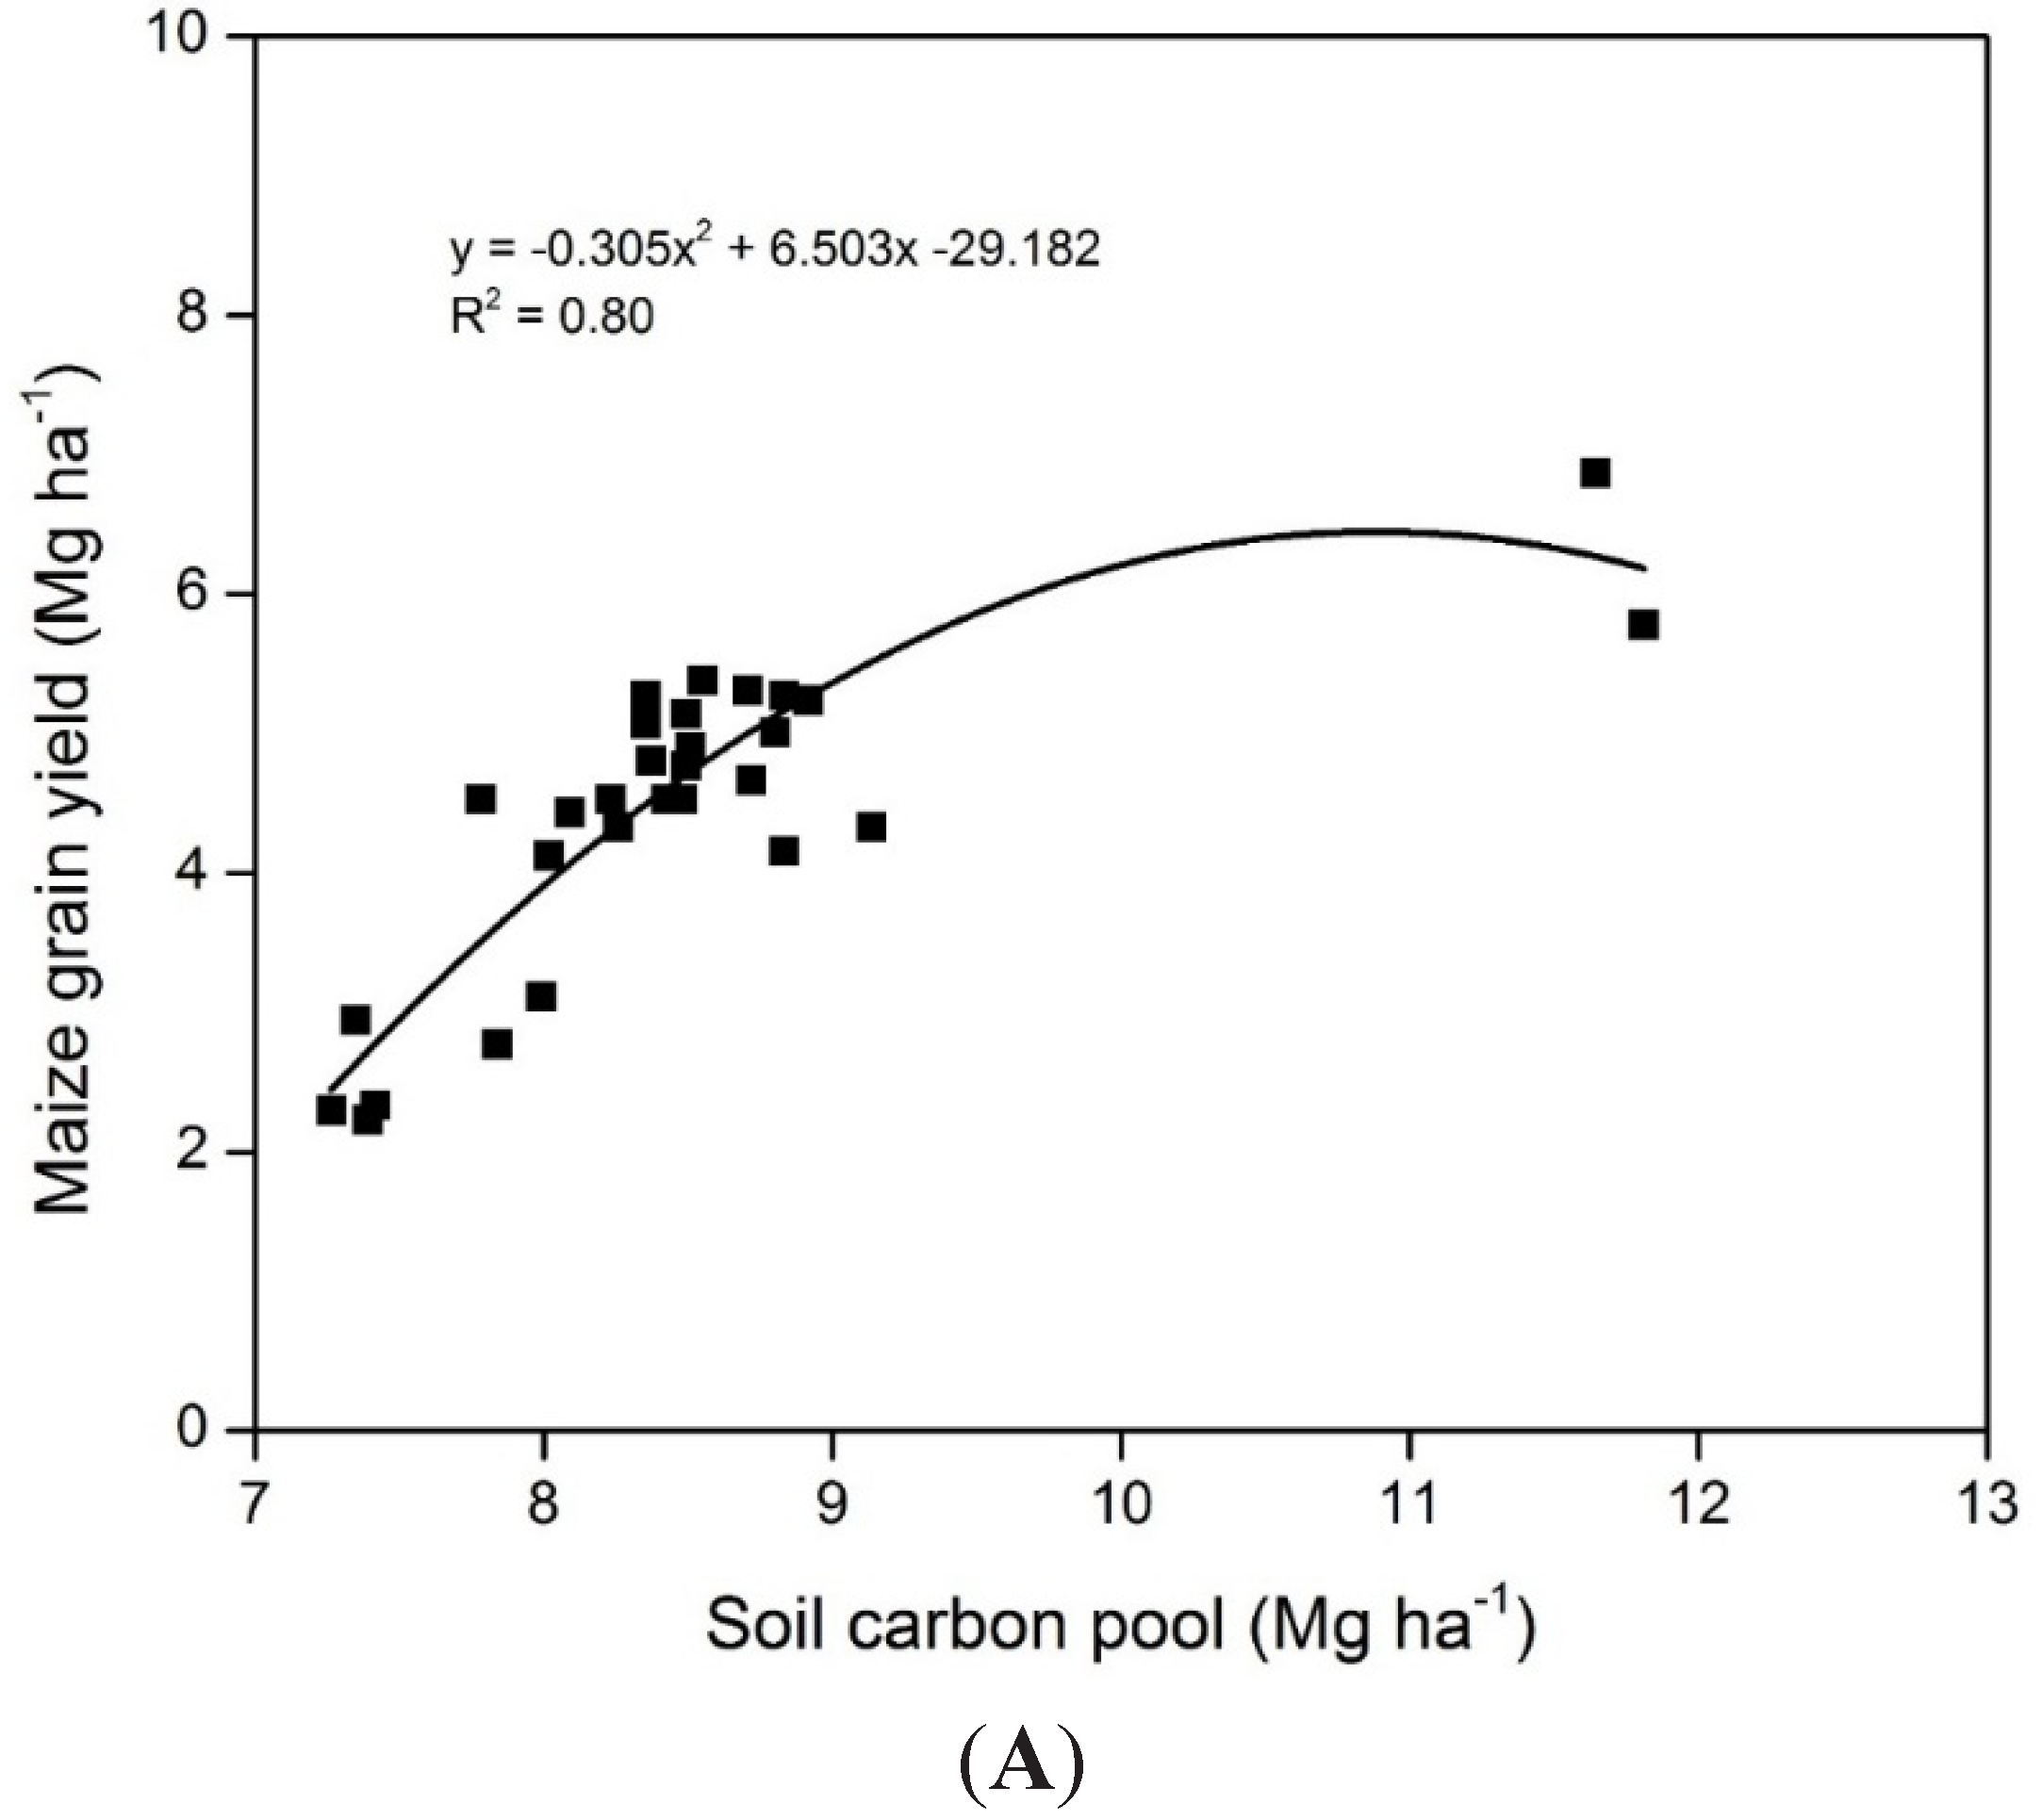
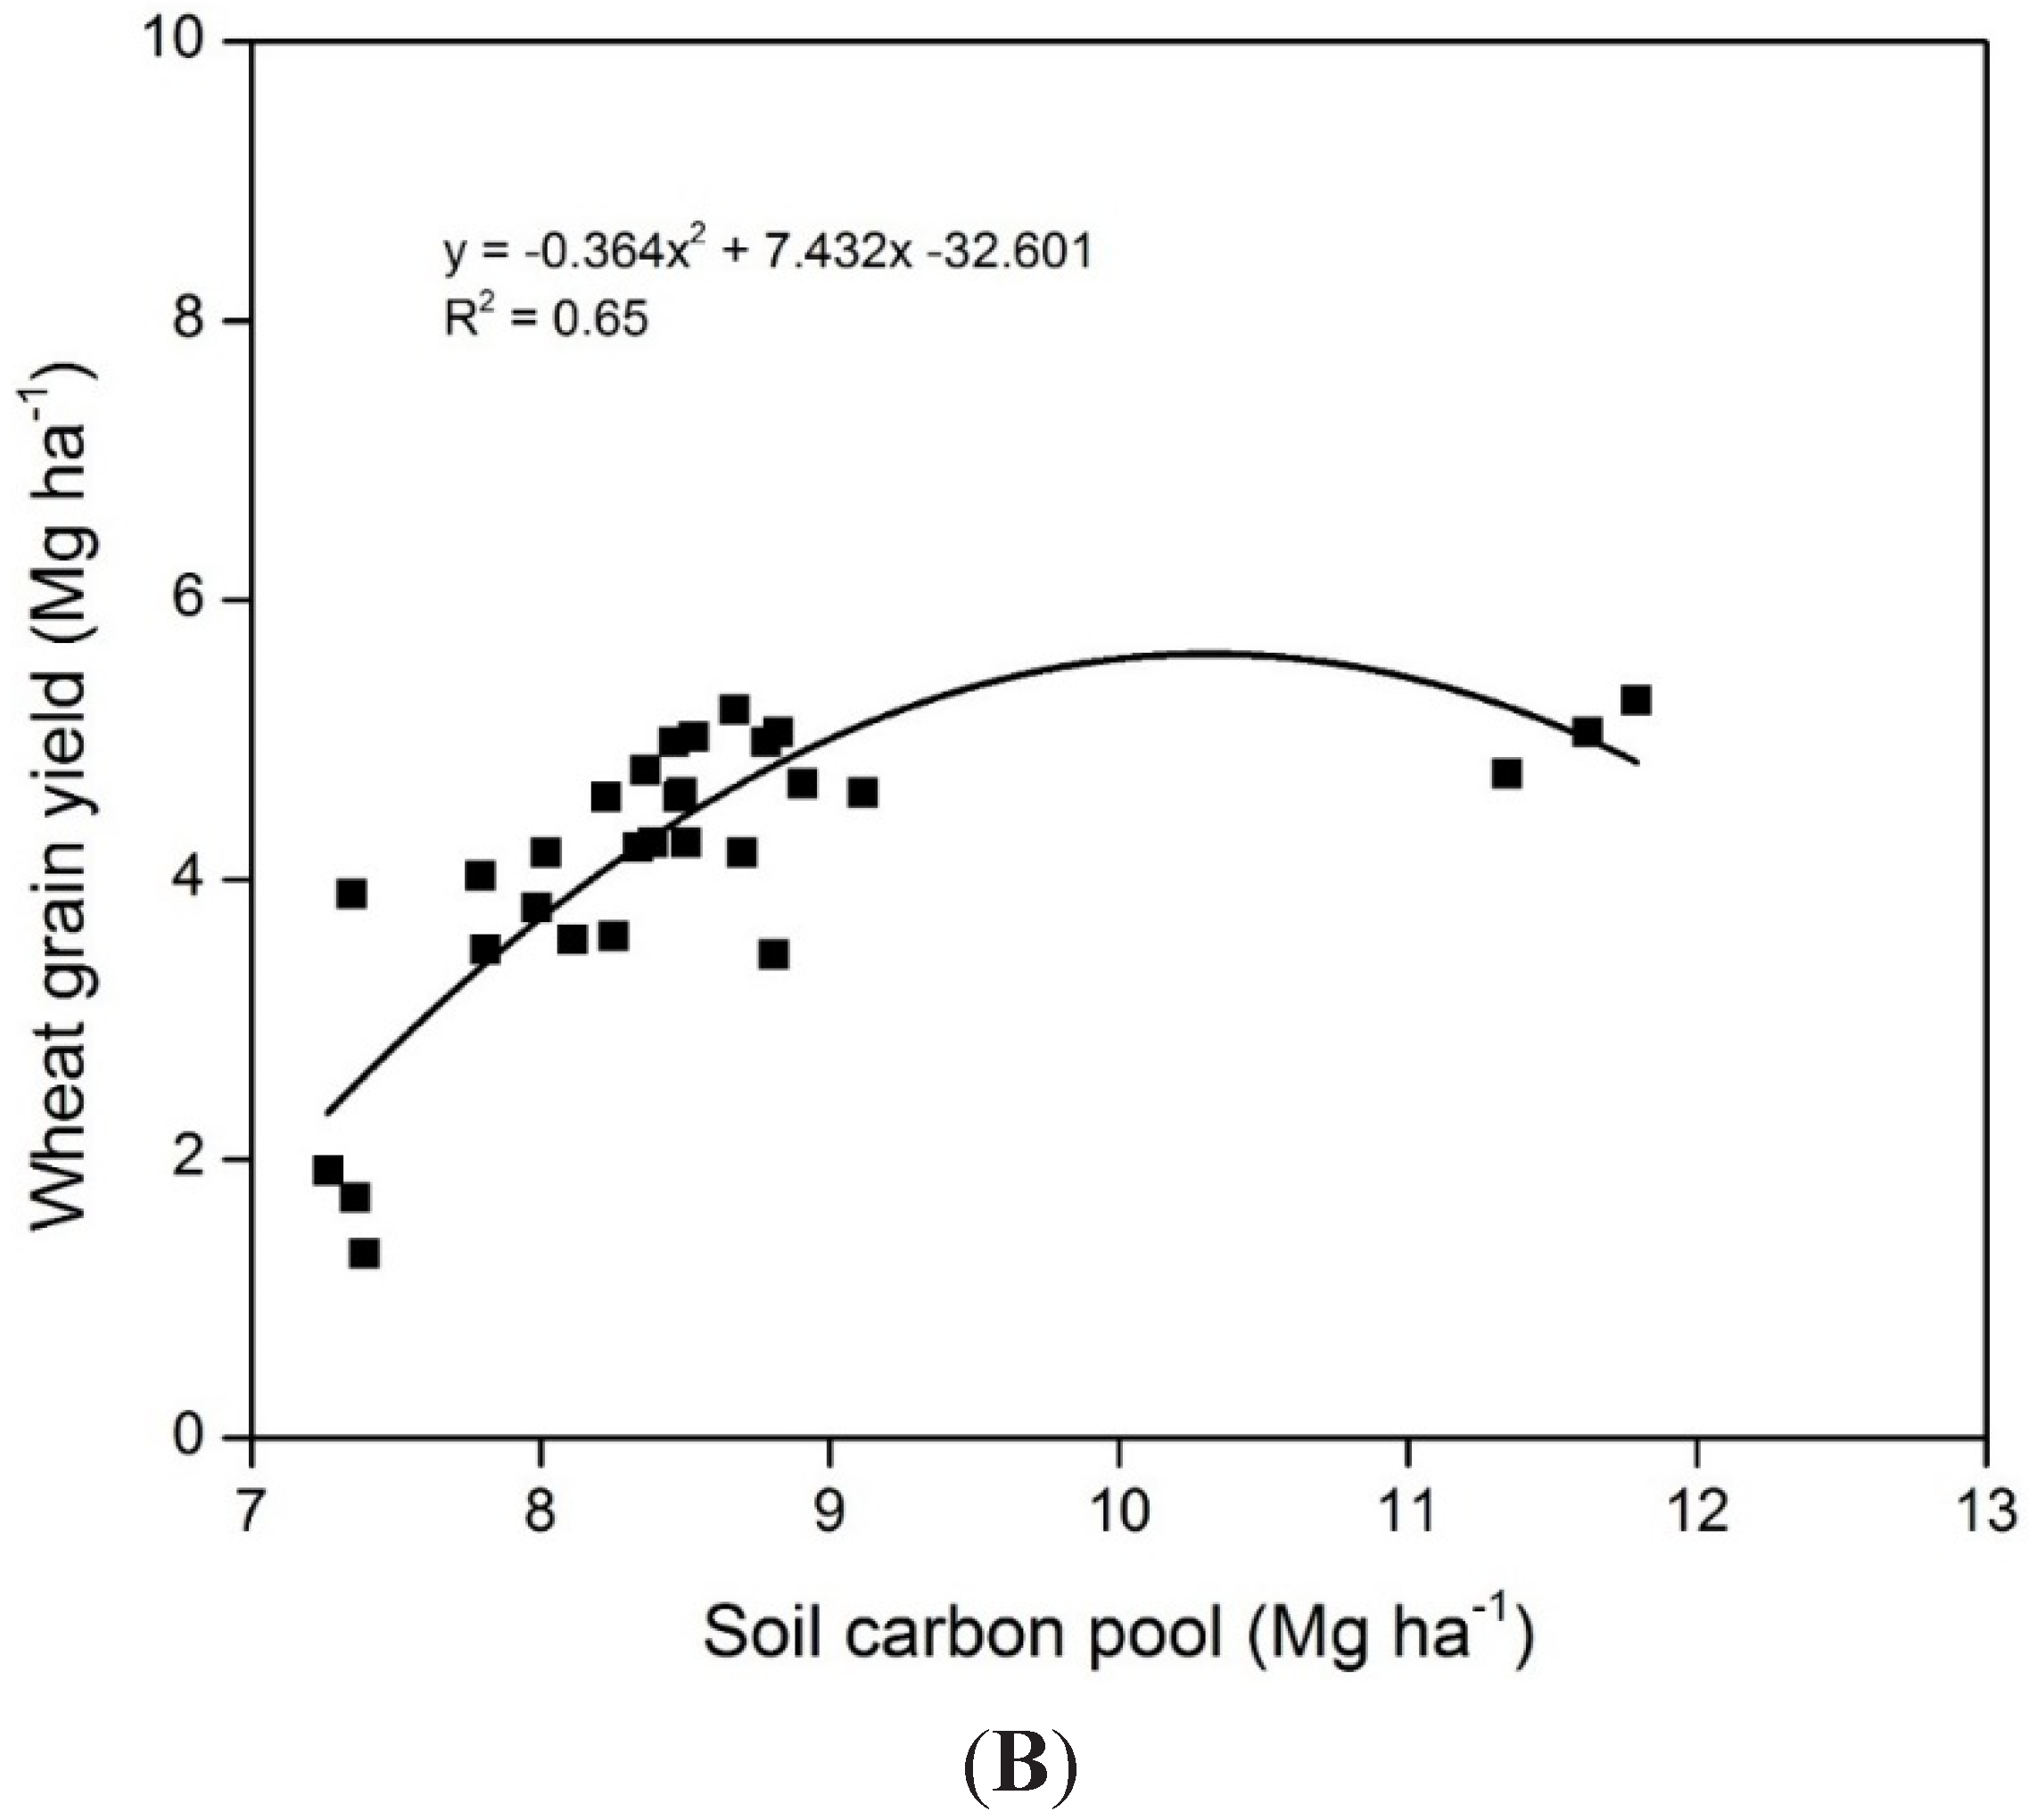
3.2. SOC and Carbon Sequestration

The SOC ranged from 1.75 g kg−1 to 2.55 g kg−1 for different fertilizer treatments at the beginning of the experiment in 1971 (Table 2). All the plots were low in soil fertility as the organic carbon was less than 4 g kg−1. All treatments had no significant differences in SOC in 1971. The SOC increased with continuous application of FYM and inorganic fertilizers for 36 years among all treatments. The SOC ranged from 3.08 g kg−1 to 5.20 g kg−1 in the 0–15 cm layer for different treatments in 2007. The soil fertility in 100% NPK + FYM was in medium range as SOC ranged between 4 and 7.5 g kg−1 whereas all other fertilizer treatments were still in low SOC range. The SOC increased to 3.34 g kg−1 with application of 100% N, 3.52 g kg−1 with 100% NP, 3.71 g kg−1 with 100% NPK and 5.20 g kg−1 with 100%NPK+FYM compared to the non-treated control (3.08 g kg−1). The 100% NPK + FYM treatment had 69% significantly higher SOC compared to non-treated control after 36 years of fertilization application in 2007. Similar results were reported for rice–wheat and maize–wheat system in Punjab, India by many other researchers [29,40]. The increase in SOC after 36 years was maximum (1.6 times) for 100% NPK + FYM and lowest for the non-treated control. Similar results were reported by Hati et al. [2] for 28 years of soybean–wheat–maize rotation on Vertisols in sub-humid sub-tropical India. No significant difference was found for increase in SOC between 50% NPK and non-treated control after 36 years of fertilizer applications. The increase in SOC in 36 years among fertilizer treatments was due to addition of carbon source through FYM, root biomass and crop residues [35]. It takes about 30 to 40 years for some cropping systems to develop an equilibrium level of SOC [51].
Table 2. Changes in soil organic carbon (SOC), SOC pool and carbon sequestration rate after 36 years of different fertilizer applications in maize–wheat rotation.
Fertilizer TreatmentsSOC (g kg−1)SOC pool (Mg ha−1)SOC sequestration rate (kg ha−1yr−1)
19712007Change19712007Change
50% NPK2.38a3.57ab1.19bc5.70ab8.40bc2.70de75d
100% NPK + W2.26a3.65ab1.39b5.40b8.50bc3.10bc86cd
150% NPK2.03a3.74ab1.71b4.90c8.70b3.80bc106bc
100% NPK2.08a3.71ab1.63b5.00c8.70b3.70bc103bc
100% NPK + Zn2.23a3.69ab1.46b5.30b8.60bc3.30bc92b
100% NP1.75a3.52ab1.77b4.20d8.10c3.90b108b
100% N1.76a3.34ab1.58b4.20d7.70cd3.50bc97b
100%NPK + FYM2.03a5.20a3.17a4.90c11.60a6.70a186a
100% NPK (-S)2.33a3.71ab1.38b5.60ab8.60bc3.00cd83d
Control2.55a3.08b0.53c6.10a7.30d1.20e33e
Same letter within each column indicate no significant differences among the treatments (P ≤ 0.05).
The SOC pools ranged from 4.20 Mg ha−1 to 6.10 Mg ha−1 for different treatments at the start of the experiment in 1971; with no significant differences between 100% NPK, 150% NPK and 100% NPK + FYM treatments (Table 3). After 36 years of continuous application of fertilizers, the SOC pool ranged from 7.30 Mg ha−1 to 11.60 Mg ha−1 in the 0–15 cm layer for different treatments in 2007. The SOC pool in 100% N treatment was not significantly different from non-treated control. All other fertilizer treatments showed significantly higher SOC pool compared to non-treated control in 2007. The highest increase in SOC pool was observed with 100% NPK + FYM and lowest in non-treated control. Benbi and Senapati [52] reported that FYM along with NPK fertilization resulted in 0.44 Mg ha−1 change in SOC over a period of seven years in rice–wheat system. No significant differences were found among 100% NPK + W, 150% NPK, 100% NPK, 100%NPK + Zn, 100% NP and 100% N for increase in SOC pool after 36 years of continues cropping of maize-wheat. Application of both inorganic and organic fertilizers resulted in higher carbon sequestration compared to non-treated control (Table 2). Addition of more root biomass carbon to soil with time due to improved physico-chemical properties and biological environment suitable for crop growth resulted in higher carbon sequestration rates. The carbon sequestration rate (Kg C ha−1 year−1) for the entire 36 years period was highest for 100% NPK + FYM and lowest for the non-treated control. The rate of increase was calculated with reference to the baseline SOC pool at the start of the experiment. Greater amounts of organic inputs in 100% NPK + FYM resulted in higher carbon sequestration. Many studies have shown that materials with higher lignin content such as FYM result in more carbon sequestration compared to materials with low lignin content [53]. Organic manures contains most of carbon in recalcitrant forms resulting in more carbon sequestration as it had already gone under some decomposition before application in agricultural fields [52]. No significant difference for carbon sequestration between treatments 100% NPK, 150% NPK, 100% NPK + W, 100% NPK + Zn, 100% N and 100% NP. Increase in fertilizer rate from 50% NPK to 100% NPK resulted in 37% higher carbon sequestration.
Table 3. Effect of long-term use of organic and inorganic fertilizers on initial and steady state infiltration rate, aggregate mean weight diameter and Kostiakov infiltration model constants.
Fertilizer TreatmentsAggregate MWD (mm)Infiltration rate (cm min−1)Kostiakov infiltration model constants
InitialSteady StateabR2a'b'R2
50% NPK0.39cd0.75c0.13c0.1150.6330.99**0.073−0.3670.98**
100% NPK + W0.41c0.67d0.13c0.0850.6100.99**0.052−0.3900.98**
150% NPK0.41c0.76bc0.10d0.1030.5950.99**0.061−0.4050.98**
100% NPK0.41c0.91a0.16ab0.1260.6520.99**0.082−0.3480.98**
100% NPK + Zn0.43bc0.81b0.12cd0.1770.5770.99**0.102−0.4230.98**
100% NP0.38d0.78bc0.15abc0.0500.6860.99**0.034−0.3140.98**
100% N0.34e0.68d0.14bc0.0060.6690.99**0.004−0.3310.97**
100%NPK + FYM0.52a0.92a0.17a0.1370.6530.99**0.089−0.3470.98**
100% NPK(-S)0.44b0.75c0.17a0.0560.6720.99**0.038−0.3280.98**
Control0.31f0.68d0.12cd0.0640.6440.99**0.041−0.3560.98**
Same letter within each column indicate no significant differences among the treatments (P ≤ 0.05); ** Significant at 5% level.

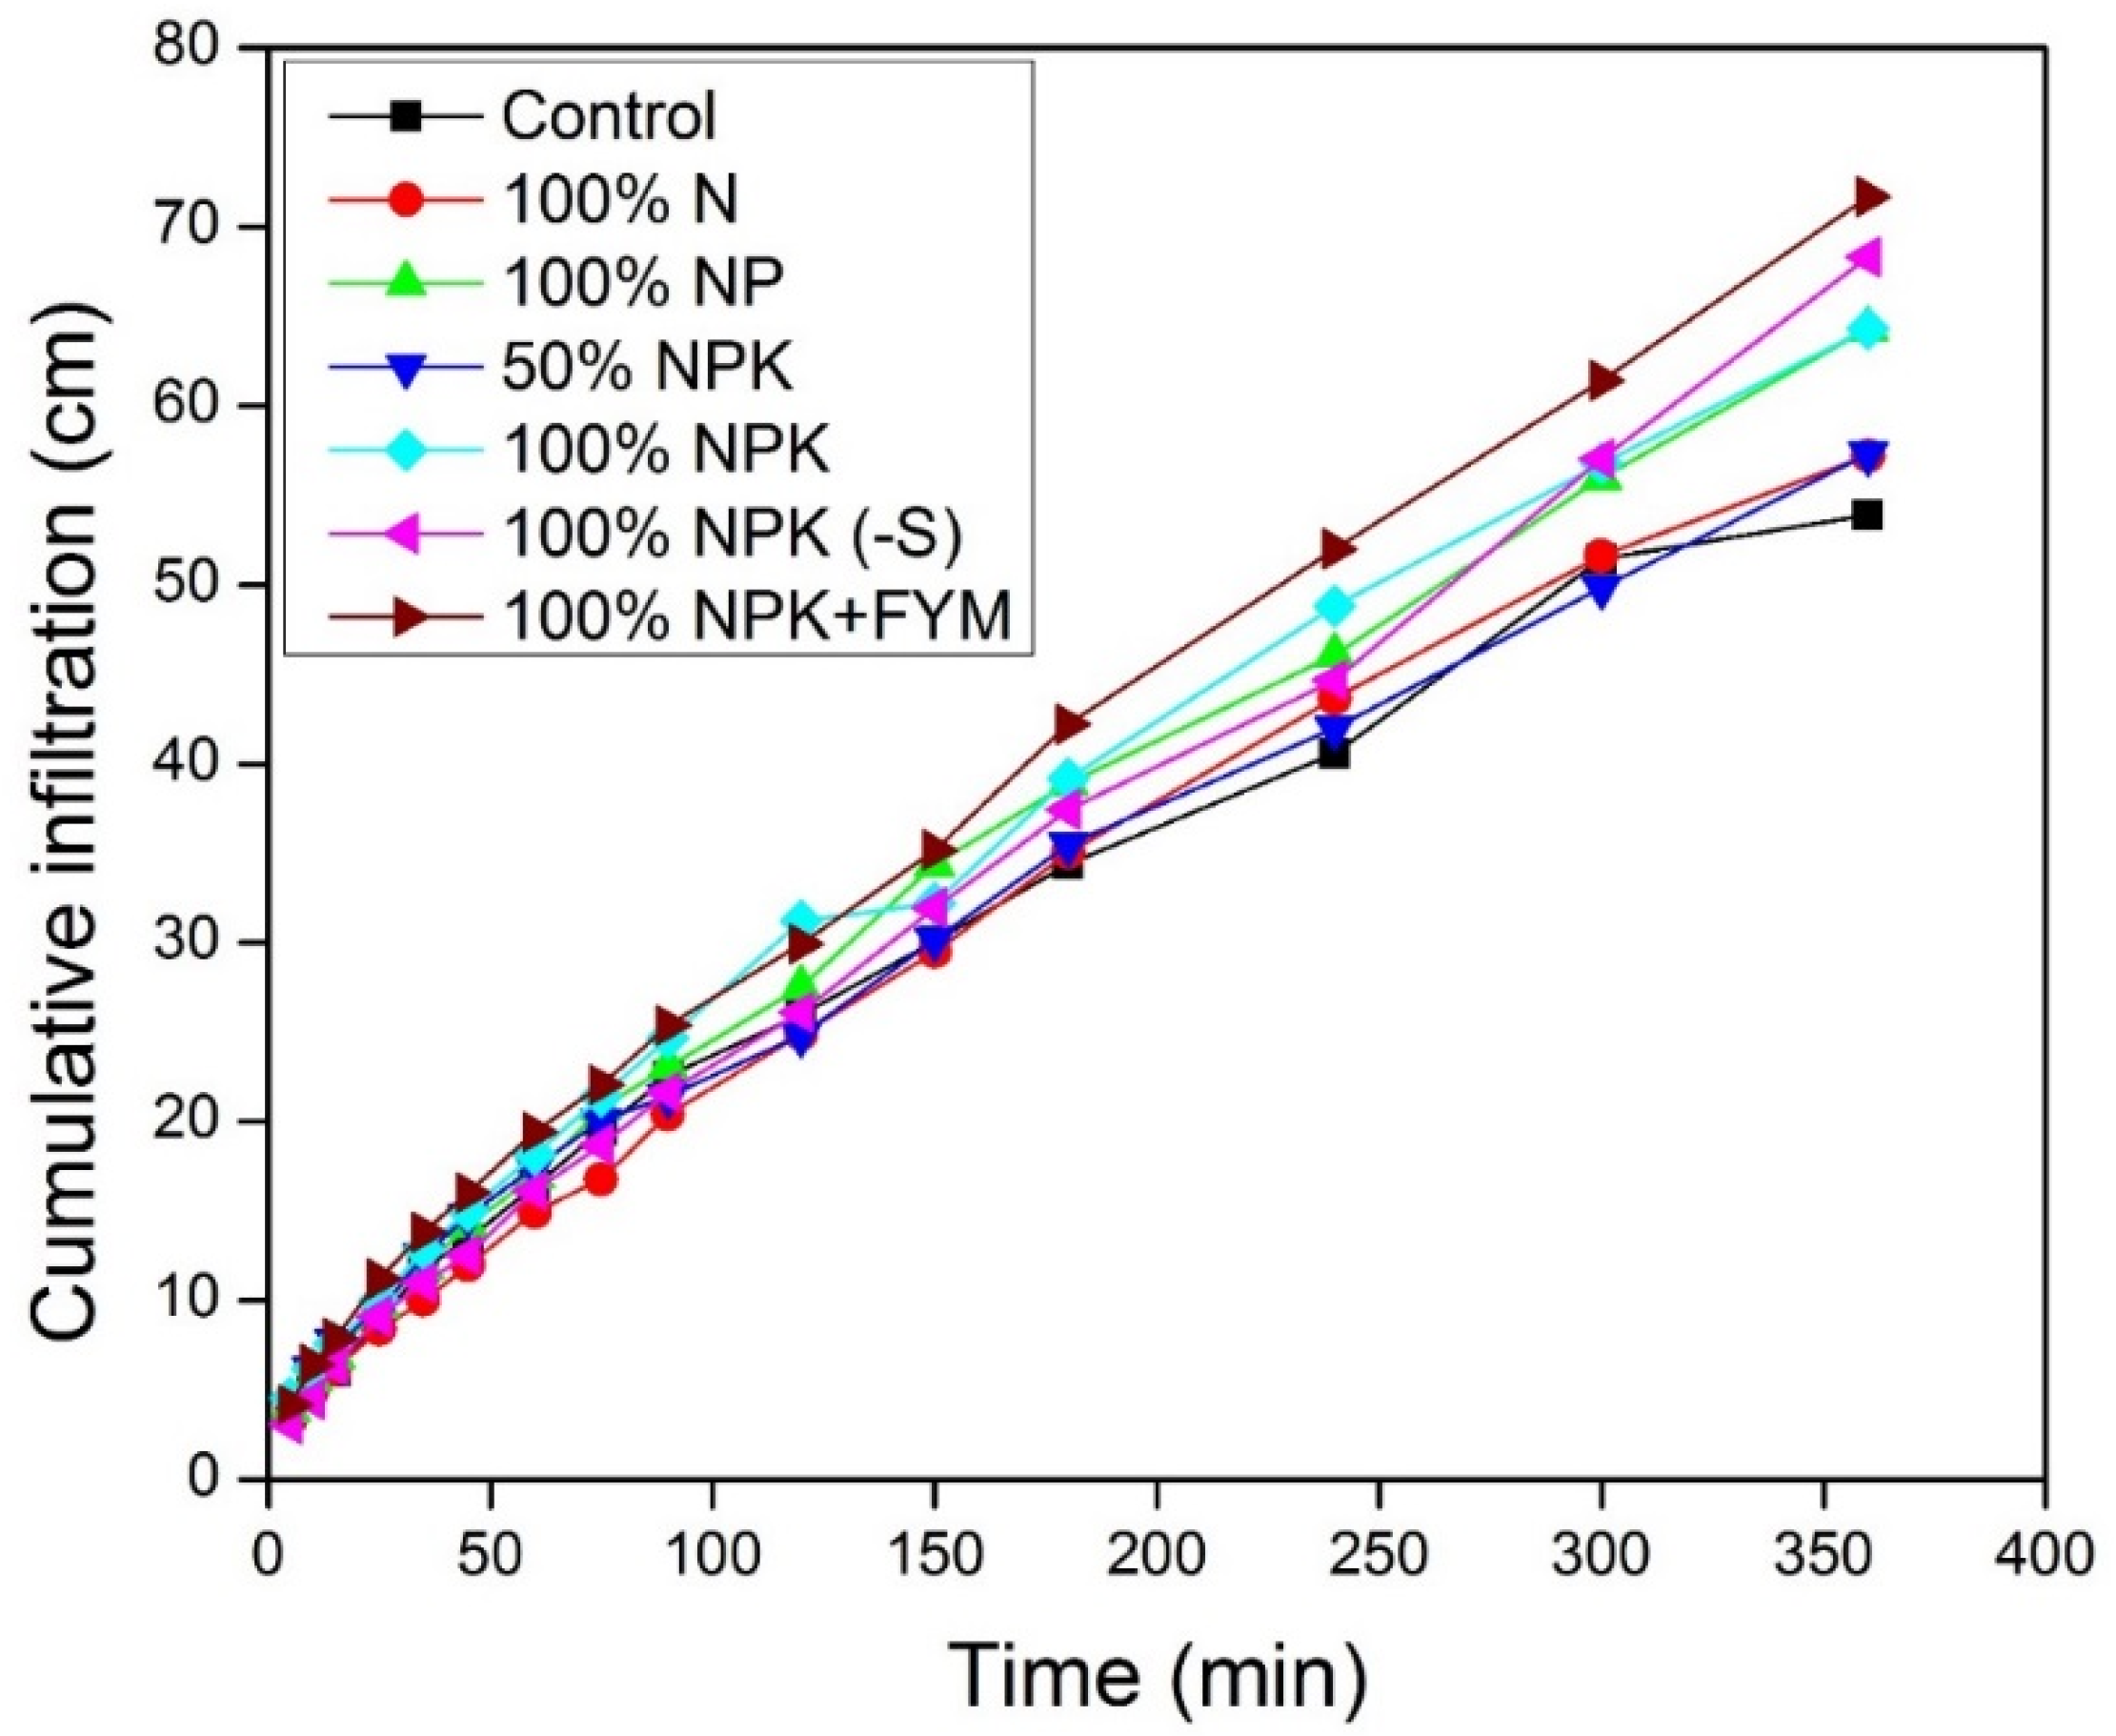
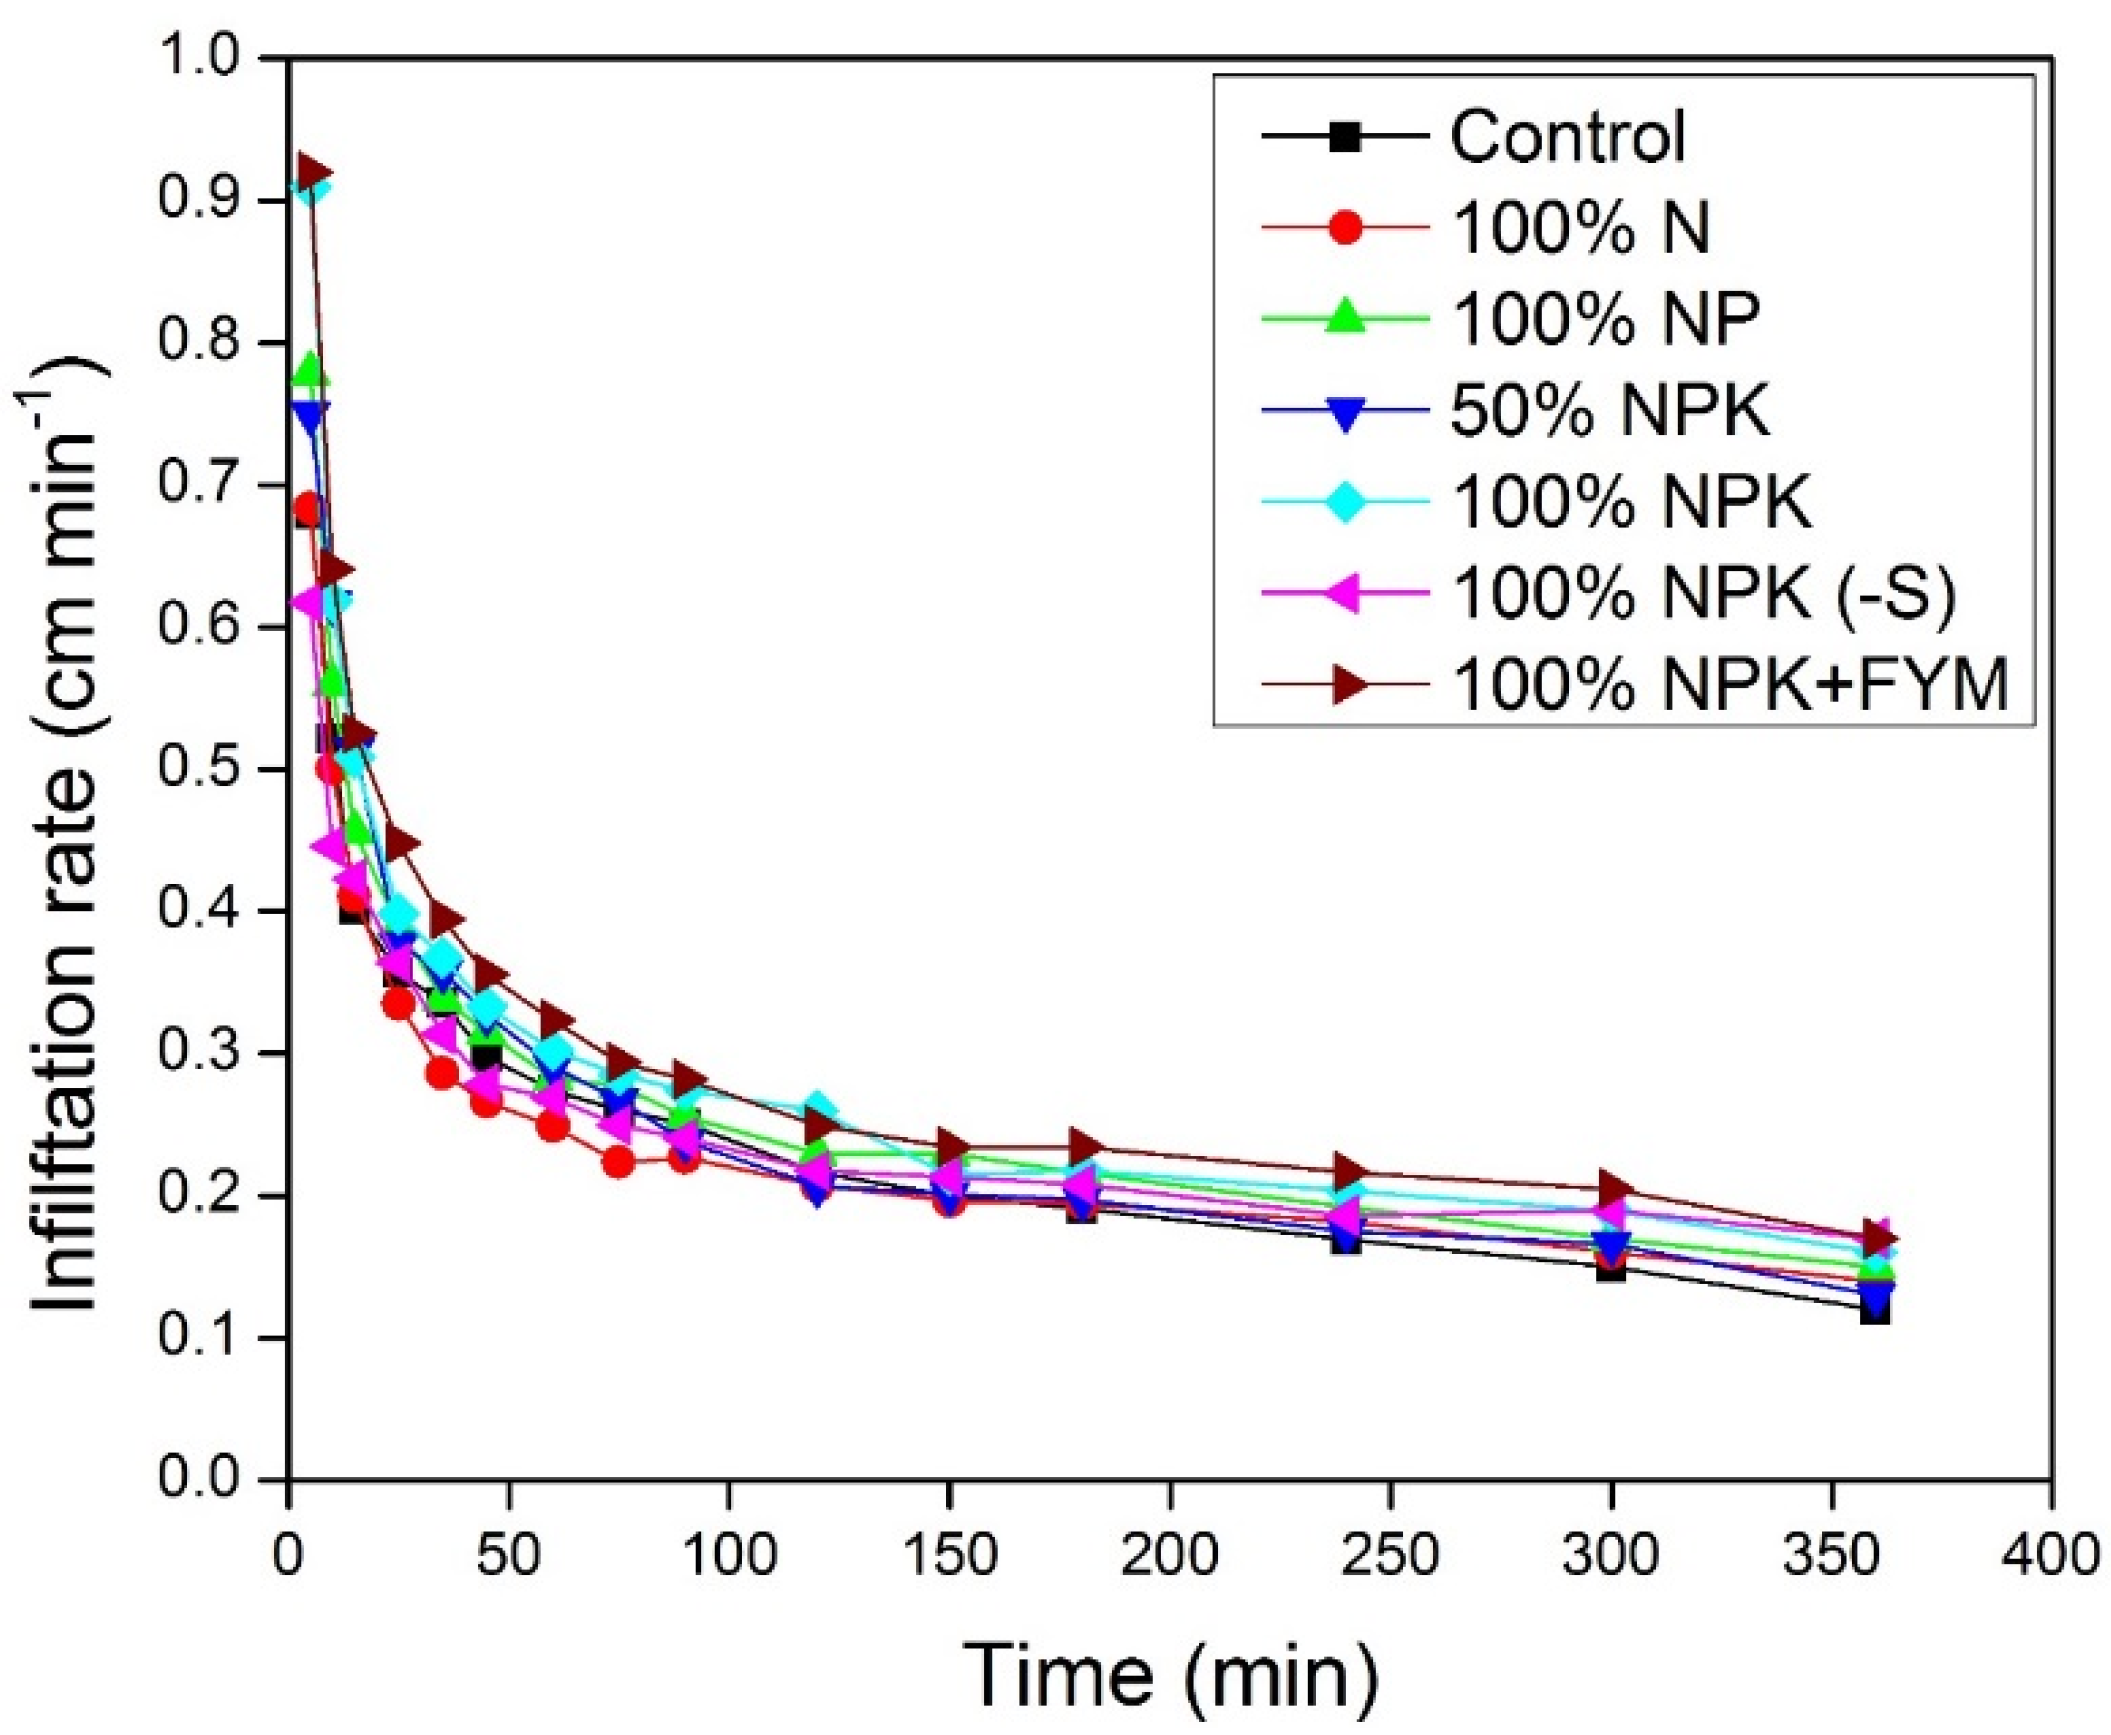
3.3. Cumulative Infiltration and Infiltration Rate

Cumulative infiltration (I) after 360 min was 53.9, 57.2, 57.3, 64.3, 64.3, 68.3 and 71.7 cm in non-treated control, 100% N, 50% NPK, 100% NP, 100% NPK, 100% NPK (-S) and 100% NPK+FYM treatments, respectively (Figure 1). The infiltration rate was highest in 100% NPK + FYM treatment and lowest in non-treated control. Cumulative infiltration was 23.5% higher in 100% NPK treatments compared to the unfertilized control. Addition of FYM along with 100% NPK increased cumulative infiltration by 9.5% compared to only 100% NPK application. Addition of P increased I by 13% compared to 100% N. No significant increase was observed with addition of K along with NP (100% NPK). The value of I increased by 16.1% when application of NPK was increased from 50% to 100% of the recommended rate. The highest I was observed in 100% NPK + FYM treatment where more stable aggregation and higher SOM concentrations were measured. The infiltration rate was higher when source of P was single superphosphate than diammonium phosphate (4.0%).
Figure 1. Cumulative infiltration against time under different fertilizer treatments. The differences in cumulative infiltration means at 360 min were statistically significant at P ≤ 0.05.
Agronomy 05 00220 g001
The infiltration rate varied with time among different fertilizer treatments (Figure 2). All fertilizer treatments has significantly higher initial infiltration rate compared to non-treated control, except 100% N and 100% NPK + W (Table 2). At 5 min, the initial infiltration rate was 35, 33 and 19% higher in 100% NPK + FYM, 100% NPK, 100% NPK + Zn respectively compared to non-treated control (Table 3). The infiltration rate slows down and equilibrates after some time. The steady state infiltration rate (ic) was highest in 100% NPK + FYM and 100% NPK (-S), which was not significantly different from treatment 100% NP and 100% NPK (Table 2). No significant differences were found for ic among non-treated control, 50% NPK, 100% NPK + W, 100% NPK + Zn and 150% NPK. The SOC was significantly and positively correlated with infiltration rate (R2 = 0.66) (Figure 3).
Figure 2. Change in infiltration rate with time among different fertilizer treatments. Means for infiltration rates were statistically significant at P ≤ 0.05.
Agronomy 05 00220 g002
Both I and ic were highest in 100% NPK + FYM followed by 100% NPK, 100% NP, 100% N and control treatments. The increase in infiltration rate may be due to increase in micropores and macropores in the soil resulting from better aggregation by cementing of soil particles together due to higher SOM and favorable living conditions for soil organisms. Application of N fertilizers also increased SOC which was positively correlated with infiltration rate (R2 = 0.66) (Figure 3). Higher SOC in fertilizer treatments resulted in higher infiltration rate. Bhattacharyya et al. [26] reported significant improvements in cumulative infiltration and infiltration rate with application of N fertilizer compared to non-treated control plots. Application of fertilizers alone or in conjunction with organic manures increased SOC concentration and improved soil physical properties [24,26,29].
Figure 3. Relationship between soil organic carbon and infiltration rate.
Agronomy 05 00220 g003
Application of P also improved the infiltration rate. Application of phosphatic fertilizers and phosphoric acid also favor aggregation by the formation of aluminum or calcium phosphates as binding agents. Laboratory studies [54] have shown that addition of P causes flocculation of soil colloids and increases water holding capacity. Increase in infiltration rate in 100% NPK + FYM treatment may be due to increase in SOC concentration, rooting density and the attendant improvement in aggregation and soil structure resulting in higher porosity and pore continuity. Laddha and Totawat [55] reported that use of FYM and phosphate fertilization significantly improved ic and hydraulic conductivity. The distribution of different-sized pores and the continuity and stability of soil aggregates affect the value of infiltration rate. Bronick and Lal [14] reported that the precipitation of hydroxides, phosphate and carbonates enhances aggregation. Haris and Megharaj [56] observed accelerated water flow through macro-pores and bio-channels which improved the infiltration rate in manure-treated plots. Bhattacharyya et al. [26] observed that the response of SOC concentration to FYM application depends upon application of inorganic fertilizers. Bhattacharyya et al. [26] reported that infiltration rate under NPK + FYM (1.98 cm h−1) was higher than that in unfertilized (0.72 cm h−1) and NPK (1.2 cm h−1) treatment.

3.4. Kostiakov (1932) Model Constants

The data for constants a, b, a' and b' of Kostiakov infiltration model (Equations 4 and 5) is presented in Table 3. The model fitted the data very well for all the treatments with R2 equal to 0.99 and 0.98 for cumulative infiltration and infiltration rate regression equations respectively. For 100% NPK + FYM and 100% NPK treatment, coefficient “a” and exponent b was significantly higher than in the non-treated control. Increase in parameters a and b were indications of possible increase in soil structural properties through improvements in soil fertility. The decay constant (b') for infiltration rate was negative for all the treatments showing that infiltration rate decreases with time as soil becomes saturated with water with time and not absorbing water anymore. Uloma et al., (2014) also reported negative decay constants for infiltration rate as soils were saturated due to rains at the time of experiment [48].

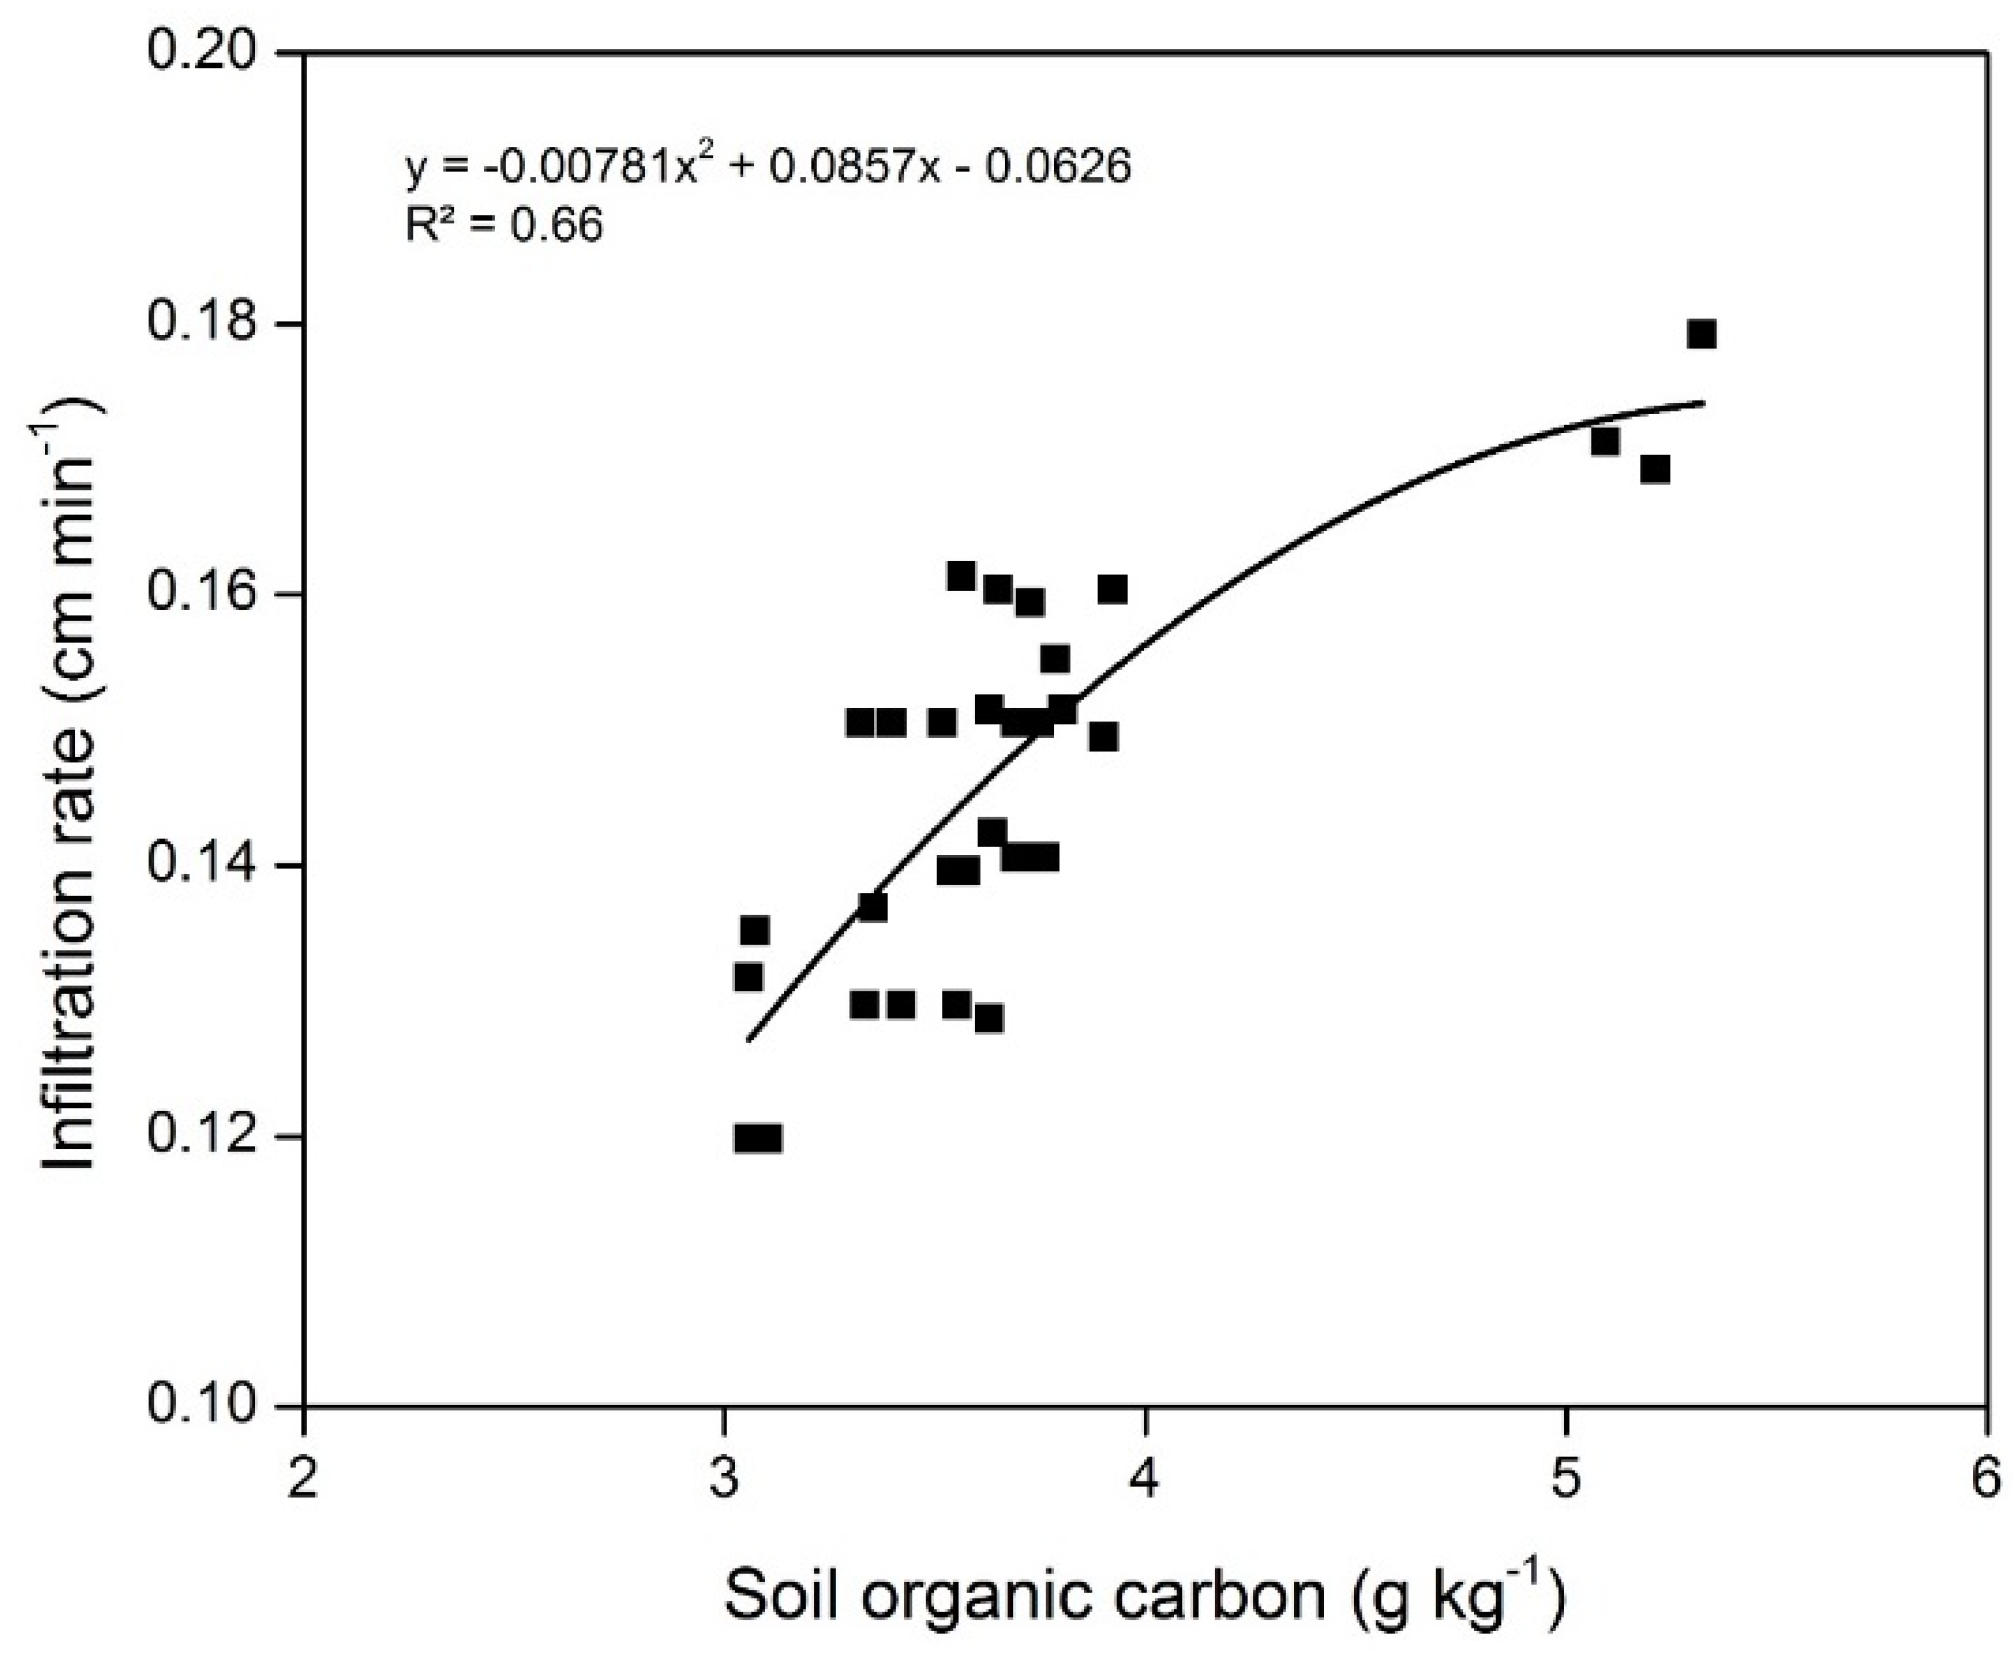
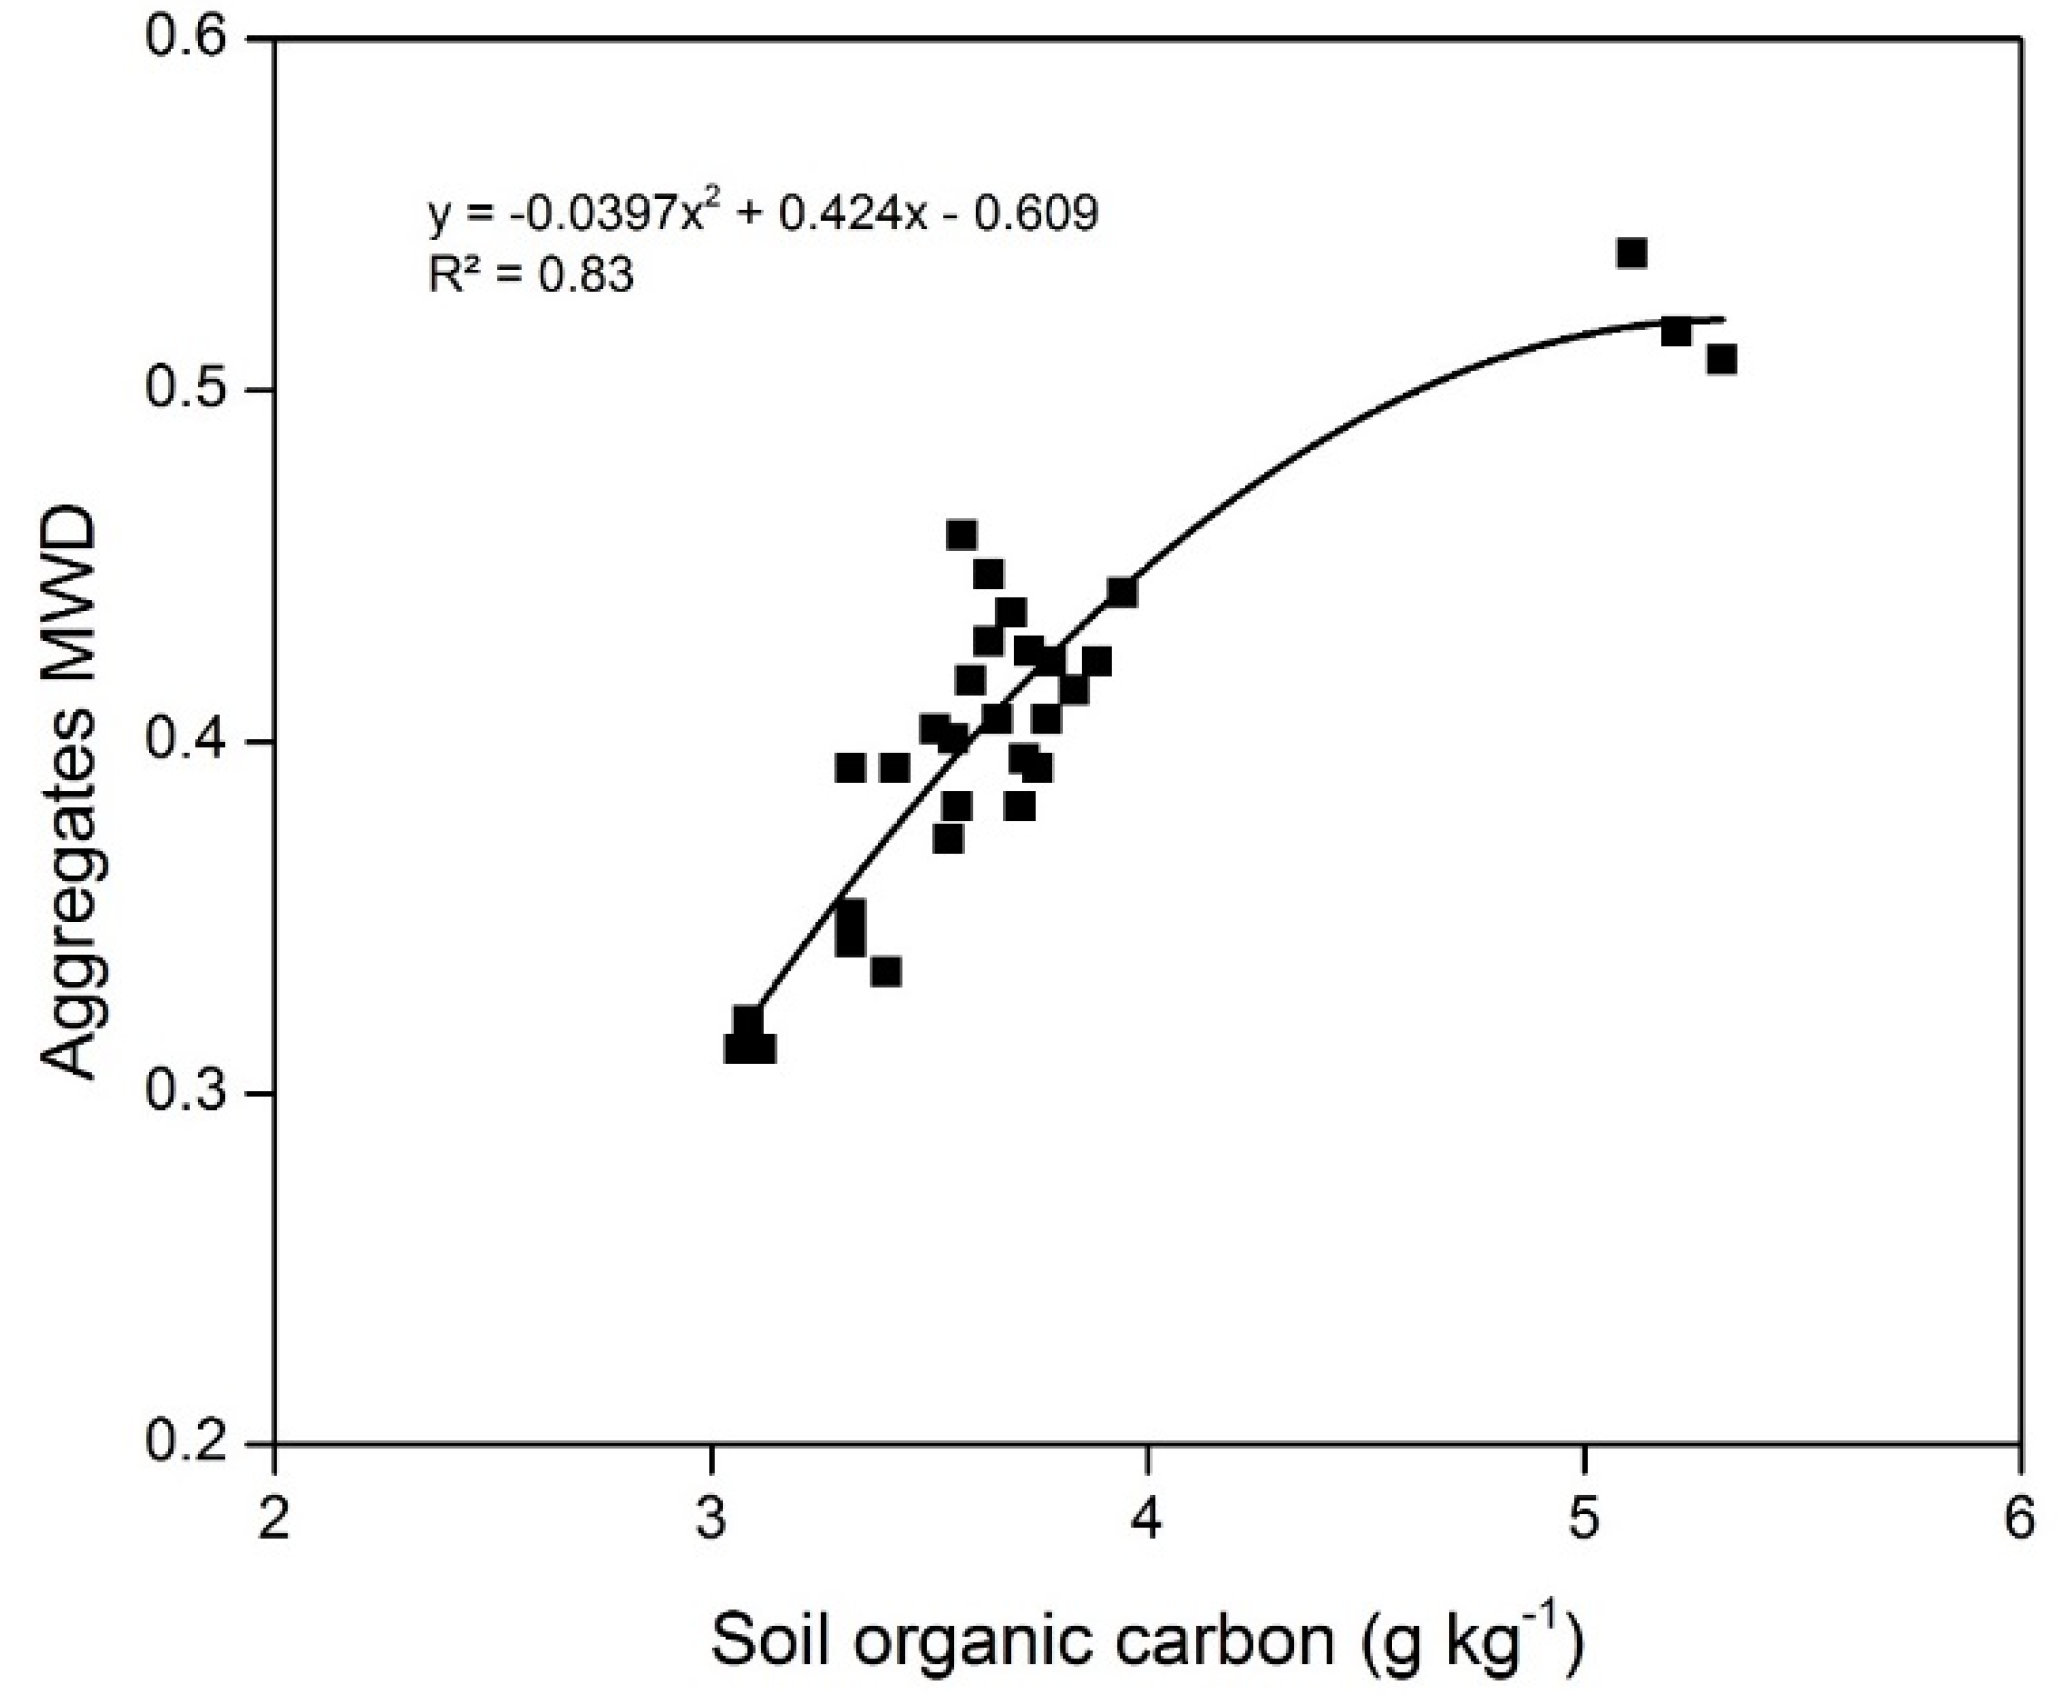
3.5. Aggregate Mean Weight Diameter

The aggregate MWD was significantly increased due to different fertilizer applications compared to non-treated control (Table 3). The addition of FYM and Zn as well as use of DAP instead of SSP as P source with 100% NPK significantly increased aggregate MWD compared to 100% NPK. Aggregate MWD increased significantly with increase in fertilizer application rate from 50% to 100% NPK, but no change in MDW from further addition of fertilizer to 150% NPK. Aggregates MWD was increased significantly with increase in SOC (R2 = 0.83) (Figure 4). Increase in aggregate MWD with the application of nitrogenous fertilizers has been reported by Subbian, et al. [57] and Roberson, et al. [58]. Positive correlation of aggregate MWD and SOC concentration have been widely reported [2,59,60]. The average MWD was highest in FYM + NPK treatment followed by 100% NPK (-S) and lowest MWD was in non-treated control plots. Similar results were obtained by Rasool et al. [29] in rice–wheat system as well as in maize–wheat system. The FYM and inorganic fertilizer applications might have resulted in higher SOM due to increased root biomass and acted as a binding agent which improved the aggregate MWD [1,52].
Figure 4. Relationship between soil organic carbon and aggregate MWD.
Agronomy 05 00220 g004

3.6. Crop Yields and Nutrient Uptake

Grain and straw yields of maize and wheat were significantly affected by the fertilizer treatments (Table 4 and Table 5). Maize grain yield increased significantly with fertilizer application from 50% NPK to 100% NPK, but any further increase in fertilizer amount to 150% NPK showed no significant effects on yield. Highest maize grain yield was in treatment having 100% NPK + FYM and lowest was in non-treated control showing beneficial effects of manure on crop performance. Grain yield of maize was 182 and 27% higher in 100% NPK + FYM compared to the non-treated control and 100% NPK treatment respectively (Table 4). The higher application rate of NPK (150% NPK) did not result in significantly higher grain yield of maize, but caused significantly higher straw yield compared to 100% NPK. The highest maize straw yield was produced with treatments having FYM in addition to 100%NPK and with 150% NPK, which was not significantly different from yield produced under treatments 100% NPK + Zn and 100% NPK (-S). The nutrient uptake for N, P and K was significantly higher in all fertilizer treatments compared to non-treated control (Table 4). The N and P uptake increased significantly from 50% NPK to 150% NPK application, but not K uptake. The N and P uptake was highest in 100% NPK + FYM treatment, but K uptake was higher in 150% NPK which was not significantly different from K uptake in 100% NPK + FYM, 100% NPK, 100% NPK + W.
Table 4. Maize yield and nutrient uptake as affected by long-term use of organic and inorganic fertilizers in 2007.
Fertilizer TreatmentsMaize Yield (Mg ha-1)Nutrient Uptake ( kg ha-1)
GrainStrawNPK
50% NPK4.3e8.9d86.9c10.2f75.7cd
100% NPK + W5.0bc10.4c125.7b15.1d104.5ab
150% NPK5.2b13.5a169.0a20.9b122.0a
100% NPK5.1b11.8bc142.7b15.9d111.8a
100% NPK + Zn4.9bd12.4ab142.1b17.7c81.1bc
100% NP4.4de11.2bc122.8b13.2e68.1c
100% N2.9f8.2d99.2c10.2f53.6d
100% NPK + FYM6.5a13.5a186.5a23.5a119.3a
100% NPK(-S)4.5cde12.1ab135.0b16.9c84.9bc
Control2.3g5.6e49.3d5.8g28.7d
Same letter within each column indicate no significant differences among the treatments (P ≤ 0.05).
Table 5. Wheat yield and nutrient uptake as affected by long-term use of organic and inorganic fertilizers in 2007.
Fertilizer TreatmentsWheat Yield (Mg ha-1)Nutrient Uptake ( kg ha-1)
GrainStrawNPK
50% NPK3.53e5.34c83.8f9.4d53.9d
100% NPK + W4.56cd7.80ab117.0cd16.4ab79.6b
150% NPK5.08ab8.43a130.1b18.3a81.8ab
100% NPK4.69bc8.25a122.8bc16.3ab82.0a
100% NPK + Zn4.65c7.59ab120.5c17.3a81.3ab
100% NP4.17d7.60ab109.8d13.1c77.4b
100% N3.74e6.38b93.7e8.8d61.7c
100% NPK + FYM5.13a8.48a150.8a18.5a92.4a
100% NPK(-S)4.60c7.23b117.7cd14.0bc73.4b
Control1.63f2.61d40.1g4.6e25.9e
Same letter within each column indicate no significant differences among the treatments (P ≤ 0.05).
Grain and straw yield of wheat was highest with 100% NPK + FYM compared to the non-treated control (Table 5). Grain yield of wheat in 100% NPK + FYM treatment was not significantly different from 150% NPK. The treatment having 150% NPK did not show any significant increase in yield compared to 100% NPK application. Straw yield of wheat in 100%NPK + FYM was not significantly different to 150% NPK, 100% NP, 100% NPK + Zn, 100% NPK + W and 100% NPK. The maximum uptake of N, P and K was also found in the treatment having FYM plus 100% NPK. Increase in fertilizer amount from 100% NPK to 150% NPK did not showed any significant increase in N, P and K uptake. Application of P and K along with N (100% NPK) increased the nutrient uptake compared to 100% N.
Better crop yields of maize and wheat with balanced application of organic manure and inorganic fertilizers may be attributed to improvements in soil physical properties along with sufficient supply of nutrients from FYM and inorganic fertilizers. The improved SOC concentration continuously from the initial level of 2.03 g kg−1 to 5.20 g kg−1 with application of FYM over 36 years might have also responsible for higher yields in treatments receiving FYM. Increases in yield due to inorganic and organic fertilizers have been reported by many other researchers [29,35,40]. Application of manure and retention of crop residues increased soil moisture, SOC and improved yields of pearl millet (Pennisetum typhoides) by 0.1–0.2 Mg ha−1 in Rajasthan, India [61].
The SOC pool was significantly correlated with grain yields of maize (R2 = 0.80) and wheat (R2 = 0.65) (Figure 5A and B). Although, the value for correlation coefficient (R2) was higher for maize compared to wheat. Crop yields increased by 490 kg ha−1 for maize and 110 kg ha−1 for wheat with every 1 Mg increase in SOC pool in the 0–15 cm depth under 100% NPK + FYM compared to 100% NPK treatment. Lal [62] also reported that crop yields increased by 20–70 kg ha−1 for wheat, 10–50 kg ha−1 for rice, and 30–300 kg ha−1 for maize with every 1 Mg increase in SOC pool in the surface 15 cm layer. Increases in crop yields due to increase in SOC in some soils might result from increase in labile fraction of carbon [63]. Increase in yield with increase in SOC has been reported for many crops including wheat, mustard, sunflower and groundnut [64,65].
Figure 5. (A) and (B) Relationship between crop yields and soil organic carbon pool.
Agronomy 05 00220 g005aAgronomy 05 00220 g005b

4. Conclusions

Long term balanced fertilization resulted in increased SOC and carbon sequestration compared to non-treated control. Increases in SOC resulted in improved soil physical properties such as CEC, pH, aggregate MWD, infiltration rate and cumulative infiltration. Integrated use of inorganic fertilizer along with organic fertilizer (100% NPK + FYM) had resulted in maximum infiltration rate, cumulative infiltration and aggregate MWD. Improved soil physical conditions and increase in SOC might have resulted in higher maize and wheat yields. Improvement in SOC and consequently, SOM also improved nutrient uptake of N, P and K significantly in all treatments compared to non-treated control. It can be concluded that balanced application of NPK fertilizers with FYM was best option for higher crop yields in maize–wheat rotation.

Acknowledgements

This project was part of All India Coordinated Research Project on long term fertilizer experiment and funding was provided by Indian Council of Agricultural Research (ICAR).

Author Contributions

Babu Singh Brar and Jagdeep Singh were responsible for management of the project, data collection, statistical analysis, interpretation of results and manuscript preparation. Gurbir Singh and Gurpreet Kaur were involved in manuscript preparation and editing.

Conflicts of Interest

The authors declare no conflict of interest.

References

  1. Haynes, R.; Naidu, R. Influence of lime, fertilizer and manure applications on soil organic matter content and soil physical conditions: A review. Nutr. Cycl. Agroecosys. 1998, 51, 123–137. [Google Scholar]
  2. Hati, K.M.; Swarup, A.; Dwivedi, A.; Misra, A.; Bandyopadhyay, K. Changes in soil physical properties and organic carbon status at the topsoil horizon of a vertisol of central india after 28 years of continuous cropping, fertilization and manuring. Agric. Ecosyst. Environ. 2007, 119, 127–134. [Google Scholar]
  3. Kundu, S.; Singh, M.; Saha, J.K.; Biswas, A.; Tripathi, A.K.; Acharya, C.L. Relationship between c addition and storage in a vertisol under soybean-wheat cropping system in sub—Tropical central india. J. Plant Nutr. Soil Sci. 2001, 164, 483–486. [Google Scholar]
  4. Manna, M.; Swarup, A.; Wanjari, R.; Ravankar, H.; Mishra, B.; Saha, M.; Singh, Y.; Sahi, D.; Sarap, P. Long-term effect of fertilizer and manure application on soil organic carbon storage, soil quality and yield sustainability under sub-humid and semi-arid tropical india. Field Crop. Res. 2005, 93, 264–280. [Google Scholar]
  5. Reeder, J.; Schuman, G.; Bowman, R. Soil C and N changes on conservation reserve program lands in the central great plains. Soil Till. Res. 1998, 47, 339–349. [Google Scholar] [CrossRef]
  6. Schuman, G.; Janzen, H.; Herrick, J. Soil carbon dynamics and potential carbon sequestration by rangelands. Environ. Pollut. 2002, 116, 391–396. [Google Scholar] [CrossRef]
  7. Lal, R. Soil erosion and the global carbon budget. Environ. Int. 2003, 29, 437–450. [Google Scholar] [CrossRef]
  8. Jarecki, M.K.; Lal, R. Crop management for soil carbon sequestration. Crit. Rev. Plant Sci. 2003, 22, 471–502. [Google Scholar] [CrossRef]
  9. Tisdall, J.; Oades, J.M. Organic matter and water—Stable aggregates in soils. J. Soil Sci. 1982, 33, 141–163. [Google Scholar] [CrossRef]
  10. Six, J.; Elliott, E.; Paustian, K.; Doran, J. Aggregation and soil organic matter accumulation in cultivated and native grassland soils. Soil Sci. Soc. Am. J. 1998, 62, 1367–1377. [Google Scholar] [CrossRef]
  11. Barzegar, A.R.; Nelson, P.N.; Oades, J.M.; Rengasamy, P. Organic matter, sodicity, and clay type: Influence on soil aggregation. Soil Sci. Soc. Am. J. 1997, 61, 1131–1137. [Google Scholar] [CrossRef]
  12. Dexter, A. Advances in characterization of soil structure. Soil Till. Res. 1988, 11, 199–238. [Google Scholar] [CrossRef]
  13. Sharma, S.; Subehia, S. Effects of twenty-five years of fertilizer use on maize and wheat yields and quality of an acidic soil in the western himalayas. Exp. Agric. 2003, 39, 55–64. [Google Scholar] [CrossRef]
  14. Bronick, C.J.; Lal, R. Soil structure and management: A review. Geoderma 2005, 124, 3–22. [Google Scholar] [CrossRef]
  15. El-Shakweer, M.; El-Sayad, E.; Ewees, M. Soil and plant analysis as a guide for interpretation of the improvement efficiency of organic conditioners added to different soils in egypt. Commun. Soil Sci. Plan. 1998, 29, 2067–2088. [Google Scholar] [CrossRef]
  16. Ndiaye, B.; Molénat, J.; Hallaire, V.; Gascuel, C.; Hamon, Y. Effects of agricultural practices on hydraulic properties and water movement in soils in brittany (france). Soil Till. Res. 2007, 93, 251–263. [Google Scholar] [CrossRef]
  17. Shukla, M.; Lal, R.; Owens, L.; Unkefer, P. Land use and management impacts on structure and infiltration characteristics of soils in the north appalachian region of ohio. Soil Sci. 2003, 168, 167–177. [Google Scholar] [CrossRef]
  18. Zhang, M.-K.; Fang, L.-P. Effect of tillage, fertilizer and green manure cropping on soil quality at an abandoned brick making site. Soil Till. Res. 2007, 93, 87–93. [Google Scholar] [CrossRef]
  19. Barzegar, A.; Yousefi, A.; Daryashenas, A. The effect of addition of different amounts and types of organic materials on soil physical properties and yield of wheat. Plant Soil 2002, 247, 295–301. [Google Scholar] [CrossRef]
  20. Duiker, S.; Lal, R. Crop residue and tillage effects on carbon sequestration in a luvisol in central ohio. Soil Till. Res. 1999, 52, 73–81. [Google Scholar] [CrossRef]
  21. McVay, K.; Budde, J.; Fabrizzi, K.; Mikha, M.; Rice, C.; Schlegel, A.; Peterson, D.; Sweeney, D.; Thompson, C. Management effects on soil physical properties in long-term tillage studies in kansas. Soil Sci. Soc. Am. J. 2006, 70, 434–438. [Google Scholar] [CrossRef]
  22. Pernes-Debuyser, A.; Tessier, D. Soil physical properties affected by long-term fertilization. Eur. J. Soil Sci. 2004, 55, 505–512. [Google Scholar] [CrossRef]
  23. Rachman, A.; Anderson, S.; Gantzer, C.; Thompson, A. Influence of long-term cropping systems on soil physical properties related to soil erodibility. Soil Sci. Soc. Am. J. 2003, 67, 637–644. [Google Scholar] [CrossRef]
  24. Hati, K.; Swarup, A.; Singh, D.; Misra, A.; Ghosh, P. Long-term continuous cropping, fertilisation, and manuring effects on physical properties and organic carbon content of a sandy loam soil. Soil Res. 2006, 44, 487–495. [Google Scholar] [CrossRef]
  25. Anderson, S.; Gantzer, C.; Brown, J. Soil physical properties after 100 years of continuous cultivation. J. Soil Water Conserv. 1990, 45, 117–121. [Google Scholar]
  26. Bhattacharyya, R.; Chandra, S.; Singh, R.; Kundu, S.; Srivastva, A.; Gupta, H. Long-term farmyard manure application effects on properties of a silty clay loam soil under irrigated wheat-soybean rotation. Soil Till. Res. 2007, 94, 386–396. [Google Scholar] [CrossRef]
  27. Ghuman, B.; Sur, H. Tillage and residue management effects on soil properties and yields of rainfed maize and wheat in a subhumid subtropical climate. Soil Till. Res. 2001, 58, 1–10. [Google Scholar] [CrossRef]
  28. Miller, J.; Sweetland, N.; Chang, C. Hydrological properties of a clay loam soil after long-term cattle manure application. J. Environ. Qual. 2002, 31, 989–996. [Google Scholar] [CrossRef] [PubMed]
  29. Rasool, R.; Kukal, S.; Hira, G. Soil physical fertility and crop performance as affected by long term application of fym and inorganic fertilizers in rice-wheat system. Soil Till. Res. 2007, 96, 64–72. [Google Scholar] [CrossRef]
  30. Sharma, P.K.; Bhushan, L. Physical characterization of a soil amended with organic residues in a rice–wheat cropping system using a single value soil physical index. Soil Till. Res. 2001, 60, 143–152. [Google Scholar] [CrossRef]
  31. Zhang, S.; Yang, X.; Wiss, M.; Grip, H.; Lövdahl, L. Changes in physical properties of a loess soil in china following two long-term fertilization regimes. Geoderma 2006, 136, 579–587. [Google Scholar] [CrossRef]
  32. Gregorich, E.; Drury, C.; Baldock, J.A. Changes in soil carbon under long-term maize in monoculture and legume-based rotation. Can. J. Soil Sci. 2001, 81, 21–31. [Google Scholar] [CrossRef]
  33. Purakayastha, T.J.; Rudrappa, L.; Singh, D.; Swarup, A.; Bhadraray, S. Long-term impact of fertilizers on soil organic carbon pools and sequestration rates in maize-wheat-cowpea cropping system. Geoderma 2008, 144, 370–378. [Google Scholar] [CrossRef]
  34. Aune, J.; Lal, R. Agricultural productivity in the tropics and critical limits of properties of oxisols, ultisols, and alfisols. Trop. Agric. 1997, 74, 96–103. [Google Scholar]
  35. Kaur, T.; Brar, B.S.; Dhillon, N. Soil organic matter dynamics as affected by long-term use of organic and inorganic fertilizers under maize–wheat cropping system. Nutr. Cycl. Agroecosys. 2008, 81, 59–69. [Google Scholar] [CrossRef]
  36. Ghimire, R.; Adhikari, K.R.; Chen, Z.-S.; Shah, S.C.; Dahal, K.R. Soil organic carbon sequestration as affected by tillage, crop residue, and nitrogen application in rice–wheat rotation system. Paddy Water Environ. 2011, 10, 95–102. [Google Scholar] [CrossRef]
  37. Malhi, S.; Nyborg, M.; Goddard, T.; Puurveen, D. Long-term tillage, straw management and N fertilization effects on quantity and quality of organic c and n in a black chernozem soil. Nutr. Cycl. Agroecosys. 2011, 90, 227–241. [Google Scholar] [CrossRef]
  38. Walkley, A.; Black, C. An examination of digestion of method for determining soil organic matter and a proposed modification of the chromic and titration method. Soil Sci. 1934, 29–38. [Google Scholar] [CrossRef]
  39. Sparks, D.L.; Page, A.; Helmke, P.; Loeppert, R.; Soltanpour, P.; Tabatabai, M.; Johnston, C.; Sumner, M. Methods of Soil Analysis. Part 3-Chemical Methods; Soil Science Society of America Inc.: Madison, WI, USA, 1996. [Google Scholar]
  40. Rasool, R.; Kukal, S.; Hira, G. Soil organic carbon and physical properties as affected by long-term application of fym and inorganic fertilizers in maize-wheat system. Soil Till. Res. 2008, 101, 31–36. [Google Scholar] [CrossRef]
  41. Dane, J.H.; Topp, C.; Campbell, G.S.; Horton, R.; Jury, W.A.; Nielsen, D.R.; van Es, H.M.; Wierenga, P.J.; Topp, G.C. Methods of Soil Analysis. Part 4: Physical Methods; Soil Science Society of America Inc.: Madison, WI, USA, 2002. [Google Scholar]
  42. Kukal, S.S.; Rehanarasool; Benbi, D.K. Soil organic carbon sequestration in relation to organic and inorganic fertilization in rice-wheat and maize-wheat systems. Soil Till. Res. 2009, 102, 87–92. [Google Scholar] [CrossRef]
  43. Zhang, X.; Fan, C.; Ma, Y.; Liu, Y.; Li, L.; Zhou, Q.; Xiong, Z. Two approaches for net ecosystem carbon budgets and soil carbon sequestration in a rice-wheat rotation system in China. Nutr. Cycl. Agroecosys. 2014, 100, 301–313. [Google Scholar] [CrossRef]
  44. Cambardella, C.; Elliott, E. Carbon and nitrogen dynamics of soil organic matter fractions from cultivated grassland soils. Soil Sci. Soc. Am. J. 1994, 58, 123–130. [Google Scholar] [CrossRef]
  45. Van Bavel, C. Mean weight-diameter of soil aggregates as a statistical index of aggregation. Soil Sci. Soc. Am. J. 1950, 14, 20–23. [Google Scholar] [CrossRef]
  46. Bouwer, H. Methods of Soil Analysis, Part 1. Physical and Mineralogical Properties, Monograph 9; ASA: Madison, WI, USA, 1986. [Google Scholar]
  47. Kostiakov, A.N. On the dynamics of the coefficient of water-percolation in soils and on the necessity for studying it from a dynamic point of view for purposes of amelioration. Trans 1932, 6, 17–21. [Google Scholar]
  48. Uloma, A.R.; Samuel, A.C.; Kingsley, I.K. Estimation of Kostiakov’s Infiltration Model Parameters of Some Sandy Loam Soils of Ikwuano-Umuahia, Nigeria. Open Trans. Geosci. 2014, 1, 34–38. [Google Scholar] [CrossRef]
  49. Benbi, D.K.; Brar, J.S. A 25-year record of carbon sequestration and soil properties in intensive agriculture. Agron. Sustain. Dev. 2009, 29, 257–265. [Google Scholar] [CrossRef]
  50. Anderson, S.H.; Gantzer, C.J.; Brown, J.R. Soil physical properties after 100 years of continuous cultivation. J. Soil Water Conserv. 1990, 45, 117–121. [Google Scholar]
  51. Miles, R.J.; Brown, J.R. The Sanborn Field experiment: Implications for long-term soil organic carbon levels. Agron. J. 2011, 103, 268–278. [Google Scholar] [CrossRef]
  52. Benbi, D.K.; Senapati, N. Soil aggregation and carbon and nitrogen stabilization in relation to residue and manure application in rice-wheat systems in northwest india. Nutr. Cycl. Agroecosys. 2009, 87, 233–247. [Google Scholar] [CrossRef]
  53. Stevenson, F.J. Humus Chemistry: Genesis, Composition, Reactions; Wiley: New York, NY, USA, 1982; p. 443. [Google Scholar]
  54. Lutz, J.; Pinto, R.A.; Garcia-Lagos, R.; Hilton, H.G. Effect of phosphorus on some physical properties of soils: II. Water retention. Soil Sci. Soc. Am. J. 1966, 30, 433–437. [Google Scholar] [CrossRef]
  55. Laddha, K.; Totawat, K. Interactive effect of tillage and phosphate fertilization in conjunction with fym to sorghum+ greengram intercropping system on physico-chemical properties of the soil. Ann. Arid Zone 1998, 37, 75–81. [Google Scholar]
  56. Haris, H.; Megharaj, M. The effects of sludge and green manure on hydraulic conductivity and aggregation in pyretic mine tailings material. Environ. Geol. 2001, 41, 285–296. [Google Scholar]
  57. Subbian, P.; Lal, R.; Akala, V. Long-term effects of cropping systems and fertilizers on soil physical properties. J. Sustain. Agr. 2000, 16, 89–100. [Google Scholar] [CrossRef]
  58. Roberson, E.B.; Shennan, C.; Firestone, M.K.; Sarig, S. Nutritional management of microbial polysaccharide production and aggregation in an agricultural soil. Soil Sci. Soc. Am. J. 1995, 59, 1587–1594. [Google Scholar] [CrossRef]
  59. Bhattacharyya, R.; Kundu, S.; Prakash, V.; Gupta, H. Sustainability under combined application of mineral and organic fertilizers in a rainfed soybean-wheat system of the Indian Himalayas. Eur. J. Soil Sci. 2008, 28, 33–46. [Google Scholar] [CrossRef]
  60. Roldan, A.; Albaladejo, J.; Thornes, J.B. Aggregate stability changes in a semiarid soil after treatment with different organic amendments. Arid Soil Res. Rehab. 1996, 10, 139–148. [Google Scholar] [CrossRef]
  61. Aggarwal, R.K.; Kumar, P.; Power, J.F. Use of crop residue and manure to conserve water and enhance nutrient availability and pearl millet yields in an arid tropical region. Soil Till. Res. 1997, 41, 43–51. [Google Scholar] [CrossRef]
  62. Lal, R. Enhancing crop yields in the developing countries through restoration of the soil organic carbon pool in agricultural lands. Land Degrad. Dev. 2006, 17, 197–209. [Google Scholar] [CrossRef]
  63. Körschens, M.; Dhaliwal, G.S.; Arora, R.; Randhawa, N.S.; Dhawan, A.K. Possibilities and limits of carbon accumulation in arable soils. In Ecological Agriculture and Sustainable Development; Centre for research in rural and industrial development: Chandigarh, India, 1998; pp. 536–543. [Google Scholar]
  64. Ghosh, P.; Dayal, D.; Mandal, K.; Wanjari, R.; Hati, K. Optimization of fertilizer schedules in fallow and groundnut-based cropping systems and an assessment of system sustainability. Field Crop Res. 2003, 80, 83–98. [Google Scholar] [CrossRef]
  65. Shankar, G.; Verma, L.; Singh, R. Effect of integrated nutrient management on field and quality of Indian mustard (brassica juncea) and properties of soil. Indian J. Agric. Sci. 2002, 72, 551–552. [Google Scholar]

