Article

Identification of Barley (Hordeum vulgare L.) Autophagy Genes and Their Expression Levels during Leaf Senescence, Chronic Nitrogen Limitation and in Response to Dark Exposure

by
Liliana Avila-Ospina
,
Anne Marmagne
,
Fabienne Soulay
and
Céline Masclaux-Daubresse
*
INRA-AgroParisTech, Institut Jean-Pierre Bourgin, UMR1318, ERL CNRS 3559, Saclay Plant Sciences, 78000 Versailles, France
*
Author to whom correspondence should be addressed.
Agronomy 2016, 6(1), 15; https://doi.org/10.3390/agronomy6010015
Submission received: 19 November 2015 / Revised: 14 February 2016 / Accepted: 16 February 2016 / Published: 22 February 2016
(This article belongs to the Special Issue Nitrogen Transport and Assimilation in Plants)

Abstract

:
Barley is a cereal of primary importance for forage and human nutrition, and is a useful model for wheat. Autophagy genes first described in yeast have been subsequently isolated in mammals and Arabidopsis thaliana. In Arabidopsis and maize it was recently shown that autophagy machinery participates in nitrogen remobilization for grain filling. In rice, autophagy is also important for nitrogen recycling at the vegetative stage. In this study, HvATGs, HvNBR1 and HvATI1 sequences were identified from bacterial artificial chromosome (BAC), complementary DNA (cDNA) and expressed sequence tag (EST) libraries. The gene models were subsequently determined from alignments between genome and transcript sequences. Essential amino acids were identified from the protein sequences in order to estimate their functionality. A total of twenty-four barley HvATG genes, one HvNBR1 gene and one HvATI1 gene were identified. Except for HvATG5, all the genomic sequences found completely matched their cDNA sequences. The HvATG5 gene sequence presents a gap that cannot be sequenced due to its high GC content. The HvATG5 coding DNA sequence (CDS), when over-expressed in the Arabidopsis atg5 mutant, complemented the plant phenotype. The HvATG transcript levels were increased globally by leaf senescence, nitrogen starvation and dark-treatment. The induction of HvATG5 during senescence was mainly observed in the flag leaves, while it remained surprisingly stable in the seedling leaves, irrespective of the leaf age during stress treatment.

1. Introduction

Autophagy is a vesicular process, present in all eukaryotic cells, that consists of the formation of small double membrane vacuoles that engulf portions of cytosol and organelles destined for degradation after fusion with lysosomes or lytic vacuoles. The AuTophaGy (ATG) genes were first discovered in yeast [1,2,3]. There are 30 ScATG genes in yeast and homologues have been described in animals and plants, including Arabidopsis [4,5,6], maize [7] and rice [8]. The central autophagy machinery that is necessary for autophagosome formation consists of 18 ATG genes involved in the regulation of autophagy, the nucleation of pre-autophagosomal structures, the recruitment of lipids to expand the membrane of the autophagosome and the enclosure of membrane around the cargo to be degraded (see [9] for a review). From knowledge of yeast models, the molecular machinery and the roles of each ATG protein in autophagosome formation are now better understood and many recent papers have reviewed these molecular aspects in plants [10,11,12]. While autophagy has been considered for a long time as a non-specific and bulk degradation process, it was recently shown that specificity for the cargo carried in the vesicle can be achieved through the interaction of protein adaptors or the cargos themselves with ATG8 membrane-bound proteins. When autophagy is induced, the cytosolic ATG8 proteins are lipidated with phosphatidyl-ethanolamine (PE). The PE queue is then anchored into the membrane of the autophagosomes. The interaction of ATG8 with the ubiquitin binding protein, NBR1, facilitates cargo recruitment and its sequestration into the vesicle [13,14]. Thus the proteins interacting with ATG8 [15,16,17] have been searched using yeast double hybrid systems. The interactions found in this way between the ATI proteins and ATG8 have been confirmed in planta through bimolecular fluorescence complementation BiFC [15,16,17].
Functional analysis of the role of autophagy in plant nitrogen remobilization was started in Arabidopsis [18,19] and has been extended to rice and maize recently [20,21]. The role of autophagy in lipid metabolism in rice has also been reported [22]. The several Arabidopsis autophagy mutants (atg) that have been isolated and characterized display similar phenotypes [4,5,10]. They are characterized by the absence of autophagosome formation in the cytosol and the absence of autophagic bodies in their vacuoles. Both characteristics can be verified using microscopy, the first by over-expressing GFP::ATG8 protein fusions in plants, the second by treating plants with concanamycin-A, which blocks autophagic body degradation in the vacuole and facilitates observation of the bodies by light microscopy [23]. Arabidopsis atg mutants are hypersensitive to nitrogen deficiency, display early leaf senescence [5] and cannot remobilize nitrogen efficiently to their seeds [18]. Proteins, amino acids and ammonium accumulate in the leaves of mutants with ageing [18,19,24]. Their accumulation is interpreted as a defect in the protein degradation processes normally needed to facilitate nitrogen recycling and phloem translocation [18,20]. Accordingly, Michaeli et al. [17] showed that ATI1 was involved in the autophagy-dependent trafficking of plastid proteins to the vacuole.
For a long time, little has been known about the role of autophagy in plant species other than Arabidopsis. After the identification of the ZmATG genes of maize by Vierstra’s group [7,20], the OsATG genes were identified in rice [8]. The isolated rice OsATG7 mutant is male sterile. Studies on the role of autophagy in N-resource allocation to the seeds in rice were therefore compromised [21,22]. Recently, Vierstra’s group isolated the maize ZmAtg12 mutants and showed that, as in Arabidopsis, maize autophagy mutants could not remobilize nitrogen effectively from their old leaves to their seeds [20]. The importance of the role of autophagy in nitrogen remobilization and grain filling in plants was then confirmed.
The aim of our study is then to provide the molecular data needed to study autophagy machinery in barley and in wheat, for which barley is a useful model system due to its smaller and simpler genome (2n = 2x = 14) and for which genome assembly and an integrated physical map are available [25].
The 24 HvATG genes that could be identified from EST (expressed sequence tag) sequences in the barley genome are presented in this report [26]. Analysis of EST and cDNA (complementary DNA) sequences facilitated identification of the functional splice variants and of the HvATG gene sequences, structures and localizations in the genome. Regulation of the HvATG genes during natural and dark-induced leaf senescence and in response to nitrogen limitation was investigated. The results presented in this report form the basis of further studies aimed at investigating autophagy processes in barley including manipulation of the autophagy pathway through plant engineering or implementation of plant breeding approaches using quantitative trait locus mapping or genome-wide association studies.

2. Materials and Methods

2.1. Plant Material and Growth Conditions

In nitrate limitation experiments, the barley (Hordeum vulgare L.) cultivar Golden Promise, a two-rowed spring barley variety, was grown in a growth chamber with controlled photoperiod, temperature and humidity (16 h–25 °C/8 h–17 °C). Day light intensity was 600 µE.m−2·s−1. Seeds were sown on a seedbed and five-day-old seedlings were transferred into polyvinyl chloride (PVC) tubes containing sand as a substrate. The experimental unit was a tube (6 ø–45 cm units) containing 3 seedlings. Plants were watered eight times per day with a nutrient solution containing 5 mM·NO3 (250 µM·KH2PO4, 250 µM·MgSO4, 4 mM·KNO3, 500 µM·Ca(NO3)2, 200 µM·NaCl; 0.04 µM·(NH4)6Mo7O24, 24.3 µM·H3BO3, 11.8 µM·MnSO4, 3.48 µM·ZnSO4, and 1 µM·CuSO4, 0.001% Sequestrene 138 FE 100 Syngenta) as the high nitrate treatment (HN) or a 0.5 mM·NO3 (250 µM·KH2PO4, 250 µM·K2SO4, 250 µM·MgSO4, 250 µM·KNO3, 125 µM·Ca(NO3)2, 250 µM·CaCl2, 0.04 µM·(NH4)6Mo7O24, 24.3 µM·H3BO3, 11.8 µM·MnSO4, 3.48 µM·ZnSO4, and 1 µM·CuSO4, 0.001% Sequestrene 138 FE 100 Syngenta) as the low nitrate treatment (LN). Twenty days after sowing (DAS), the leaves were harvested individually; leaves L1 to L4 in HN and leaves L1 to L3 in LN, with L1 representing the bottom and oldest leaf and L3 or L4 the upper and youngest leaf under low or high nitrate conditions, respectively. For plants grown under LN and HN, three (in the first replicate) and four (in the second and third replicates) independent groups containing 18 leaves of each leaf rank were harvested between 10:00 a.m. and 12:00 p.m. and stored at –80 °C for further experiments. A total of 3 planting replicates were performed and the following analyses were carried out on at least two.
In dark stress experiments, plants were grown in the same growth chamber as described above, with the same controlled photoperiod, temperature and humidity. Seeds were sown in sand and seedlings were grown in PVC tubes and watered eight times per day with a nutrient solution containing 5 mM·NO3 (described above). Fourteen DAS, the plants were completely deprived of light for 4 days (the dark treatment). At the end of this dark stress period, plants were harvested and leaf ranks collected as described above, this first harvest was called T1. The remaining plants were left growing in the light for 3 more days (the recovery treatment). After this recovery period, plants were harvested and leaf ranks collected, this second harvest was called T2. At each harvesting time, three independent groups containing 12 leaves of each leaf rank were harvested between 10:00 a.m. and 12:00 p.m. and stored at −80 °C until required for further experiments. Leaves from plants growing in optimal light conditions throughout the experiment were also harvested at T1 and T2 and used as untreated controls.
In field experiments, the spring barley (Hordeum vulgare L.) cultivar Carina was used. The experiments were performed at Hohenschulen research farm, 15.5 km west of Kiel during the 2013 growing season. Spring barley was sown using a drill on 2 April 2013. The crop was managed organically and organic manure equal to 70 kg N·ha−1 was added. There were four replicate plots, each of 150 m2. Plants were grown at a density of 300 plants/m2 with 12.5 cm between rows. The crop was treated with 1.5 L/ha of Ariane C (Dow AgroSciences, St Quentin en Yvelines, France) and 20 g/ha of Trimmer SX (FCS) (herbicides) on 14 May 2013. Subsequently, the crop was also treated with 0.3 L/ha of Moddus (Syngenta, Guyancourt, France) and Ethephon (Bayer CropSc., Puteaux, France) (growth regulators), 0.5 L/ha of Gladio (Syngenta, Guyancourt, France) (fungicide), 5 kg/ha of MgSO4 and 10 L/ha of Mn-EDTA on 5 June 2013. On 7 June 2013, 150 kg/ha ESTA® Kierserit (KALI, Kassel, Germany) (25% MgO, 20% S) and 30 kg/ha KAS (76% NH4NO3, 24% CaCO3) were added. Thirty flag leaves from the main shoots were harvested from each plot between 10:00 a.m. and 12:00 p.m. and immediately stored at −80 °C for further experiments. Three whole plants were taken from each plot and dark adapted for 30 to 45 min for further photosynthesis and CO2 assimilation measurements on the flag leaf.
Samples were harvested after plant flowering at several time points representing different stages of leaf senescence and grain maturity: the first time point (T1) was 95 DAS and represented young leaves, the second time point (T2) was 99 DAS and represented mature leaves, and time point 3 (T3) was 103 DAS and represented senescing leaves according to chlorophyll measurements. The senescence stage was monitored in flag leaves in the field by measuring chlorophyll contents (SPAD), photosystem II efficiency using a photosynthesis yield analyzer (Mini-PAM, H. Walz Effeltrich, Germany) and CO2 assimilation using a portable gas exchange fluorescence system GFS-3000 (H. Walz Effeltrich, Germany). After harvesting, all plant material was immediately frozen using liquid nitrogen and ground to obtain a fine homogenous powder. This powder was stored at −80 °C for further analysis.
Arabidopsis thaliana wild type (Col-0), the atg5 mutant (SAIL_129B07) and the complemented atg5 p35S::HvATG5 mutant (this work) were grown on soil in either a glasshouse or a growth chamber at 60% relative humidity with a 16/8 light/dark cycle at 21/17 °C and light intensity 150 μE.m−2·s−1. Plants were watered three times a week with either a complete nutrient solution (10 mM·NO3) containing 5 mM·KNO3, 2.5 mM·Ca(NO3)2, 0.25 mM·MgSO4, 0.25 mM·KH2PO4, 0.42 mM·NaCl, 0.1 mM·FeNa–EDTA, 30 μM·H3BO3, 5 μM·MnSO4, 1 μM·ZnSO4, 1 μM·CuSO4, and 0.1 μM·(NH4)6Mo7O24 or a nitrate deficient solution (2 mM·NO3) containing 1.75 mM·KNO3, 0.125 mM·Ca(NO3)2, 0.25 mM·MgSO4, 0.25 mM·KH2PO4, 0.42 mM·NaCl, 0.1 mM·FeNa–EDTA, 30 μM·H3BO3, 5 μM·MnSO4, 1 μM·ZnSO4, 1 μM·CuSO4, and 0.1 μM·(NH4)6Mo7O24.

2.2. DNA and Protein Sequence Analysis

The barley ATG, ATI1 and NBR1 genes were identified using homologous protein sequences from Arabidopsis and rice (Oryza sativa) as queries.
The Arabidopsis and rice ATG gene and protein sequences were obtained from The Arabidopsis Information Resource (TAIR) (http://www.arabidopsis.org/) and GRAMENE (http://www.gramene.org/) databases (Supplementary Table 1; Supplementary Figure 1). The Arabidopsis and rice protein sequences were then used to search by TBLASTN and TBLASTX [27] in the following cDNA, EST, and BAC (bacterial artificial chromosome) clone libraries as well as protein and genomic assembly databases: GeneBank, http://www.ncbi.nlm.nih.gov/; European Nucleotide Archive (ENA), http://www.ebi.ac.uk/ena/; UniProt, http://www.uniprot.org/; European Bioinformatic Institute (EBI), http://www.ebi.ac.uk/ (last searched November 2013). The identified HvATG cDNA sequences were then used as BLASTN query sequences against the full barley genome sequence found in the EnsemblPlants (http://plants.ensembl.org/) database in order to obtain the gene models and to assign each cDNA to a genomic locus. All the barley HvATG genes were found through BLAST searches using both coding DNA sequences (CDSs) and predicted protein sequences of the three species: Saccharomyces cerevisiae, Arabidopsis thaliana and Oriza sativa. Only sequences with the lower e-values were considered as homologues for all ATG genes described in this work (Figure 1 and Table 1). Only one barley homologue gene is described for each ATG gene in this work (Figure 1 and Table 1). In the case of gene families such as ATG1, ATG8 and ATG18, each one of their members represents a different gene.
The predicted protein sequences considered as barley ATG homologues were then used as queries to search ATG proteins in S. cerevisiae, A. thaliana and O. sativa (the results of protein identity for each ATG protein are indicated in Table 1). Reciprocal BLAST using predicted HvATG proteins of barley as queries confirmed the initial results by showing the lowest e-values for each of the ATG proteins of S. cerevisiae, A. thaliana and O. sativa. The results of this work were further confirmed by the publication of the barley genome assembly (Supplementary Figure 1).
Sequence alignments between individual cDNA and genomic sequences were manually inspected for consensus coding regions, introns and exons. Sequence alignments between HvATG and ATG protein sequences of other species were also manually inspected for conserved and essential amino acids. Alignments were performed on the whole protein sequence. These protein sequences were also used to perform phylogenetic analysis. The ATG protein sequences for other species different to Arabidopsis and rice were found through the GeneBank database searches. The multiple protein sequence alignments and the phylogenetic trees were generated using the ClustalW algorithm and the Phylogeny MABL program available online (http://www.phylogeny.fr/simple_phylogeny.cgi; [28]). Figures of the HvATG gene model were generated by Exon-Intron graphic maker (http://wormweb.org/exonintron). Splice variants predicted by the EnsemblPlants database and the corresponding accession numbers are found in Table 1.

2.3. RNA Purification and RT-qPCR Analysis

Four hundred milligrams of frozen ground material were used for RNA isolation with TRIzol reagent (Ambion) according to the manufacturer’s specifications. RNA was suspended in nuclease free water, the purity and concentration were spectrophotometrically determined with a Nanodrop 1000 (Thermo Scientific) and stored at −80 °C. cDNA synthesis was performed with 1µg of RNA using the first strand cDNA synthesis kit (Thermo Scientific) at 37 °C for 50 min. cDNA was diluted 1:2 (v/v) in nuclease free water and stored at −20 °C. qPCR mix was composed by 10 µL of MESA FAST qPCR master mix plus for SYBR assay (Eurogentec), 3.8 µL water, 1.2 µL of 10 µM specific forward and reverse primers and 5 µL diluted cDNA 1:30 (v/v) in nuclease free water. Reactions were carried out in triplicate in 96-well plates in a Bio-Rad CFX connect thermocycler on the following cycle, 94 °C for 5 min followed by 94 °C for 5 s, 72 °C for 20 s and a melt curve from 50 °C to 95 °C increasing by 0.5 °C every 30 s. Fluorescence readings were taken during the elongation step (72 °C). Ct values were calculated by the CFX connect software.
Genes and primers are listed in Supplementary Table 2. Several reference genes (including GADPH, Actin, SAMd, CHS90, α-Tubulin, β-Tubulin, EF1a, ADPrf1, CDC48 and Ubiquitin) were trialed and only GADPH was validated across all samples under nitrate limitation and dark stress assays and Actin was validated across all senescence stages in samples from field experiments in accordance with the geNorm algorithm [29]. Results are shown as Log10 fold changes in the transcript levels of samples compared to the youngest leaf.

2.4. HvATG5 Cloning and Agrobacterium tumefaciens-Mediated Transformation

The HvATG5 CDS was amplified from the BAC clone NIASHv2006J04 (provided by the National Institute of Agrobiological Sciences, NIAS) using the primers attB1 HvATG5 (5′-GGGGACAAGTTTGTACAAAAAAGCAGGCTTCGAAGGAGATAGAACCATGGCGGCGGCGGCGCCGT-3′) and attB2 HvATG5 (5′-GGGGACCACTTTGTACAAGAAAGCTGGGTTTCAAGCGCTGACGTATACAC-3′). The PCR product was then recombined into pDONR207 (Invitrogen). The insert in pDONR-HvATG5 was next transferred into the destination binary vector pMDC32 (Invitrogen) by LR recombination. The fragment generated by PCR and the cloned fragments were verified by sequencing in all vectors. Subsequently, these plasmids were transferred into the Agobacterium tumefaciens strain, GV3101::pMP90 (C58C1), by electroporation and atg5 (SAIL_129B07) Arabidopsis thaliana was transformed by floral dipping. The expression level of HvATG5 in the transformants was measured as in barley using the same specific primers and the same RT-qPCR conditions as described above, except that Arabidopsis Actin was used as the reference gene.

2.5. Chlorophyll Content Determination

Chlorophyll content was determined in seedling leaves and flag leaf crude extracts according to [30].

2.5.1. Concanamycin A Treatment

Primary roots of wild-type (Col-0), atg5 mutant and complemented atg5 p35S::HvATG5 plants grown vertically on MS medium for 1 week were removed from the plants and then incubated in MS-N liquid medium containing 1 μM concanamycin A (C-9705; Sigma-Aldrich, St. Louis, MO, USA) under gentle agitation at 23 °C for 6 h in the dark. The roots were mounted in MS medium and observed by conventional transmission light microscopy (ZEISS Axioplan) [23].

2.5.2. Statistics

The significance of the leaf senescence and nitrate effects was determined using XLSTAT ANOVA Newman–Keuls (SNK) comparisons.

3. Results

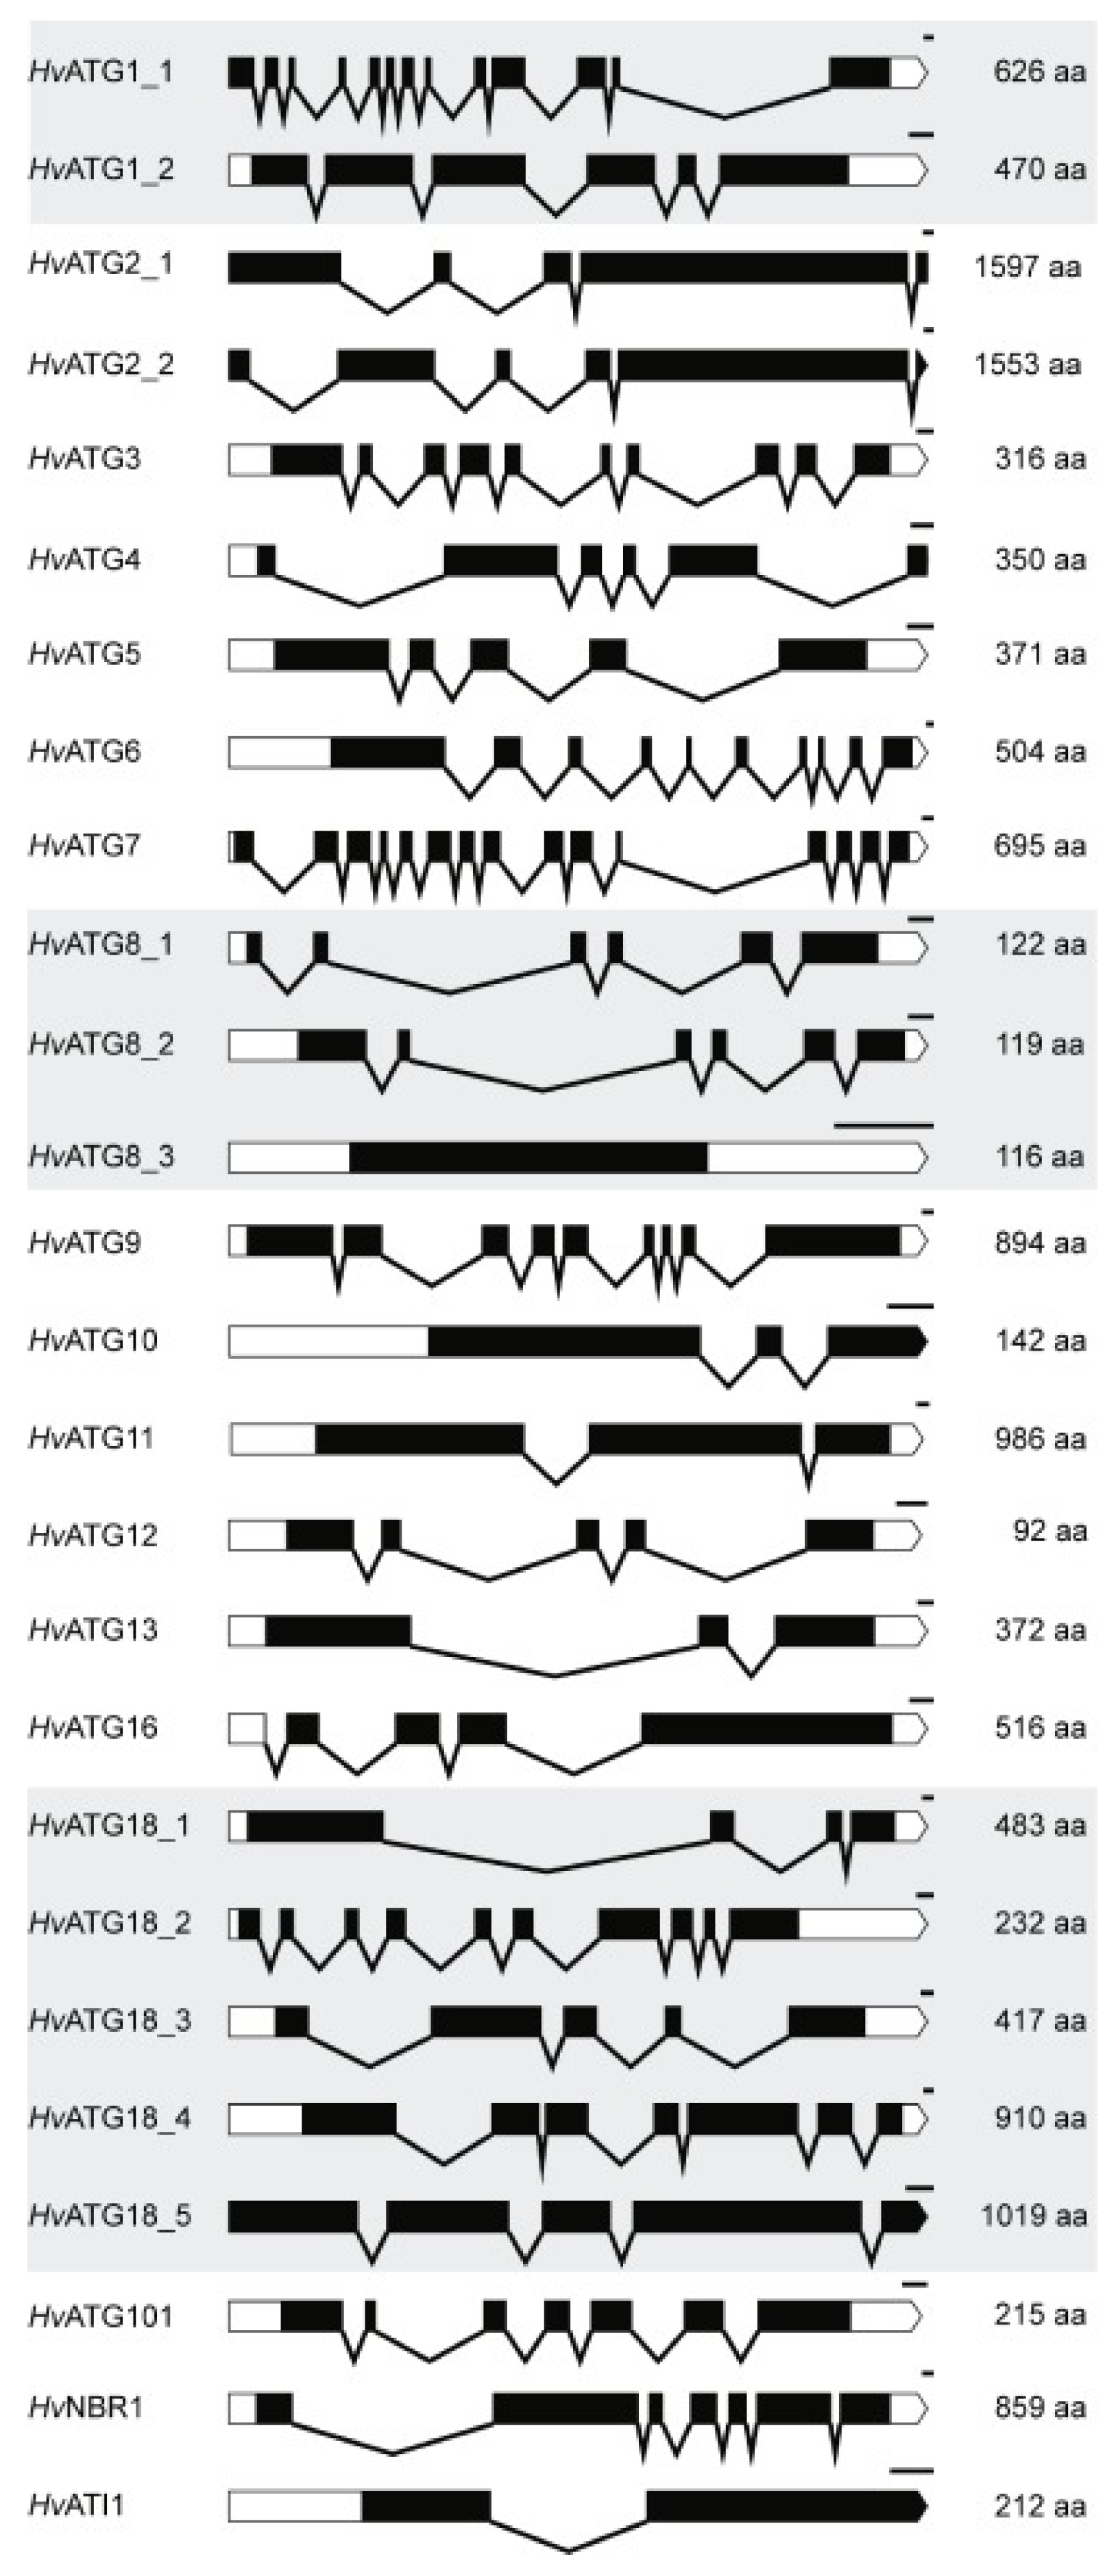
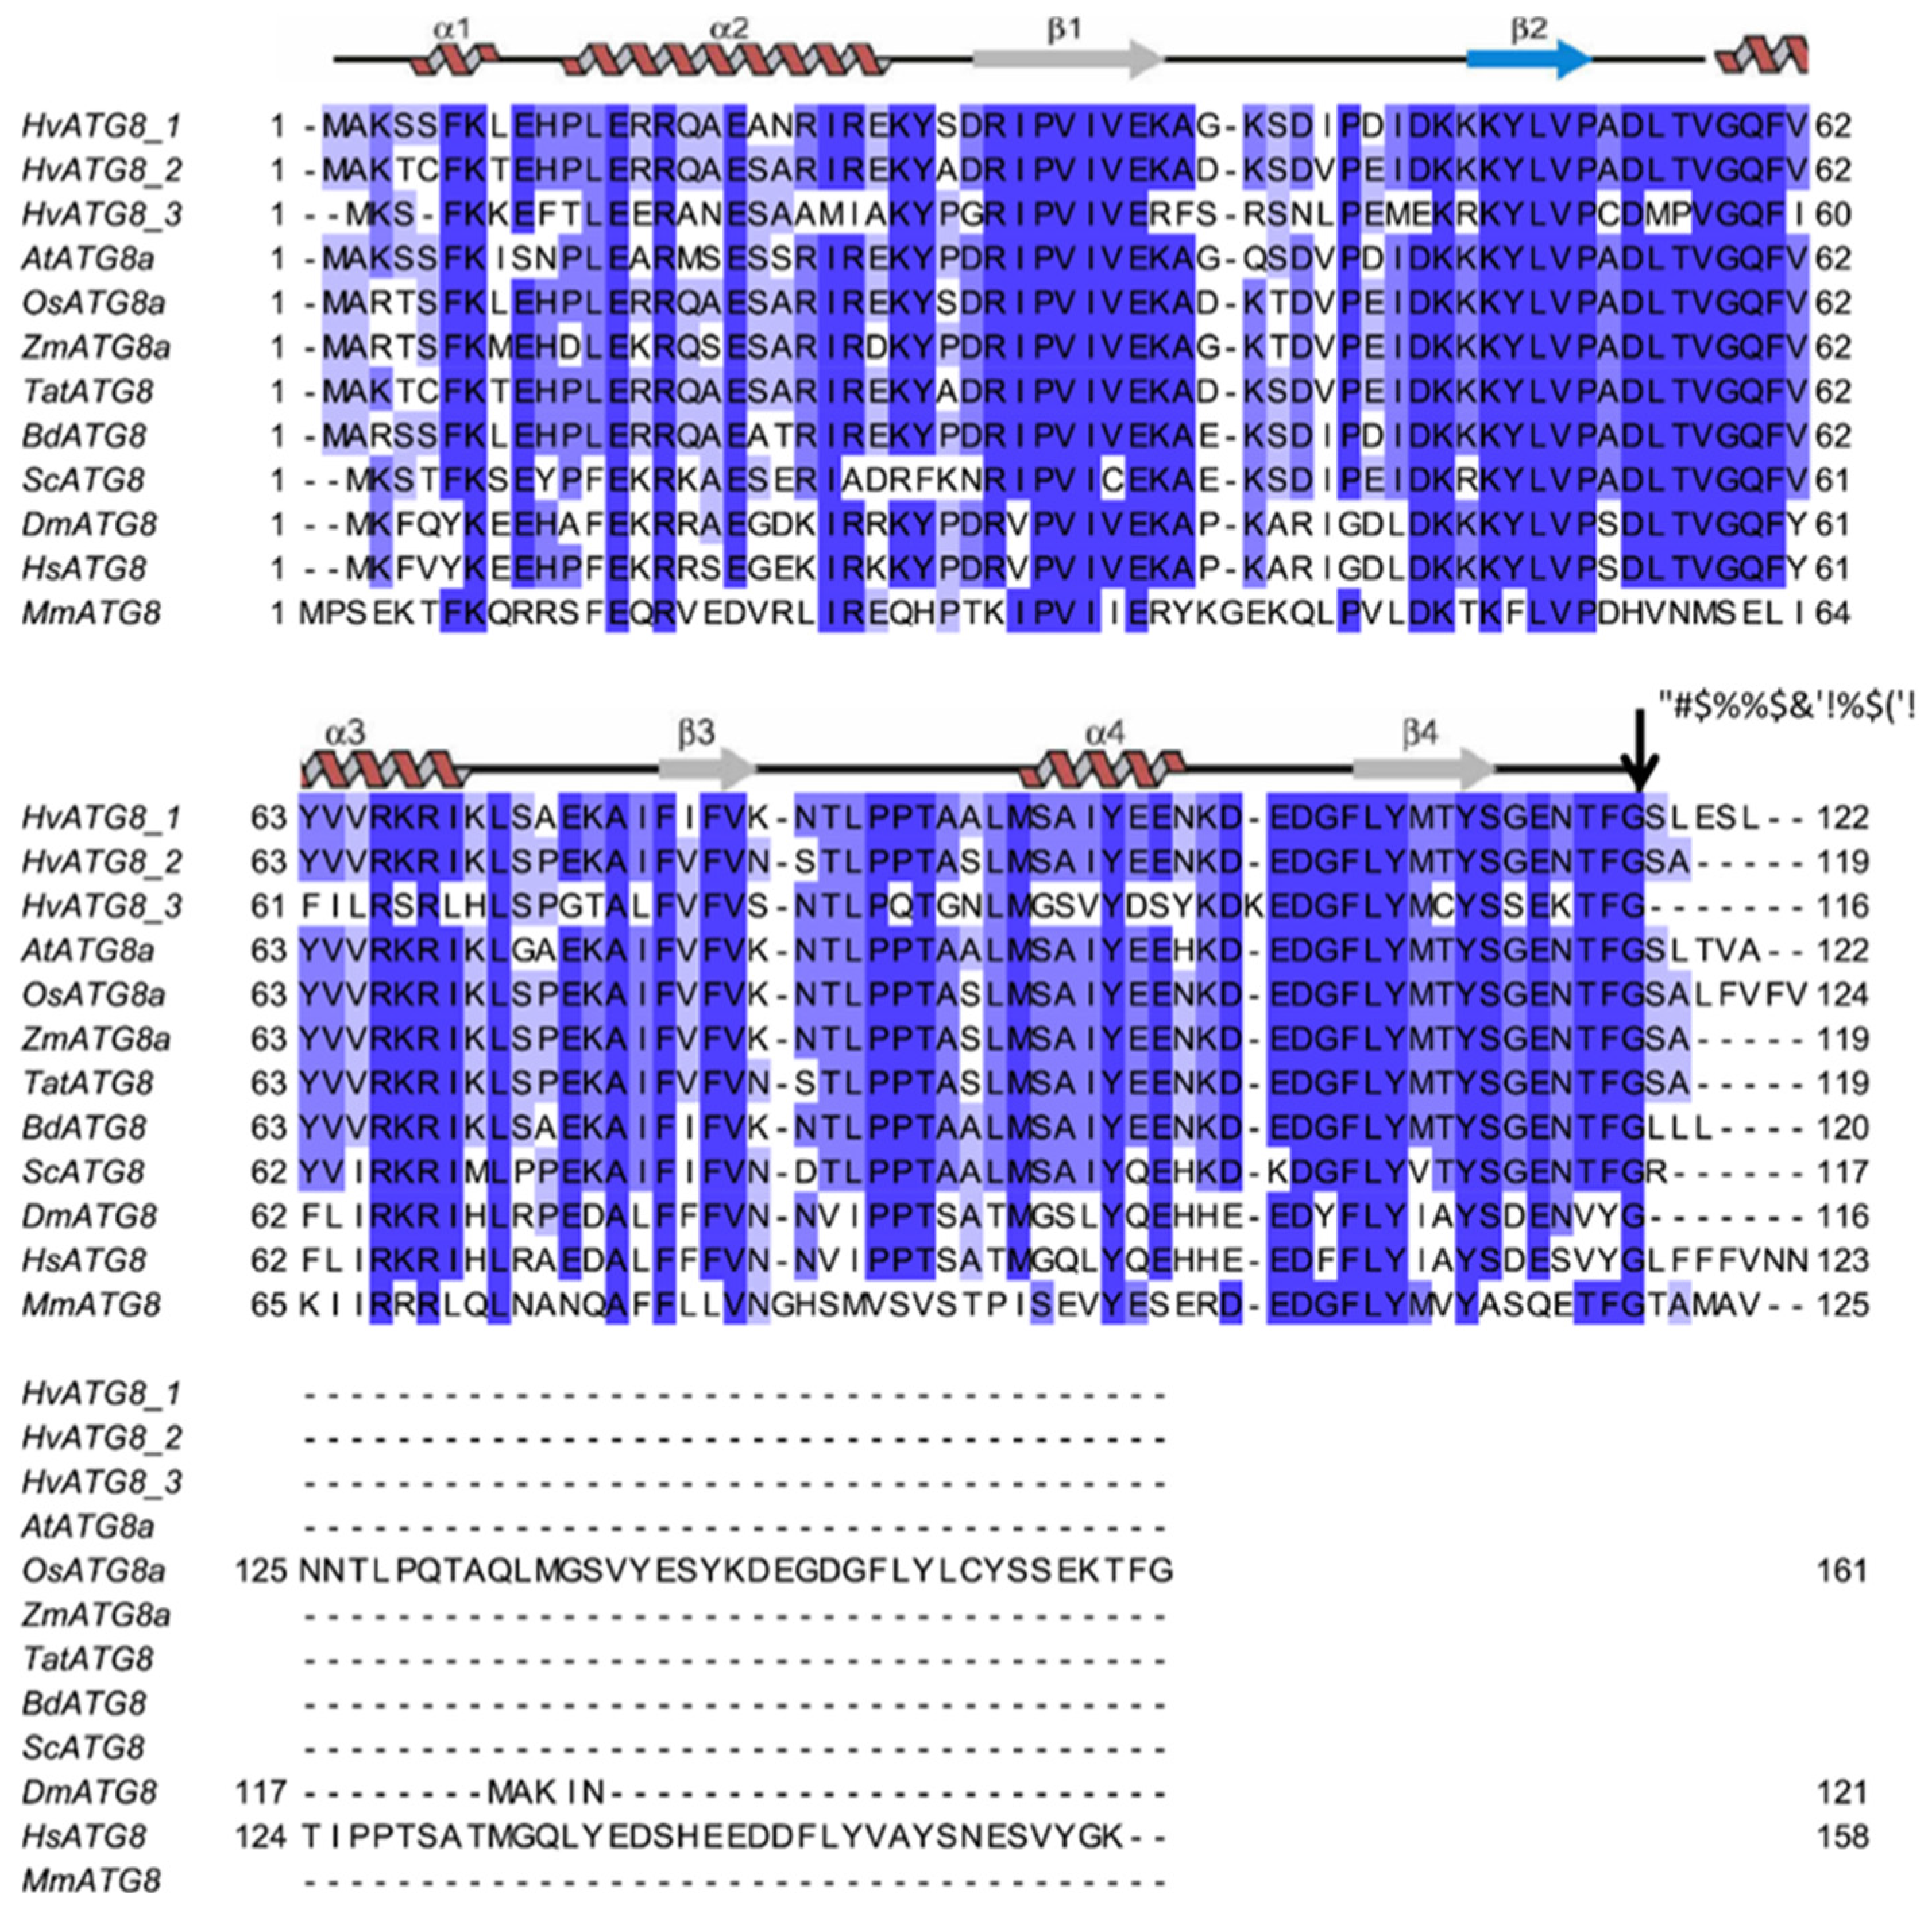
3.1. Identification of ATG, NBR1 and ATI Genes in Barley

In order to find the barley HvATGs, HvNBR1 and HvATI homologue sequences, we used the rice (OsATG, OsATI and OsNBR1), Arabidopsis (AtATG, AtATI and AtNBR1) and yeast (ScATG) equivalents as queries. Yeast equivalents are single genes for each function, while in Arabidopsis and rice several ATG functions are encoded by gene families. This is the case for ATG1 (three genes in Arabidopsis and four in rice), ATG3 (two genes in rice), ATG4 (two genes in both Arabidopsis and rice), ATG8 (nine genes in Arabidopsis and five genes in rice), ATG9 and ATG10 (two genes of each in rice), ATG12 (two genes in Arabidopsis and three genes in rice), ATG13 (two genes in both Arabidopsis and rice) and ATG18 (eight genes in Arabidopsis and six genes in rice). The Arabidopsis, rice and yeast ATG collections (Supplementary Table 1) were used as queries in the BLASTX and TBLASTN searches in the different DNA and protein sequence databases including cDNA, EST (e.g., GeneBank and ENA), the genomic assembly databases (e.g., EnsemblGenomes) and the protein sequence database (e.g., Uniprot, EBI). Gaps in the sequences were eliminated by sequence analysis of the corresponding bacterial artificial chromosome clone sequences available in the databases previously mentioned. Finally, all the cDNA sequences found were aligned with genomic sequences in order to establish the HvATGs, HvATI1 and HvNBR1 gene models and reciprocal blasts were performed to confirm results (Figure 1).
A total of twenty-four HvATG genes were found in our study (Table 1). Only one HvATI gene could be found. Single genes encode HvATG3, HvATG5, HvATG7, HvATG9, HvATG11, HvATG12, HvATG13, HvATG16, and HvATG101, while HvATG1, HvATG8 and HvATG18 are encoded by gene families (two genes for HvATG1, three genes for HvATG8 and five genes for HvATG18; Table 1 and Supplementary Data Set 1). For many putative proteins, high amino acid sequence conservation was observed when they were compared with their homologues in rice, but there was less identity with their Arabidopsis and yeast equivalents. For example, HvATG5 has 72% identity with OsATG5, 48% with AtATG5 and 13% with ScATG5. Other proteins showed high identity with all counterparts; for example, HvATG8_1 has 87% identity with OsATG8a, 86% with AtATG8a and 71% with ScATG8a. This protein also shows high identity with other ATG8 proteins from organisms such as drosophila, mice and humans and represents one of the most conserved proteins of all HvATG collection (Figure 2).
In phylogenetic analysis carried out using the predicted protein sequences of the HvATG families (HvATG8_1 to 3 and HvATG18_1 to 5) and the homologous protein sequences of different eukaryotic species (Supplementary Figure 2), we could observe that predicted proteins from the HvATG18 family were clustered with their Arabidopsis homologues, with the exception of HvATG18_1 and HvATG18_5, which were clustered with other ATG18-like proteins from other plants (Supplementary Figure 2A). The predicted proteins from the HvATG8 family were all branched with the Arabidopsis proteins (Supplementary Figure 2B). In all cases, the gene and the protein names were given according to their phylogenetic proximity to the Arabidopsis isoform. Furthermore, in most of the HvATG proteins identified, the key amino acids necessary for their functions of were detected (Supplementary Figure 3A-N). These residues include (i) the catalytic Cys residues in ATG3 and ATG7 essential for their interaction with ATG8 [32]; (ii) the Lys residue in ATG5 considered as the conjugation site for ATG12; (iii) the C-terminal Gly in ATG12 isoforms, which is essential for the formation of the ATG12–ATG5 conjugate; (iv) the highly conserved amino acids from the BARA domain in ATG6 that are essential for autophagy [33]; (v) the amino acids from C-terminal domain in ATG7 responsible for the recognition of ATG8 [31], (Figure 2); (vi) the amino acid residues from the ATG8-family interacting motif that are crucial for selective autophagy [31]; (vii) the Ser residues of ATG9 that are targets of ATG1 phosphorylation [34]; (viii) the Arg residue belonging to the HORMA domain in ATG13 that is required for autophagy and PI-3 kinase recruitment [35]; and (ix) the amino acid residues from the coiled-coil domain (CCD) in ATG16 that are essential for interaction with the ATG5-ATG12 conjugate [36]. No essential amino acid residues were found in the predicted proteins of the HvATG18 family. Due to the low identity of HvATG18_4 and HvATG18_5 amino acid sequences with the counterparts of other species and the fact that no key amino acids essential for their function could be found in these sequences, we cannot be assured that these genes encode for ATG functions in barley. Further studies are needed to confirm that these sequences have HvATG function.
Our gene models (Figure 1) were performed by aligning the collected EST, BAC and cDNA sequences with the available genome sequences [26]. We then compared our gene models to the ones published by the genome assembly database EnsemblPlants (http://plants.ensembl.org/index.html), (Supplementary Figure 4). EnsemblPlants predicted and proposed several splice variants for almost all the HvATG genes (Supplementary Figure 4), and apart from the case of HvATG5, for each of the other genes, only one of the EnsemblPlants proposed splice variant corresponded to our gene model. This suggested that for each HvATG gene, only one of the splice variants encoded the corresponding sequenced cDNA and EST reported in NCBI (Table 1). Due to the sequence gaps between all splice variants found in EnsemblPlants and the EST and cDNA sequences found in NCBI for HvATG5, special interest was paid to this gene.

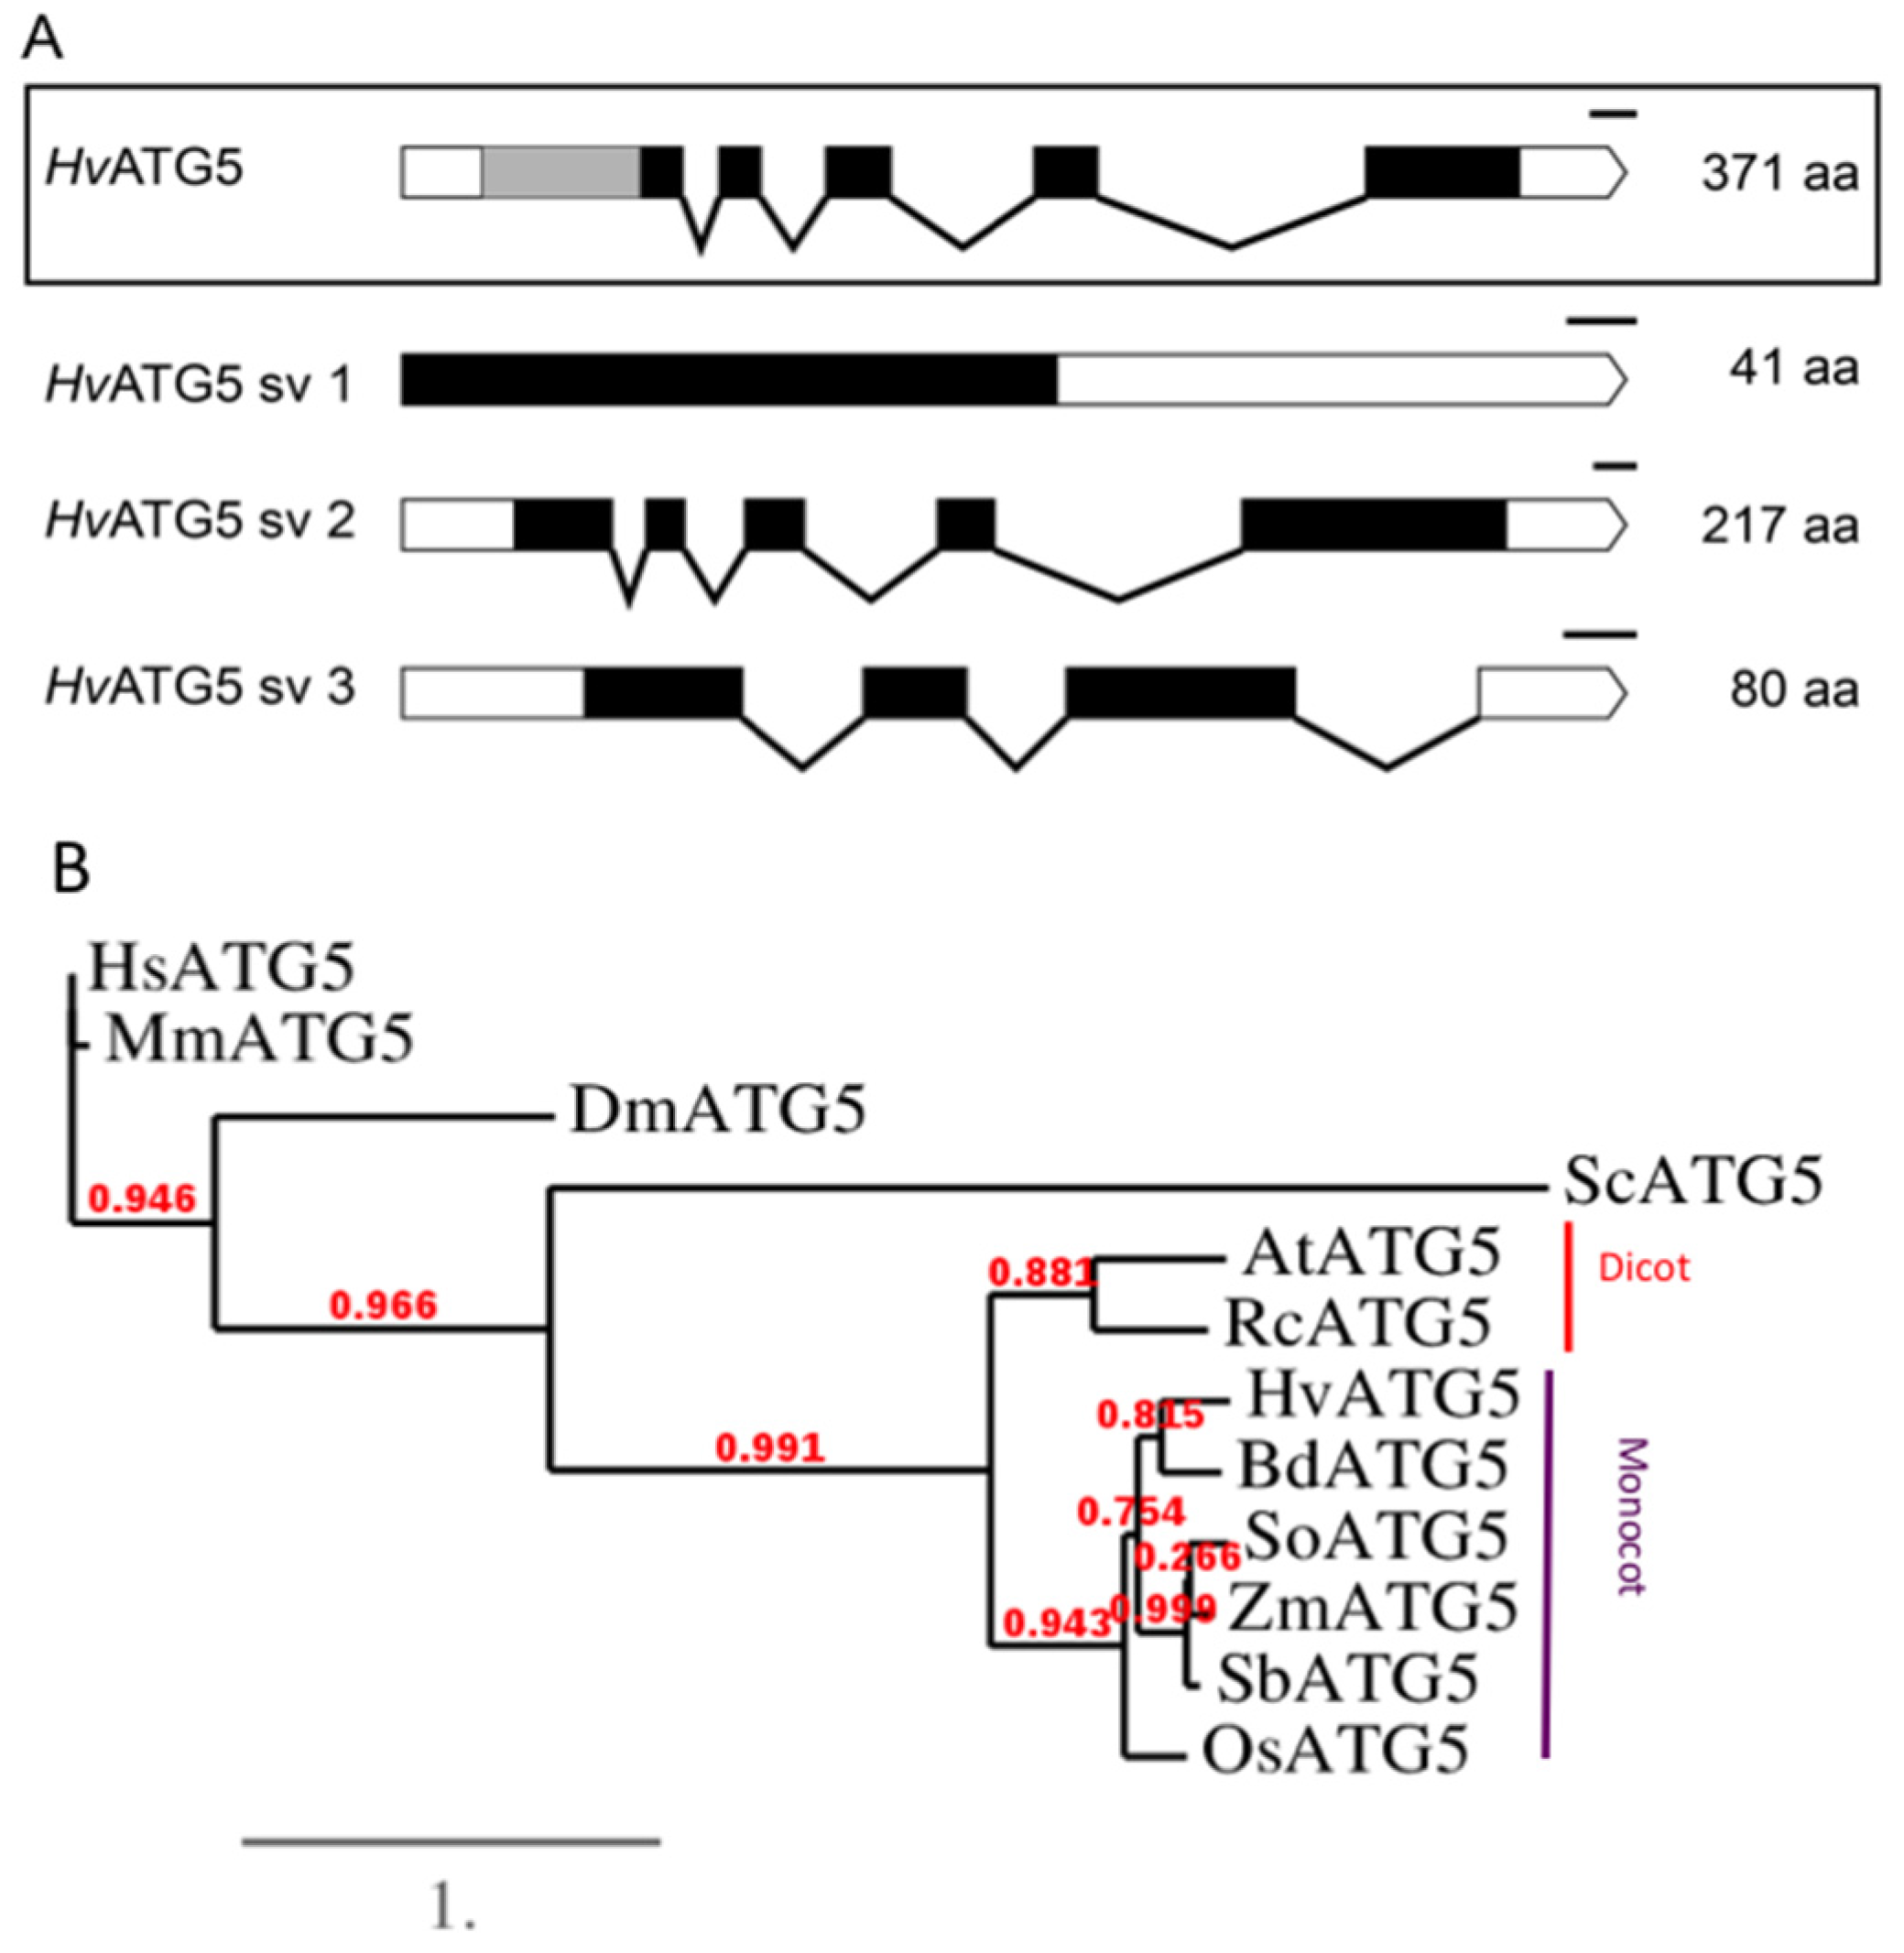
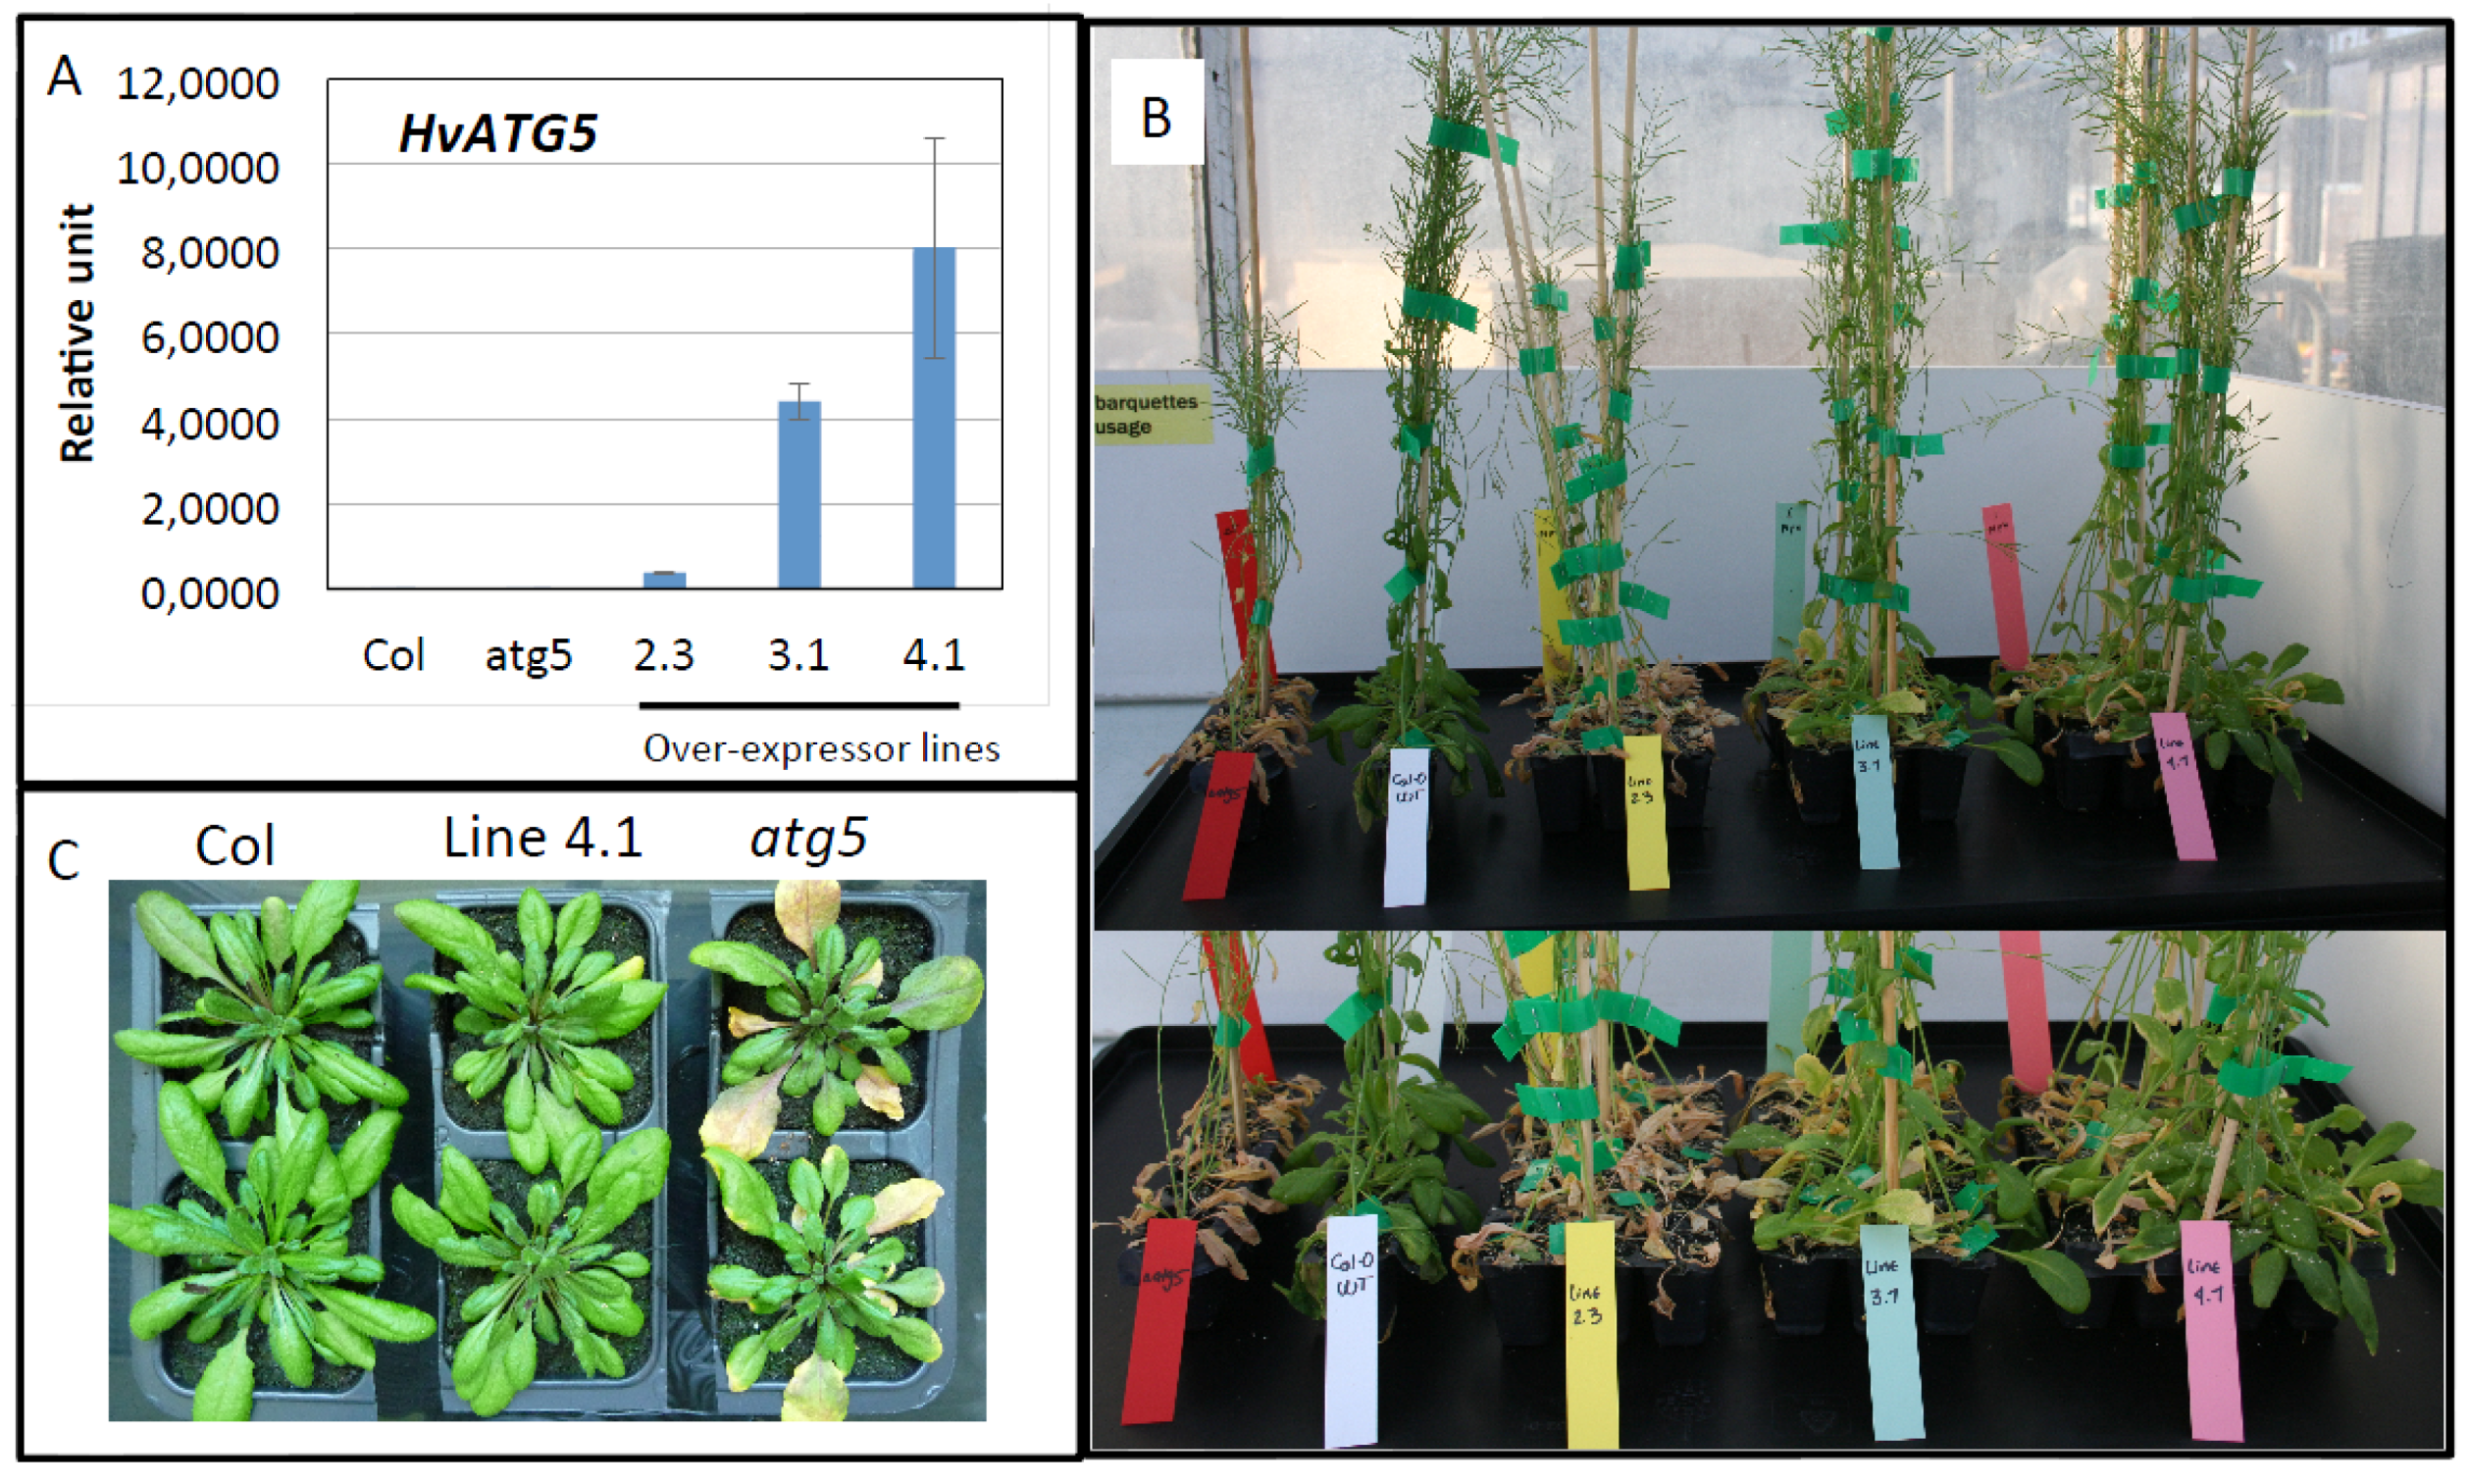
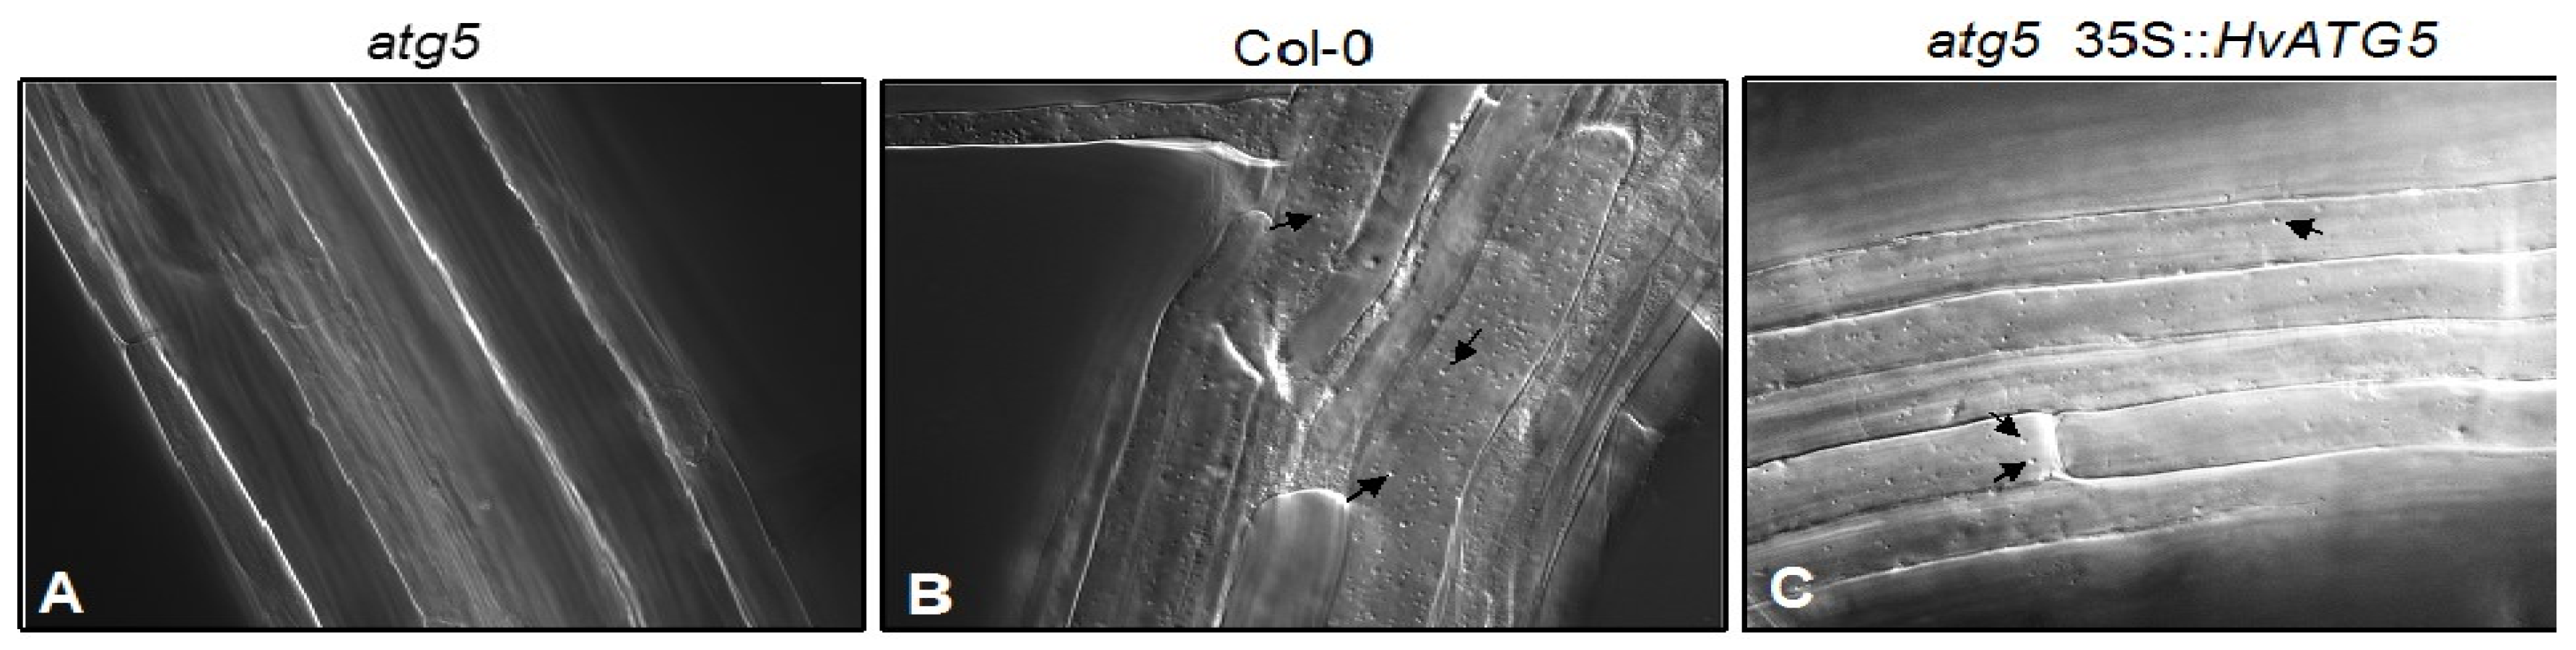
3.2. HvATG5 Description and Functional Complementation

The HvATG5 gene sequence we found by aligning the HvATG5 EST sequence on the barley genome does not contain the full HvATG5 coding frame (Figure 1; Supplementary Figure 4; Figure 3). The HvATG5 EST sequence, contained in a BAC clone library, encodes for a 371 amino acid protein (Figure 3A). The gap in the genome sequence corresponds to the 154 amino acids of the beginning of the HvATG5 protein predicted from the EST sequence (Figure 3A). These 154 amino acids are essential for clustering of the HvATG5 protein sequence with the ATG5 of other monocots in the phylogenetic tree (Figure 3B). The gap observed in the genome sequence could be due to its high GC content, which makes it difficult to amplify and sequence as also described by Chung et al. [7] for ZmATG5.
The CDS DNA fragment corresponding to the HvATG5 EST was cloned under the control of the 35S promoter and over-expressed in the Arabidopsis atg5 mutant to test phenotype complementation. Three independent over-expressing lines showing different HvATG5 expression levels were isolated and observed further (Figure 4A). The three atg5 lines overexpressing the HvATG5 CDS showed bigger rosettes, longer stems and delayed leaf senescence in comparison to atg5, whatever the growth conditions (Figure 4BC; Supplementary Figure 5).
One way to select an autophagy mutant is to observe the absence of autophagic bodies in their roots after concanamycin-A treatment. Most of the Arabidopsis atg mutants have been confirmed this way by previous authors [4,5,6,37]. Using a similar protocol, we confirmed the total absence of autophagic bodies in the roots of atg5 while many were accumulated in the wild type roots after concanamycin-A treatment (Figure 5A,B). By contrast with atg5, accumulation of autophagic bodies was also observed after concanamycin-A treatment in the vacuole of the roots of the three atg5 35S::HvATG5 over-expressor lines (Figure 5C). This indicated that the over-expression of HvATG5 in atg5 has rescued autophagic body formation.

3.3. Expression Patterns of HvATG Genes during Leaf Senescence and Nutritional Stress

The transcript levels of the HvATG genes were estimated using RT-qPCR in two different plant models: (i) seedlings grown in growth chambers under high (HN) or low (limiting; LN) nitrate conditions (Figure 6) or submitted to dark treatment (Figure 7), and (ii) flag leaves from plants grown in the field (Figure 8). The same plant material has been previously used in our studies on glutamine and asparagine synthetases in barley [38]. For the seedlings submitted or not to dark treatment, we analyzed separately each of the L1, L2 and L3 leaf ranks (from the bottom to the top), which represented old, mature and young leaves, respectively. For seedling leaves and flag leaves, senescence was determined by comparing the chlorophyll contents (Figure 6A, Figure 7C and Figure 8A) and the expression of the senescence-associated HvNAC13 gene and the senescence-repressed HvGS2 gene (Figure 6B, Figure 7D and Figure 8B).
Based on the HvATG sequences found, specific primers were designed for each gene in order to evaluate their expression during senescence and under stress conditions. The expression of almost all the genes described in this study could be estimated with exception of HvATG9, HvATG11, HvATG12, HvATG18_4 and HvATG101, as it was not possible to find efficient primers for these.

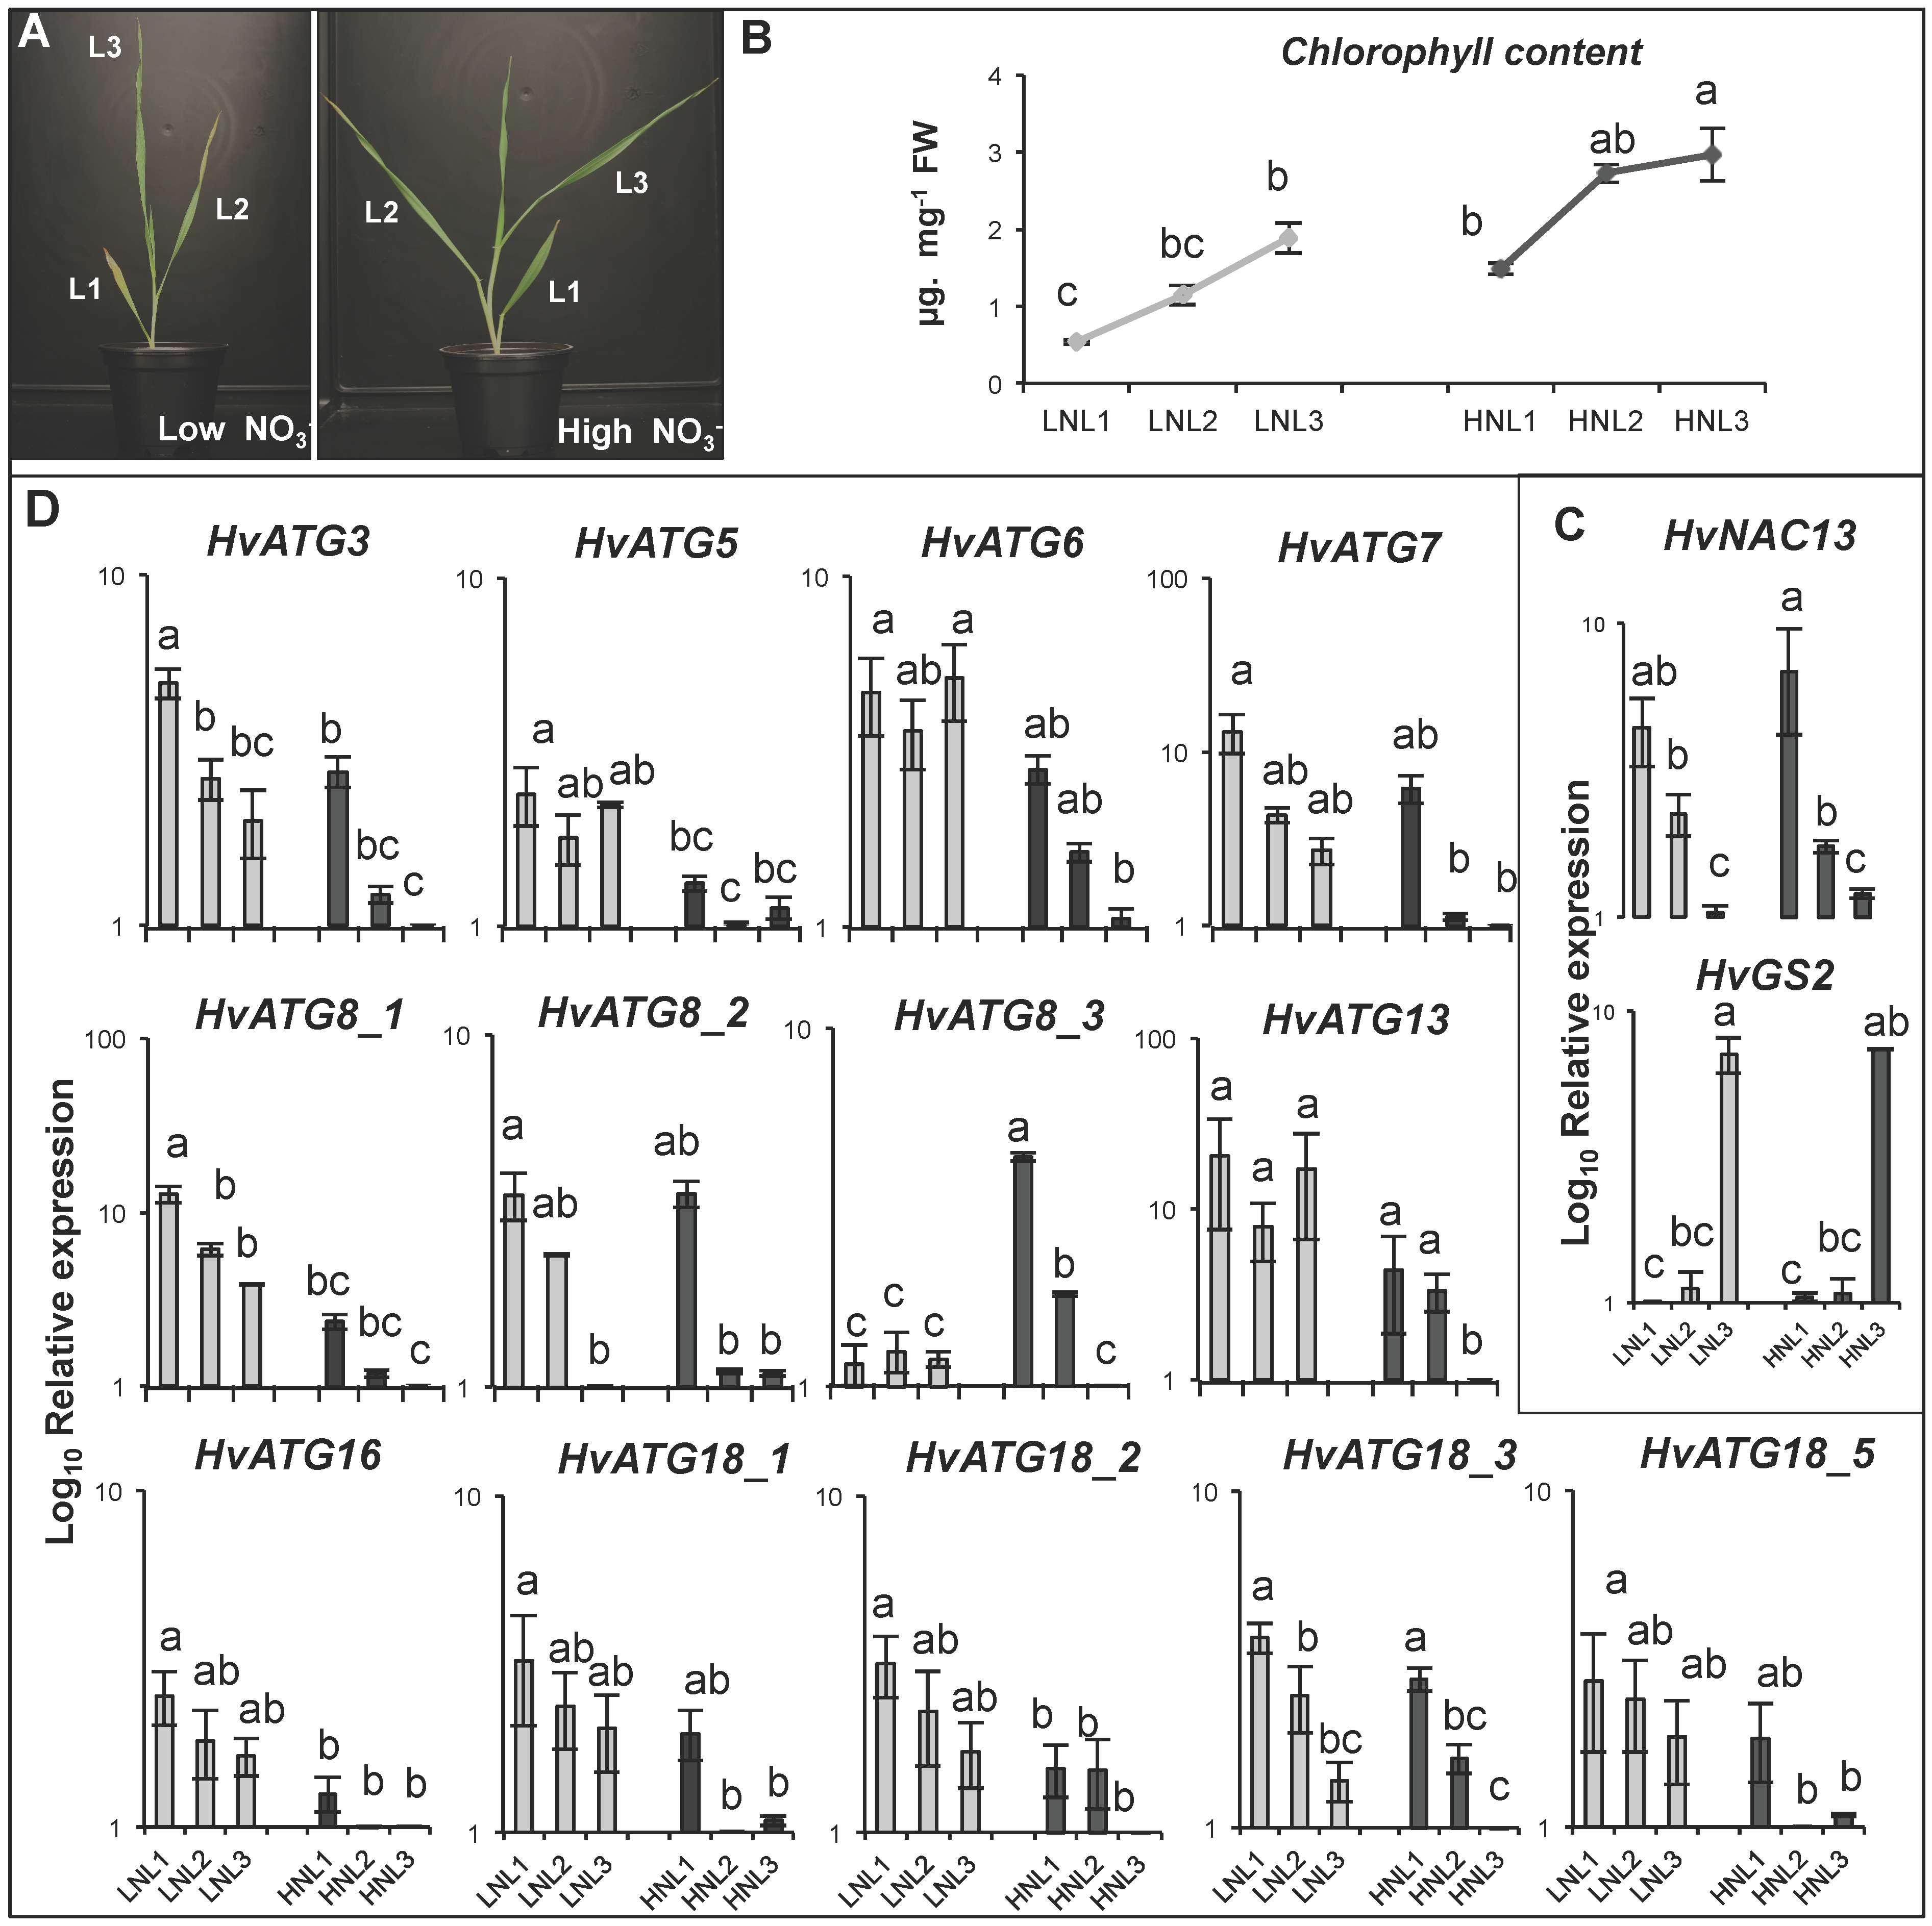
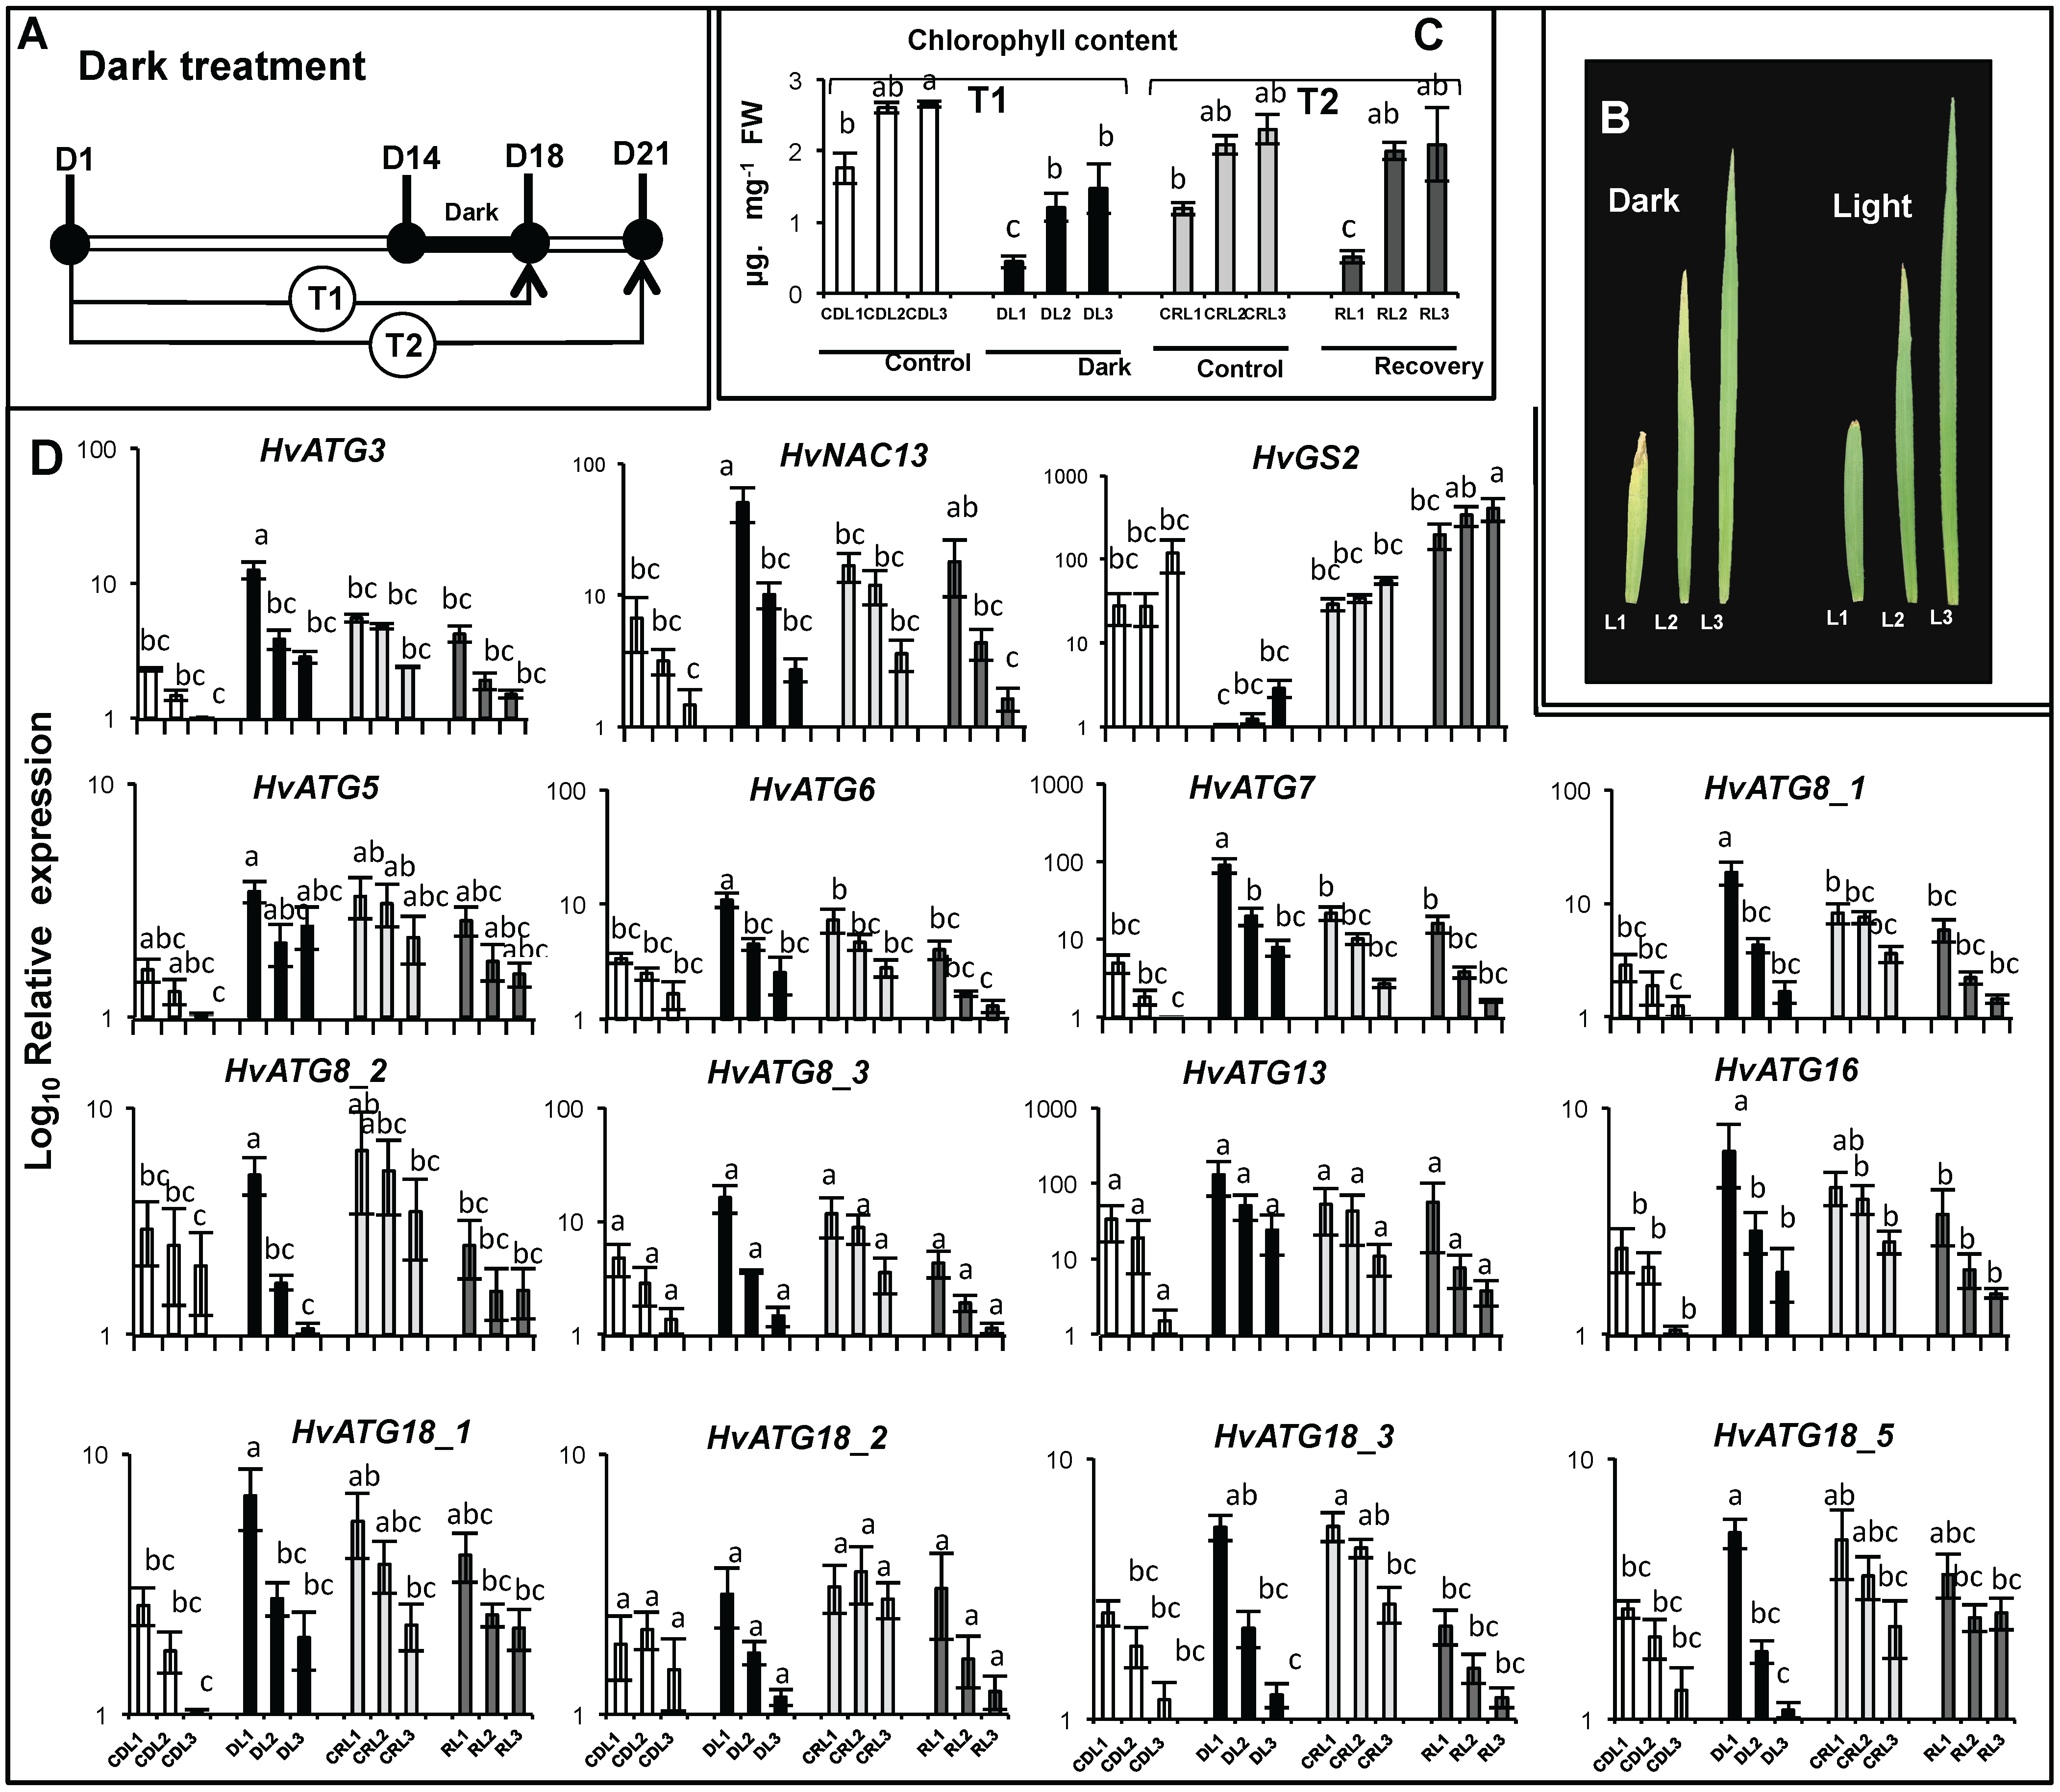
3.4. HvATG Transcript Levels in Seedling Leaves During Senescence and in Response to Nitrate Shortage or Dark Treatment

The three leaf ranks, L1, L2 and L3, which were collected separately from seedlings grown under low (LN) or high (HN) nitrate conditions were analyzed first. For most of the HvATG genes, with the exception of the regulatory HvATG13 genes and HvATG5, we observed that mRNA levels increased with leaf ageing and were higher in the oldest leaves (L1) (Figure 6D) than in the others. In addition, their expression levels were higher in plants grown under LN conditions compared to HN, with the only exception being HvATG8_3, which showed a lower level in plants grown in LN (Figure 6D).
In order to perform carbon limitation, barley plants were submitted to dark treatment for 4 d (Figure 7A). After dark treatment (at T1), leaves from the three leaf ranks, L1, L2 and L3, were collected. After dark treatment, some of the dark-treated plants continued to grow under normal day/night conditions for three more days and were collected at T2 after this designated recovery treatment.
At T1, the dark treated plants exhibited more chlorosis than control plants (Figure 7B). Chlorophyll content decreased during the dark period and increased afterward during the recovery time (Figure 7C), suggesting that the senescence process was reversed when light was restored. In good agreement, the HvNAC13 transcripts increased during the dark treatment and decreased during the recovery time, while the HvGS2 transcript levels showed exactly the reverse pattern (Figure 7D).
In all samples harvested at T1 and T2 from the dark-treated and control plants, we observed that all HvATG genes were more expressed in the old leaves than in the young ones (Figure 7D). We also observed that most of the HvATG transcript levels were higher in dark treated leaves than in control leaves at T1. The positive effect of dark treatment on HvATG transcript levels was transient and was completely abolished after recovery treatment at T2. Surprisingly, for a few genes like HvATG3, HvATG8_2, HvATG8_3, HvATG18_2 and HvATG18_3, the transcript levels at T2 were lower in the dark-treated leaves than in the control ones showing the strong effect of the C/N status of the plant on the regulation of autophagy genes.

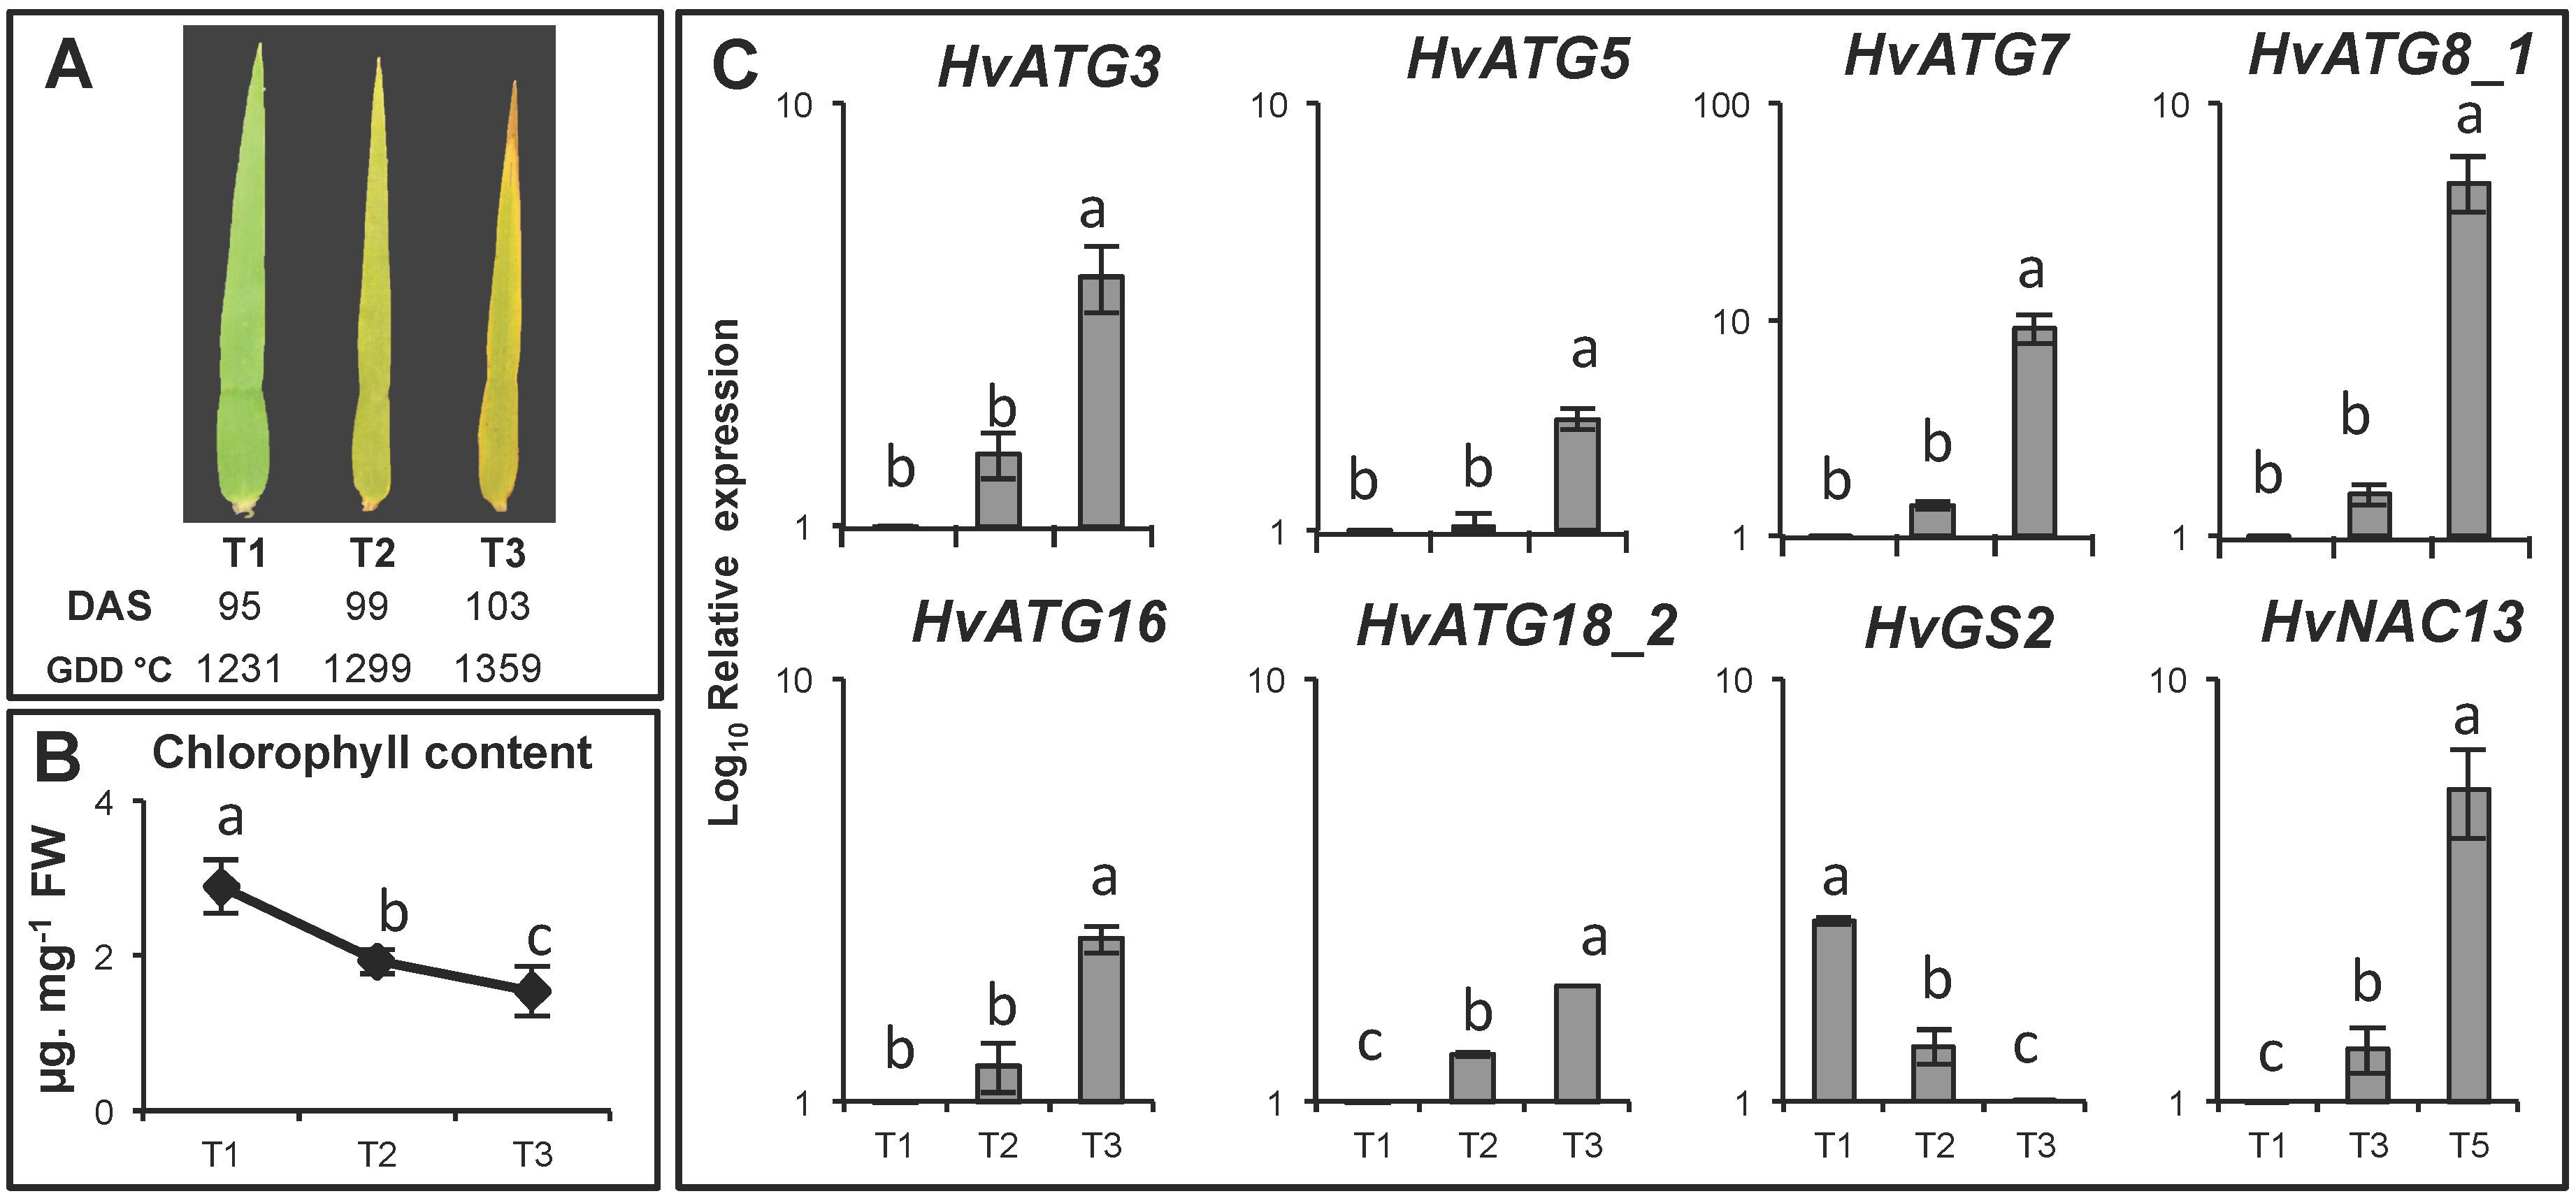
3.5. HvATG Transcript Levels in the Flag Leaf During Senescence

Because flag leaves cannot be obtained in our growth chamber conditions, field experiments were preferred. Flag leaves were harvested from field grown barley cv. Carina as we described in our previous paper [38]. Flag leaves were harvested at three time points after sowing: T1 (95 DAS), T2 (99 DAS) and T3 (103 DAS) (Figure 8A). Senescence was determined by chlorophyll content (Figure 8B) and by the expression of the HvNAC13 and HvGS2 marker genes (Figure 8C). Both showed that T1 represents a young leaf, T2 represents a mature leaf and T3 represents a senescing leaf.
In good agreement with previous finding on seedlings, we found that the HvATG transcript levels were increased in the senescing leaves (T3) compared to the young leaves (T1) and to the mature leaves (T2). More interestingly, the HvATG5 transcript clearly increased with flag leaf senescence, although such a senescence-related pattern was not observed on seedling leaves

4. Discussion

In all organisms, recycling of intracellular constituents is critical for growth, survival under nutrient limiting conditions and for the quality control of cell proteins and organelles. Since plants are sessile organisms, recycling is especially important. Plants have adapted to poor environments by storing nutrients when available and remobilizing them to support the growth of the new organs and the formation and the filling of the seeds. We recently showed in Arabidopsis that autophagy is important for nitrogen use efficiency and especially for the remobilization of nitrogen from the rosette leaves to the seeds [18,19]. Similar features were demonstrated in maize [20] and there are several lines of evidence that autophagy also plays a role for nitrogen recycling in rice [21] In addition, Masclaux-Daubresse et al. [24] also showed that autophagy is globally important for metabolic and redox homeostasis in the leaves, especially under nitrate limitation. Links between autophagy, redox and stress resistance have been described in Arabidopsis in several reports [39,40,41,42,43] and autophagy also seems involved in plant immunity [44,45].
The identification of barley sequences of autophagy genes and the characterization of their patterns of expression in response to ageing, nitrate-shortage or dark-treatment should then pave the way for further investigations of the roles of autophagy in barley and wheat.
Barley genes identified in this report were found by searching ATG homologous cDNA, EST and BAC sequences in barley libraries, and by aligning the cDNA sequences found with genomic sequences in order to establish the HvATG gene models. The use of rice (OsATG), Arabidopsis (AtATG) and yeast (ScATG) ATGs as queries was sufficient to optimize the number of genes found. In addition, by proceeding in this way we ensured that all of the 24 HvATG genes described in this report (Figure 1) are translated into mRNA. We verified that the proteins encoded share all the characteristics and essential amino acids known from studies performed on other ATG gene homologues in plants, animals and yeast. In addition, starting from the cDNA clones, we identified a new splice variant of HvATG5 that was not proposed by the genome assembly database, EnsemblPlants (http://plants.ensembl.org/index.html). In the case of ATG5, which is highly important for the autophagy machinery in both plants and animals [10], the 5′ sequence region of the HvATG5 coding sequence was missing from the genome sequence, and this was likely due to the difficulty of sequencing the high GC content of this 5′ end. Functionality of the HvATG5 CDS clone was verified through the transformation of the Arabidopsis atg5 mutant [10,46]. This allowed us to observe the suppressed phenotypes of complemented lines and the recovery of autophagic bodies in their vacuoles.
In their report, Chung et al. [7] interpreted the diversity of the ATG splice variants as an adaptation of plants to the complex response of autophagy activity to developmental and environmental cues. In our case, the cDNA and EST sequences suggest that only one functional splice variant exists for each HvATG gene. The presence of several different HvATG8 and HvATG18 genes in the barley genome—as also observed in other plants and animals, but not in yeast—suggests that autophagic machinery has adapted to environmental and developmental changes by duplicating these ATG genes [47], thereby providing several protein isoforms coded by different genes rather than deriving isoforms from different splice variants of the same gene. In the case of HvATG8, the results also showed that the different HvATG8 genes are differentially regulated post-transcriptionally. Indeed, the HvATG8_1 and HvATG8_2 genes show a canonical cleavage site of the ATG4 proteolytic activity at Gly117 and a C-terminal sequence that needs to be removed to allow ATG8 lipidation, whereas HvATG8_3 does not.
The three HvATG8 and five HvATG18 genes found in barley did not show the same responses to ageing, nitrogen limitation or carbon limitation. This is in good agreement with the idea that they could display specificities. HvATG8_1 was highly induced by leaf senescence but more specifically under low nitrate conditions, while HvATG8_3 was highly induced by leaf senescence especially under high nitrate conditions. HvATG8_2 was equally induced by leaf senescence under high or low nitrate conditions. Similarly, the HvATG18 genes showed specific responses to leaf senescence depending on nitrate conditions. If the ATG8 proteins participate in cargo recognition as suggested by several reports [31], it could be that the different isoforms do not target the same cargos.
Consistent with Arabidopsis studies, we found that most of the HvATG genes were induced by N limitation, in response to darkness and during leaf senescence [48,49,50,51]. The gene with the lowest response to all these conditions was HvATG5. Interestingly, the effect of leaf senescence on the HvATG5 expression level was much more perceptible in the flag leaves than in the seedling leaves. This could be related to the importance of the flag leaf in processes involved in nitrogen remobilization to the seeds [19,20].
The present report gives the first characterization of the HvATG genes. The barley sequences will be useful for transcriptome studies and further investigations of the role of autophagy in nitrogen remobilization, grain yield and grain quality in barley and wheat [50]. While mutations in autophagy genes affect plant yield and nutrient use efficiency, two reports indicate that over-expressing autophagy genes can improve plant performance and tolerance to various stresses [40,52]. Although barley transformation remains difficult and very slow, the results presented in this report will facilitate the manipulation of autophagy genes in barley.

Supplementary Files

Supplementary File 1

Acknowledgments

The authors thank Joël Talbotec (INRA Versailles, France) for taking care of the plants, Pr Karin Krupinska (University of Kiel, Kiel, Germany) for facilitating plant material harvest during the field experiment, Kohki Yoshimoto (INRA Versailles, France) for advice, and Laurence Cantrill for correcting English writing. The authors also thank the National Institute of Agrobiological Sciences, NIAS, for providing the BAC clone NIASHv2006J04 containing the HvATG5 CDS. Funding: This work was supported by the FP7 Marie Curie Actions—Networks for Initial Training Project FP7-MC-ITN No. 264394 acronym CropLife for L.A.-O.

Author Contributions

L.A.-O. has performed all the experiments, computed data and participated to the writing of the manuscript. A.M. has performed RT-qPCR on Arabidopsis plants and provided advice for all the cloning steps. F.S. provided technical assistance in growing plants and selecting Arabidopsis transformants. C.M.-D. has supervised the all work and written the manuscript.

Conflicts of Interest

The authors declare no conflict of interest.

References

  1. Tsukada, M.; Ohsumi, Y. Isolation and characterization of autophagy-defective mutants of saccharomyces-cerevisiae. Febs Lett. 1993, 333, 169–174. [Google Scholar] [CrossRef]
  2. Baba, M.; Takeshige, K.; Baba, N.; Ohsumi, Y. Ultrastructural analysis of the autophagic process in yeast—Detection of autophagosomes and their characterization. J. Cell Biol. 1994, 124, 903–913. [Google Scholar] [CrossRef] [PubMed]
  3. Takeshige, K.; Baba, M.; Tsuboi, S.; Noda, T.; Ohsumi, Y. Autophagy in yeast demonstrated with proteinase-deficient mutants and conditions for its induction. J. Cell Biol. 1992, 119, 301–311. [Google Scholar] [CrossRef] [PubMed]
  4. Doelling, J.H.; Walker, J.M.; Friedman, E.M.; Thompson, A.R.; Vierstra, R.D. The apg8/12-activating enzyme apg7 is required for proper nutrient recycling and senescence in arabidopsis thaliana. J. Biol. Chem. 2002, 277, 33105–33114. [Google Scholar] [CrossRef] [PubMed]
  5. Hanaoka, H.; Noda, T.; Shirano, Y.; Kato, T.; Hayashi, H.; Shibata, D.; Tabata, S.; Ohsumi, Y. Leaf senescence and starvation-induced chlorosis are accelerated by the disruption of an arabidopsis autophagy gene. Plant Physiol. 2002, 129, 1181–1193. [Google Scholar] [CrossRef] [PubMed]
  6. Xiong, Y.; Contento, A.L.; Bassham, D.C. Atatg18a is required for the formation of autophagosomes during nutrient stress and senescence in arabidopsis thaliana. Plant J. 2005, 42, 535–546. [Google Scholar] [CrossRef] [PubMed]
  7. Chung, T.J.; Suttangkakul, A.; Vierstra, R.D. The ATG autophagic conjugation system in maize: Atg transcripts and abundance of the atg8-lipid adduct are regulated by development and nutrient availability. Plant Physiol. 2009, 149, 220–234. [Google Scholar] [CrossRef] [PubMed]
  8. Xia, K.; Liu, T.; Ouyang, J.; Wang, R.; Fan, T.; Zhang, M. Genome-wide identification, classification, and expression analysis of autophagy-associated gene homologues in rice (oryza sativa l.). DNA Res. 2011, 18, 363–377. [Google Scholar] [CrossRef] [PubMed]
  9. Mizushima, N.; Komatsu, M. Autophagy: Renovation of cells and tissues. Cell 2011, 147, 728–741. [Google Scholar] [CrossRef] [PubMed]
  10. Thompson, A.R.; Doelling, J.H.; Suttangkakul, A.; Vierstra, R.D. Autophagic nutrient recycling in arabidopsis directed by the ATG8 and ATG12 conjugation pathways. Plant Physiol. 2005, 138, 2097–2110. [Google Scholar] [CrossRef] [PubMed]
  11. Li, F.; Vierstra, R.D. Autophagy: A multifaceted intracellular system for bulk and selective recycling. Trends Plant Sci. 2012, 17, 526–537. [Google Scholar] [CrossRef] [PubMed]
  12. Liu, Y.; Bassham, D.C. Autophagy: Pathways for self-eating in plant cells. Ann. Rev. Plant Biol. 2012, 63, 215–237. [Google Scholar] [CrossRef] [PubMed]
  13. Svenning, S.; Lamark, T.; Krause, K.; Johansen, T. Plant NBR1 is a selective autophagy substrate and a functional hybrid of the mammalian autophagic adapters NBR1 and p62/sqstm1. Autophagy 2011, 7, 993–1010. [Google Scholar] [CrossRef] [PubMed]
  14. Zientara-Rytter, K.; Lukomska, J.; Moniuszko, G.; Gwozdecki, R.; Surowiecki, P.; Lewandowska, M.; Liszewska, F.; Wawrzynska, A.; Sirko, A. Identification and functional analysis of JOKA2, a tobacco member of the family of selective autophagy cargo receptors. Autophagy 2011, 7, 1145–1158. [Google Scholar] [CrossRef] [PubMed] [Green Version]
  15. Honig, A.; Avin-Wittenberg, T.; Galili, G. Selective autophagy in the aid of plant germination and response to nutrient starvation. Autophagy 2012, 8, 838–839. [Google Scholar] [CrossRef] [PubMed]
  16. Avin-Wittenberg, T.; Honig, A.; Galili, G. Variations on a theme: Plant autophagy in comparison to yeast and mammals. Protoplasma 2012. [Google Scholar] [CrossRef] [PubMed]
  17. Michaeli, S.; Avin-Wittenberg, T.; Galili, G. Involvement of autophagy in the direct er to vacuole protein trafficking route in plants. Front. Plant Sci. 2014, 5. [Google Scholar] [CrossRef] [PubMed]
  18. Guiboileau, A.; Avila-Ospina, L.; Yoshimoto, K.; Soulay, F.; Azzopardi, M.; Marmagne, A.; Lothier, J.; Masclaux-Daubresse, C. Physiological and metabolic consequences of autophagy defisciency for the management of nitrogen and protein resources in arabidopsis leaves depending on nitrate availability. New Phytol. 2013, 199, 683–694. [Google Scholar] [CrossRef] [PubMed] [Green Version]
  19. Guiboileau, A.; Yoshimoto, K.; Soulay, F.; Bataillé, M.; Avice, J.; Masclaux-Daubresse, C. Autophagy machinery controls nitrogen remobilization at the whole-plant level under both limiting and ample nitrate conditions in arabidopsis. New Phytol. 2012, 194, 732–740. [Google Scholar] [CrossRef] [PubMed]
  20. Li, F.; Chung, T.; Pennington, J.G.; Federico, M.L.; Kaeppler, H.F.; Kaeppler, S.M.; Otegui, M.S.; Vierstra, R.D. Autophagic recycling plays a central role in maize nitrogen remobilization. Plant cell 2015, 27, 1389–1408. [Google Scholar] [CrossRef] [PubMed]
  21. Wada, S.; Hayashida, Y.; Izumi, M.; Kurusu, T.; Hanamata, S.; Kanno, K.; Kojima, S.; Yamaya, T.; Kuchitsu, K.; Makino, A.; et al. Autophagy supports biomass production and nitrogen use efficiency at the vegetative stage in rice. Plant Physiol. 2015, 168, U60–U721. [Google Scholar] [CrossRef] [PubMed]
  22. Kurusu, T.; Koyano, T.; Hanamata, S.; Kubo, T.; Noguchi, Y.; Yagi, C.; Nagata, N.; Yamamoto, T.; Ohnishi, T.; Okazaki, Y.; et al. Osatg7 is required for autophagy-dependent lipid metabolism in rice postmeiotic anther development. Autophagy 2014, 10, 878–888. [Google Scholar] [CrossRef] [PubMed]
  23. Merkulova, E.A.; Guiboileau, A.; Naya, L.; Masclaux-Daubresse, C.; Yoshimoto, K. Assessment and optimization of autophagy monitoring methods in arabidopsis roots indicate direct fusion of autophagosomes with vacuoles. Plant Cell Physiol. 2014, 55, 715–726. [Google Scholar] [CrossRef] [PubMed]
  24. Masclaux-Daubresse, C.; Clément, G.; Anne, P.; Routaboul, J.; Guiboileau, A.; Soulay, F.; Shirasu, K.; Yoshimoto, K. Stitching together the multiple dimensions of autophagy using metabolomic and transcriptomic analyses reveals new impacts of autophagy defects on metabolism, development and plant response to environment. Plant Cell 2014, 26, 1857–1877. [Google Scholar] [CrossRef] [PubMed]
  25. Mayer, K.; Waugh, R.; Langridge, P.; Close, T.; Wise, R.; Graner, A.; Matsumoto, T.; Sato, K.; Schulman, A.; Muehlbaue, G.; et al. A physical, genetic and functional sequence assembly of the barley genome. Nature 2012, 491, 711–716. [Google Scholar] [CrossRef] [PubMed]
  26. Consortium, T. A physical, genetic and functional sequence assembly of the barley genome. Nature 2012, 491, 711–717. [Google Scholar]
  27. Altschul, S.F.; Lipman, D.J. Protein database searches for multiple alignments. Proc. Natl. Acad. Sci. USA 1990, 87, 5509–5513. [Google Scholar] [CrossRef] [PubMed]
  28. Thompson, J.; Higgins, D.; Gibson, T. Clustal W: Improving the sensitivity of progressive multiple sequence alignment through sequence weighting, position-specific gap penalties and weight matrix choice. Nucleic Acids Res. 1994, 22, 4673–4680. [Google Scholar] [CrossRef] [PubMed]
  29. Vandesompele, J.; De Preter, K.; Pattyn, F.; Poppe, B.; Van Roy, N.; De Paepe, A.; Speleman, F. Accurate normalization of real-time quantitative RT-PCR data by geometric averaging of multiple internal control genes. Genome Biol. 2002, 3, RESEARCH0034. [Google Scholar] [CrossRef] [PubMed] [Green Version]
  30. Arnon, D.I. Copper enzymes in isolated chloroplasts. Polyphenol oxidase in beta vulgaris. Plant Physiol. 1949, 24, 1–15. [Google Scholar] [CrossRef] [PubMed]
  31. Noda, N.N.; Ohsumi, Y.; Inagaki, F. Atg8-family interacting motif crucial for selective autophagy. Febs Lett. 2010, 584, 1379–1385. [Google Scholar] [CrossRef] [PubMed]
  32. Noda, N.N.; Satoo, K.; Fujioka, Y.; Kumeta, H.; Ogura, K.; Nakatogawa, H.; Ohsumi, Y.; Inagaki, F. Structural basis of ATG8 activation by a homodimeric E1, ATG7. Mol. Cell 2011, 44, 462–475. [Google Scholar] [CrossRef] [PubMed]
  33. Noda, N.N.; Kobayashi, T.; Adachi, W.; Fujioka, Y.; Ohsumi, Y.; Inagaki, F. Structure of the novel c-terminal domain of vacuolar protein sorting 30/autophagy-related protein 6 and its specific role in autophagy. J. Biol. Chem. 2012, 287, 16256–16266. [Google Scholar] [CrossRef] [PubMed]
  34. Papinski, D.; Schuschnig, M.; Reiter, W.; Wilhelm, L.; Barnes, C.A.; Maiolica, A.; Hansmann, I.; Pfaffenwimmer, T.; Kijanska, M.; Stoffel, I.; et al. Early steps in autophagy depend on direct phosphorylation of Atg9 by the ATG1 kinase. Mol. Cell 2014, 53, 515–515. [Google Scholar] [CrossRef]
  35. Jao, C.C.; Ragusa, M.J.; Stanley, R.E.; Hurley, J.H. What the n-terminal domain of Atg13 looks like and what it does a horma fold required for ptdins 3-kinase recruitment. Autophagy 2013, 9, 1112–1114. [Google Scholar] [CrossRef] [PubMed]
  36. Fujioka, Y.; Noda, N.N.; Fujii, K.; Yoshimoto, K.; Ohsumi, Y.; Inagaki, F. In vitro reconstitution of plant Atg8 and Atg12 conjugation systems essential for autophagy. J. Biol. Chem. 2008, 283, 1921–1928. [Google Scholar] [CrossRef] [PubMed]
  37. Yoshimoto, K.; Hanaoka, H.; Sato, S.; Kato, T.; Tabata, S.; Noda, T.; Ohsumi, Y. Processing of Atg8s, ubiquitin-like proteins, and their deconjugation by Atg4s are essential for plant autophagy. Plant Cell 2004, 16, 2967–2983. [Google Scholar] [CrossRef] [PubMed]
  38. Avila-Ospina, L.; Marmagne, A.; Talbotec, J.; Krupinska, K.; Masclaux-Daubresse, C. The identification of new cytosolic glutamine synthetase and asparagine synthetase genes in barley (hordeum vulgare l.), and their expression during leaf senescence. J. Exp. Bot. 2015, 66, 2013–2026. [Google Scholar] [CrossRef] [PubMed]
  39. Phillips, A.R.; Suttangkakul, A.; Vierstra, R.D. The Atg12-conjugating enzyme Atg10 is essential for autophagic vesicle formation in arabidopsis thaliana. Genetics 2008, 178, 1339–1353. [Google Scholar] [CrossRef] [PubMed]
  40. Slavikova, S.; Ufaz, S.; Avin-Wittenberg, T.; Levanony, H.; Galili, G. An autophagy-associated Atg8 protein is involved in the responses of arabidopsis seedlings to hormonal controls and abiotic stresses. J. Exp. Bot. 2008, 59, 4029–4043. [Google Scholar] [CrossRef] [PubMed]
  41. Xiong, Y.; Contento, A.L.; Nguyen, P.Q.; Bassham, D.C. Degradation of oxidized proteins by autophagy during oxidative stress in arabidopsis. Plant Physiol. 2007, 143, 291–299. [Google Scholar] [CrossRef] [PubMed]
  42. Xiong, Y.; Contento, A.L.; Bassham, D.C. Disruption of autophagy results in constitutive oxidative stress in arabidopsis. Autophagy 2007, 3, 257–258. [Google Scholar] [CrossRef] [PubMed]
  43. Liu, Y.; Xiong, Y.; Bassham, D.C. Autophagy is required for tolerance of drought and salt stress in plants. Autophagy 2009, 5, 954–963. [Google Scholar] [CrossRef] [PubMed]
  44. Yoshimoto, K.; Jikumaru, Y.; Kamiya, Y.; Kusano, M.; Consonni, C.; Panstruga, R.; Ohsumi, Y.; Shirasu, K. Autophagy negatively regulates cell death by controlling NPR1-dependent salicylic acid signaling during senescence and the innate immune response in arabidopsis. Plant Cell 2009, 21, 2914–2927. [Google Scholar] [CrossRef] [PubMed]
  45. Lai, Z.; Wang, F.; Zheng, Z.; Fan, B.; Chen, Z. A critical role of autophagy in plant resistance to necrotrophic fungal pathogens. Plant J. 2011, 66, 953–968. [Google Scholar] [CrossRef] [PubMed]
  46. Inoue, Y.; Suzuki, T.; Hattori, M.; Yoshimoto, K.; Ohsumi, Y.; Moriyasu, Y. Atatg genes, homologs of yeast autophagy genes, are involved in constitutive autophagy in arabidopsis root tip cells. Plant Cell Physiol. 2006, 47, 1641–1652. [Google Scholar] [CrossRef] [PubMed]
  47. Shpilka, T.; Weidberg, H.; Pietrokovski, S.; Elazar, Z. Atg8: An autophagy-related ubiquitin-like protein family. Genome Biol. 2011, 12, 226. [Google Scholar] [CrossRef] [PubMed]
  48. Breeze, E.; Harrison, E.; McHattie, S.; Hughes, L.; Hickman, R.; Hill, C.; Kiddle, S.; Kim, Y.-S.; Penfold, C.A.; Jenkins, D.; et al. High-resolution temporal profiling of transcripts during arabidopsis leaf senescence reveals a distinct chronology of processes and regulation. Plant Cell 2011, 23, 873–894. [Google Scholar] [CrossRef] [PubMed]
  49. Avila-Ospina, L.; Moison, M.; Yoshimoto, K.; Masclaux-Daubresse, C. Autophagy, plant senescence, and nutrient recycling. J. Exp. Bot. 2014, 65, 3799–3811. [Google Scholar] [CrossRef] [PubMed]
  50. Hollmann, J.; Gregersen, P.L.; Krupinska, K. Identification of predominant genes involved in regulation and execution of senescence-associated nitrogen remobilization in flag leaves of field grown barley. J. Exp. Bot. 2014, 65, 2963–3973. [Google Scholar] [CrossRef] [PubMed]
  51. Rose, T.L.; Bonneau, L.; Der, C.; Marty-Mazars, D.; Marty, F. Starvation-induced expression of autophagy-related genes in arabidopsis. Biol. Cell 2006, 98, 53–67. [Google Scholar] [CrossRef] [PubMed]
  52. Xia, T.; Xiao, D.; Liu, D.; Chai, W.; Gong, Q.; Wang, N.N. Heterologous expression of Atg8c from soybean confers tolerance to nitrogen deficiency and increases yield in arabidopsis. PLoS ONE 2012, 7, e37217. [Google Scholar] [CrossRef] [PubMed]
Figure 1. Diagram of barley HvATG genes. Gene structures were deduced from the sequences of cDNA, EST, and BAC clone libraries and alignments with genomic sequences (see Methods) using the genome assembly database EnsemblPlants (http://plants.ensembl.org/index.html). White boxes ( ) represent untranslated regions; black boxes ( ) represent coding regions and solid lines (\/) represent introns. The predicted amino acid (aa) length for each of the corresponding proteins is shown at right. HvATG gene families are highlighted in grey. Upper bars correspond to 0.1 Kbp.
Agronomy 06 00015 g001
Figure 2. Protein alignment of the ATG8 family. ATG8 proteins of different species including the three isoforms of HvATG8 were aligned using ClustalW. Only one isoform of the ATG8 protein in other species was used for the alignment. Conserved amino acids (aa) are shown by shades of blue ranging from less conserved aa (light blue) to more conserved aa (dark blue). The secondary structural elements of S. cerevisiae ATG8 are shown above the alignment [31]. The scissile ATG4 cleavage site is shown by the vertical black arrow. Secondary structural elements of ScATG8 are shown above the alignment. Species abbreviations are as follows: Hv (Hordeum vulgare), At (Arabidopsis thaliana), Os (Oryza sativa), Zm (Zea mays), Ta (Triticum aestivum), Bd (Brachypodium distachium), Sc (Saccharomyces cerevisiae), Dm (Drosophila melanogaster), Hs (Homo sapiens), Mm (Mus musculus).
Agronomy 06 00015 g002
Figure 3. The sequence gap in the coding region of HvATG5 genome sequence codes for amino acids essential for monocot clustering. (A) The HvATG5 gene model obtained from the EST (expressed sequence tag) sequence analyzed in this study (shown in rectangle) is different from the splice variants (HvATG5 sv1; sv2 and sv3) predicted and provided by the genome assembly database EnsemblPlants (http://plants.ensembl.org/index.html). White boxes ( ) represent untranslated regions, black boxes ( ) represent coding regions, solid lines (\/) represent introns, and the grey box ( ) indicates the sequence missing in the genome sequence but found in the EST coding region of X-contig-57680. (B) The HvATG5 protein sequence deduced from the HvATG5 sequence of X-contig-57680 clusters with the ATG5 proteins of monocots. Phylogenetic analysis was performed using the MABL program available online (http://www.phylogeny.fr/simple_phylogeny.cgi). Species abbreviations: Hv (Hordeum vulgare), Os (Oryza sativa), Zm (Zea mays), Bd (Brachypodium distachium), So (Saccharum officinarum), Sb (Sorghum bicolor), At (Arabidopsis thaliana), Rc (Ricinus communis), Sc (Saccharomyces cerevisiae), Dm (Drosophila melanogaster), Hs (Homo sapiens), Mm (Mus musculus).
Agronomy 06 00015 g003
Figure 4. Early senescence and low biomass phenotypes of Arabidopsis autophagy defective atg5 mutants are suppressed by the over expression of the barley HvATG5 CDS. (A) HvATG5 was introduced in atg5 by agroinfection and the HvATG5 expression level was monitored using RT-qPCR in the three atg5 HvATG5 over-expressors (lines 2.3, 3.1 and 4.1) using HvATG5-specific primers. Relative expression values of HvATG5 were calculated using Actin as a reference gene (2ΔΔCT) and are presented as fold change relative to the Actin expression level. In Col and atg5, the HvATG5 expression level was null. (B) Macrophenotype of atg5 (red tag), WT (white tag), and the three atg5 HvATG5 over-expressor lines selected (line 2.3, yellow; line 3.1, blue; line 4.1, pink) show the suppression of rosette senescence, low biomass and short stem size phenotypes observed in the atg5 mutant. (C) Rosette senescence phenotype of the Col, atg5 and atg5 HvATG5 over-expressor line 4.1. Planting of the three independent transformants and their control lines was repeated twice and included several plants per genotype (n = 8). Transformants displayed similar recovery phenotypes compared to atg5 over all the repeats.
Agronomy 06 00015 g004
Figure 5. Accumulation of autophagic bodies in Arabidopsis atg5 mutant complemented with the HvATG5 CDS. atg5 (A); wild type (B); and the atg5 35S::HvATG5 transformant (C) toots were incubated with MS medium containing concanamycin A for 6 h and then observed by conventional transmission light microscopy. The same experiment was performed twice on the roots of the three lines 4.1, 2.3 and 3.1 and all the assays confirmed the presence of autophagic bodies in the roots of transformants and WT and absence from roots of atg5. Only pictures of the line 4.1 are presented here. The black arrows indicate the autophagic bodies located inside the vacuole.
Agronomy 06 00015 g005
Figure 6. Transcript levels of HvATG genes are higher in leaves of seedlings grown under low nitrate (LN) compared to high nitrate (HN) conditions. (A) Leaf ranks of 20-day-old plants grown under low (0.5 mM NO3) and high nitrate (5 mM NO3). (B) Chlorophyll content of L1, L2 and L3 from LN (light grey bars) and HN (dark grey bars). (C) Transcript levels of HvNAC13 (Senescence Associated Gene) and HvGS2 (Senescence Repressed Gene) show opposite patterns. (D) Transcript levels of HvATG. Transcript levels were measured by RT-qPCR. Only leaf ranks L1, L2 and L3 from both LN and HN plants were analyzed. Results are shown as Log10 relative expression values. Data are mean ± SD of three independent biological replicates. The different letters indicate values significantly different at p < 0.05 as determined using XLSTAT ANOVA Newman–Keuls (SNK) comparisons. Similar results have been obtained on two independent cultures. HvGAPDH was used as the reference gene.
Agronomy 06 00015 g006
Figure 7. Transcript levels of HvATG genes in seedlings after dark treatment. (A) H. vulgare cv. Golden Promise seedlings were kept in the dark (Dark-treated Leaves, DL; dark bars) or not (Control of Dark-treated Leaves, CDL; white bars) for four days and harvested 18 days after sowing (T1; D18). After the dark period, plants were kept growing for three more days (from D18 to D21) to test recovery under a normal day/night photoperiod. Leaves of control plants (CRL; light grey bars) and of recovering plants after dark treatment (RL; dark grey bars) were harvested at T2. (B) Leaf ranks L1, L2 and L3 harvested after dark treatment, at T1 on control and treated plants. (C) Chlorophyll content of leaves from controls (CDL and CRL) and treated plants (DL and RL) at T1 and T2. (D) Transcript levels of HvNAC13, HvGS2 and HvATG were measured by RT-qPCR in leaf ranks of seedlings submitted or not to dark treatment. Results are shown as Log10 relative expression for each gene. Data are mean ± SD of three independent biological replicates. The different letters indicate values significantly different at p < 0.05 as determined using XLSTAT ANOVA Newman–Keuls (SNK) comparisons. HvGAPDH was used as the reference gene. Similar results have been obtained on two independent cultures.
Agronomy 06 00015 g007
Figure 8. Transcript levels of HvATG were increased in flag leaves during senescence. (A) H. vulgare cv. Carina flag leaves were harvested at different time points (T1: 95 DAS; T2: 99 DAS; T3: 103 DAS; DAS days after sowing). (B) Chlorophyll content decrease with leaf ageing. (C) Transcript levels of HvNAC13, HvGS2 and HvATG genes were measured by RT-qPCR. Results are shown as Log10 relative expression for each gene. Data are mean ± SD of three independent biological replicates. The different letters indicate values significantly different at p < 0.05 as determined using XLSTAT ANOVA Newman–Keuls (SNK) comparisons. HvActin was used as the reference gene.
Agronomy 06 00015 g008
Table 1. List of barley ATG genes.
GeneBAC ClonesGene ID EMBL-EBIAccession No. NCBI or UniProt ***H.vulgare Genomic seq.No. of AA ResiduesIdentity to
S. cerevisiaeA. thaliana *O. sativa **
HvATG1_1NIASHv2141K06MLOC_55869AK371799x_contig_4034762628%45%69%
HvATG1_2-MLOC_1553M0UXZ8 ***x_contig_11371347018%28%29%
HvATG2_1-MLOC_14121M0UTQ2 ***x_contig_1567298159717%34%69%
HvATG2_2-MLOC_4729M0WB65 ***x_contig_135441155317%32%66%
HvATG3FLbaf179k14MLOC_66486AK252967x_contig_5162631626%71%89%
HvATG4-MLOC_62924M0XTP6 ***x_contig_4709935030%54%77%
HvATG5NIASHv2006J04MLOC_70253AK362511x_contig_5768037113%48%72%
HvATG6NIASHv2011D22MLOC_71271AK362923, AM075824x_contig_5946350419%37%85%
HvATG7NIASHv2065A17MLOC_20377AK367931x_contig_15894469528%34%49%
HvATG8_1FLbaf129h07MLOC_74964AK251678x_contig_6687112271%86%87%
HvATG8_2FLbaf5e12MLOC_18032AK248733x_contig_157899411973%81%93%
HvATG8_3FLbaf77m18MLOC_62061AK250515x_contig_4616211648%47%50%
HvATG9NIASHv2013F07MLOC_54359AM085509, AK363183x_contig_3907189013%48%79%
HvATG10-MLOC_73839M0YWL5 ***X_contig_6453714210%24%50%
HvATG11-MLOC_53194AK365876x_contig_3813498618%44%71%
HvATG12-MLOC_55583-x_contig_400859235%74%73%
HvATG13NIASHv2035H08MLOC_12860AK365609x_contig_156427954010%24%76%
HvATG16NIASHv1141N15MLOC_66915AK361491x_contig_522785166%50%77%
HvATG18_1NIASHv2028H07MLOC_56544AK364793x_contig_4093448316%58%77%
HvATG18_2NIASHv2141H12MLOC_74982AK371787x_contig_669023216%17%17%
HvATG18_3NIASHv2025P14MLOC_56913AK364502x_contig_4123938519%42%38%
HvATG18_4NIASHv2073H03MLOC_4865AK368421x_contig_1355959127%6%6%
HvATG18_5NIASHv2002C04, NIASHv2139D21MLOC_24797AK362065, AK371649x_contig_165567910196%6%5%
M. musculusA. thaliana *O. sativa **
HvATG101-MLOC_40301M0W150 ***x_contig_255802421524%58%81%
HvNBR1-MLOC_74717M0YZ84 ***X_contig_6641285923%40%71%
HvATI1-MLOC_80474M0ZAS9 ***X_contig_9070212-32%58%
Sequences compared with the single gene product in yeast and the isoforms of Arabidopsis* and rice**; AA. Amino acids.

