Article

A Short Non-Saline Sprinkling Increases the Tuber Weights of Saline Sprinkler Irrigated Potatoes

1
South Australian Research and Development Institute, PIRSA, Loxton Centre, P.O. Box 411, Loxton, SA 5333, Australia
2
Sentek Pty Ltd., 77 Magill Rd., Stepney, SA 5069, Australia
3
School of Medicine, Flinders University, G.P.O. Box 2100, Adelaide, SA 5001, Australia
*
Author to whom correspondence should be addressed.
Agronomy 2017, 7(1), 4; https://doi.org/10.3390/agronomy7010004
Submission received: 31 August 2016 / Revised: 4 December 2016 / Accepted: 15 December 2016 / Published: 3 January 2017
(This article belongs to the Special Issue Crop Salinity Tolerance)

Abstract

:
Previous work has shown that a short non-saline sprinkling, following saline sprinkling, increased crop growth. We incorporated this finding into an investigation of two approaches to the conjunctive use of saline and non-saline water sources for sprinkler irrigation of potatoes viz., (i) mixing waters prior to application, and (ii) keeping waters temporally separate, that is commencing each irrigation with saline water and finishing it with non-saline sprinkling. The latter approach delayed canopy senescence and increased tuber weight by at least 150%. Under both approaches, soil salinities and leaf and tuber concentrations of Na+ and Cl were similar. Thus, the advantages of a non-saline sprinkling cannot be explained in terms of its effect on either soil osmotic potential or bulk tissue concentrations of putatively toxic ions Na+ and Cl. We propose that the positive effect of finishing irrigations with a non-saline sprinkling may be attributed to either dilution, and hence increase in osmotic potential, of the water film that remains on the leaf after each irrigation or its effect on the distribution of the putatively toxic ions Na+ and Cl within tissue.

1. Introduction

Most of Australia’s potato production for the fresh market is based on sprinkler irrigated crops and in some areas the salinity of irrigation water is rising.
Potatoes have been rated as moderately sensitive to salinity [1]. This assessment was based on the study in which direct application of saline irrigation to the soil surface hastened canopy senescence and reduced yield [2]. The effect of saline irrigation is also dependent on the method of irrigation; sprinkler irrigation which wetted the foliage caused a greater yield loss in bell peppers than drip irrigation [3]. Further, the yield loss increased with sprinkling frequency. These two observations were reconciled by proposing that this effect was related to the accumulated time for which the leaf surface remained wet following sprinkling with saline solution; this time was greater with a higher frequency of sprinkling.
Use of a non-saline sprinkling to remove the saline water film remaining on foliage after completion of saline sprinkling was shown in barley to double grain weight [4]. These results supported the proposition that a significant component of damage from saline sprinkling occurred whilst the leaves remained wet after cessation of sprinkling [3].
With sprinkler irrigation, these observations indicate that an approach to the conjunctive use of saline and non-saline water which applies the two waters separately may be preferable to one which mixes the two prior to application.
The observation of the positive effect that a non-saline sprinkling had on grain weight in barley was made with a system that separately irrigated the canopy and roots [4]. Such an approach is impractical in the field and the effect has yet to be demonstrated without such separation. Further a fixed volume of non-saline water was applied and so it remains unclear whether the observed effect was sensitive to variation in the volume of non-saline irrigation. If the minimum effective volume proves small relative to overall irrigation requirements, then alternative source of fresh water such as a solar powered desalination plant may have a role to play in saline sprinkler irrigation. The costs of both these technologies have halved over the last decade [5,6].
Using potatoes, we compared a conjunctive use strategy which mixed saline and non-saline water sources prior to application with one which kept the waters temporally separate, that is, each irrigation commenced with saline water and finished with sprinkling of non-saline water. With the latter approach we also investigated the effect of varying the volume of the non-saline sprinkling. The effects of the two approaches on the plants were evaluated measurement of leaf and tuber Na+ and Cl concentrations, tuber weight and canopy growth. This paper reports on the second more comprehensive of two glasshouse based investigations which were both briefly reported in a conference paper [7].

2. Results

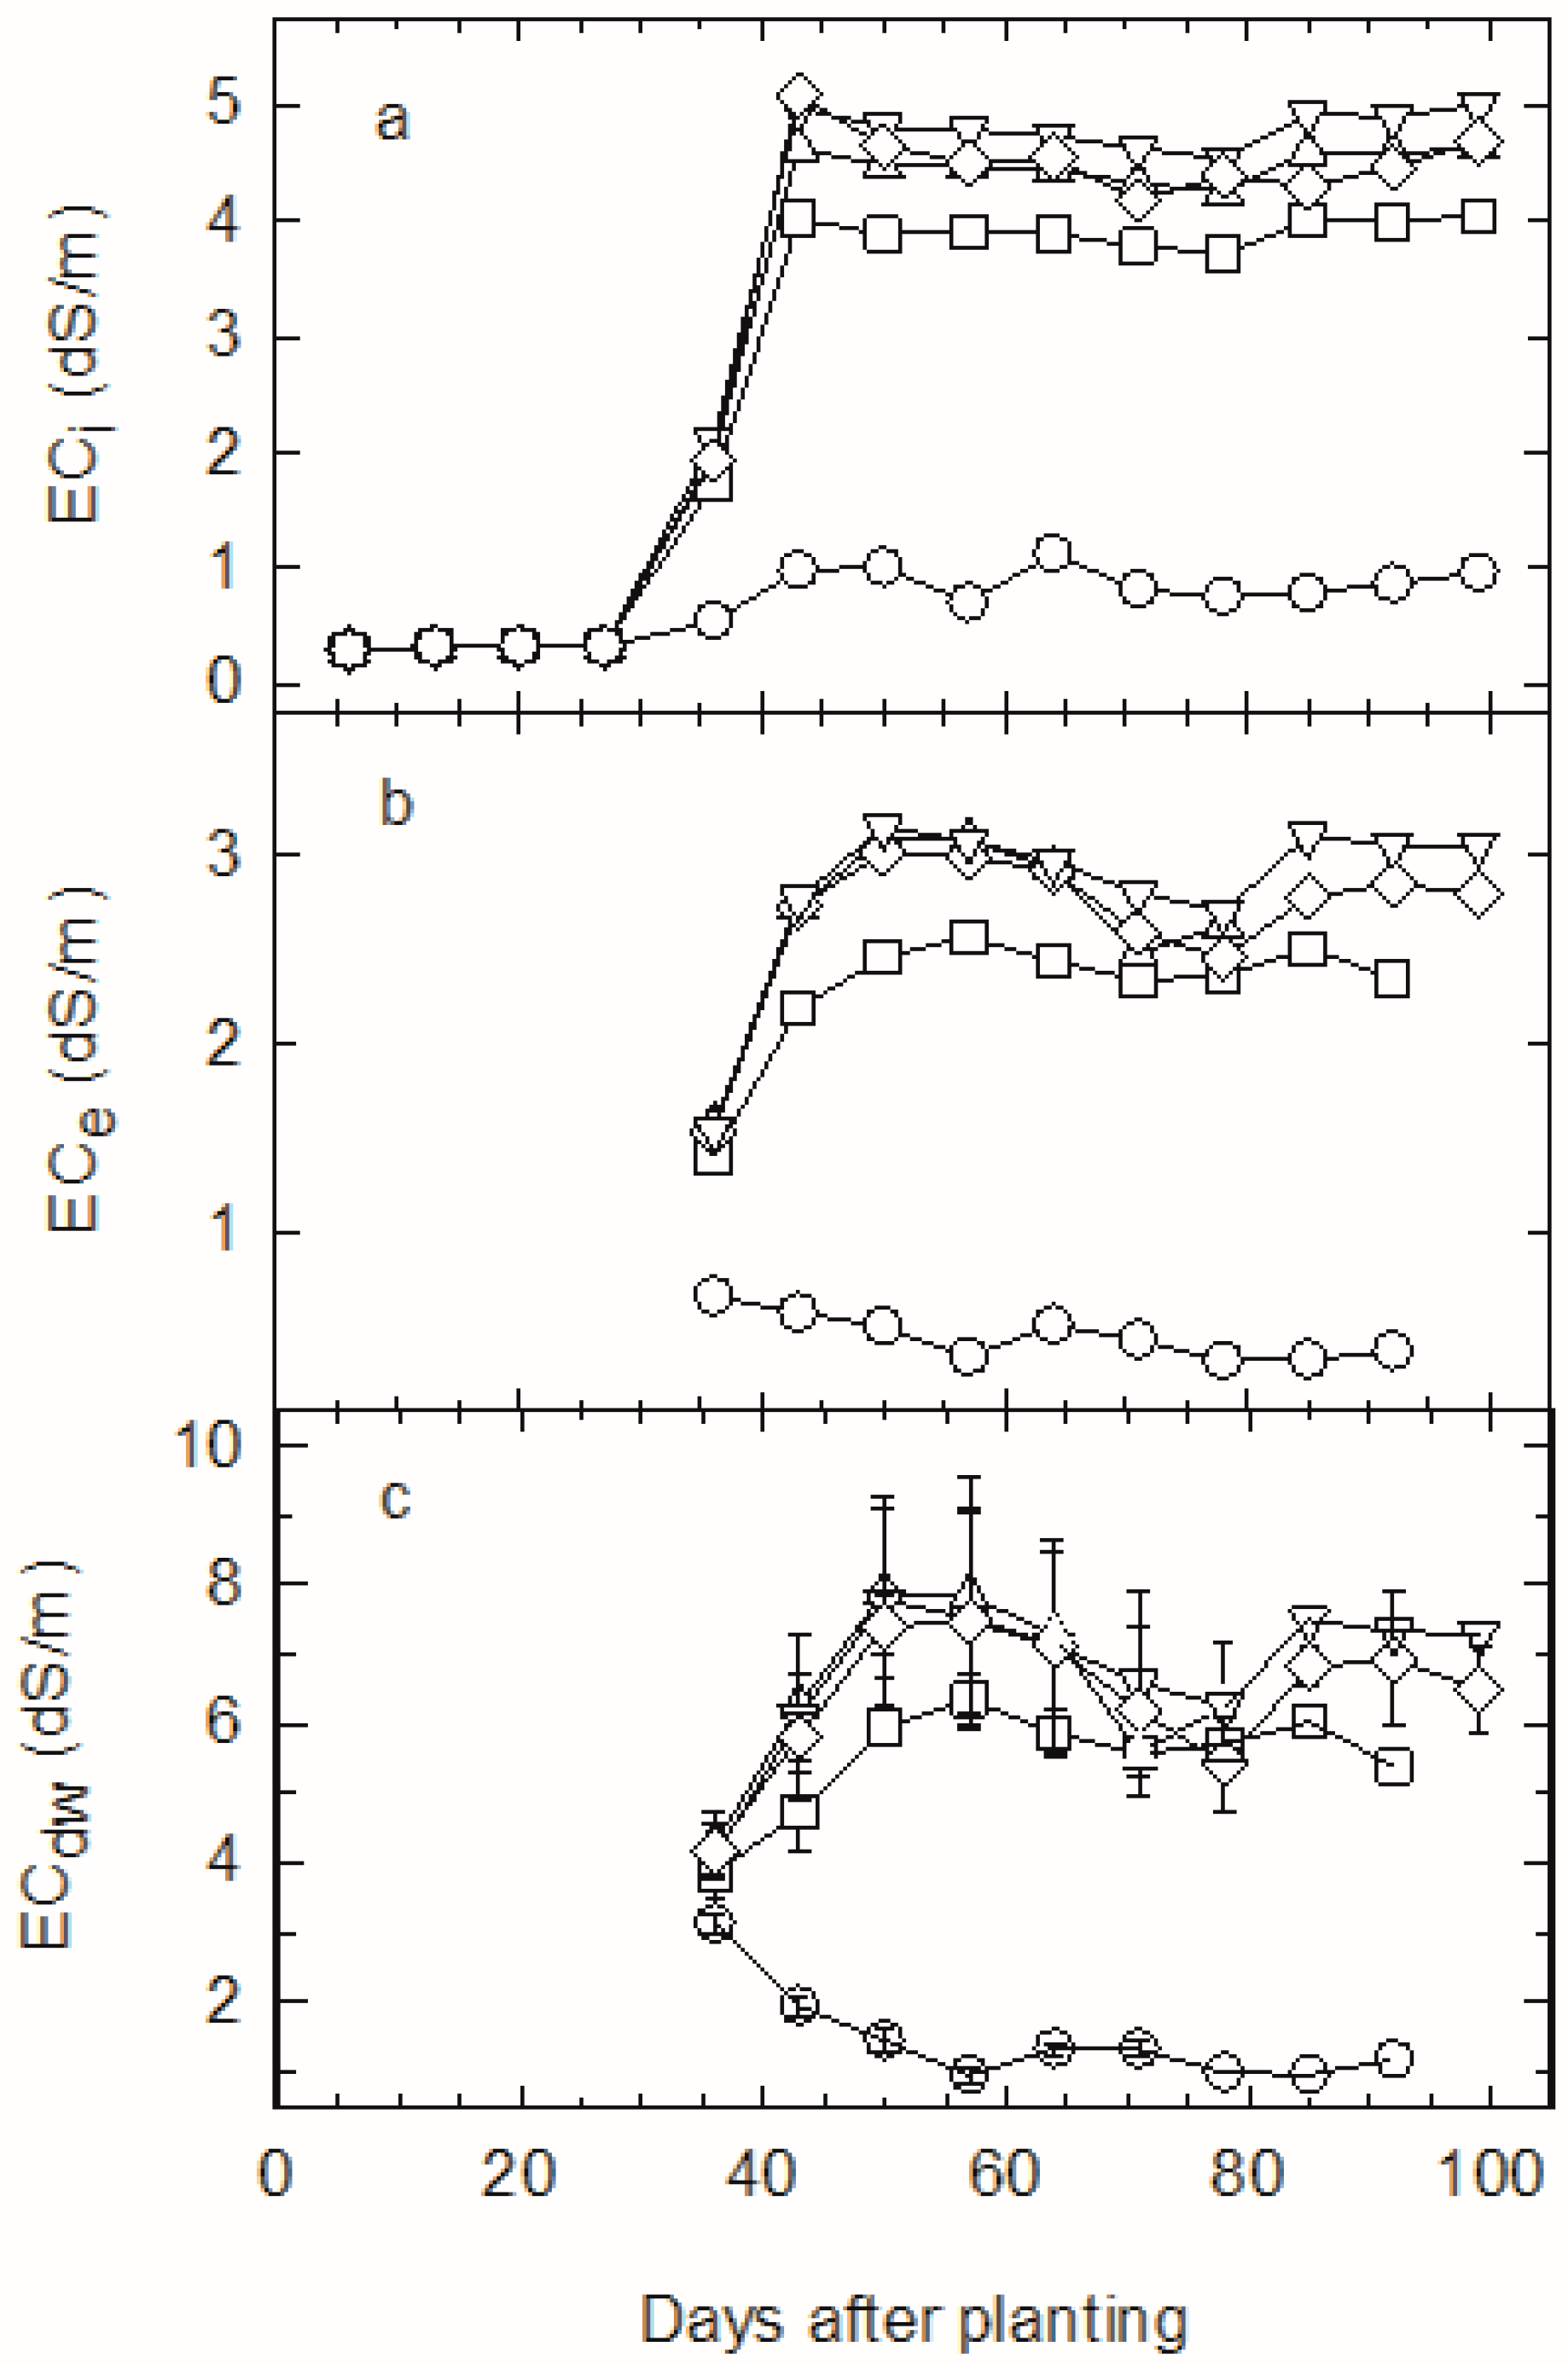
2.1. Irrigation and Drainage Waters
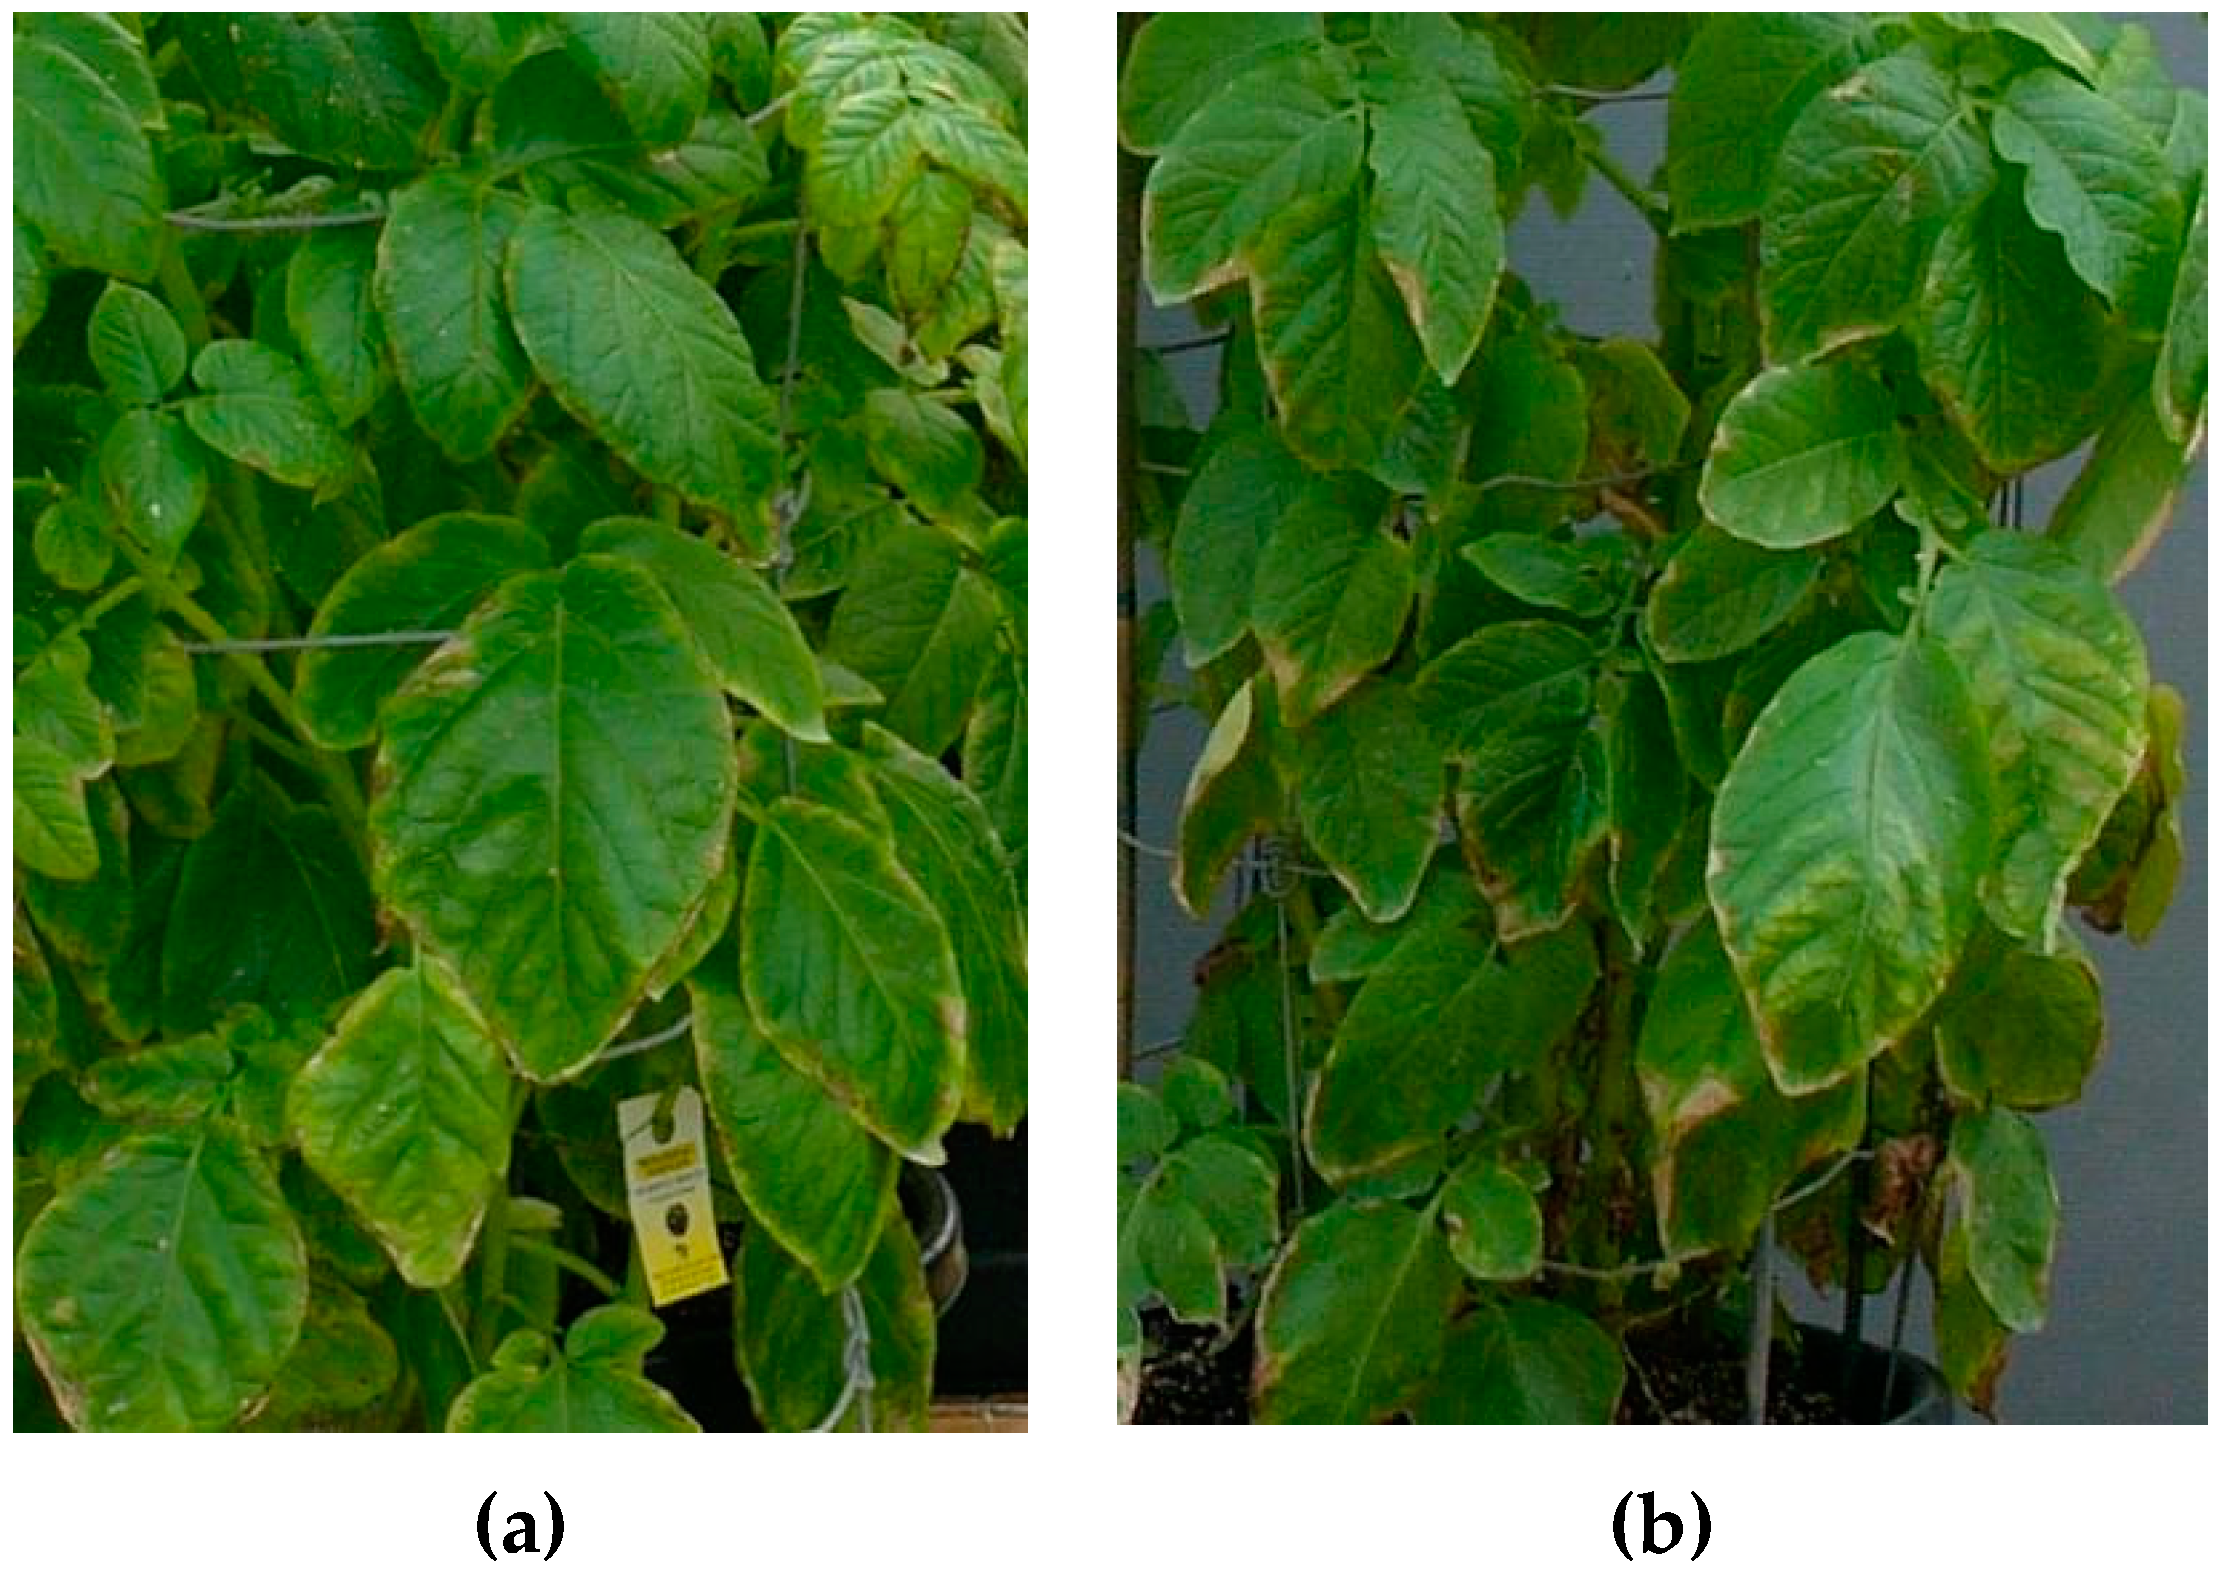
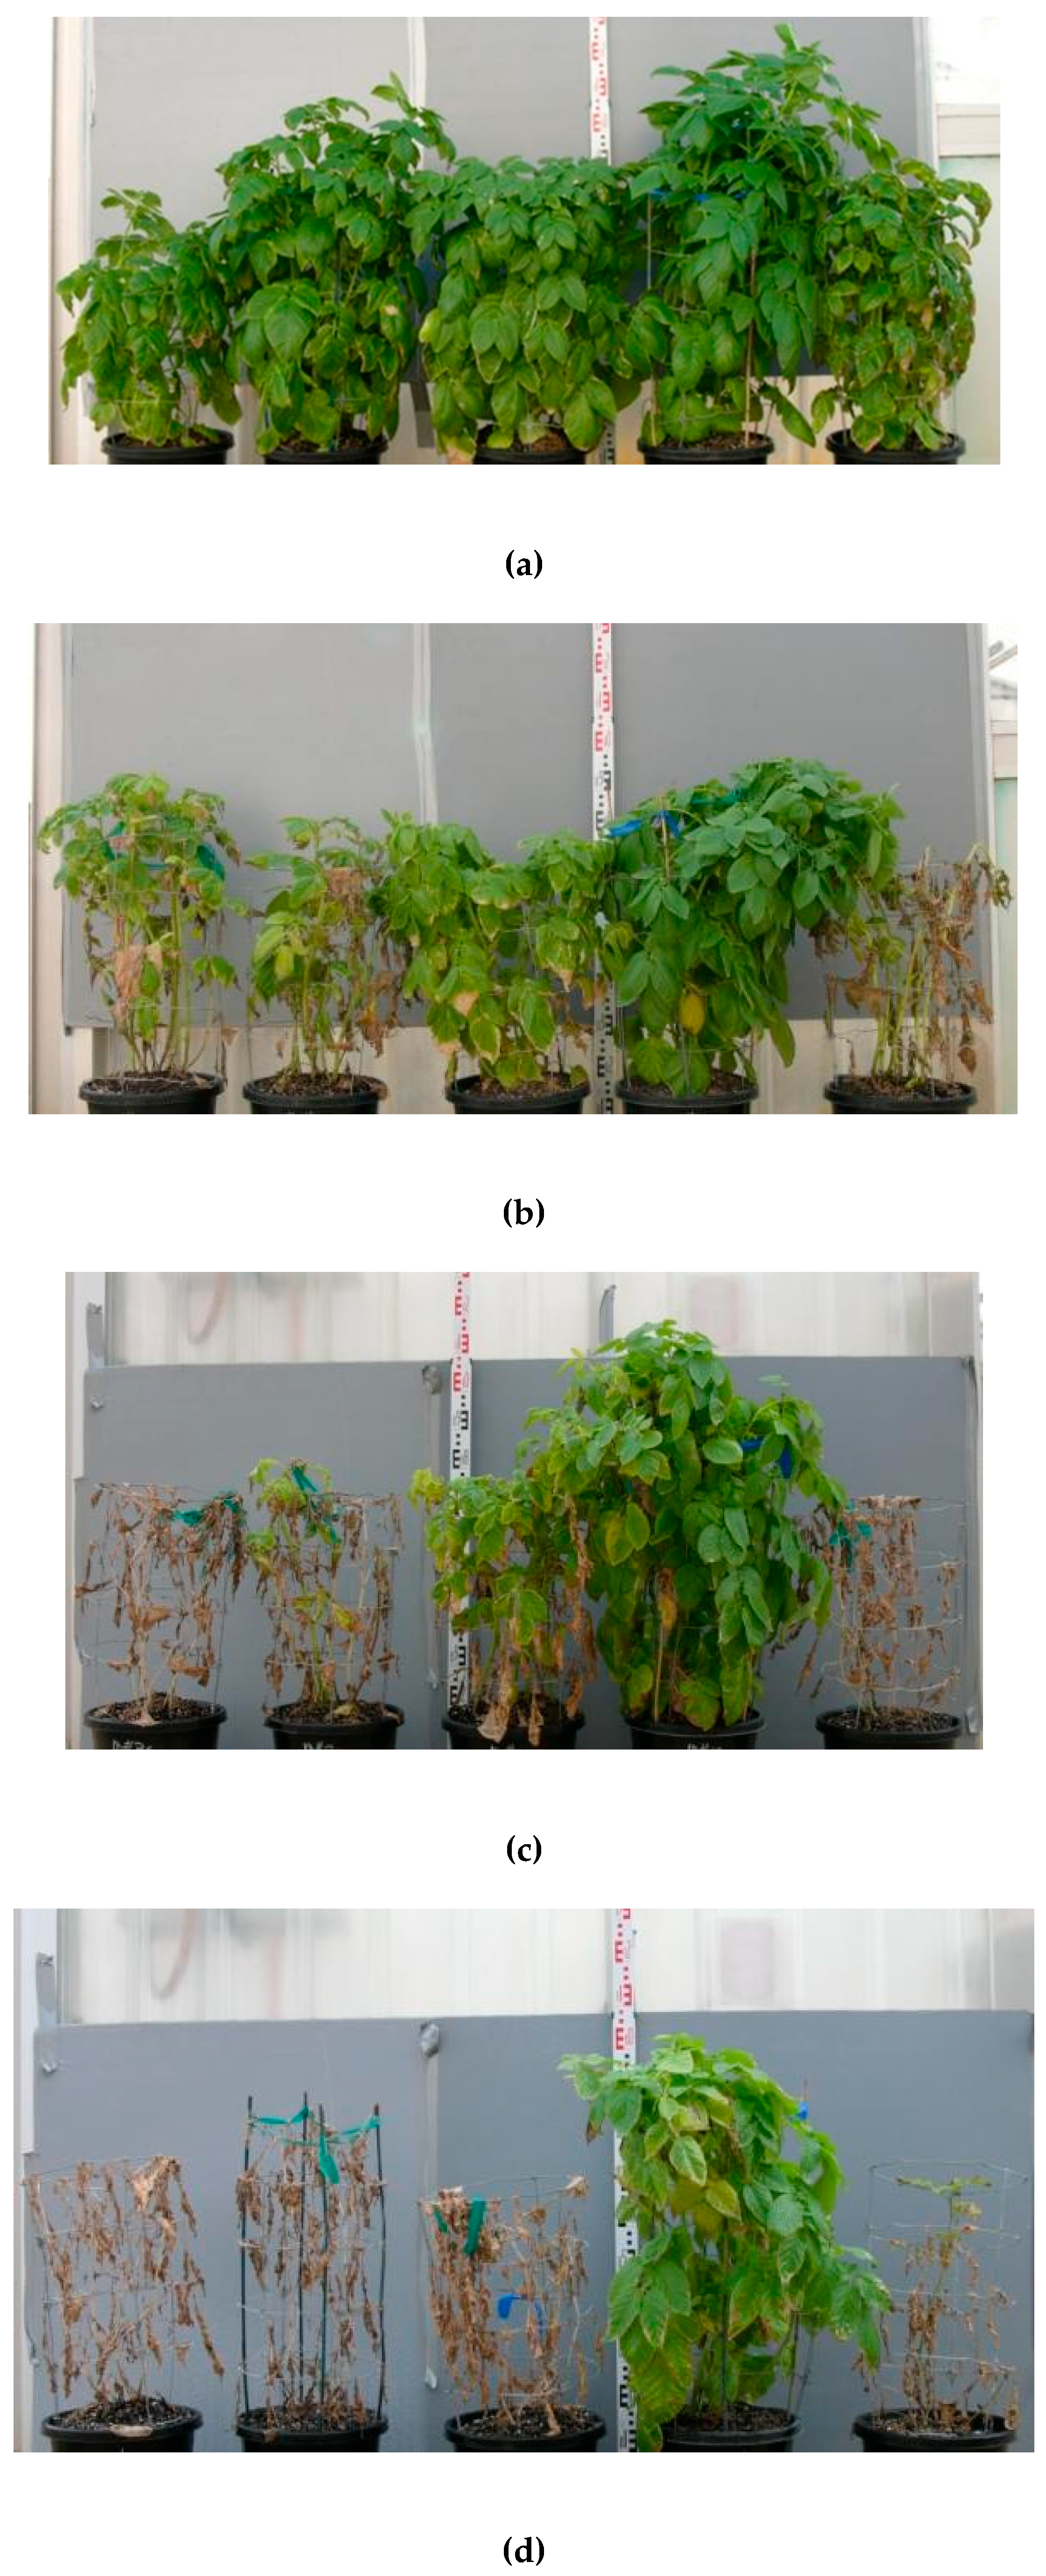
Between 35 and 102 days after planting (DAP) the average calculated daily precipitation rate was (mean ± SE) 0.73 ± 0.03 L/pot (data not tabulated). The time courses for the salinity of irrigation water is shown in Figure 1. For the period 6 to 98 DAP, the volume weighted electrical conductivity of the irrigation waters (ECi) were: 0.8 dS/m in the non-saline control (CONT); 3.8, 4.0, and 3.8 dS/m, respectively, in the saline treatments wherein non-saline waters were applied for the last 7.5%, 15% and 22.5% of the duration of the irrigation (designated SALT + 7.5%F, SALT + 15%F, and SALT + 22.5%F, respectively); and 3.3 dS/m for the saline treatment wherein saline and non-saline waters were mixed in the ratio 85:15 prior to application (designated 85%SALT). For the period when salt concentrations were at full value, 36 to 98 DAP, the average ECi for the CONT, 85%SALT and SALT supply lines were 0.9, 4.5 and 5.1 dS/m. Figure 1 also shows the time course for calculated soil salinity (ECe) and drainage water salinity (ECdw) between 36 and 98 DAP. Soil salinity rose rapidly between 36 and 42 DAP following the increases in the salinity of irrigation water at 28 and 36 DAP. Between 36 and 98 DAP the average ECe in the CONT, 85%SALT, SALT + 7.5%F, SALT + 15%F, and SALT + 22.5%F, treatments were 0.4, 2.7, 2.8, 2.6 and 2.3 dS/m, respectively. Drainage water salinity in the salinised treatments rose following the increase in ECi. The average values between 36 and 77 DAP in the 85%SALT, SALT + 7.5%F, SALT + 15%F, and SALT + 22.5%F, treatments were similar at 6.6, 6.9, 6.9, and 5.7 dS/m, respectively. In the CONT treatment, ECdw fell between 36 and 56 DAP and this was probably due to progressive leaching of the salts from the slow release fertiliser present in the potting mix. The average value between 36 and 77 DAP was 1.3 dS/m. The patterns established whilst a full data set was available continued in the reduced data set between 78 and 102 DAP.
Based on estimating leaching fraction as the ratio of ECi/ECdw, the values, for period 36 and 77 DAP, in the CONT, 85%SALT, SALT + 7.5%F, SALT + 15%F, and SALT + 22.5%F, treatments were 0.68, 0.69, 0.68, 0.65, and 0.72, respectively. In all treatments, the addition of salts from the slow release fertilizer in the potting mix added salt to the drainage water which was not present in the irrigation water. This addition biased the estimate of leaching fraction so that it represents a minimum value.

2.2. Plant Growth

The photographic records showed that damage in older leaves consisted of chlorosis of the interveinal area and necrosis of tips and margins. It was first observed in 85%SALT, SALT + 7.5%F and SALT + 15% at 42 DAP and in SALT + 22.5%F at 51 DAP. Leaves in the CONT also displayed the same damage at the third and fourth harvests (92 and 103 DAP) (Figure 2).
The condition of plant canopies in treatments receiving saline irrigation deteriorated over the four harvests (Figure 3). At the second harvest (81 DAP), the canopies in five of the six replicates of 85%SALT had senesced, at the third (92 DAP) the canopies in five of the six replicates of SALT + 7.5% had senesced as had those in one replicate each of the SALT + 15%F and SALT + 22.5%F and by the fourth harvest (103 DAP) canopies in all replicates of all saline treatments had senesced.
At each of the four harvests, the dry weights of the canopy in the CONT treatment were greater than those in the salt treatments excepting at the first harvest when that in SALT + 15%F was equal to the CONT (Table 1). At the first harvest, the dry weight in the SALT + 15%F treatment was greater than those in the SALT + 7.5%F and 85%SALT; at the third, the dry weight in the SALT + 22.5%F was greater than that in 85%SALT; and at the second and fourth, the canopy dry weights in all salt treatments were equivalent. Harvest date also modified the effect of irrigation treatment on tuber weights (Table 1). At the first harvest the weight of tubers in the CONT was equivalent to those of SALT + 15%F and SALT + 22.5%F and that of the SALT + 15%F was greater than that of 85%SALT. At the second harvest, the weight in the CONT was greater than that in any saline treatments and these treatments had equivalent weights. At the third and fourth harvest, the weight in the CONT was again greater than the weights in the saline treatments and weights in saline irrigation treatments receiving short non-saline irrigations were equivalent and greater than those of the 85%SALT treatment. The weight of tubers in the CONT increased at each successive harvest up until the third harvest, the weight in SALT + 22.5%F increased between the first and third harvest and that in the SALT + 7.5%F between the first and fourth harvests. Tuber weights in the remaining saline treatments did not change across harvests. The tuber weights in the CONT treatment had reached a maxima (indicating an optimal harvest date) by the third harvest. At the third and fourth harvest, the average tuber weights in the SALT + 22.5%F, SALT + 15%F and SALT + 7.5%F were 67%, 60% and 57% of those in the CONT, whereas that in 85%SALT was only 38% of the CONT. Non-saline sprinklings increased tuber weights by at least 50% (cf. 85%SALT with SALT + 7.5%F).The effect of irrigation treatment on tuber dry weight expressed as a % fresh weight was modified by harvest date (Table 1). In the CONT treatment the values increased between the first and second, and the second and third harvest to reach a maxima of 18% at the third and fourth harvests. On these two dates, values in the CONT were greater than those in the saline irrigation treatments. The values in the 85%SALT and the SALT + 7.5%F remained constant across all four harvests. Those in SALT + 15%F and the SALT + 22.5%F increased between the first and third harvest and decreased between the third and fourth harvests.

2.3. Tissue Concentrations of Sodium and Chloride

The effect of irrigation treatment on the concentration of sodium in the leaves was dependent on the sampling date (Table 2). In the CONT treatment the concentration remained equivalent across the period 43 to 92 DAP, with an average value of 187 mmol/kg. In the 85%SALT, SALT + 7.5%F and SALT + 15%F treatments, the concentrations rose between 43 and 74 DAP and fell between 74 and 92 DAP. On 74 DAP, the values were equivalent with the average, 2090 mmol/kg, more than 10-fold greater that the value in CONT. In the SALT + 22.5%F, the sodium concentrations on all three sampling dates were greater than the respective value in the CONT; were equivalent to the respective values in the two other saline treatments receiving non-saline sprinkling excepting on 74 DAP when it was less and; less than the respective values in 85%SALT excepting on 43 DAP when the values were equivalent.
Irrigation effects on the concentration of chloride in the leaves were independent of sampling date. (Table 2). The concentrations in the 85%SALT and SALT + 7.5%F were equivalent with the average value of 2491 mmol/kg and greater than those in the SALT + 15%F and SALT + 22.5%F, which were equivalent, average value 1956 mmol/kg, and greater than the 774 mmol/kg in the CONT. The concentration rose between 43 and 74 DAP and fell between 74 and 92 DAP.
In the tubers, the sodium and chloride concentrations in the CONT were less than those in the saline treatments. The sodium concentration in the 85%SALT treatment was higher than those SALT + 22.5%F and SALT + 7.5%F, but equivalent to that in the SALT + 15%F (Table 3). The Cl concentration in the SALT + 7.5% was equivalent to that in SALT + 15%F and greater than the values in the SALT + 22.5%F and 85%SALT which were equivalent.

3. Discussion

Tuber weight in the CONT treatment reached its maximum at 92 and 103 DAP. On these dates, the tuber weights from the 85%SALT, SALT + 7.5%F, SALT + 15%F, and SALT + 22.5%F treatments were 38%, 57%, 60% and 67% of that in the CONT. The tuber weights in the treatments where saline and non-saline irrigations were temporally separate were equivalent and on average they were 61% of the weight in the CONT. Substitution of the ECe values recorded in our saline irrigation treatments into yield-salinity relationship for potatoes grown with irrigation applied directly to the soil surface [1] gives a predicted yields loss of that 13% or less. In common with studies on bell pepper, barley and grapevine, we found that sprinkling saline water on the foliage causes much greater yield losses than application of the same water directly to the soil surface [3,8,9]. These studies have associated the additional yield loss under saline sprinkling with higher leaf concentrations of Na+ and Cl.
In the saline treatments, tip and marginal necrosis of leaves and chlorosis of the inter-veinal area began to appear between 42 and 51 DAP. This was associated with high concentration of Na+ and Cl in leaves (see Table 2). The same changes began to appear in the leaves of the non-saline CONT treatment after completion of tuber bulking between 92 and 103 DAP (see Figure 2). The concentration of Na+ and Cl in leaves of the CONT treatment was 271 and 455 mmol/kg, respectively, at 92 DAP. The change in the appearance of leaves in the CONT was not associated with high concentration of Na+ and Cl in leaves, but rather with the onset of canopy senescence. The canopies of saline treatments underwent full senescence before the final harvest and it is likely that the changes in leaf conditions observed between 42 and 51 DAP were the commencement of canopy senescence. This aligns with a previous observation [2] that salinity hastened the onset of canopy senescence and this was attributed to a decrease in soil solution osmotic potential. The appearance of damaged leaves that we observed is similar to the description of leaf damage given in a study of saline sprinkled potatoes with non-saline root zones [10]. It was proposed that the cause was high Na+ and Cl concentrations in the leaves. The canopy of 85%SALT was senescent on 81 DAP, whereas that of SALT + 15%F did not senesce until 92 DAP. The soil salinities in these two treatments were equivalent as were the leaf concentrations of Na+ and Cl. Thus, we cannot attribute differences in the development of canopy senescence between these two treatments to differences in either soil solution osmotic potential (directly proportional to the salinity of soil solution [11]) or leaf Na+ and Cl concentrations. In our study, an approach to conjunctive use of saline and non-saline waters for sprinkling which applies non-saline water at the end of each irrigation delayed the development of canopy senescence. This delay in senescence was associated with an increase in tuber weight of at least 50% (compare weights in SALT + 7.5%F and 85%SALT at harvests on 92 and 103 DAP, see Table 1).
Given that the 50% increase in tuber weight in the treatment which terminated each irrigation with non-saline sprinkling consisting of 7.5% of total irrigation volume was equivalent to that in the treatment where this volume was tripled to 22.5%, then it is likely that most of the benefits of a short non-saline sprinkling were realised well before application of the entire 7.5% of the total irrigation volume.
All treatments had the same calculated values of the daily precipitation rate. It was based on a pre-trial measure of rate at the pot mouth without the presence of a plant canopy. The presence of a canopy would have increased interception of the non-vertical component of sprinkler irrigation and the resultant stem flow would have increased precipitation entering the pot mouth. Canopy growth was greater in the CONT treatment; the canopy growth in the 85%SALT was equivalent to that in one of more of the three other salinised treatments on three of the four harvest dates (Table 1). The presence of a wire cage constrained canopy spread and therefore would have also diminished the effect that between treatment differences in canopy growth had on interception of precipitation, however given the large difference in growth between the CONT and salinised treatments it is likely that precipitation in the CONT treatment was greater than in salinised treatments. If the added precipitation in the CONT had increased drainage, then we would have expected the estimate of leaching fraction in the CONT to be greater than in the salinised treatments. However the estimate in the CONT, 0.68, was similar to the average of the values in the salinized treatments, 0.68. This observation supports a proposition the evapotranspiration from the CONT treatment was greater than from the salinised treatments. All treatments were irrigated to well in excess of soil water deficit as evinced by the high leaching fractions and as a consequence it is unlikely that the proposed higher evapotranspiration in the CONT would have led to the development of stress induced by a soil water deficit.
Previous work with the application of non-saline sprinkling following saline irrigation to crops growing with non-saline root zones found that the emergence of leaf damage (marginal necrosis) was species dependent. It was present in maize, but not in barley [8]. Thus, the increased grain growth reported in the same study [4] was associated with a reduction in leaf concentrations of Na+ and Cl but not necessarily with the emergence of leaf damage. In contrast our gains in tuber weight were associated with only minor changes in leaf concentrations of Na+ and Cl, but with a substantial delay in the rate of canopy senescence. Sprinkling leaves with non-saline water at the end of an irrigation would have diluted the saline film remaining on the leaves after the irrigation event. This would have raised the osmotic potential of this solution and reduced the localised droughting effect that this film would have exerted on leaf tissue. An alternate explanation is that a short sprinkling of non-saline water altered the distribution of Na+ or Cl in the leaves such an alteration in Na+ distribution was shown to be associated with improved salinity tolerance in cereal crops [12].

4. Materials and Methods

4.1. Materials and Culture

The experiment was conducted at Loxton, South Australia (34°38′ S, 140°38′ E) in a glasshouse where the temperature was maintained between 10 and 29 °C. Certified seed potatoes (Solanum tuberosum L. cv Coliban) were planted directly into 14.5 L pots containing 12 L of soil. The potting soil consisted of the following ingredients per 500 L:275 L composted pine bark, 150 L coarse river sand, 75 L isolite, 1 kg lime, 1 kg dolomite, and 2 kg of slow release fertiliser with a N:P:K ratio of 16:4:10 (%w/w) and an inert coating of paraffin wax. A wire cage was used to constrain the canopy within the area circumscribed by the pot mouth (0.067 m2). A plot consisted of the four pots mounted on a rectangular rack, 2.28 m by 0.81m, with the four pots placed equidistant along a line bisecting the short axis. After planting, pots were initially watered by hand using water from the local reticulated supply (EC ~ 0.3 dS/m). Plants emerged 10 days after planting (DAP).

4.2. Trial Design and Analysis

The trial consisted of six replicates of five irrigation treatments arranged as a randomised block. The treatments were: a control (CONT) sprinkled with non-saline water; three treatments which represented an irrigation strategy wherein dual sources of water were kept temporally separate, that is combinations of sprinkling with saline water followed by sprinkling with a non-saline water (F, fresh water) to wash away salt from the surface of the foliage—the irrigation event comprised sprinkling with SALT water for 92.5% or 85% or 77.5% of the duration for the irrigation event and CONT water for the remainder and treatments were accordingly designated as SALT + 7.5%F or SALT + 15%F or SALT + 22.5%F; one treatment which represented an irrigation strategy wherein dual water sources were mixed prior to application (that is water with a salinity equivalent to that achieved by mixing SALT and CONT waters in a ratio 85:15) and sprinkled for the entire duration of the irrigation event - the treatment was designated as 85%SALT.
Data were analysed using a repeated measures ANOVA in GenStat Release 7.2 (Lawes Agricultural Trust, Hampenden, UK). Where effects were significant (p < 0.05), then all pair wise comparisons were made using Fischer’s unprotected LSDs.

4.3. Irrigation

Each plot was irrigated with four sprinklers (Antelco Vari-jets with 90° throw, Adelaide, Australia) positioned on risers at the corners of a plot. The SALT + 22.5%F, SALT + 15%F, and SALT + 7.5%F plots were fitted with two sets of sprinklers. One set supplied the saline water (SALT) and the other the same non-saline water as received by the CONT treatment. Sprinklers were operated at a pressure of 90 kPa and discharged 1.15 L/min. As the crop grew, the height of risers was adjusted to maintain the top of the spray trajectory at above canopy height. Plots were separated by plastic curtains to prevent cross plot contamination from overspray.
The distribution uniformity and the precipitation rate of the sprinkler system was measured before planting. In three replicates, catch cans were placed at the mouths of the four pots within a plot and a timed irrigation was applied. Distribution uniformity was calculated by ordering the record of the depth of water in each catch can from lowest to highest; calculating the average depth in the catch cans in the lowest 25% of this range and dividing this value by the average of depths in all cans. An operating pressure of 90 kPa gave a sprinkler distribution uniformity greater than 90%. The average hourly rate of precipitation calculated from catch can records was 4.38 L/pot. The daily precipitation per pot was calculated as the product of duration of programmed irrigations and average sprinkler precipitation rate.
Irrigation water was drawn from the River Murray (EC 0.3 dS/m). It was dosed with Ca(NO3)2 brine to bring the concentration to 2.6 mM and then split between lines supplying non-saline and saline irrigations. The lines supplying saline treatments were dosed with one of the two NaCl brines to bring the concentrations of NaCl in the SALT and the 85%SALT treatments to 40 and 34 mM, respectively.
Sprinkler irrigation began eight DAP. Saline treatments began at 28 DAP and were applied in two stages. In the first stage, the salt concentrations were at 40% of the final values—this stage ended at 34 DAP. As the plants grew, irrigation frequency increased from once every six days to twice daily. Duration of irrigations ranged from 6 to 15 min. All treatments received the same duration and frequency of irrigation.
The salinities (ECi) of irrigation waters were measured weekly on a samples generated by continuously bleeding the line supplying each treatment through a micro-capillary tube into a 4 L container. The salinity (ECdw) of drainage water was measured weekly in 2 replicates. Draining water was collected in closed top receptacles. Drainage flow began in the week ending on 35 DAP. The pots used to monitor drainage were selected prior to the random allocation of pots to specific harvest dates. At each harvest, some of the drainage monitoring pots were harvested. After the first harvest, the drainage water data set was incomplete. Water salinity was measured with a hand held conductivity meter (model MC-84, TPS Pty Ltd., Brisbane, Australia).
The salinity of the soil water (ECsw) was estimated as (ECi + ECdw)/2 and the leaching fraction as (ECi/ECdw) [13] and the salinity of the saturated soil paste extract (ECe) as half the value of ECsw [11,13].

4.4. Harvest and Tissue Analyses

Photographs were taken of plants in one replicate on 30, 42, 51, and 59 DAP, and of plants in all replicates at each harvest. The date of damage emergence was assessed by scoring photos for presence (score = 1) or absence (score = 0) of leaf necrosis and inter-veinal chlorosis.
Mature leaves were sampled from the exterior of the canopies of all plants in a plot on 43, 74 and 92 DAP. Prior to drying, leaf tissue was rinsed once in an acidified, phosphate free detergent solution and twice in distilled water. Samples were dried at 80 °C for 48 h.
One pot per plot was harvested on 65, 81, 92 and 103 DAP. Tubers were washed and weighed, and a sub-sample was taken for determination of the dry to fresh weight ratio. The canopy was divided into leaves and stems, weighed and then the leaves were dried at 80 °C for 48 h and stems dried until they reached a constant weight. Tubers sub-samples were freeze dried (Cuddon FD-80, Blenheim, New Zealand). Leaf and freeze dried tubers were ground to pass a 0.8 mm mesh.
The concentration of chloride in leaf tissue was determined in an aqueous extract [14] by ion chromatography (model ICS-3000, Dionex, Sunnyvale, CA, USA). The system was run with a pump flow rate of 0.25 mL/min, the column was eluted with potassium hydroxide which was run as a gradient with concentrations ranging from 5 to 80 mM, with current to the suppressor (ARSII, Dionex) ranging from 5 to 60 mA, through a 2 mm column (AS19, Dionex) held at 30 °C.
The chloride concentration in tubers was determined in warm 4% nitric acid extraction [15] with an axial CIROS Inductively Coupled Plasma Atomic Emission Spectrometry (Spectro Analytical Instruments, Kleve, Germany).
The concentration of sodium in the leaves and tubers was determined in a nitric acid and hydrogen peroxide digest with a radial CIROS Inductively Coupled Plasma Atomic Emission Spectrometry (Spectro Analytical Instruments, Kleve, Germany).

5. Conclusions

We proposed that the mixing regime used in the conjunctive use of saline and non-saline waters for sprinkler irrigation affects the growth of potato tubers. Our experiment demonstrates that a regime which commenced each irrigation with saline water and finished with a short sprinkling of non-saline water increased tuber weight relative to an approach which mixed the waters prior to application. This advantage could neither be attributed to differences between regimes in soil salinity nor differences in bulk tissue concentrations of sodium and chloride.

Acknowledgments

The authors wish to thank Gerrit Schrale for project management; Tony Bass for assistance with glasshouse management; Fruit Doctors and Biological Services Loxton for monitoring the glasshouse trial for pests and diseases and supply of beneficials; Mondello farms for supply of seed potatoes; and Tim Pitt for commenting on the manuscript. Funds from the National Action Plan for Salinity via the Centre for Natural Resource Management, and the River Murray Levy supported this research.

Author Contributions

R.M.S and J.M.P conceived and designed the experiment; J.M.P and G.J.G performed the experiment; J.M.P and R.M.S analysed the data; R.M.S wrote the paper.

Conflicts of Interest

The authors declare no conflict of interest. The funding sponsors had no role in the design of the study; in collection, analysis and interpretation of data; in writing of the manuscript, and in the decision to publish the results.

References

  1. Maas, E.V.; Hoffman, G.J. Crop salt tolerance—Current assessment. J. Irrig. Drain. Div. 1977, 103, 115–134. [Google Scholar]
  2. Bernstein, L.; Ayers, A.D.; Wadleigh, C.H. The salt tolerance of white rose potatoes. Proc. Am. Soc. Hortic. Sci. 1951, 57, 231–236. [Google Scholar]
  3. Bernstein, L.; Francois, L.E. Effects of frequency of sprinkling with saline waters compared with daily drip irrigation. Agron. J. 1975, 67, 185–190. [Google Scholar] [CrossRef]
  4. Benes, S.E.; Aragues, R.B.; Grattan, S.R. Brief pre- and post-irrigation sprinkling with freshwater reduces foliar salt uptake in maize and barley sprinkler irrigated with saline water. Plant Soil 1996, 180, 87–95. [Google Scholar] [CrossRef]
  5. National Water Commission. Emerging Trends in Desalination: A Review; National Water Commission: Canberra, Australia, 2008. [Google Scholar]
  6. Feldman, D.; Barbose, G.; Margolis, R.; Wiser, R.; Darghouth, N.; Goodrich, A. Photovoltaic (pv) Pricing Trends: Historical, Recent, and Near-Term Projections; U.S. Department of Energy: Oak Ridge, TN, USA, 2012.
  7. Stevens, R.M.; Pech, J.M.; Grigson, G.J. Improving yield of vegetables grown with over-canopy, saline irrigation. Acta Hortic. 2008, 792, 639–646. [Google Scholar] [CrossRef]
  8. Benes, S.E.; Aragues, R.; Grattan, S.R.; Austin, R.B. Foliar and root absorption of Na+ and Cl in maize and barley: Implications for salt tolerance screening and the use of saline sprinkler irrigation. Plant Soil 1996, 180, 75–86. [Google Scholar] [CrossRef]
  9. Stevens, R.M.; Harvey, G.; Norton, S.; Frahn, W. Over-canopy saline sprinkler irrigation of grapevines during different growth stages. Agric. Water Manag. 2011, 101, 62–70. [Google Scholar] [CrossRef]
  10. Maas, E.V.; Grattan, S.R.; Ogata, G. Foliar salt accumulation and injury in crops sprinkled with saline water. Irrig. Sci. 1982, 3, 157–168. [Google Scholar] [CrossRef]
  11. United States Salinity Laboratory Staff. Diagnosis and Improvement of Saline and Alkali Soils; United States Department Agriculture Handbook No. 60.; U.S. Government Printing Office: Washington, DC, USA, 1954; pp. 1–160.
  12. James, R.A.; Munns, R.; von Caemmerer, S.; Trejo, C.; Miller, C.; Condon, T. Photosynthetic capacity is related to the cellular and subcellular partitioning of Na+, K+ and Cl in salt-affected barley and durum wheat. Plant Cell Environ. 2006, 29, 2185–2197. [Google Scholar] [CrossRef] [PubMed]
  13. Rhoades, J.D. Drainage for salinity control. In Drainage for Agriculture; van Schilfgaarde, J., Ed.; American Society of Agronomy: Madison, WI, USA, 1974; Volume 17, pp. 433–468. [Google Scholar]
  14. Russo, V.M.; Karmarkar, S.V. Water extraction of plant tissues for analysis by ion chromatography. Commun. Soil Sci. Plant Anal. 1998, 29, 245–253. [Google Scholar] [CrossRef]
  15. Wheal, M.S.; Palmer, L.T. Chloride analysis of botanical samples by ICP-OES. J. Anal. At. Spectrom. 2010, 25, 1946–1952. [Google Scholar] [CrossRef]
Figure 1. The temporal variation in the salinity of irrigation water (ECi) (a), soil (ECe) (b) and drainage water (ECdw) (c). In (c), vertical bars represent the standard error; absence of the SE bar indicates that the value is based on one rather than two datum points. CONT ○, 85%SALT ◊, SALT + 7.5%F ∇, SALT + 15%F Δ, SALT + 22.5%F □.
Agronomy 07 00004 g001
Figure 2. The appearance of the canopies in SALT + 7.5%F at 65 DAP (a) and in CONT at 103 DAP (b).
Agronomy 07 00004 g002
Figure 3. The effect of treatment on canopy appearance on the day before harvest at 65 (a); 81 (b); 92 (c) and 103 (d) days after planting. Treatments, from left to right, SALT + 7.5%F, SALT + 15%F, SALT + 22.5%F, CONT, 85% SALT. On the survey rod in the background, the distance between base of the E shape and the base of its adjacent mirror image is 10 cm.
Agronomy 07 00004 g003
Table 1. The effects of irrigation treatment (T) and harvest date (D), specified as DAP, on canopy dry weights (g/pot) and tuber wet weight (g/pot) and wet to dry weight ratio (%).
DAPIrrigation TreatmentDp-Value
CONT85% SALTSALT + 7.5%FSALT + 15%FSALT + 22.5%FMeans
Canopy dry weight
6538.6 ab25.4 de26.0 de32.4 bc30.1 cd30.5<0.001 (T)
8133.4 bc20.1 efg19.4 efgh20.6 efg24.9 de23.7<0.001 (D)
9241.4 a13.0 hi17.8 fghi16.6 fghi23.3 ef22.40.003 (T × D)
10334.2 bc11.7 i14.6 ghi17.3 fghi17.6 fghi19.1
T means36.917.619.421.724.0
Wet weight of tubers
65624 cdef371 i439 fghi578 cdefgh499 efghi502<0.001 (T)
81843 b538 defghi490 efghi570 cdefgh626 cdef614<0.001 (D)
921135 a395 hi611 cdefg596 cdefg723 bcd6920.017 (T × D)
1031056 a429 ghi629 cde723 bcd738 bc715
T means914433542617647
Tuber d.w. as % w.w.
6515.3 h15.6 gh16.1 cdefg15.9 efgh16.0 defgh15.8<0.001 (T)
8116.6 bcd16.1 cdefg16.0 defg16.6 bcde16.3 bcdef16.3<0.001 (D)
9217.8 a16.0 defg15.9 fgh16.7 bc16.9 b16.7<0.001 (T × D)
10318.1 a15.6 gh16.2 cdefg15.8 fgh16.1 cdefg16.3
T means17.015.816.016.316.3
Values followed by different letters indicate significant differences for the treatment by harvest date interaction (p = 0.05 Fischer’s unprotected LSD).
Table 2. The effects of irrigation treatment (T) and sample date (D), specified as DAP, on sodium and chloride concentration in leaves (mmol/kg dry weight).
DAPIrrigation TreatmentDp-Value
CONT85% SALTSALT + 7.5%FSALT + 15%FSALT + 22.5%FMeans
Sodium
43117 e,*1215 bc1127 bcd844 cd746 d810<0.001 (T)
74172 e2197 a1885 a2189 a1240 bc1537<0.001 (D)
92271 e945 cd1385 b1235 bc1210 bc1009<0.001 (T × D)
T means1871452146614231065
Chloride
43106924442378212819491994 B<0.001 (T)
7479833643187276324062503 A<0.001 (D)
9245513582218140210861304 C0.108 (T × D)
T means774 d2388 ab2594 a2098 bc1814 c
* Values followed by different letters are significantly different, for sodium the letters indicate significant differences for the treatment by sample date interaction (p = 0.05 Fischer’s unprotected LSD).
Table 3. The effect of irrigation treatment on the sodium and chloride concentration (mmol/kg dry weight) in tubers harvested on 92 DAP.
Irrigation treatment
CONT85% SALTSALT + 7.5%FSALT + 15%FSALT + 22.5%Fp-Value
Sodium5 c,*43 a31 b36 ab32 b<0.001
Chloride71 d176 c225 a213 ab188 bc<0.001
* Values within the same row followed by different letters are significantly different (p = 0.05 Fischer’s unprotected LSD).

