A Case Study of Potential Reasons of Increased Soil Phosphorus Levels in the Northeast United States


Department of Cooperative Extension, University of Maine, 57 Houlton Rd., Presque Isle, ME 04769, USA
*
Authors to whom correspondence should be addressed.
Agronomy 2017, 7(4), 85; https://doi.org/10.3390/agronomy7040085
Submission received: 17 November 2017
/
Revised: 12 December 2017
/
Accepted: 14 December 2017
/
Published: 18 December 2017
(This article belongs to the Special Issue Plant Mineral Nutrition: Principles and Perspectives)
Abstract
:Recent phosphorus (P) pollution in the United States, mainly in Maine, has raised some severe concerns over the use of P fertilizer application rates in agriculture. Phosphorus is the second most limiting nutrient after nitrogen and has damaging impacts on crop yield if found to be deficient. Therefore, farmers tend to apply more P than is required to satisfy any P loss after its application at planting. Several important questions were raised in this study to improve P efficiency and reduce its pollution. The objective of this study was to find potential reasons for P pollution in water bodies despite a decrease in potato acreage. Historically, the potato was found to be responsible for P water contamination due to its high P sensitivity and low P removal (25–30 kg ha−1) from the soil. Despite University of Maine recommended rate of 56 kg ha−1 P, if soil tests reveal that P is below 50 kg ha−1, growers tend to apply P fertilizer at the rate of 182 kg ha−1 to compensate for any loss. The second key reason for excessive P application is its tendency to get fixed by aluminum (Al) in the soil. Soil sampling data from UMaine Soil Testing Laboratory confirmed that in Maine reactive Al levels have remained high over the last ten years and are increasing further. Likewise, P application to non-responsive sites, soil variability, pH change, and soil testing methods were found to be other possible reasons that might have led to increases in soil P levels resulting in P erosion to water streams.
1. Introduction
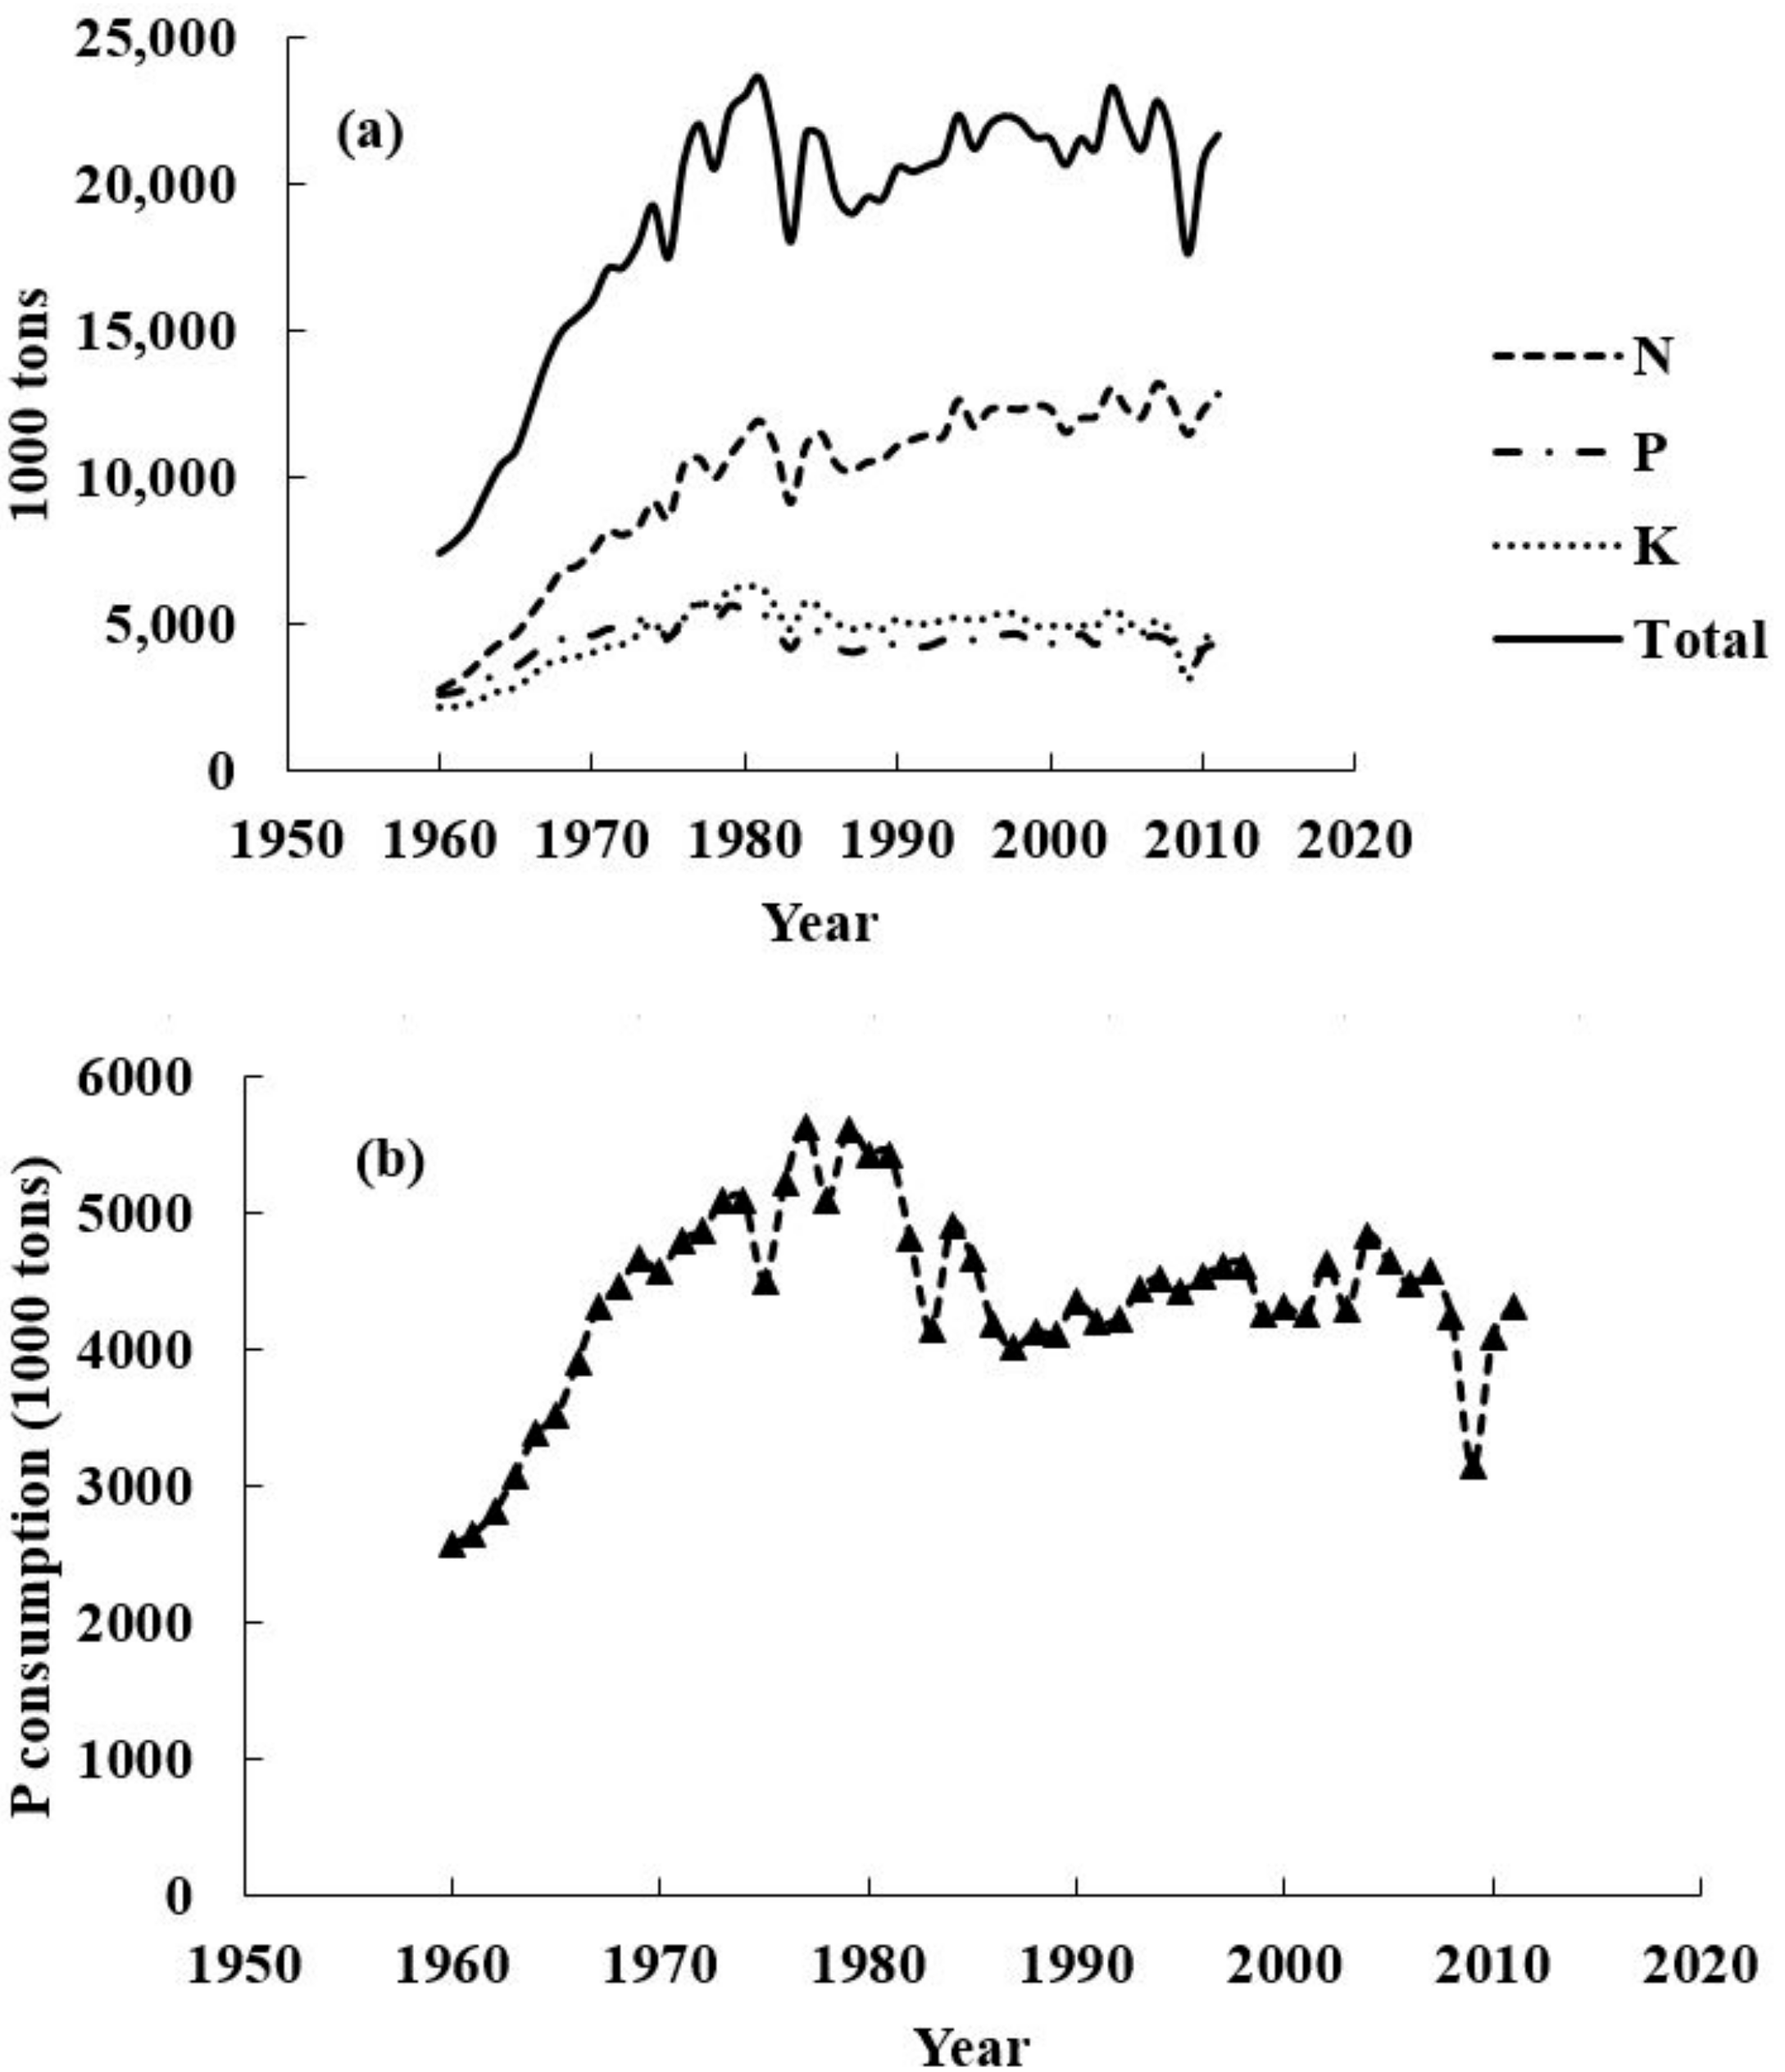
Following the green revolution, the use of chemical fertilizer has increased (Figure 1) in agricultural crop production. The fertilizer consumption has not only increased crop yield but also deteriorated environmental conditions [1]. Phosphorus (P) efficiency was calculated by the simple calculation of total fertilizer P uptake by potato per hectare divided by total fertilizer applied. Total mineralized P per hectare was also added to the total P applied. The efficiency of P in Maine is only ~17%. However, the efficiency of applied P fertilizer was found to be 16%. Since its use as a fertilizer, P pollution in United States water streams has been a challenge. However, not many efforts are carried out to stop its erosion from agriculture fields to nearby water bodies. Due to a lack of knowledge about the impact of soil P erosion into the water bodies, P pollution has created a grave danger to our wildlife. The P pollution in the Northeast United States has been reported by several studies carried out by the Environmental Protection Agency (EPA) [2].
In the United States, the application rates of the primary fertilizers containing nitrogen (N), phosphorus (P), and potassium (K) has increased (Figure 1) [3]. The P consumption grew at the beginning of 1960 near the green revolution and then fell after 1980 following reports of P erosion to lakes and rivers in the United States [4,5,6]. However, it again started increasing after 2010 despite several government regulations in place. In the past, potato cultivation was found to be responsible for P pollution among Northeast lakes due to unnecessary P fertilizer application. Currently, P concentrations have been found to be increasing in northeast lakes and rivers [2] raising legitimate questions regarding the amounts of P applied in agriculture production.
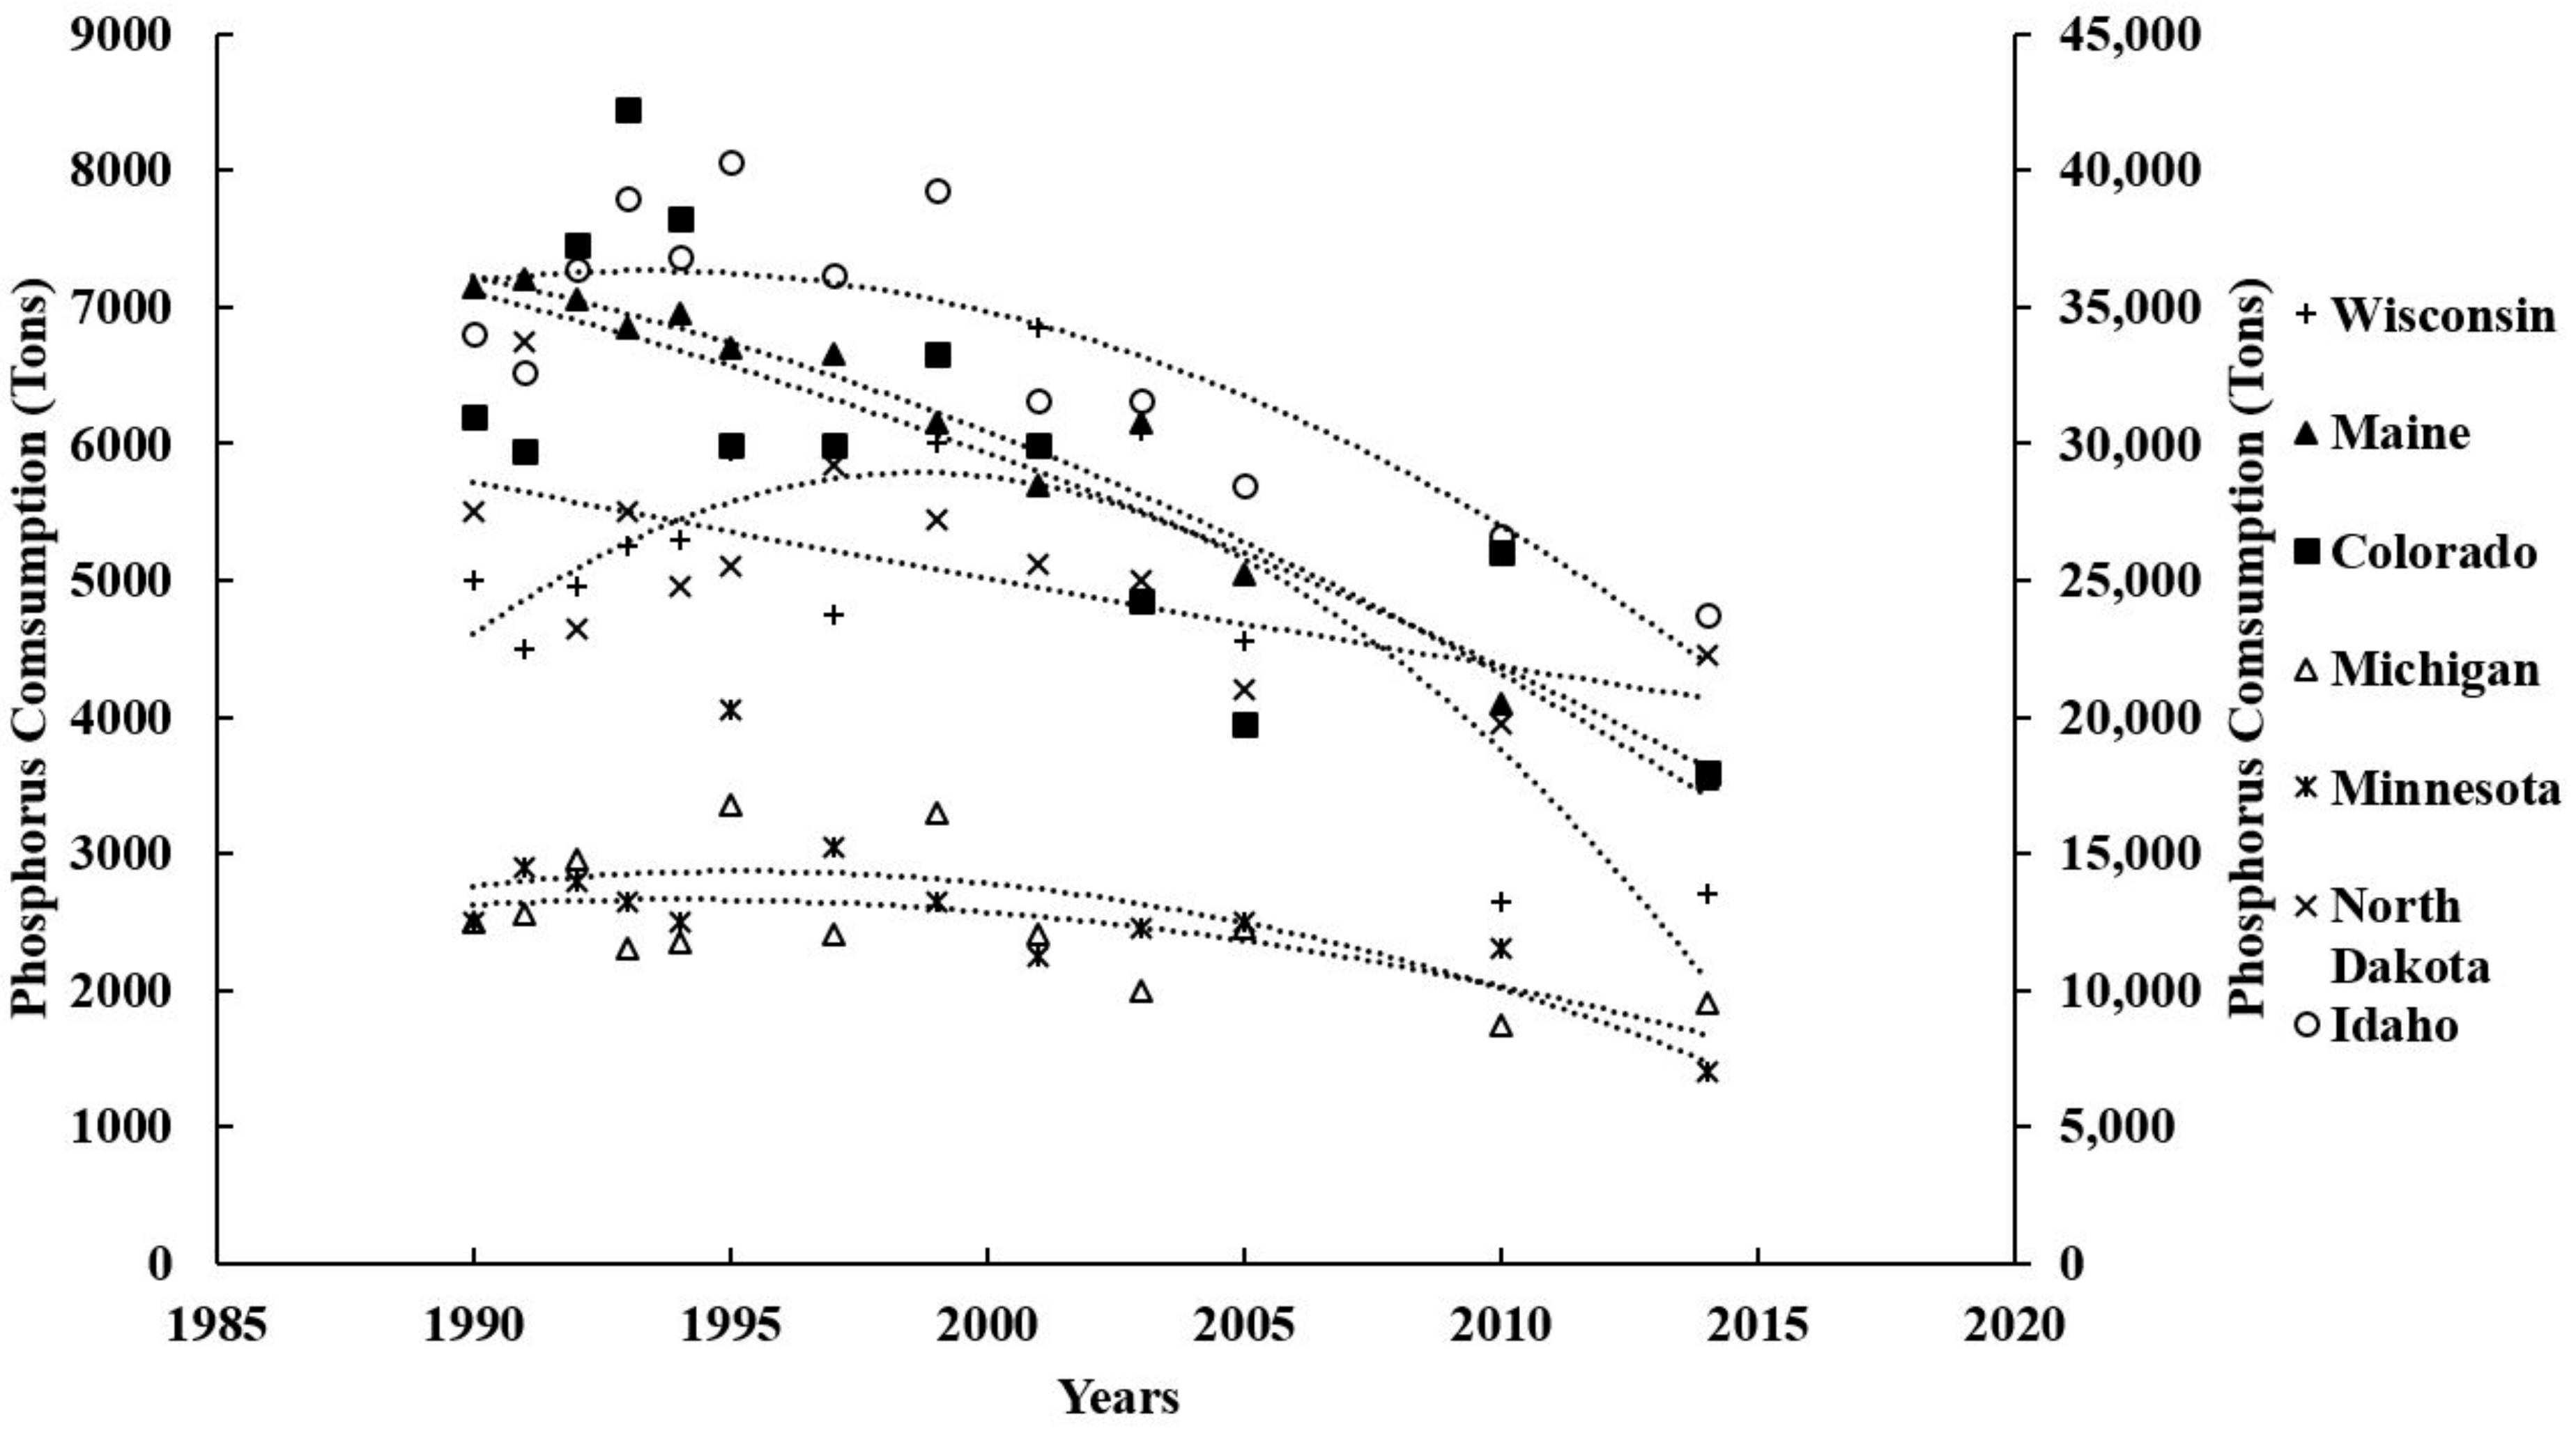
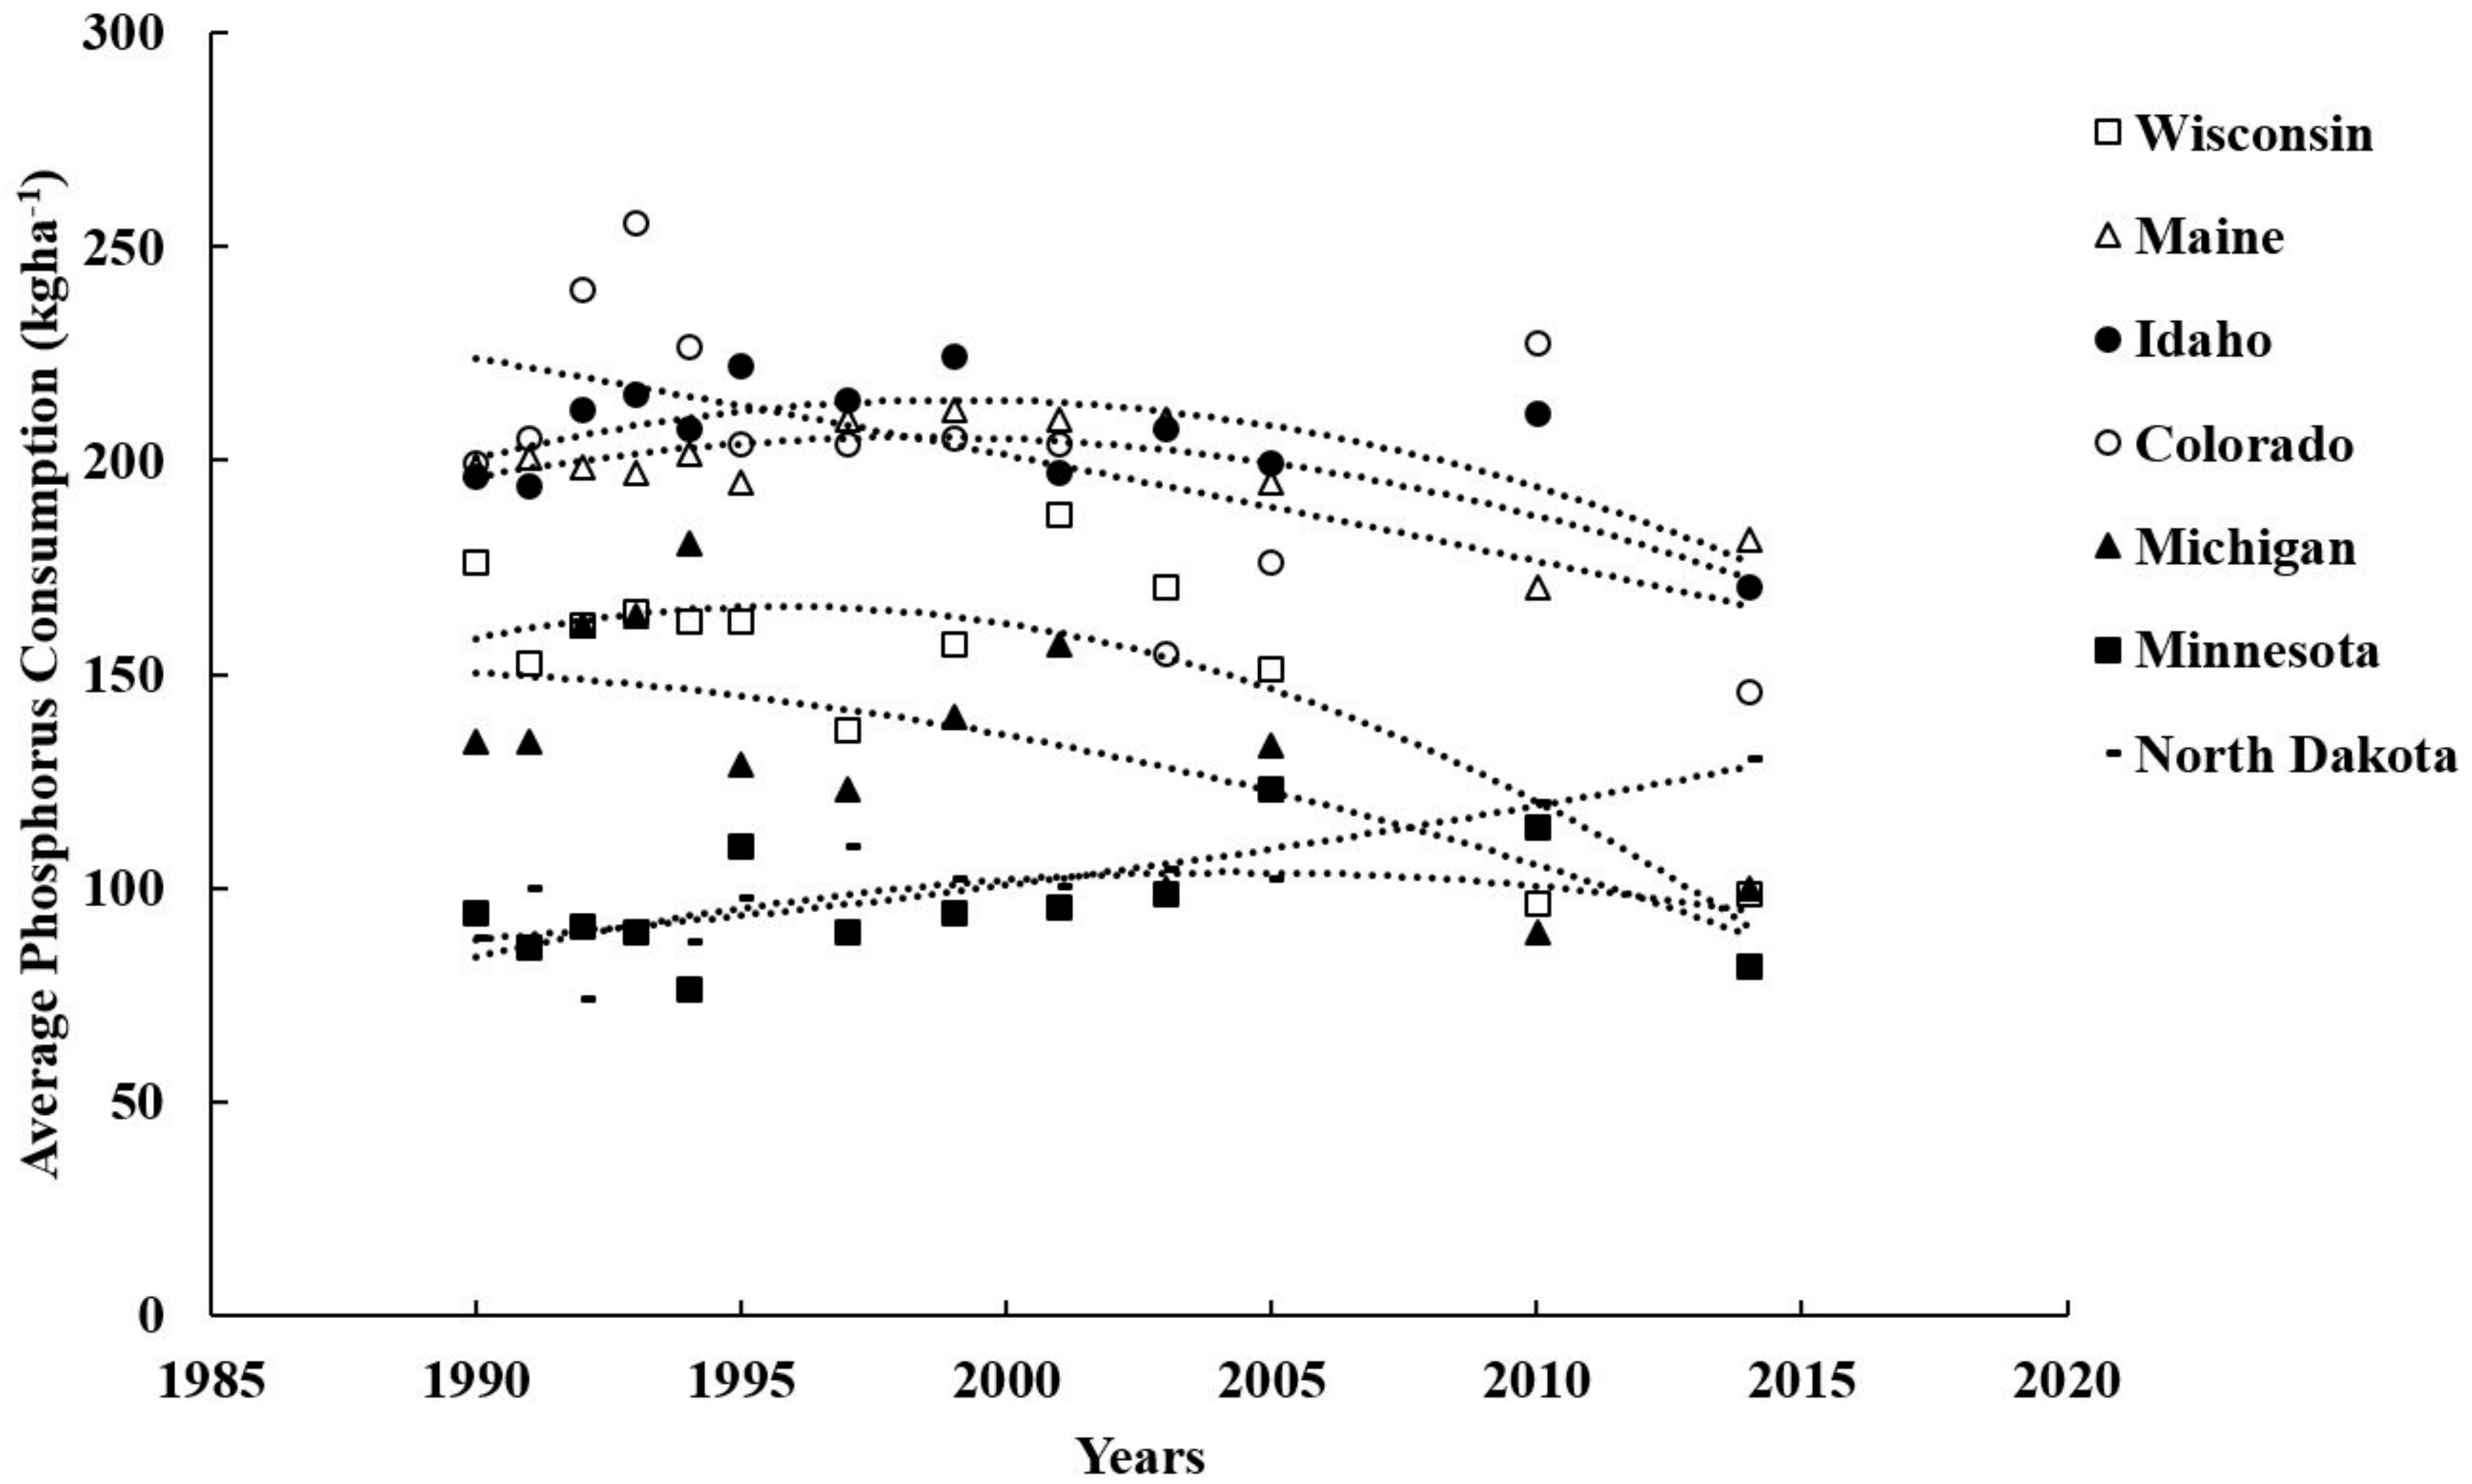
State-wise P consumption was compared under potato cultivation from crucial potato growing regions. It was found that P use has declined (Figure 2), which could be due to a decrease in the area under potato cultivation, but the question remains as to why P pollution is high. Therefore, average P was analyzed, where Minnesota and North Dakota states were found to exhibit an increasing trend (Figure 3). However, the P application rate was found to be decreasing in Maine, but the decrease was found to be insignificant (Figure 3), which suggested that there is sufficient P available or a buildup in the soil to support optimal potato yield.
Potato growers tend to apply more P than recommended to compensate for any P loss to unavailable forms (Figure 3) (e.g., in Minnesota and North Dakota) [3]. In Maine, 58,000 tons of chemical fertilizer were applied on more than 101,171 ha of land, which mostly includes crops such as potatoes, apples, blueberries, and forage [3]. Presently, potato cultivation is again under scrutiny as a result of increased P pollution recently found in Maine’s lakes and rivers because of historical association that potato cultivation is responsible for P pollution. In Florida, potato cultivation has been found to be responsible for P loss to St. Johns River [7]. A study by the United States Geological Survey (USGS) confirmed that nearly 300 million acres, representing ~71% of United States cropland, has at least one of four contaminants (dissolved nitrate, total phosphorus, fecal coliform bacteria, and suspended sediment) creating water quality issues [8]. In Maine, Environmental Protection Agency (EPA) has raised concerns over the non-point source of phosphorus (P), e.g., agricultural practices that led to increasing the concentration of P in nearby water bodies [9]. The total impaired hectares due to P pollution were found to be 14,407 [9]. In 2014, the total P applied in potatoes in Maine was 3550 t with average 182 kg ha−1 [3]. The P uptake in potato is very low with an average of ~28 kg ha−1 [10] and since only 10% [11] of applied P is available for potatoes, its efficiency becomes dramatically low, resulting in P erosion to water streams.
The three basic ways that P can enter water resources are run-in, runoff, and leaching. P was found to be the primary cause of poor water quality in freshwater sources [12]. It is estimated that 10–40% of the P movement to water bodies from agricultural land occurs through soil runoff and leaching [13]. A concentration of P more than 0.02 parts per million (ppm) in water creates a severe problem of eutrophication [14]. High P levels have been recorded in Maine’s lakes and rivers, resulting in a need to manage P levels to reduce eutrophication [15]. Soil testing is a vital tool that allows farmers to know the nutrient status of their farm soil, but despite recommendations from every state, P pollution is increasing, which indicates that there is an over application of P fertilizer. Several studies have been conducted since the 1940s [16,17,18,19,20,21,22,23,24], but so far answers regarding P requirements, especially for potatoes, have not been clear.
Several reasonable questions arise with high P levels in Maine’s water bodies.
- Do Maine’s soils have sufficient P to support optimum crop yield?
- Were P recommendations developed from responsive sites?
- Is there any gap between average P removal by the crop and application as fertilizer?
- Are appropriate soil testing methods used for P?
2. Sufficient Soil P and Soil Variability
UMaine Soil Testing Laboratory data from 2006–2015 was analyzed, and ~85% of soil samples in Maine were found to have sufficient P (Figure 4a), i.e., in the range of between 24–56 kg ha−1. Since 2006, significant P has been applied to Maine agriculture systems irrespective of the recommendation from UMaine Soil Testing Laboratory, and this may be responsible for the P pollution in Maine’s lakes and rivers. Among all the samples, 5% exhibited more than 56 kg ha−1 of P, and 10% of soil samples were P deficient. The steady application of P over an extended period may have resulted in massive soil P buildup [25,26,27]. The question is that if the soil has sufficient P, then why is it that growers tend to apply more P.
One reason is that growers apply P to protect themselves from any P deficiency due to P soil erosion. They apply P to ensure a sufficient supply to the crops and to follow the philosophy of soil nutrient buildup and maintenance. The low price of P supports its excessive application. The second important reason is a high level of soil reactive aluminum (Al), especially when pH is low 5–6 [28]. Soil reactive Al may fix applied P and leave limited P for crop plants. Currently, the typical pH range in Maine is between 4.9–6. The Al, a dominant cation at low pH, reacts with P and forms aluminum phosphate, a crystalline structure which further converts itself to amorphous aluminum phosphate [28]. A regression line was used to predict the trend. The Al shows a gradual increase in its level over time in Aroostook County soils (Figure 4b). This trend indicates a high possibility that P might be fixed in high amounts in Maine’s soil.
In another study in Maine by Sharma et al. [23], no P was applied and the maximum yield was obtained as 59 t ha−1 (Figure 5) when the average Maine potato yield was 44 t ha−1 [3] and farmer yield was ~53 t ha−1 from the same field with a P rate of 182 kg ha−1. This confirmed that many, but not all, farms in Maine might have enough P for maximum optimal potato yield.
Soils in Maine have improved their fertility levels due to crop and livestock production and high fertilizer applications [24]. Manure application and organic agriculture are other reasons for the improvement in soil fertility. The P concentration in the Northeast United States soil samples excluding Ohio was found to be more than 50 parts per million (ppm) with Bray P-1 [24]. In the Northeast States, over 50% of annual soil test results showed high levels of plant-available P [21]. This indicates vast P soil reserves build up from unnecessary P applications because many of these states have determined soil P recommendations from non-responsive P sites. Consequently, they did not find an ideal P rate for optimal yield. The amount of work required increased by the need to develop recommendations for multiple regions that consider the effects of different soil types, climates, crop growth habits, and crop requirements.
Several studies documented that soil type variation could have a significant impact on P response towards crop yield [29,30,31,32,33], as demonstrated in the introduction. A study at University of Kentucky on P showed the differences that occurred from testing soil P (Mehlich III solution) using different soils with the same rate of P application [33]. Therefore, it was necessary to study the soil types in Maine and Aroostook County, Maine. There are 21 soil mapping units in Maine, and out 21, 15 mapping units are present in Aroostook County, a major potato growing area in Maine (Table 1 and Table 2). Soils behave differently towards P response, crop yield, P supplying ability, and P retention. They may further vary in their P distribution within the landscape (Table 1). Table 2 shows that there are soils containing gravel or stone with apparent good drainage which may move P to groundwater and near streams. However, silt loam soils could retain more P. The soil order in Maine with significant distribution is Spodosols which is susceptible to P deficiency, with the third minimum distribution of P among 12 orders (after Andisols and Vertisols) [34].
3. P Recommendations and Soil pH
The change in pH was examined because of the high influence of soil pH on soil P availability. The UMaine Soil Testing Laboratory data from 2006–2015 was used to determine the change in pH over the time.
The soil pH in Maine has improved since the past ten years (Figure 6), mostly after the P recommendations were developed. The pH of Maine potato soils has increased due to a switch from round white varieties to scab resistant Russet Burbank potato variety and because farmers are interested in growing grains and other rotation crops that require higher soil pH. However, P recommendations in Maine were developed when the average pH was around 5 (20 years ago); the soil pH has since improved to ~6 (at the present time) and is expected to improve further due to more emphasis on growing grains. Figure 6a is an average of ~1000 soil samples from Maine each year. The distribution and correlation value (r2 = 0.44) confirm that the increase in soil pH was gradual. Similarly, the increase in levels of calcium (Figure 6b) with a significant coefficient of correlation (r2 = 0.70) also confirmed that farmers applied lime to improve their soil pH.
A study by Fitzgerald et al. [23] to develop P recommendations proved that there was sufficient P available in Maine soils. Only one site (r2 = 0.66) out of 12 showed a positive P response. It was important that the sites with no P response had high to too high P availability. Since there was not sufficient data to develop P recommendations in Maine, researchers recommended a minimum of ~56 kg ha−1 of P application, when the P value found between 22–56 kg ha−1. Although the minimum application rate of 56 kg ha−1 is not too high, then again it could lead to excessive P erosion to Maine’s water resources. Besides, given that the average P rate application in Maine is ~182 kg ha−1 [3], it is clear that farmers are over fertilizing their soil unnecessarily when ~85% of the soil samples from the last ten years were found with high P levels.
The critical P concentration is the minimum P for maximum yield. Soil testing is a standard method to determine the soil P level and required level of additional P application if the soil P level is found less than the threshold value. The threshold value is specific to each soil P test [36,37,38]. These specific P values for the individual test were developed after calibration and experimentation used to calculate optimum P rate with the maximum economic return. In-season P application is an approach to correct any P deficiency [39]. However, this approach was questioned since there was no consistent relationship between what was reported between petiole P and potato yield [40]. The other important method to improve P recommendations is to identify and quantify the critical P value for potatoes. The approach of critical P value in potatoes was first used by Zamuner et al. [41] in Argentina.
In early 1945, potato production was believed to be responsible for increasing plant-available P levels in the eastern United States [16], when modified Truog method was in frequent use. The amount of available P in soil samples from cultivated land in Alabama, Virginia, and New York was found to be ~68 times more than the nearby virgin soils [16]. During the same period, the available P levels in Maine showed a positive linear relationship with estimated P applied to the soils from the last 20 years [17]. However, the elevated P levels in the soils were attributed to the low tuber P removal compared to the amount of P applied, for example, in 1947, only 11% of the P that was applied to Maine potato cultivation was removed from the field within harvested tubers.
Hawkins et al. [17] studied Maine potato soils in 1947 to evaluate the fertility status of the soils in relation to fertilizer application and crop rotation. They found that 5 of 11 sites showed no yield response to P fertilizer. Modified Truog P levels at the sites ranged from 49 to 328 kg P ha−1, with most containing more than 121 kg P ha−1. The unresponsive sites included the four soils testing highest in plant-available P. Soils requiring the higher P applications for optimal yield tend to have lower plant-available P levels, and no yield responses to the addition of the highest rate of P fertilizer seen at any sites. The lowest-testing soil not only was unresponsive to P fertilizer additions, but it also showed the highest yield. Although four different varieties (cultivars Green Mountain, Katahdin, Irish Cobbler, and Chippewa) were grown in this experiment, no site contained more than one variety, and so it was impossible to examine varietal differences in response. These results demonstrate that it was possible to produce an optimum yield of a potato crop without the addition of P fertilizer. However, it is also evident that the modified Truog test could not consistently identify the responsive sites, which could be due to the limiting factors, e.g., soil with same plant-available P level perform differently depending upon other parameters such as climate [17].
4. Gap in Fertilizer Application and P Removal
The crop response to applied P fertilizer depends on the soil P availability and crop uptake ability. The available P can slowly be replenished but depends upon the uptake speed and behavior of the crop [42]. Once the crop absorbs the available P from the soil solution, it can slowly be replenished by the unavailable or stable form of P. The plant’s ability to take up available soil P from soil solution further depends on its root distribution [42,43,44]. In potatoes, P is applied as a banded application for direct contact of potato roots to P fertilizer, but the amount of rainfall (Figure 7a) after planting and before potato P uptake creates a window for P fertilizer to move deeper or to be fixed in unavailable or marginally available forms. In contrast, lack of P movement in some instances could lead to less P availability under banded application treatments compared to broadcast application. Figure 7b demonstrates that the maximum amount of total rainfall in Maine occurs after potato planting in June (40%). The potato planting in Maine happens in late May, and early June, especially in the high potato growing area that is northern Maine, therefore, most of the P applied to potatoes or cultivated after the potato season is highly prone to erosion.
There is evidence that the P available from the soil may be sufficient to allow the reduction or elimination of P fertilizer applications to potatoes [23]. Maier et al. [19] studied potato crop response to P fertilizer at 33 sites in South Australia using Kennebec, Coliban, Exton, Sebago, and Russet Burbank varieties. When sites were grouped according to the soil textures, relative yield (100 × yield at 0 P rate)/maximum yield) approached 100% on the soils with the highest initial plant-available P level. This pattern held true for measurements made using all of the seven plant-available P extraction methods examined (Colwell, Olsen, Bray I, Bray II, Lactate, Mehlich I, and fluoride methods). Several studies have reported low potato P uptake or removal from the soil (Table 3). It was also found that the P uptake numbers varied substantiallyand that could be due to the differences in potato varieties.
5. Discrepancies in Soil P Testing
Water could be used to extract P from the soil. However, due to the lack of significant leftover undissolved P and analysis difficulties of water as an extractant, several extractants have been proposed to extract forms of P in soils. The Truog method [45] uses dilute H2SO4 buffered to pH 3.0. The Bray method, which uses a combination of HCl and NH4F, was used to extract acid soluble P forms, mostly Al and Fe-bound P [46] in the North Central states. In 1953, another combination (Mehlich 1), HCl and H2SO4 acids were introduced to extract the P and other nutrients in southeastern soils [47]. In 1984, Mehlich further modified earlier extractants to Mehlich 3, a combination of acetic acid (HOAc) and nitric (HNO3) acid, salts (ammonium fluoride (NH4F), and ammonium nitrate (NH4NO3)). The chelating agent ethylenediaminetetraacetic acid (EDTA) is suitable for both acidic and neutral soils. In alkaline soils, 0.5 M sodium bicarbonate (NaHCO3) solution at a pH of 8.5 is used to extract P [48]. In 2000, anion exchange resin (AER) [14] and Fe-oxide impregnated paper (IIP) methods were introduced. In those methods, the thought of P sink was used to imitate plant root systems and measure the amount soil P available for absorption by the plants, but due to its high labor requirement and longer time requirement, this test was found to be impractical to follow. However, with recent developments in filter paper and FeO precipitates, this test could be used as an alternative to other standard P tests [49,50,51,52].
The typical soil test for P is modified Morgan in Northeast states due to the region’s acidic soils and low (less than 20) cation exchange capacity (CEC). Modified Morgan uses 0.62 M NH4OAc + 1.25 M CH3COOH at pH 4.8. Soil tests from the last ten years in Maine showed increases in soil P with an average value of ~32 kg ha−1. The optimum range of P in soils for potatoes as recommended by UMaine Soil Testing Laboratory is between 20–50 kg ha−1, but farmers still apply P on their soil, which means the excess P that is being applied to soil results in P erosion to Maine’s water sources. The optimum range (20–50 kg ha−1), which is quite broad, with a range of 30 kg ha−1, reflects the overall uncertainty in potato P response. Few P research studies were found in the literature that were performed in New England. However, P recommendation studies and their results have never been published, making it difficult for growers and researchers to amend their cultural practices or scientific research for better P guidelines.
Unfortunately, none of these results including Maine can be used to refine current recommendations from the University of Maine. The UMaine Soil Testing Laboratory stopped using the modified Truog plant-available P method and adopted the modified Morgan method (NH4-acetate) in the 1960s, initially at pH 3.0 but later standardized to pH 4.8. With some modifications, Cornell University’s fertilizer recommendation scheme was adopted for use with the original Morgan extract. However, little calibration work has been performed in Maine to support these recommendations. Experiments on the University of Maine Agricultural and Forest Experiment Station’s Aroostook Research Farm indicate that the recommendations for soils testing around 22 kg P ha−1 (modified Morgan extract) are adequate (G. Porter, unpublished data). Until now, no study had been conducted to test the quality of these recommendations for Aroostook County potato soils testing above 22 kg P ha−1.
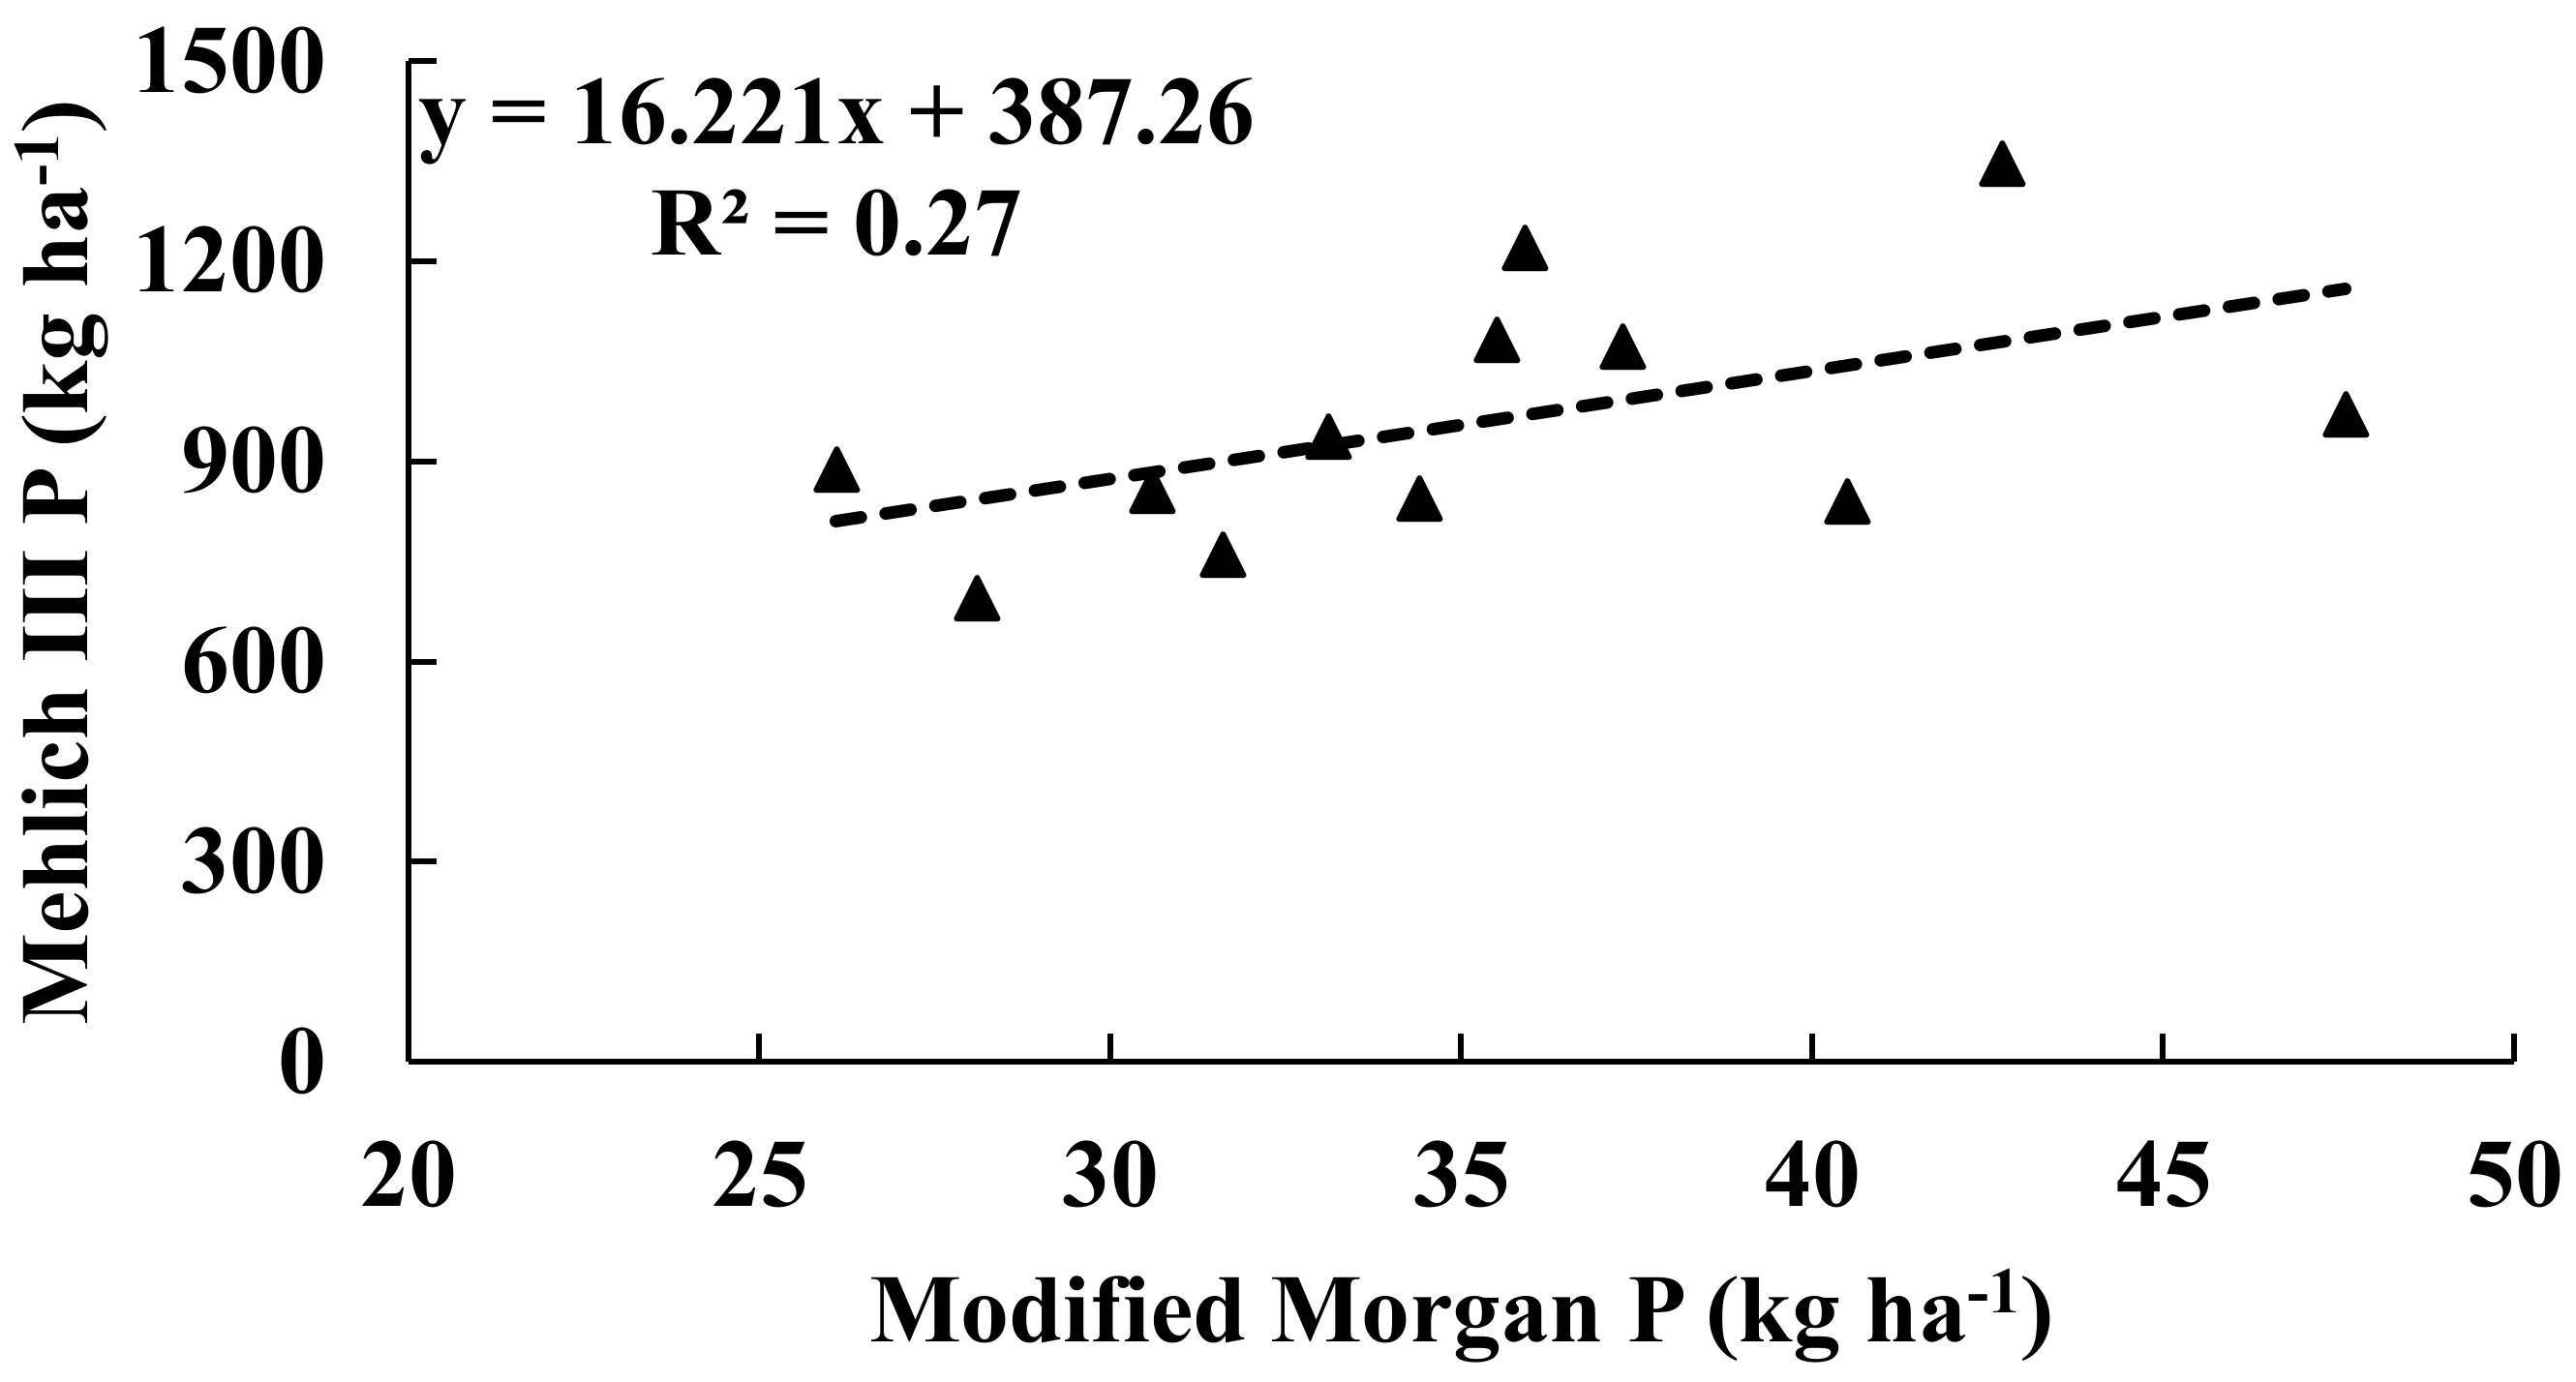
The P recommendation study was done in 1999 in Maine, where only one site out of 12 was found to exhibit a significant P response towards potato yield [23]. The study was published as a thesis. There were 12 sites, where pre-planting soil tests were conducted using Modified Morgan and Mehlich III P tests. The data was analyzed after doing a linear correlation between the P numbers from two tests (Figure 8). A weak correlation was found (R2 = 0.27), indicating a weak relationship between the two methods. Although there was some relationship between Mehlich III extractant and potato yield, it was weak, with small r2 value, which means it may not explain yield variability. Also, the relationship between the P value from Mehlich III and yield was inconsistent. Therefore, use of Mehlich III for P recommendations is questionable. In contrast, leaf and tuber P concentration was reported to increase with P rates using both Mehlich II and Modified Morgan. This inconsistency indicates the need to revise the recommendations using low P sites in Maine.
6. Conclusions
It is clear that soils in Maine are highly variable and may have sufficient P to support the maximum crop yield. Therefore, it is necessary to recalibrate the recommendation equation using low, medium, and high P sites. Also, while developing P recommendations, it is essential to differentiate between soil types and regions because of differences in soil variability and soil moisture, both of which may act as significant driving forces for plant growth and nutrient movement in plant roots. The study found that P recommendations need to be revised in order to consider soil variability and recalibration of soil P test. The average results from soil P tests have increased, and that is a clear signal of P buildup in Maine’s soils, which have a history of excessive P application. Improvement in soil pH after the development and implementation of P recommendations raises questions about the credibility of the recommendations. The study recommends more detailed recommendations, which consideri soil types, climate variables, and cultivation system (number of crop rotation) using multiyear data from low, medium, high, and above optimum P level sites. The study also found it to be crucial to consider the type of potato growers, e.g., table stock growers, seed growers, and processing growers, while developing P recommendations. We suggest that while developing P recommendations, it may be essential to differentiate between soil types and regions. For example, in North Dakota, United States for N in corn, sunflower, and wheat [53,54,55,56,57,58,59,60,61] recommendations were developed considering soil variability, the price of the commodity, cultivation system, yield potential, and soil moisture. It was found that there is a need to examine banded application according to the crop root system development because banded application P stays where it is applied. However, roots grow beyond the P fertilizer band. An outreach program from the University of Maine is required to guide and demonstrate to the growers the details of P response under high and low P soil sites. More education and training among growers may help in lessening P pollution because the growers are generally the ones responsible for making the decisions on P rates in their fields. An explanatory extension publication on P recommendation procedure and its accompanying equation could help growers to understand how P rates are calculated and decided for a specific area.
Acknowledgments
We are thankful to University of Maine and University of Kentucky for allowing us to use their data for the best representation of this article.
Author Contributions
Sharma and Bali contacted the UMaine Soil Laboratory for data processing. Both wrote this article in collaboration. Ahemd Zaeen, refined the language and held in collection of review literature.
Conflicts of Interest
There is no conflict of interest. Also, any data used in the article was done so after obtaining permission from the concerned person(s).
References
- IOM (Institute of Medicine); NRC (National Research Council). A Framework for Assessing Effects of the Food System; The National Academies Press: Washington, DC, USA, 2015.
- EPA. 2015. Available online: https://www.epa.gov/aboutepa/epa-region-1-new-england (accessed on 17 December 2017).
- USDA-NASS. 2016. Available online: https: (accessed on 1 April 2017).
- Almazan, J.A.; Pickett, R.L. Water temperature. In IFYGL Atlas Lake Ontario Summary Data; Jenkins, C.F., Ed.; Great Lakes Environmental Research Laboratory: Ann Arbor, MI, USA, 1980; pp. 200–244. [Google Scholar]
- Assel, R.A.; Boyce, D.E.; DeWitt, B.H.; Wartha, J.H.; Keyes, F.A. Summary of Great Lakes Weather and Ice Conditions, Winter 1977–78; NOAA Technical Memorandum ERL GLERL-26; Great Lakes Environmental Research Laboratory: Ann Arbor, MI, USA, 1979. [Google Scholar]
- Bell, G.L. Lake Erie Chemical and Physical Characteristics Data for 1967; NOAA Data Report ERL GLERL-4; Great Lakes Environmental Research Laboratory: Ann Arbor, MI, USA, 1980; p. 9. [Google Scholar]
- Pack, J.E.; Hutchinson, C.M.; Simonne, E.H. Evaluation of Controlled-Release Fertilizers for Northeast Florida Chip Potato Production. J. Plant Nutr. 2006, 29, 1301–1313. [Google Scholar] [CrossRef]
- Smith, V.H.; Tilman, G.D.; Nekola, J.C. Eutrophication: Impacts of excess nutrient inputs on freshwater, marine, and terrestrial ecosystems. Environ. Pollut. 1999, 100, 179–196. [Google Scholar] [CrossRef]
- Maine Department of Environmental Protection (Maine DEP). Integrated Water Quality Monitoring and Assessment Report; Bureau of Land and Water Quality: Augusta, ME, USA, 2012.
- Stark, J.C.; Westermann, D.T.; Hopkins, B.G. Nutrient Management Guidelines for Russet Burbank Potatoes; University of Idaho: Moscow, ID, USA, 2004. [Google Scholar]
- Van der Zaag, P. Soil Fertility Requirements for Potato Production; Technical Information Bulletin 14; International Potato Center (CIP): Lima, Peru, 1981. [Google Scholar]
- Flanagan, S.M.; Nielsen, M.G.; Robinson, K.W.; Coles, J.F. Water-Quality Assessment of the New England Coastal Basins in Maine, Massachusetts, New Hampshire, and Rhode Island: Environmental Settings and Implications for Water Quality and Aquatic Biota; Water-Resources Investigations Report 98–4249; U.S. Geological Survey: Pembroke, NH, USA, 1999. [Google Scholar]
- Sharpley, A.N.; Smith, S.J.; Jones, O.R.; Berg, W.A.; Coleman, G.A. The transport of bioavailable phosphorus in agricultural runoff. J. Environ. Qual. 1992, 21, 30–35. [Google Scholar] [CrossRef]
- Sharpley, A.N. Bioavailable phosphorus in soil. In Methods for Phosphorus Analysis for Soils, Sediments, Residuals, and Water; Pierzynski, G.M., Ed.; Southern Cooperative Series Bulletin; North Carolina State University: Raleigh, NC, USA, 2000; pp. 38–43. [Google Scholar]
- McGuire, P. Analysis: Belgrade Lake’s water quality down. Portland Press Herald, 27 July 2015. [Google Scholar]
- Peech, M. Nutrient Status of Soils in Commercial Potato-Producing Areas of the Atlantic and Gulf Coast: Part II. Chemical Data on the Soils1. Soil Sci. Soc. Am. J. 1946, 10, 245. [Google Scholar] [CrossRef]
- Pizzeghello, D.; Berti, A.; Nardi, S.; Morari, F. Relationship between soil test phosphorus and phosphorus release to solution in three soils after long-term mineral and manure application. Agric. Ecosyst. Environ. 2016, 233, 214–223. [Google Scholar] [CrossRef]
- Rhue, R.D.; Hensel, D.R.; Yuan, T.L.; Robertson, W.K. Response of potatoes to soil and fertilizer phosphorus in northeast Florida. Soil Crop Sci. Soc. Fla. Proc. 1981, 40, 58–61. [Google Scholar]
- Maier, N.A.; Potocky-Pacay, K.A.; Dahlenburg, A.P.; William, C.M.J. Effect of phosphorus on the specific gravity of potato tubers (Solanum tuberosum L.) of the cultivars Kennebec and Coliban. Aust. J. Exp. Agric. 1989, 29, 869–874. [Google Scholar] [CrossRef]
- Pierzynski, G.M.; Logan, T.I. Crop, soil, and management effects on phosphorus soil test levels. J. Prod. Agric. 1993, 6, 513–520. [Google Scholar] [CrossRef]
- Sharpley, A.N. Dependence of runoff phosphorus on extractable soil phosphorus. J. Environ. Qual. 1995, 24, 920–926. [Google Scholar] [CrossRef]
- Porter, G.A.; McBurnic, J.C. Crop and soil research. In The Ecology, Economics, and Management of Potato Cropping Systems: A Report of the First Four Years of the Maine Potato Ecosystem Project; Alford, A.R., Drummond, F.A., Gallandt, E.R., Groden, E., Lambert, D.A., Liebman, M., Marra, M.C., McBurnie, J.C., Porter, G.A., Salas, B., Eds.; Maine Agricultural and Forest Experiment Station: Orono, ME, USA, 1996. [Google Scholar]
- Sharma, L.; Bali, S.; Dwyer, J.; Plant, A.; Bhowmik, A. A case study of improving yield prediction and sulfur deficiency detection using optical sensors and relationship of historical potato yield with weather data in maine. Sensors 2017, 17, 1095. [Google Scholar] [CrossRef] [PubMed]
- Fitzgerald, C. Soil phosphorus in Aroostook County (Maine) Potato Cropping Systems: Organic Matter Effects and Residual Phosphorus Contributions. Master’s Thesis, University of Maine, Orono, ME, USA, 1998. [Google Scholar]
- Bruulsema, B.T.W. Soil Fertility in the Northeast Region. Better Crops 2006, 90, 8–10. [Google Scholar]
- Hochmuth, G.; Weingartner, P.; Hutchinson, C.; Tilton, A.; Jesseman, D. Potato yield and tuber quality did not respond to phosphorus fertilization of soils testing high in phosphorus content. HortTechnology 2002, 12, 420–423. [Google Scholar]
- Campbell, C.A.; Zentner, R.P.; Selles, F.; Jefferson, P.G.; McConkey, B.G.; Lemke, R.; Blomert, B.G. Long-term effect of cropping system and nitrogen and phosphorus fertilizer on production and nitrogen economy of grain crops in a Brown Chernozem. Can. J. Plant Sci. 2005, 85, 81–93. [Google Scholar] [CrossRef]
- McKenzie, R.H.; Roberts, T.L. Soil and fertilizer phosphorus update Alberta Soil Sci. In Proceedings of the Workshop Coast Terrace, Edmonton, AB, Canada, 20–22 February 1990. [Google Scholar]
- Carpenter, P.N.; Murphy, H.I. Effects of AccullIulaLecl Fertilizer Nutrients in a Maine Soil upon the Yield, Quality and Nutrient Content or Potato Plants; Maine Agricultural Experiment Station: Orono, ME, USA, 1965. [Google Scholar]
- Murphy, H.I.; Carpenter, P.N. Effect of Differential Rates of Phosphorus, Potassium and Lime on Yield, Specific Gravity, and Nutrient Uptake of the Katahdin and Russet Burbank; Maine Agricultural Experiment Station: Orono, ME, USA, 1967. [Google Scholar]
- Locascio, S.J.; Breland, H.L. Irish potato yield and leaf composition as affected by dolomite and phosphorus. Soil Crop Sci. Soc. Fla. Proc. 1963, 23, 95–99. [Google Scholar]
- Hochmuth, G.; Maynard, D.; Vavrina, C.; Hanlon, E. Plant Tissue Analysis and Interpretation for Vegetable Crops in Florida. 1991. Available online: http://edis.ifas.ufl.edu/ep081 (accessed on 17 December 2017).
- Schultz, E.E.; DeSutter, T.; Sharma, L.K.; Enders, G.; Ashley, R.; Bu, H.; Markell, S.; Kraklau, A.; Franzen, D.W. Response of sunflower to nitrogen and phosphorus in North Dakota. Agron. J. 2017, in press. [Google Scholar]
- Baligar, V.C.; Fageria, N.K.; He, Z.L. Nutrient use efficiency in plants. Commun. Soil Sci. Plant Anal. 2001, 32, 921–950. [Google Scholar] [CrossRef]
- Thom, W.O.; Dollarhide, J.E. Phosphorus Soil Test Change Following the Addition of Phosphorus Fertilizer to 16 Kentucky Soils. Agron. Notes 2002, 34, 1–4. [Google Scholar]
- Reddy, A. Phosphorus Transport and Distribution in Kentucky Soils Prepared Using Various Biochar Types. Master’s Thesis, Western Kentucky University, Bowling Green, KY, USA, 2012; pp. 1–49. [Google Scholar]
- Hurst, L.A.; Knobel, E.W.; Hendrickson, B.H. Soil Survey of Aroostook Area, Maine; United States Department of Agriculture: Washington, DC, USA, 1917. [Google Scholar]
- Johnston, A.E.; Poulton, P.R.; White, R.P. Plant-available soil phosphorus. Part II: The response of arable crops to Olsen P on a sandy clay loam and a silty clay loam. Soil Use Manag. 2013, 29, 12–21. [Google Scholar] [CrossRef]
- Rosen, C.J.; Kelling, K.A.; Stark, J.C.; Porter, G.A. Optimizing phosphorus fertilizer management in potato production. Am. J. Potato Res. 2014, 91, 145–160. [Google Scholar] [CrossRef]
- Echeverría, H.E.; Giletto, C.M. Papa. In Soil Fertility and Crop Fertilization; Echeverría, H.E., García, F.O., Eds.; Editorial INTA: Buenos Aires, Argentina, 2015; pp. 585–608. [Google Scholar]
- Hegney, M.A.; McPharlin, I.R.; Jeffery, R.C. Using soil testing and petiole analysis to determine phosphorus fertiliser requirements of potatoes (Solanum tuberosum L. cv. Delaware) in the Manjimup-Pemberton region of Western Australia. Aust. J. Exp. Agric. 2000, 40, 107. [Google Scholar] [CrossRef]
- Mac Kerron, D.K.L.; Young, M.W.; Davies, H.V. A critical assessment of the value of petiole sap analysis in optimizing the nitrogen nutrition of potato crop. Plant Soil 1995, 172, 247–260. [Google Scholar] [CrossRef]
- Zamuner, E.C.; Lloveras, J.; Echeverria, H. Comparison of Phosphorus Fertilization Diagnostic Methods of Potato in Mollisols. Agron. J. 2016, 108, 1237–1245. [Google Scholar] [CrossRef]
- Beegle, D.; Durst, P.T. Managing phosphorus for crop production. Penn. State Ext. Agron. Facts 2014, 13, 1–6. [Google Scholar]
- Payton, F.V.; Rhue, R.D.; Hensel, D.R. Mitscherlich–Bray equation used to correlate soil phosphorus and potato yields. Agron. J. 1989, 81, 571–576. [Google Scholar] [CrossRef]
- Truog, E. The determination of readily available phosphorus in soils. I. Am. Soc. Agron. 1930, 22, 874–882. [Google Scholar]
- Jenkins, P.D.; Ali, H. Phosphorus supply and progeny tuber numbers in potato crops. Ann. App. Biol. 2000, 136, 41–46. [Google Scholar] [CrossRef]
- Ali, H.; Khan, M.A.; Shakeel, A.; Randhawa, A. Interactive Effect of Seed Inoculation and Phosphorus Application on Growth and Yield of Chickpea (Cicer arietinum L.). Int. J. Agric. Biol. 2004, 6, 110–112. [Google Scholar]
- Bray, R.H.; Kurtz, L.T. Determination of total, organic and available phosphorus in Soil. Soil Sci. 1945, 59, 39–45. [Google Scholar] [CrossRef]
- Mehlich, A. Mehlich 3 soil test extractant: A modification of Mehlich 2 extractant. Commun. Soil Sci. Plant Anal. 1984, 15, 1409–1416. [Google Scholar] [CrossRef]
- Olsen, S.R.; Cole, C.V.; Watanabe, F.S.; Dean, L.A. Circular. In Estimation of Available Phosphorus in Soils by Extraction with Sodium Bicarbonate; US Department of Agriculture: Washington, DC, USA, 1954; Volume 939, p. 19. [Google Scholar]
- McIntosh, J.L. Bray and Morgan soil test extractants modified for testing acid soils from different parent materials. Agron. J. 1969, 61, 259–265. [Google Scholar] [CrossRef]
- Sharma, L.K.; Franzen, D.W. Use of Corn Height to Improve the Relationship between Active Optical Sensor Readings and Yield Estimates. Precis. Agric. 2014, 15, 331–345. [Google Scholar] [CrossRef]
- Franzen, D.W.; Sharma, L.K.; Bu, H.; Dentond, A. Evidence for the ability of active-optical sensors to detect sulfur deficiency in corn. Agron. J. 2016, 108, 2158–2162. [Google Scholar] [CrossRef]
- Sharma, L.K.; Bu, H.G.; Denton, A.; Franzen, D.W. Active-Optical Sensors Using Red NDVI Compared to Red Edge NDVI for Prediction of Corn Grain Yield in North Dakota, U.S.A. Sensors 2015, 15, 27832–27853. [Google Scholar] [CrossRef] [PubMed]
- Bu, H.; Sharma, L.K.; Denton, A.; Franzen, D.W. Sugarbeet root yield and quality prediction at multiple harvest dates using active-optical sensors. Agron. J. 2016, 108, 273–284. [Google Scholar] [CrossRef]
- Bu, H.; Sharma, L.K.; Denton, A.; Franzen, D.W. Comparison of Satellite Imagery and Ground-Based Active Optical Sensors as Yield Predictors in Sugar Beet, Spring Wheat, Corn, and Sunflower. Agron. J. 2017, 109, 299–308. [Google Scholar] [CrossRef]
- Franzen, D.W.; Sharma, L.K.; Bu, H. Active Optical Sensor Algorithms for Corn Yield Prediction and a Corn Side-Dress Nitrogen Rate Aid; North Dakota State University Extension Service: Fargo, ND, USA, 2014. [Google Scholar]
- Sharma, L.K. Evaluation of Active Optical Ground-Based Sensors to Detect Early Nitrogen Deficiencies in Corn. Ph.D. Thesis, North Dakota State University, Fargo, ND, USA, 2014. [Google Scholar]
- Sharma, L.K.; Bu, H.; Franzen, D.W. Comparison of two ground-based active-optical sensors for in-season estimation of corn (Zea mays, L.) yield. J. Plant Nutr. 2016, 39, 957–966. [Google Scholar] [CrossRef]
- Sharma, L.K.; Bu, H.; Franzen, D.W.; Denton, A. Use of corn height measured with an acoustic sensor improves yield estimation with ground based active optical sensors. Comput. Electron. Agric. 2016, 124, 254–262. [Google Scholar] [CrossRef]
Figure 1.
The trend of nitrogen, phosphorus, and potassium consumption in the United States under all agriculture crops since 1960; (a) represents all the fertilizer together. However, (b) represents only phosphorus use in the whole United States. The horizontal axis represents the years, and the vertical axis shows the consumption rate. Source: United States Department of Agriculture, National Agricultural Statistics Service.

Figure 2.
The trend of total phosphorus use for potato cultivation in the significant potato-growing states since 1990. The polynomial regression analysis was utilized to investigate a potential relationship between years and phosphorus use. Idaho yield is represented on secondary due to the high matrix. Source: USDA, National Agricultural Statistics Service, and New England Ag Statistics.

Figure 3.
The trend of average phosphorus (kg ha−1) for potato cultivation in the significant potato-growing states since 1990. The polynomial regression analysis was utilized to investigate a potential relationship between years and phosphorus use. Source: USDA, National Agricultural Statistics Service, and New England Ag Statistics.

Figure 4.
The soil phosphorus and aluminum levels in Aroostook County Maine. UMaine Soil Testing Laboratory received soil samples from 2006–2015. (a) Change in phosphorus levels with time; (b) change in aluminum levels with time. The trend is positive and shows the significant relationship of soil phosphorus buildup with successive years.
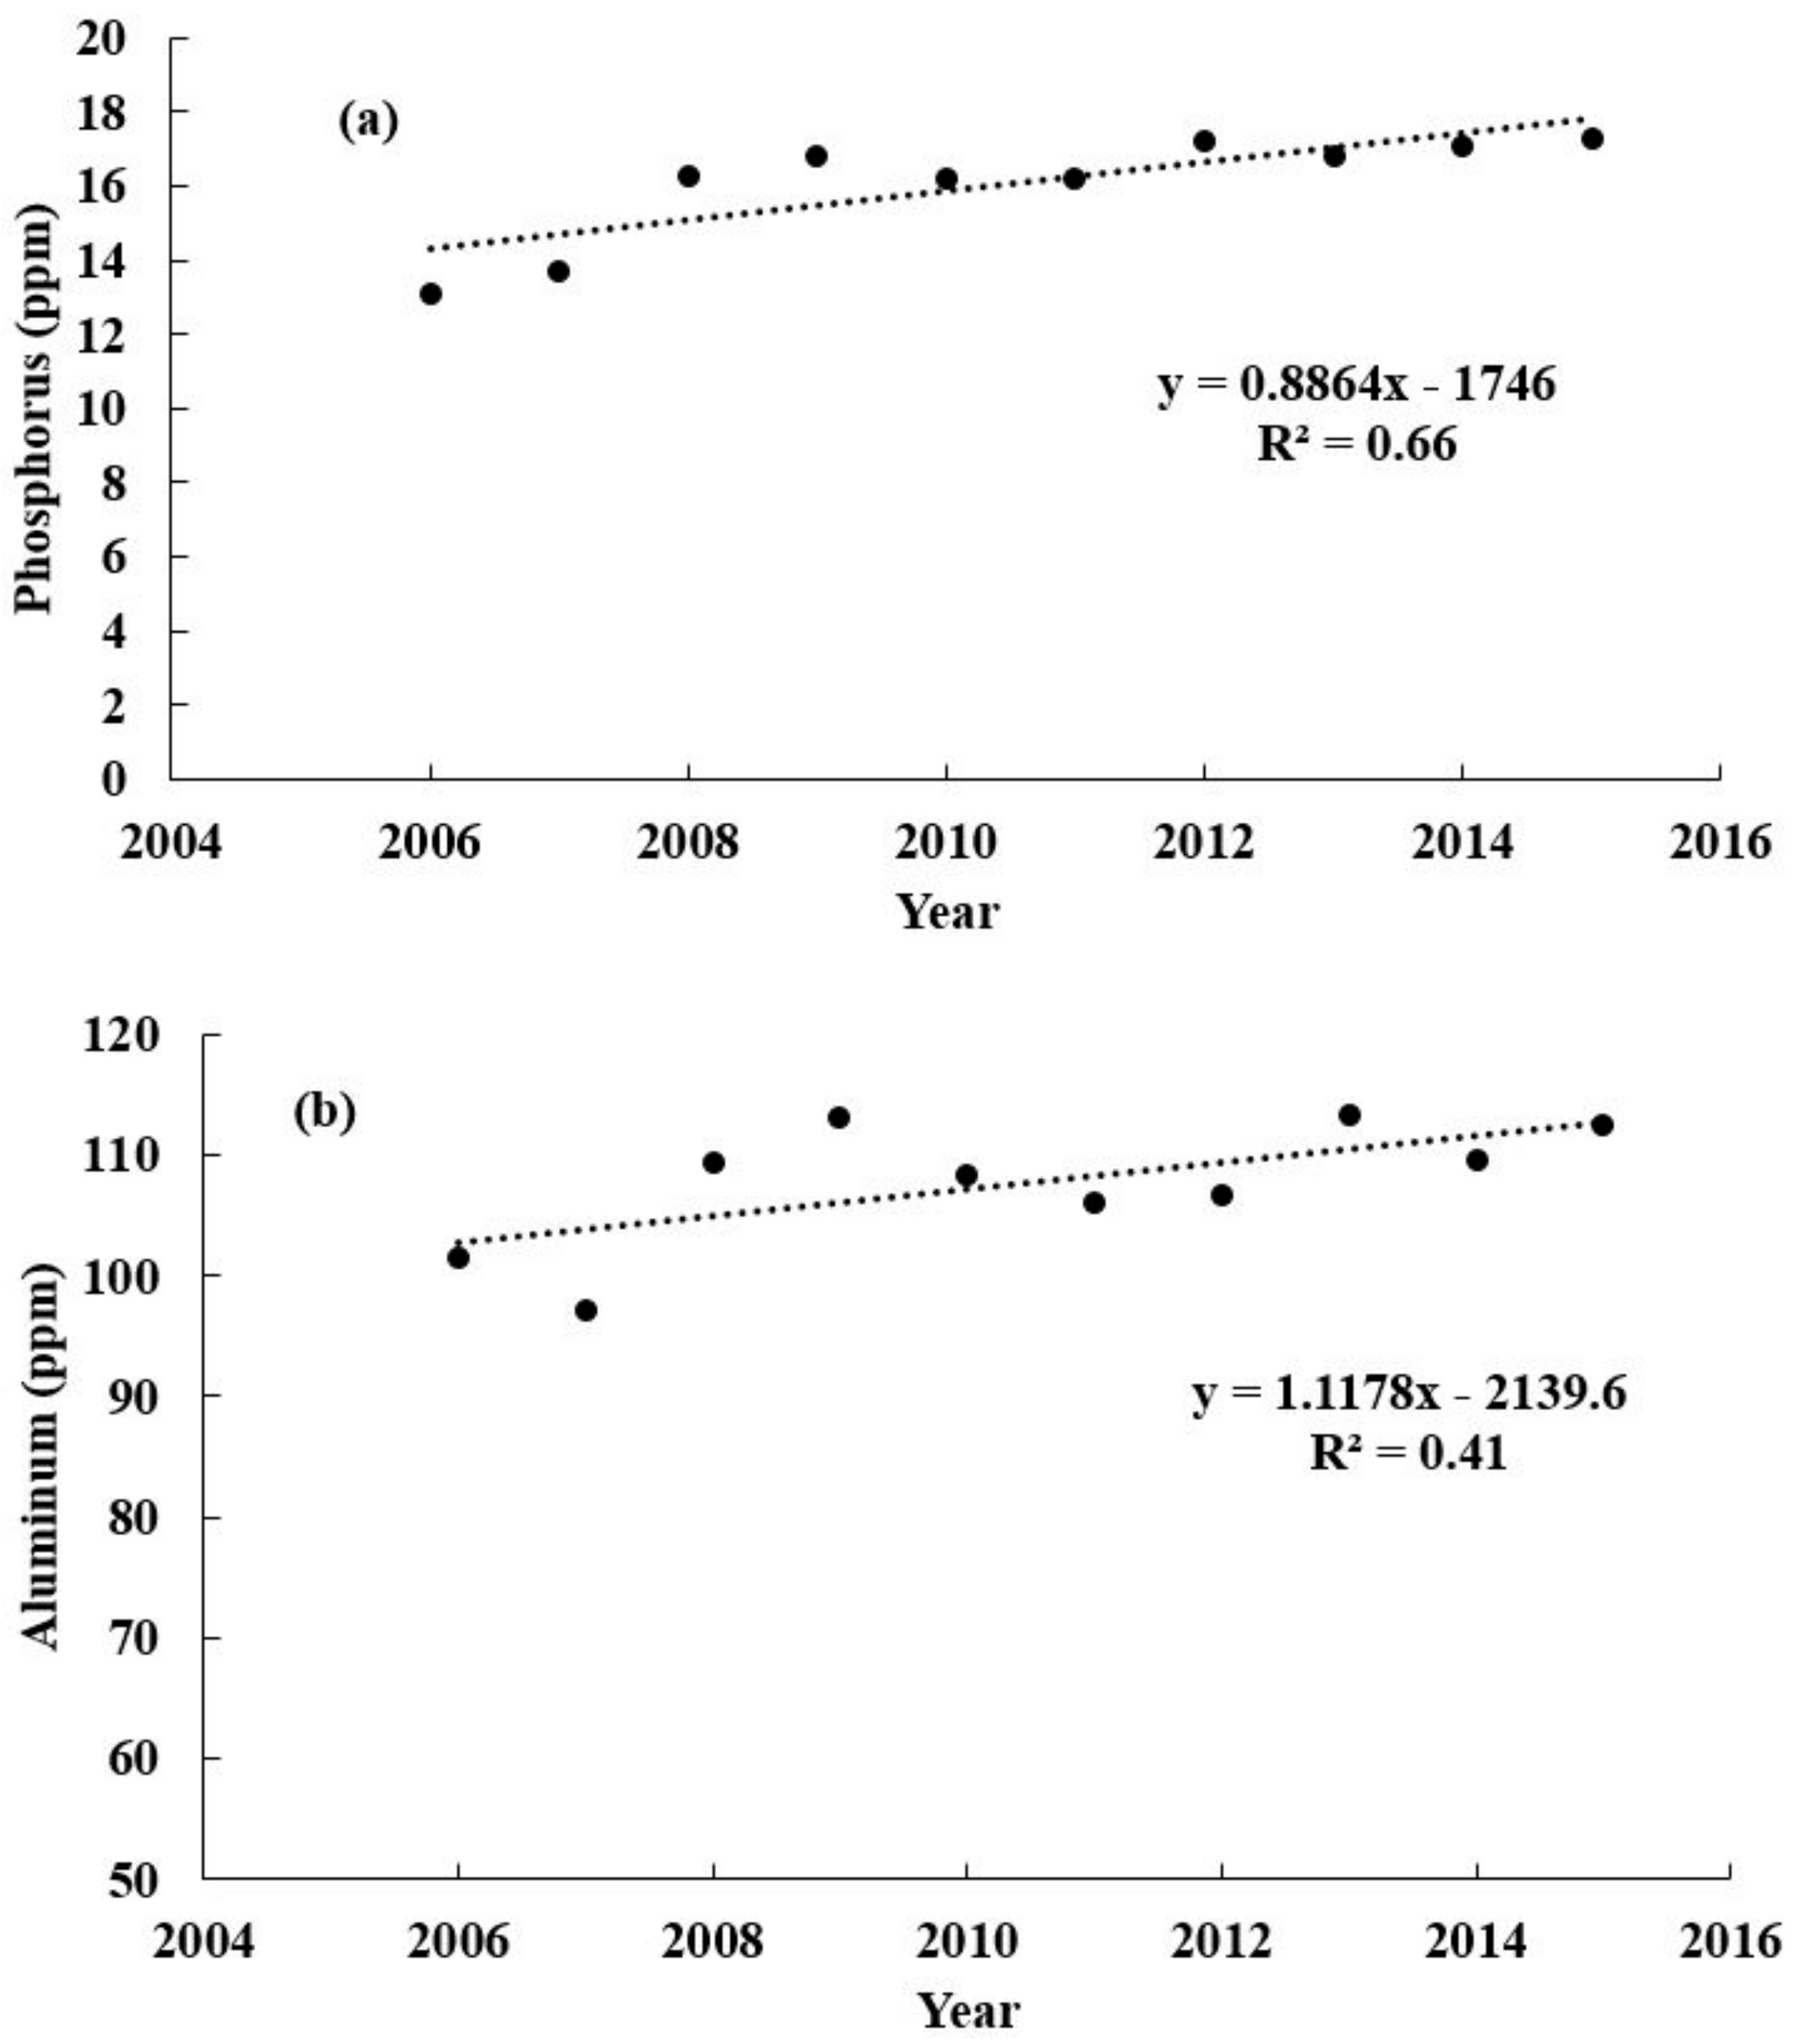
Figure 5.
Representing potato yield response with CAN (calcium ammonium nitrate) rates when no phosphorus was applied in 2016.
Figure 5.
Representing potato yield response with CAN (calcium ammonium nitrate) rates when no phosphorus was applied in 2016.
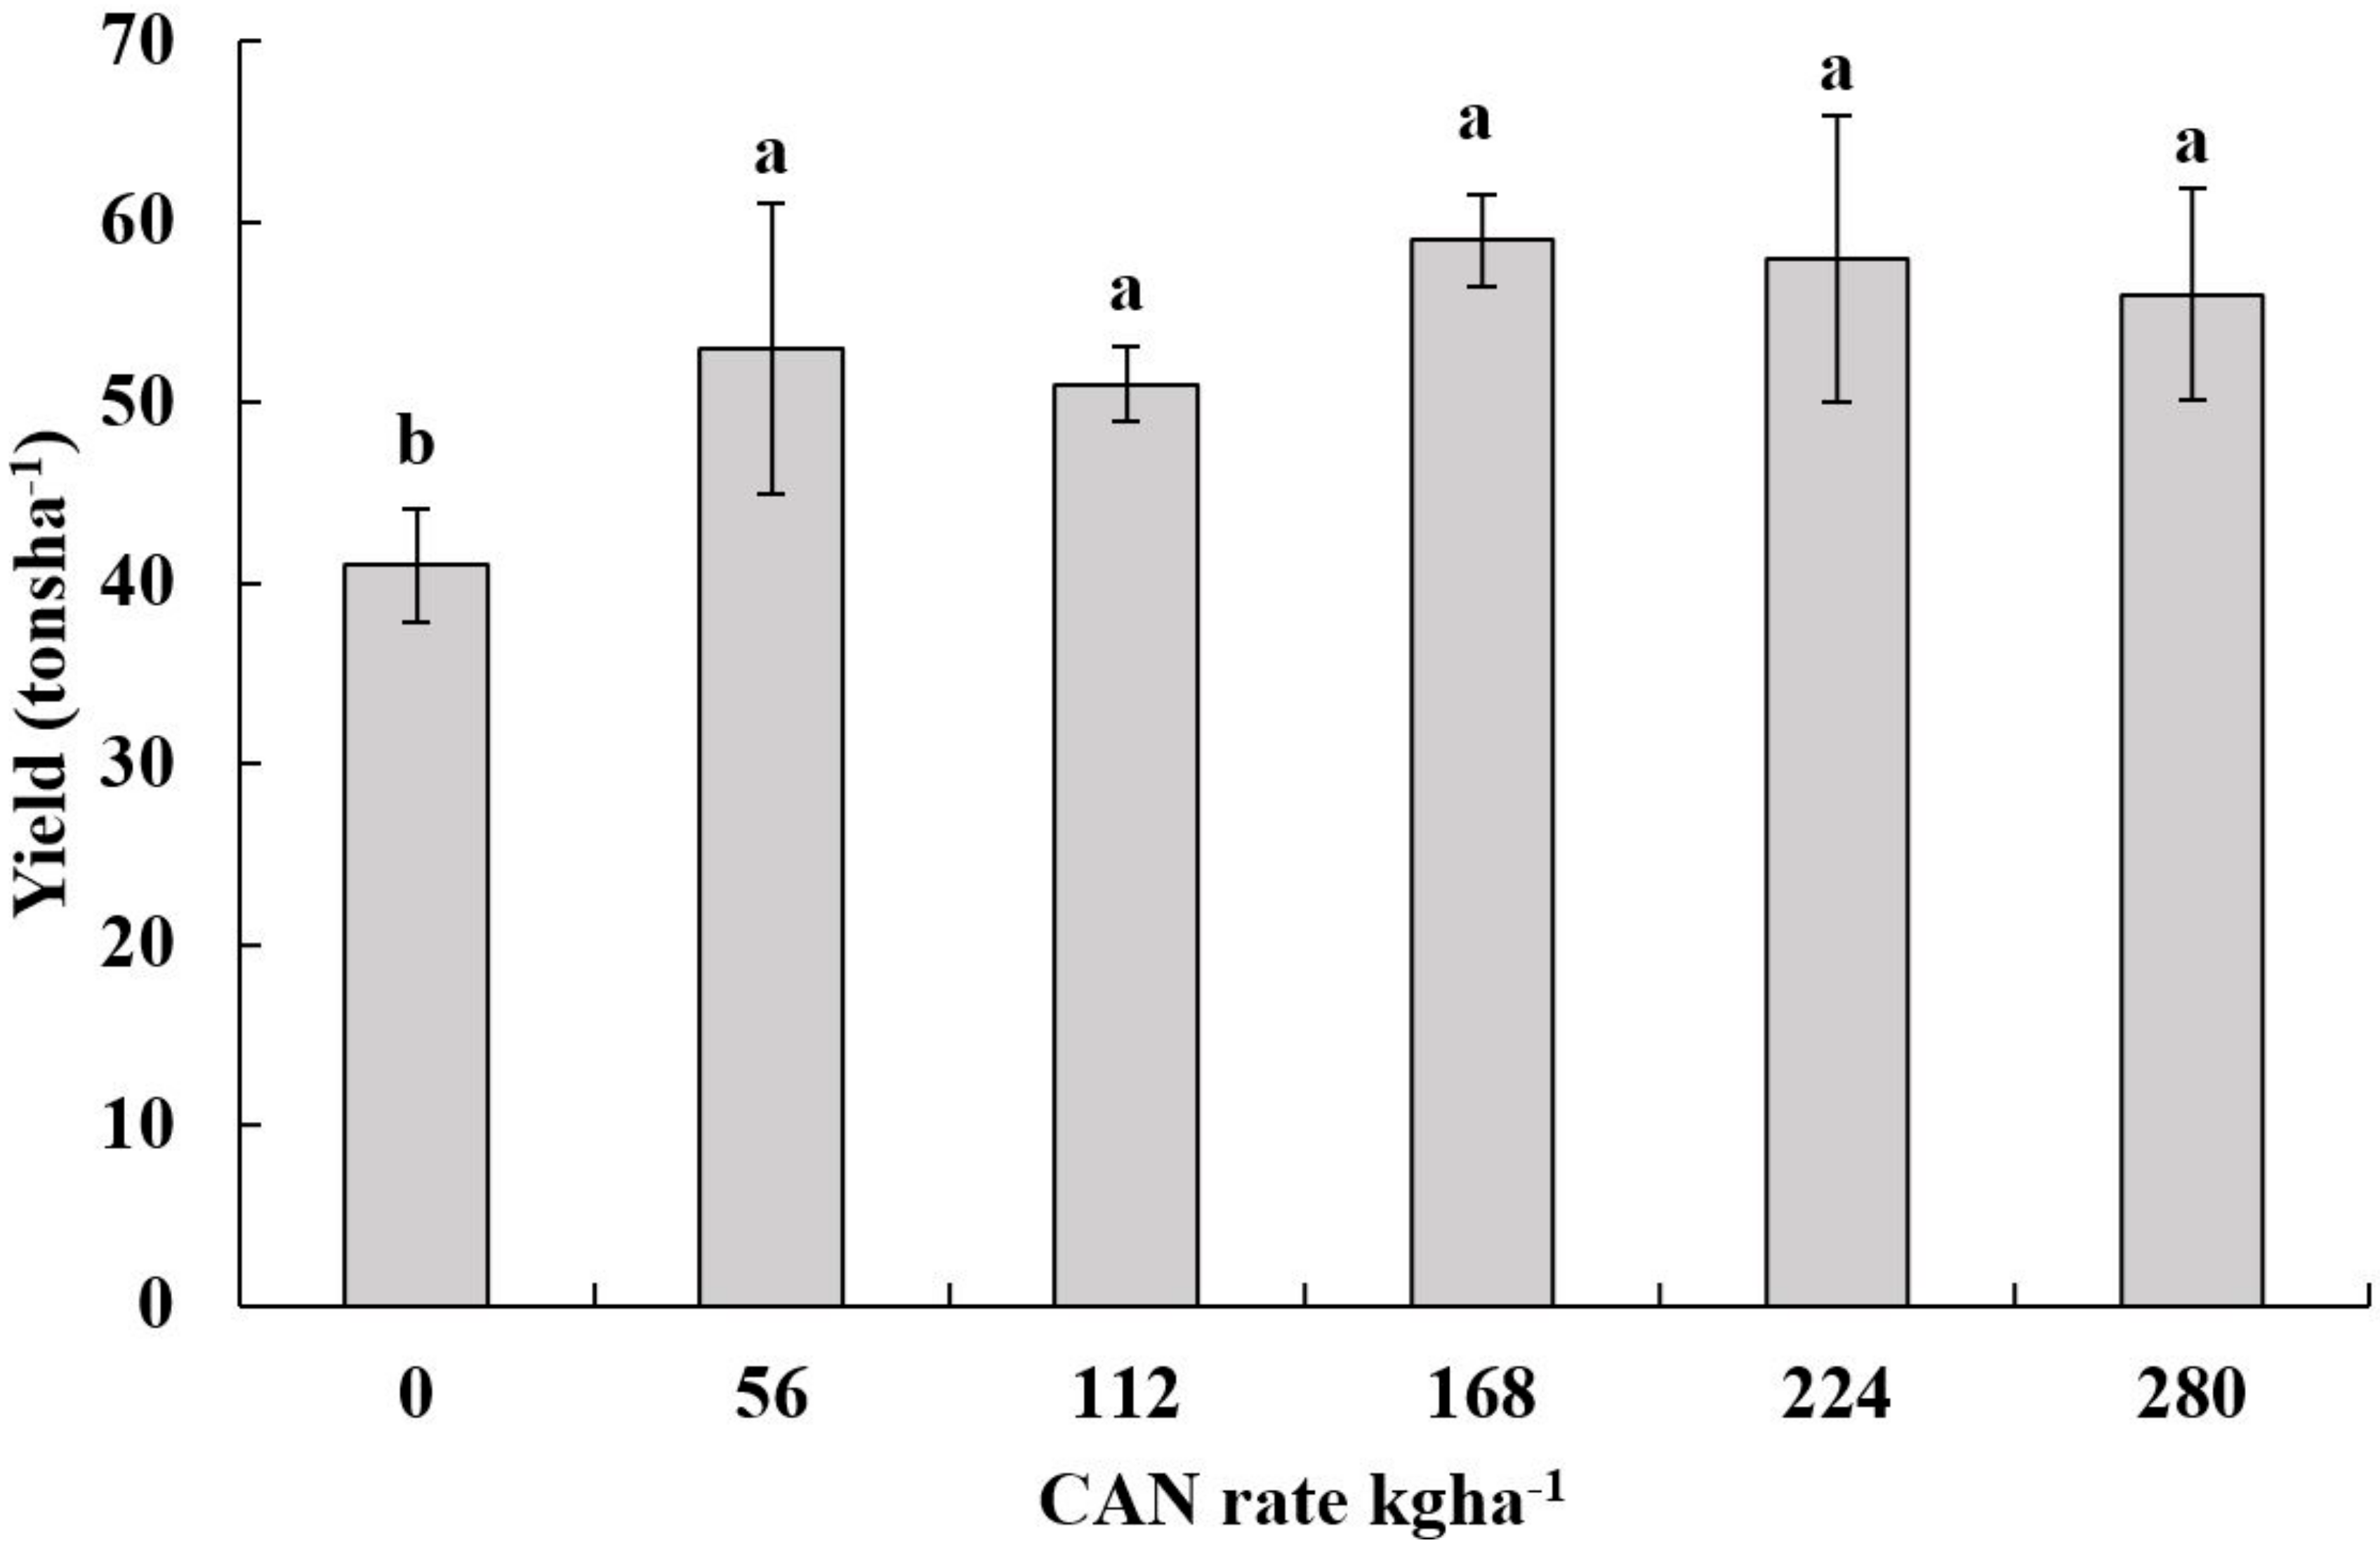
Figure 6.
The trend of change in soil pH and calcium level over time (2006–2015) in Aroostook County. (a) Change in pH; (b) a shift in calcium level with time.
Figure 6.
The trend of change in soil pH and calcium level over time (2006–2015) in Aroostook County. (a) Change in pH; (b) a shift in calcium level with time.
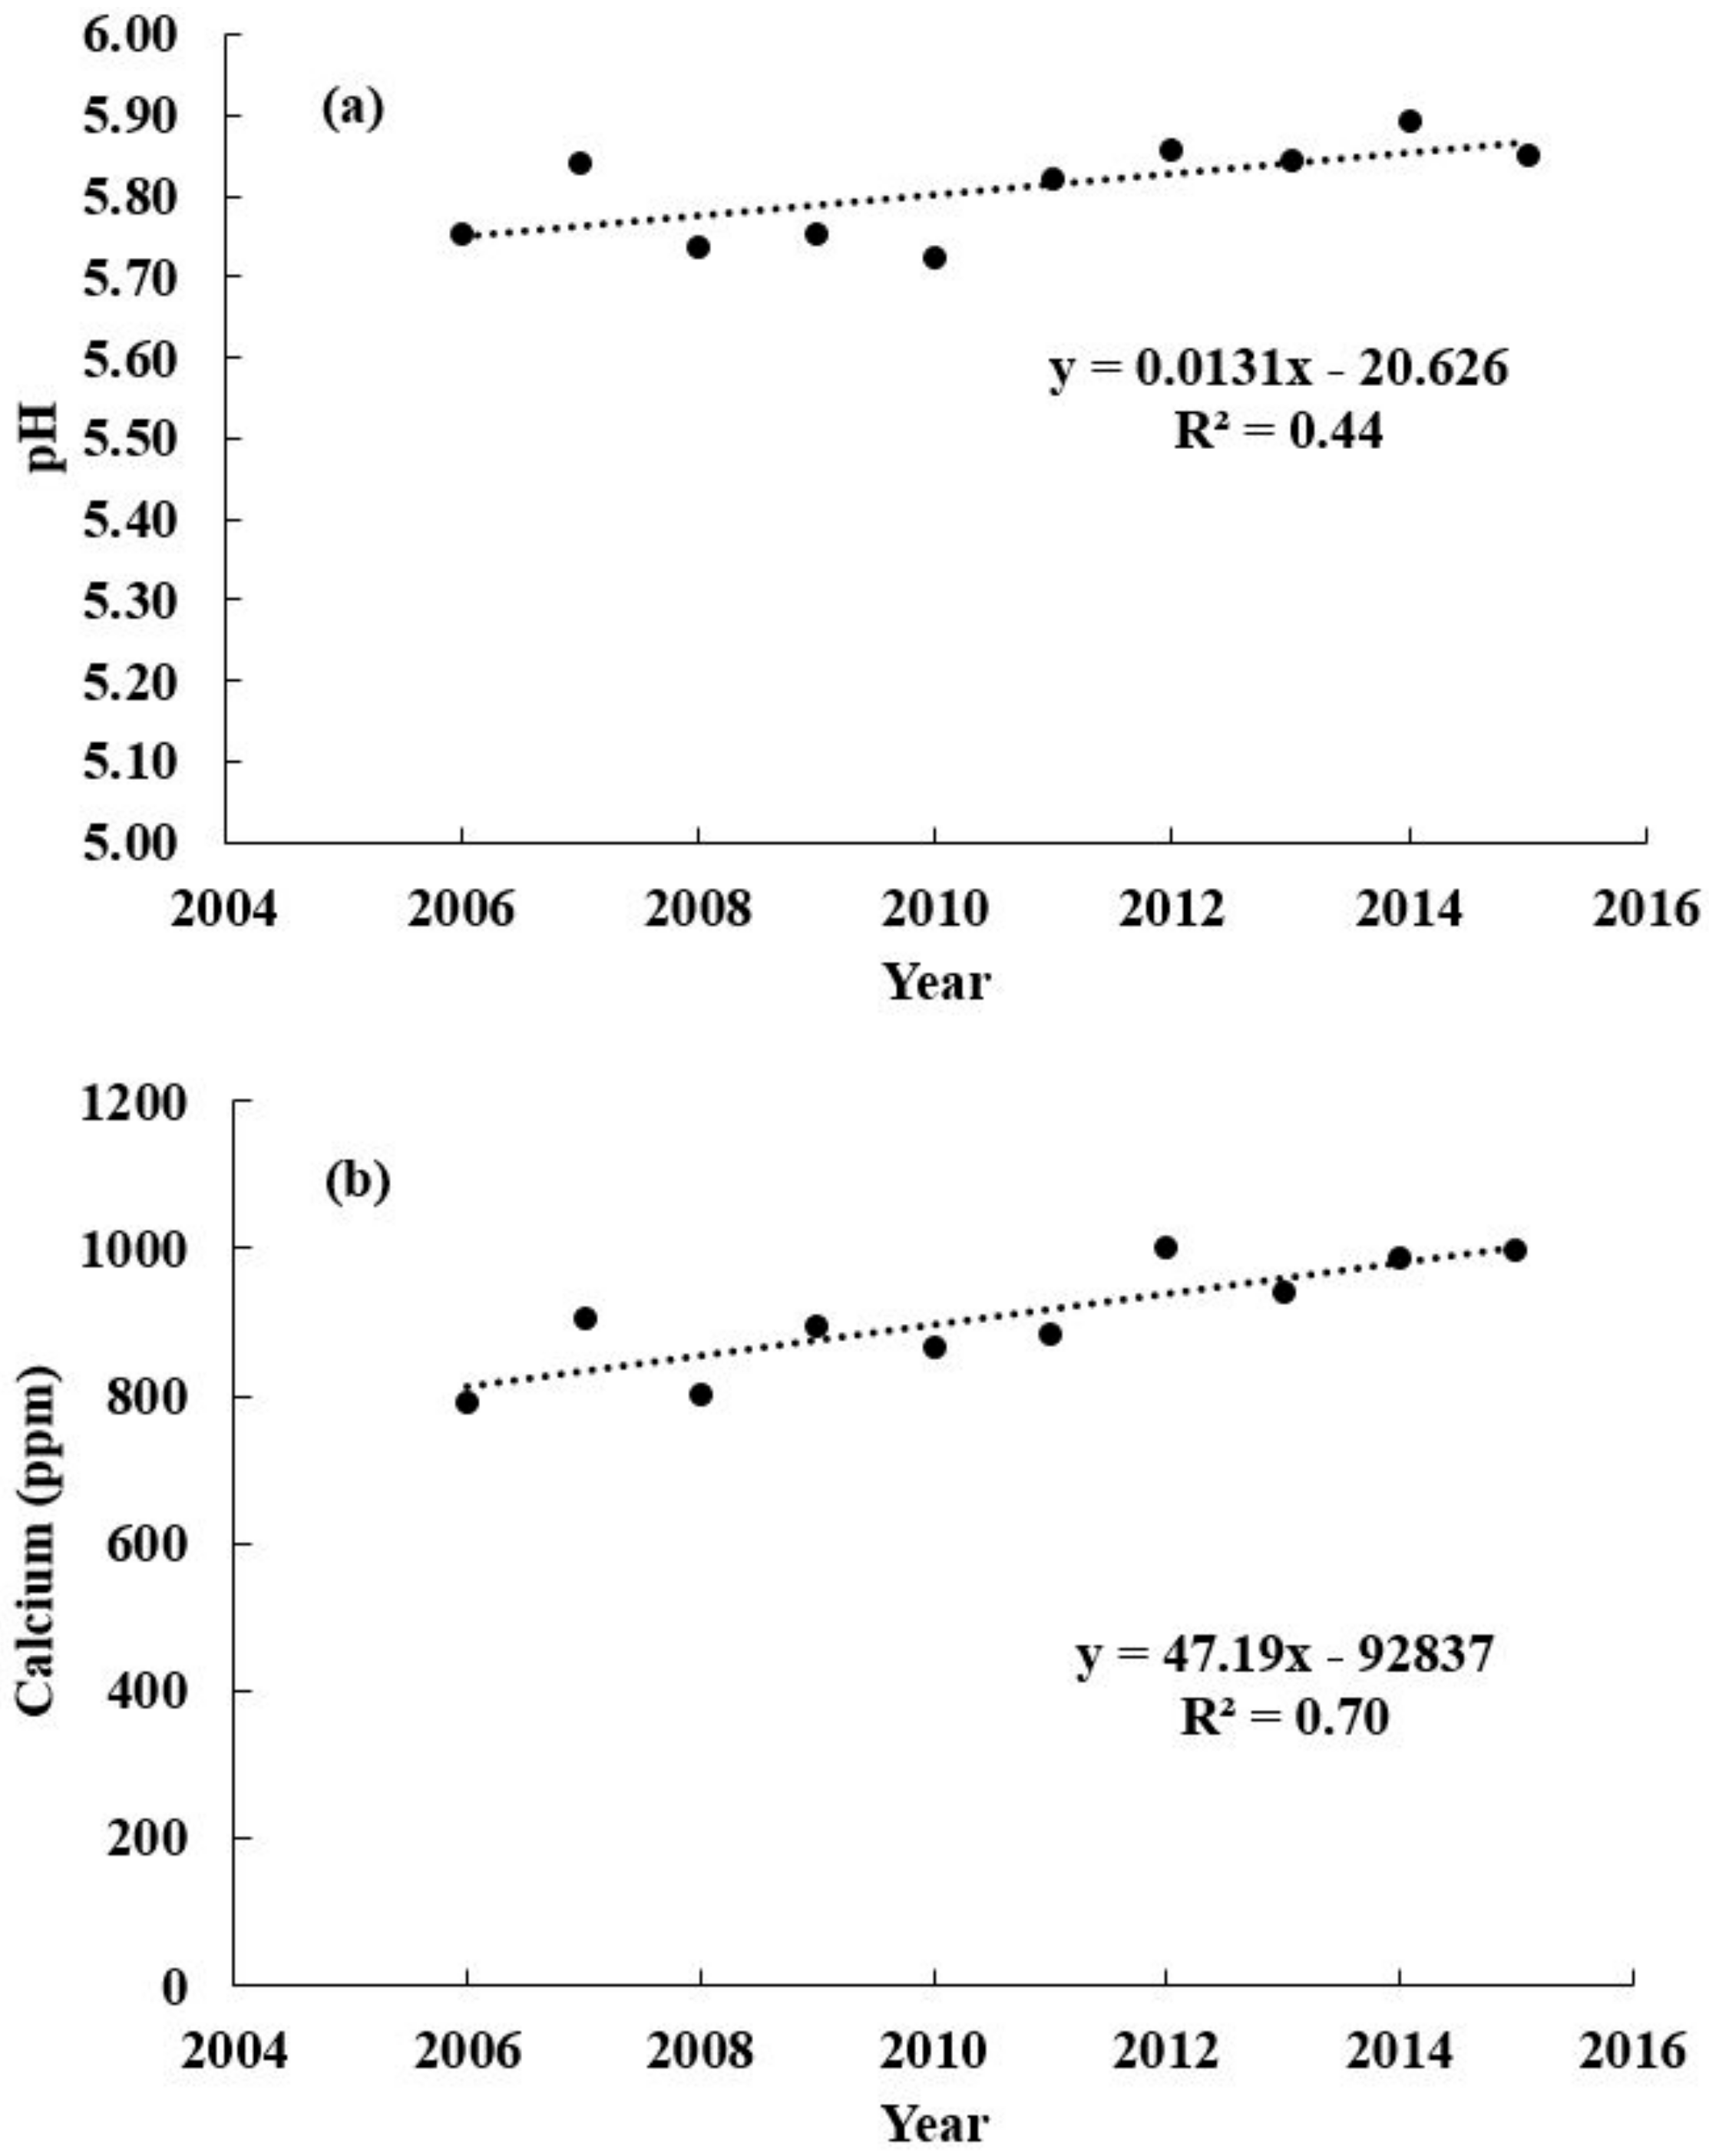
Figure 7.
(a) The bar graph shows the variation in rainfall across different towns in Maine from the south (Portland, Augusta, and Bangor) to the north (Millinocket, Houlton, and Caribou). (b) The pie graph represents the variation in rainfall within the months. (c) The scatter plot represents the relationship between the yearly sum of rainfall and potato yield of the last 21 years.
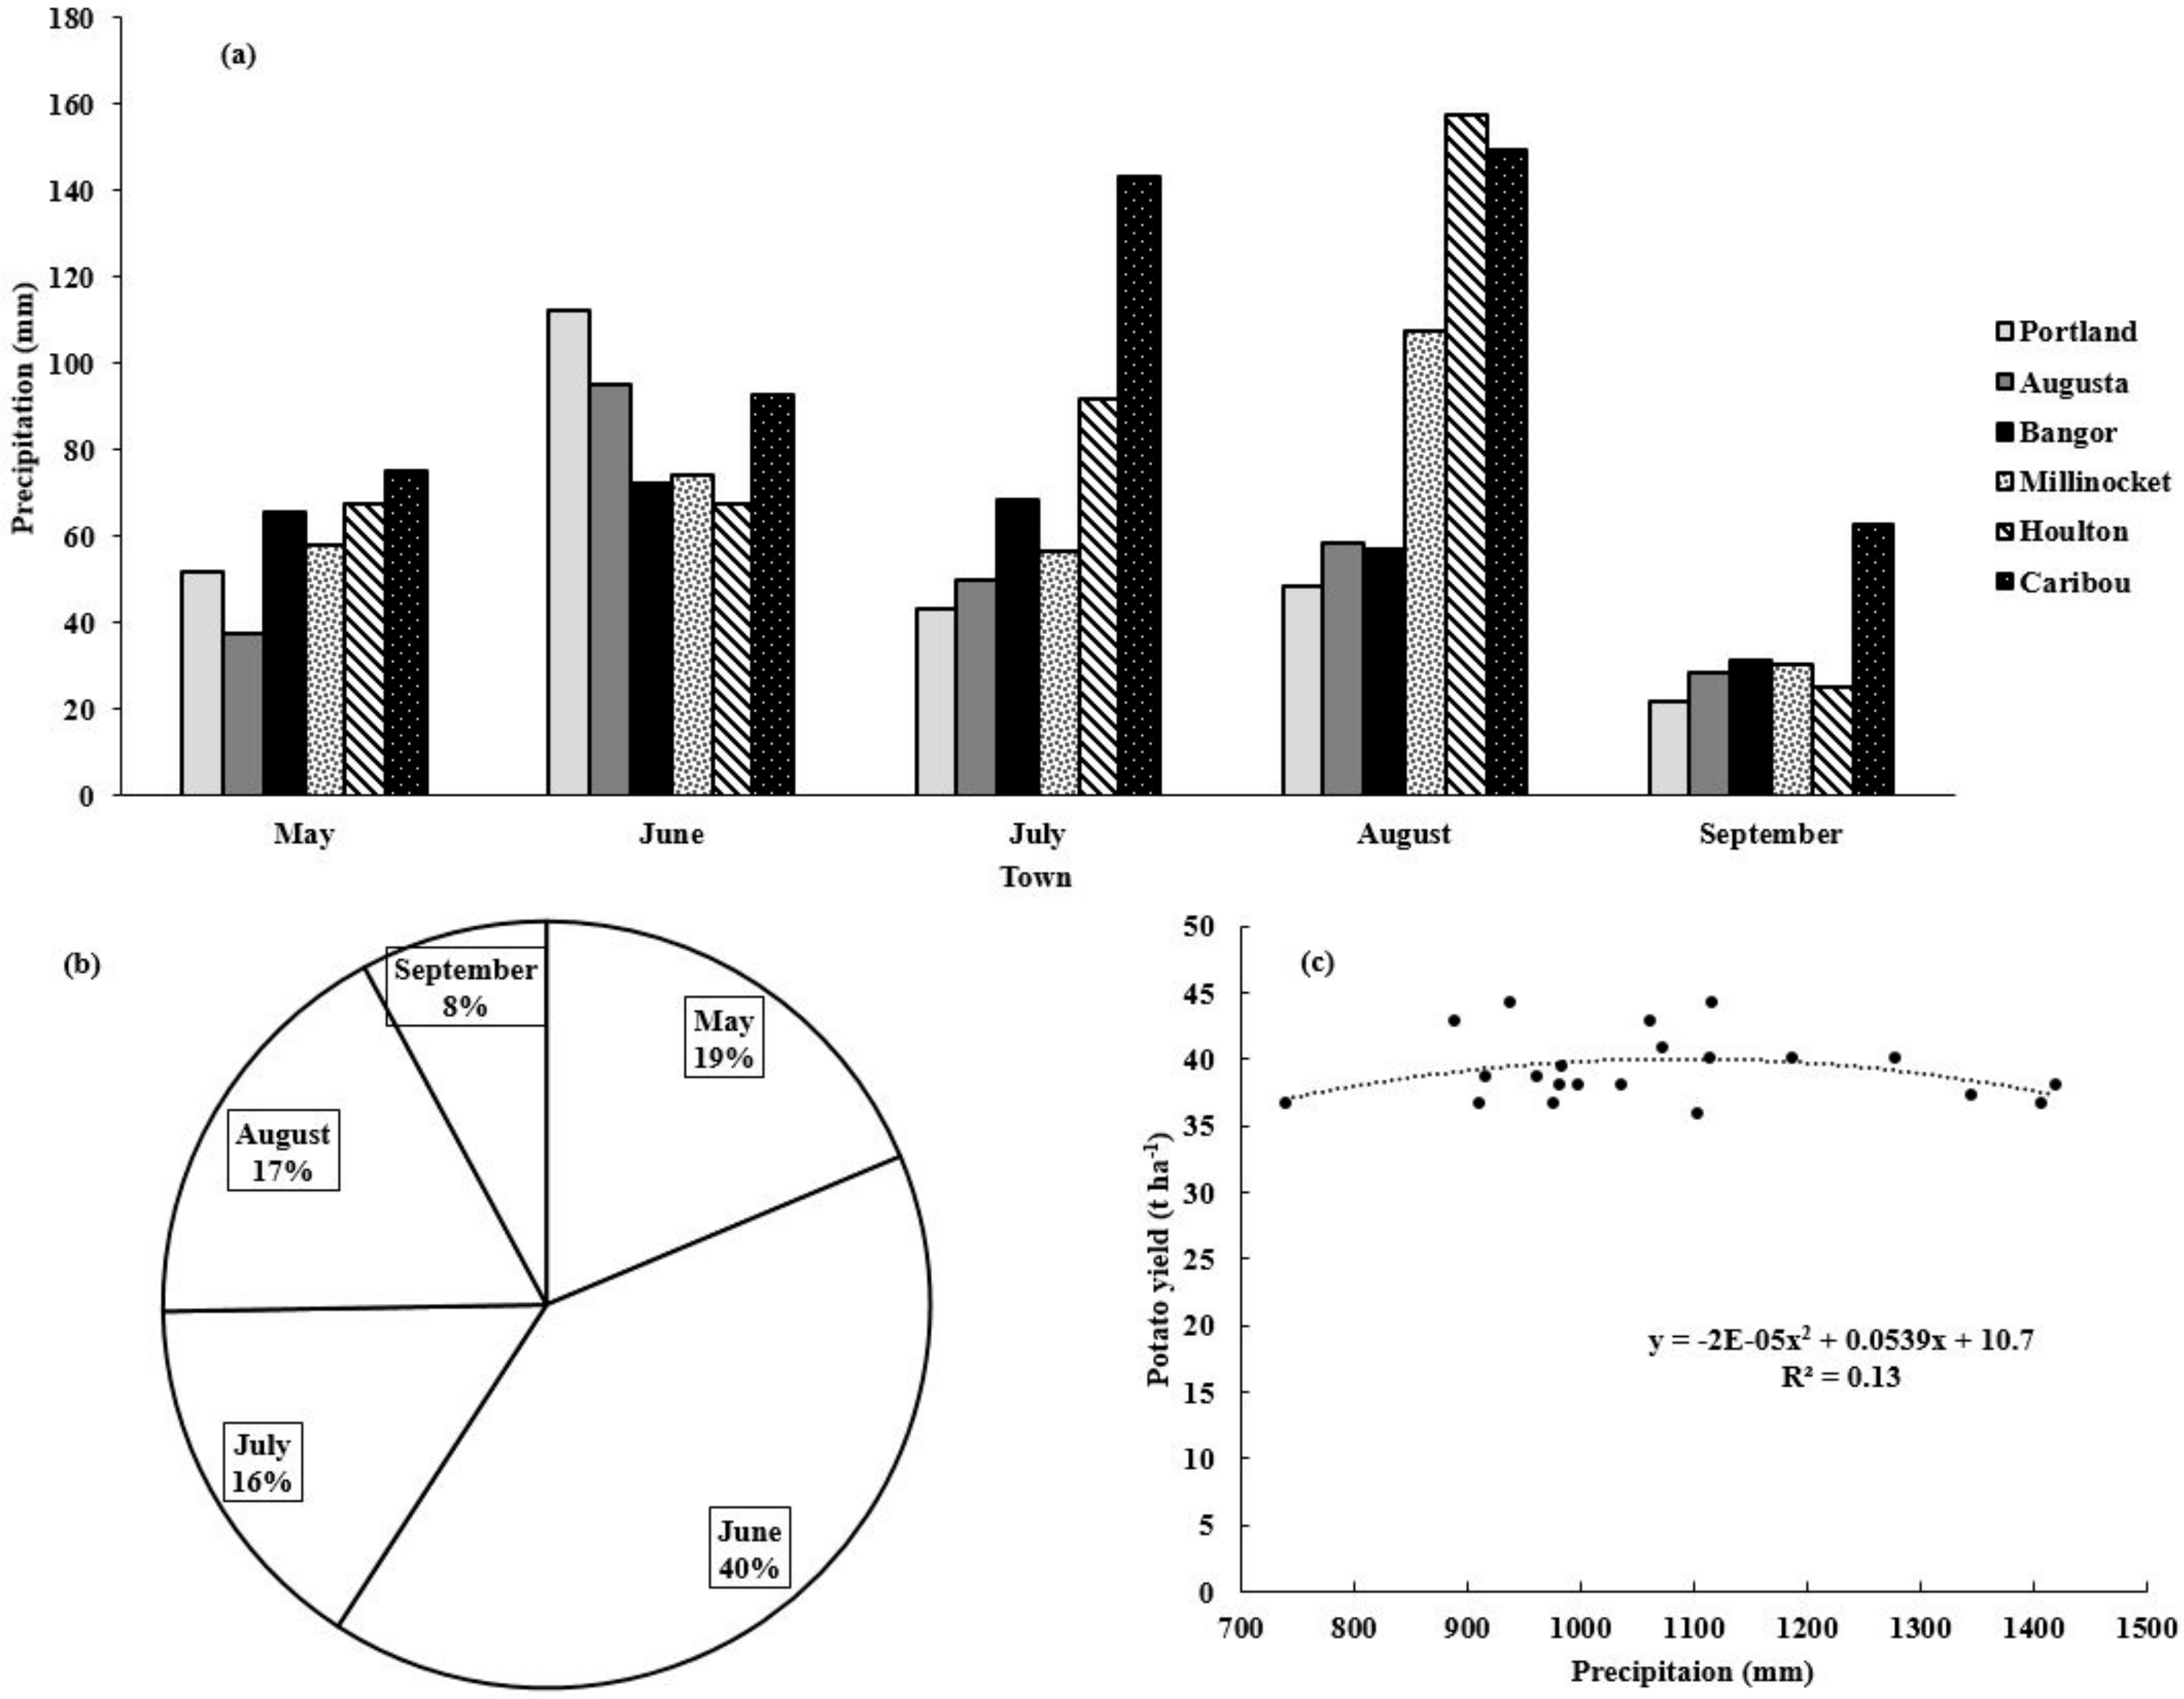
Figure 8.
The correlation between the two phosphorus tests. The two tests were used on the same soil samples from 12 sites over the two years.
Figure 8.
The correlation between the two phosphorus tests. The two tests were used on the same soil samples from 12 sites over the two years.

Table 1.
Parent material and mapping unit present in Maine under all crops in 1917.
| Parent Material | Mapping Unit |
|---|---|
| Soils in Basal Till | Monson-Elliottsville-Ricker-Telos |
| Telos-Monarda-Monson-Elliottsville | |
| Aurelie-Daigle-Perham-Burnham | |
| Plaisted-Penquis-Thorndike-Howland | |
| Dixfield-Colonel-Lyman-Brayton | |
| Skerry-Hermon-Monadnock-Colonel | |
| Lyman-Tunbridge-Dixfield | |
| Soils in Loose Till | Danforth-Masardis-Shirley |
| Dixmont-Thorndike-Monarda-Burnham | |
| Caribou-Mapleton-Conant | |
| Hermon-Brayton-Dixfield | |
| Enchanted-Saddleback-Ricker | |
| Soils in Glaciofluvial Materials | Colton-Adams-Sebago |
| Adams-Croghan-Naumburg | |
| Masardis-Stetson-Adams | |
| Soils in Glaciolacustrine or Glaciomarine Materials | Swanville-Boothbay-Biddeford |
| Scantic-Lamoine-Buxton-Lyman | |
| Nicholville-Buxton-Dixfield-Scantic | |
| Soils in Recent Alluvium | Cornish-Fryeburg-Podunk-Ondawa |
| Soils in Organic Materials | Vassalboro-Sebago-Wonsqueak |
| Soils in Organic Materials and Sandy Materials | Sulfihemist-Beaches-Adams-Dune land |
Source: The United States Department of Agriculture, Soil Survey of Aroostook County Area Maine, by Hurst et al. (1917) [35].
Table 2.
Type of soils in Aroostook County, a major potato growing area in Maine in 1917.
| County Name | Soil Type |
|---|---|
| Aroostook County | Caribou stony team |
| Caribou shale loam | |
| Caribou gravelly loam | |
| Caribou fine sandy loam | |
| Caribou loam | |
| Caribou silt loam | |
| Washburn loam | |
| Chapman loam | |
| Easton loam | |
| Linneus silt loam | |
| Van Buren sandy loam | |
| Van Buren silt loam | |
| Keegan silt loam | |
| Aroostook silt loam | |
| Muck |
Source: The United States Department of Agriculture, Soil Survey of Aroostook County Area Maine, by Hurst et al. (1917) [35].
Table 3.
List of studies reported potato phosphorus uptake in different regions.
| Researcher Name | Year | Amount of P Removed | Potato Variety |
|---|---|---|---|
| Porter and McBurnie [22] | 1999 | 12 kg ha−1 | cv. Superior and Atlantic |
| Fitzgerald et al. [23] | 1995 | 11–19 kg ha−1 | cv. Atlantic |
| Fitzgerald et al. [23] | 1996 | 12–22 kg ha−1 | cv. Atlantic |
| Carpenter and Murphy [29] | 1965 | 14.4 kg ha−1 | cv. Katahdin |
| Murphy and Carpenter [30] | 1967 | 20 kg ha−1 | cv. Kennebec |
| Stark et al. [10] | 2004 | 28 kg ha−1 | cv. Russet Burbank |
© 2017 by the authors. Licensee MDPI, Basel, Switzerland. This article is an open access article distributed under the terms and conditions of the Creative Commons Attribution (CC BY) license (http://creativecommons.org/licenses/by/4.0/).
Share and Cite
MDPI and ACS Style
Sharma, L.K.; Bali, S.K.; Zaeen, A.A. A Case Study of Potential Reasons of Increased Soil Phosphorus Levels in the Northeast United States. Agronomy 2017, 7, 85. https://doi.org/10.3390/agronomy7040085
AMA Style
Sharma LK, Bali SK, Zaeen AA. A Case Study of Potential Reasons of Increased Soil Phosphorus Levels in the Northeast United States. Agronomy. 2017; 7(4):85. https://doi.org/10.3390/agronomy7040085
Chicago/Turabian StyleSharma, Lakesh K., Sukhwinder K. Bali, and Ahmed A. Zaeen. 2017. "A Case Study of Potential Reasons of Increased Soil Phosphorus Levels in the Northeast United States" Agronomy 7, no. 4: 85. https://doi.org/10.3390/agronomy7040085
Note that from the first issue of 2016, this journal uses article numbers instead of page numbers. See further details here.