Article

Evaluation of Asparagine Concentration as an Indicator of the Acrylamide Formation in Cereals Grown under Organic Farming Conditions

1
Institute of crop science, University of Hohenheim, D-70599 Stuttgart, Germany
2
Chemisches und Veterinäruntersuchungsamt Stuttgart, Schaflandstraße 3/2, D-70736 Fellbach, Germany
*
Author to whom correspondence should be addressed.
Agronomy 2018, 8(12), 294; https://doi.org/10.3390/agronomy8120294
Submission received: 22 October 2018 / Revised: 28 November 2018 / Accepted: 4 December 2018 / Published: 6 December 2018
(This article belongs to the Special Issue Organic Farming: Impacts on Food Quality and Human Health)

Abstract

:
This study investigated the impact of organically grown cereals on the level of free asparagine (Asn) with simultaneous consideration of grain yields and flour qualities over three growing seasons in Germany. Additionally, the relation of free Asn and acrylamide (AA) was investigated. By including free Asn results of a second trial site, heritability of the trait free Asn was calculated. Free Asn was significantly influenced by species and within species by cultivars. Rye showed the highest free Asn amount, followed by einkorn, emmer, wheat, and spelt. Replacing rye with spelt would reduce free Asn by 85%. Cultivars differed in free Asn by up to 67% (wheat), 55% (spelt), and 33% (rye). Year significantly influenced free Asn levels. Heritability was high for wheat and spelt concerning locations, but regarding years, heritability was low for wheat but high for spelt and rye. For organically grown cereals, the relation between free Asn and AA formation has never been investigated. Across species and years, a correlation of R2 = 0.69 *** was found. Thus, free Asn can serve as an indicator for AA formation. In conclusion, the level of free Asn can be highly influenced by proper selection of species and cultivars.

1. Introduction

As a consequence of the carcinogenic potential of acrylamide [1] formed by heating carbohydrate-rich food materials such as cereals [2,3], the European Commission in 2017 has announced a regulation aiming to reduce the level of acrylamide (AA) in food products like cereals and potatoes [4]. Since April 2018, the food industry and gastronomy in Germany faces AA mitigation strategies and benchmark levels.
Besides reducing sugars, free Asn is known to be the main precursor for AA in food. Both sugar and free asparagine (Asn) react during the Maillard reaction to form AA [5,6,7,8,9].
However, after intensive research, several food processing measures have turned out to effectively lower the levels of AA [10,11,12,13]. Unfortunately, changes in processing measures often lead to impairment of taste, colour, and texture, or are cost expensive and thus could reduce consumer acceptance, which necessitates additional strategies.
As for cereals, free Asn is the key parameter for AA formation. Some studies investigated the effect of different additives or using the enzyme asparaginase to minimize free Asn [14,15,16,17]. Regardless, currently, most of these technological approaches have not been transferred into practice.
As free Asn is formed during crop growth, agronomic measures could reduce the amount of free Asn already in the raw material. This is also the favourable way of the food industry as no technological approach has to be applied or adjusted. Several studies proved that the level of free Asn can be considerably influenced by agronomic measures [5,6,18,19,20,21,22,23,24]. Multiple studies showed that cereal species differ in their Asn levels and consequentially in their AA formation potential. Typically, rye seems to have higher Asn levels when compared to wheat and spelt [5,6,18]. Moreover, cultivars can differ considerably in their precursor content, as shown by several studies [5,6,18,22,25,26]. Taeymans et al. [22] reported a 5-fold range for a selection of European wheat cultivars and Claus et al. [5] found a variability of Asn contents in nine German winter wheat cultivars of up to a factor of three. Similar results were found by Corol et al. [25]. They analyzed the Asn content in wholemeal of 150 wheat genotypes and found differences of almost 5-fold. Thus, selection of suitable cultivars with low Asn contents is considered as a feasible way to minimize AA formation potential, although it has to be taken into account that environmental conditions (site-specific and climatic conditions) may alter Asn contents considerably [6,18].
Fertilization is a key measure in crop production to increase yield and quality that can affect Asn levels as well. Nitrogen amount and timing of application, as well as nitrogen form can affect Asn contents in wheat considerably [20,23]. Especially high nitrogen availability during grain filling, which leads to high crude protein content, is considered to increase free Asn levels significantly [23]. Postles et al. [26] realized that high levels of nitrogen raised the amount of free Asn to about 29% when comparing N supply of 1 kg N ha−1 with 200 kg N ha−1. Moreover, sulphur deficiency can dramatically increase Asn contents and thus the AA formation potential [19,21,27]. Furthermore, fungicide application promoting leaf area duration and delaying senescence can reduce free Asn content in grains [20,28].
However, most of the available studies on AA were carried out under conventional farming practices. This includes cultivars bred for conventional farming and adjusted for a high input of inorganic N fertilizer and crop protection measurements [29,30]. As organic farming methods differ considerably from those of conventional farming (e.g., fertilization treatment, plant protection, weed control, cultivars in use), results of studies done for conventional farming cannot simply be transferred to organically cultivated crops. Kunz [31] announced that for breeding wheat cultivars under organic farming conditions, plants must have completely different characteristics than under conventional practices, e.g., a higher accumulation of gluten under a lower nitrogen supply, longer stems, a long terminal internode, loose ears or a faster transfer of nutrients into the grain, more weed competitiveness, and compatibility against harrowing and hoeing. In addition, other cereal species like einkorn and emmer are used in organic cropping systems and have not been previously investigated regarding their level of free Asn in white flour. Also, for organically grown cereals, no information is available regarding the possible relation between free Asn and AA as it was found for conventionally cropped cereals. Moreover, in order to recommend cultivars low in free Asn to farmers, it would be important that the trait of free Asn is bound mainly to the cultivar and is only slightly influenced by the environmental conditions. Up to now, only few studies are available addressing the heritability of the trait of free Asn in cereal cultivars.
Hence, the aim of this study was to assess and compare the levels of free Asn in flours of different winter wheat, winter spelt, winter rye, einkorn, and emmer cultivars fully grown under organic farming conditions, over 3-years in Southwestern Germany. The major objectives were to investigate (i) if cereal species winter wheat, winter spelt, winter rye, einkorn, and emmer differ in their potential to accumulate free Asn in their flours, (ii) if Asn levels are affected by cultivar (cv) and year in the context of gained yields and qualities, (iii) to what extent the genotype contributes to the Asn accumulation in flours.

2. Materials and Methods

2.1. Site Description

The field trial was carried out over three consecutive growing seasons (2005–2006, 2006–2007; 2007–2008) at the Dörrmenz trial site (49°12’ N, 9°59’ E, average annual temperature 7.8 °C; average annual rainfall 790 mm). Dörrmenz is located in Southwestern Germany in the federal state of Baden-Württemberg, roughly 100 km north-east of Stuttgart. The site has been cropped under the guidelines of organic farming of the association of Demeter, referring to the highest and strongest organic farming guidelines in Germany.
In 2008, the same field-trial was accomplished on an additional trial site at the experimental station for organic farming of the University Hohenheim, Kleinhohenheim, Stuttgart (48° 44’ N 9° 12’ E; average annual temperature 8.8 °C; average annual rainfall 700 mm). Detailed data on temperature and rainfall for Dörrmenz during the seasons 2005–2006, 2006–2007, and 2007–2008 and Kleinhohenheim during the season 2007–2008 are depicted in Figure 1.

2.2. Site Conditions at the Experimental Sites

The field trial at Dörrmenz was carried out on shell lime derived soils with a soil texture of clayey loam with maize as the previous crop in 2006 and 2007, while oat was the previous crop in 2008. Nmin values at the start of the vegetation period in a soil depth of 0–90 cm were 44 kg NO3-N ha−1 in 2006 and 21 kg NO3-N ha−1 in 2007 and 2008. The soils at Kleinhohenheim are loess derived with a loamy soil texture with faba beans as the previous crop. Nmin content at autumn in 2007 in a soil depth of 0–90 cm was 42 kg N ha−1.

2.3. Experimental Design

Nineteen winter wheat (Triticum aestivum L.), seven winter spelt (Triticum aestivum ssp. Spelta L.), and two winter rye cultivars (Secale cereale L.), mostly specified as organic cultivars, were grown under organic farming conditions at Dörrmenz over three consecutive growing seasons (2006–2008). In addition, ten rye, three einkorn (Triticum monococcum L.), and two emmer cultivars (Triticum dicoccum Schranck) were organically grown in single years (see Table 1). For analyzing the heritability of the parameter free Asn concerning the trait location the same species and cultivars were grown under organic farming conditions at a second location (Kleinhohenheim) in 2008.
At both locations, all cultivars were tested in a randomized complete block design (plot size 1.5 × 12 m) with three replicates. To avoid neighbouring effects between the different species, species were separated by a border plot with a width of 1.5 m. Species groups were randomly placed in each block, and within each species group, cultivars were arranged randomly.

2.4. Experimental Performance

At both locations, seed bed preparation in autumn took place with a power harrow followed by primary tillage with a moldboard plough (25 cm depth).
Sowing was done for all species on 12 October 2005, 12 October 2006 and 8 October 2007 at Dörrmenz and on 17 October 2007 at Kleinhohenheim. Sowing density was 400 seeds m−2 for winter wheat, 180 seeds m−2 for winter spelt, 300 seeds m−2 for winter rye, 350 seeds m−2 for einkorn, and 240 seeds m−2 for emmer. Row distance was 0.125 m at both sites.
Nitrogen was applied only in Dörrmenz as liquid cattle manure at start of vegetation in spring equally for all species. The applied amount of nitrogen was 40 kg N ha−1 in 2006, 25 kg N ha−1 in 2007 and 25 kg N ha−1 in 2008. At the Kleinhohenheim site (only tested in 2008), no nitrogen was applied due to faba bean being the previous crop. If necessary, a currycomb was used to reduce weeds.
Harvest was accomplished on 3 August 2006, 17 July 2007, and 1 August 2008 at Dörrmenz and on 2 August 2008 in Kleinhohenheim with a Hege 180 plot combine harvester (Hege, Hohebuch, Germany) after grains had reached a dry matter content of 85%.

2.5. Yield

Grain yield was determined by weighing plot yield. Grain samples were dried at 105 °C for 24 h to determine grain moisture. Given grain yields refer to 86% dry matter content.

2.6. Flours

For the determination of quality parameters, the determination of free Asn and the AA formation potential, grain samples were milled on a laboratory mill (Quadrumat Junior, Brabender, Duisburg, Germany). Ash content of flours was approximately 0.5% of flour-DM. Flour moisture was calculated from the weight loss before and after drying of approximately 5 g flour at 105 °C for 24 h.

2.7. Crude Protein Content

Total grain nitrogen content was determined by Near-Infrared-Spectroscopy (NIRS, NIRS 5000, FOSS GmbH Rellingen, Germany). Calibration samples were analyzed according to the Dumas Method [32] using a Vario Max CNS analyzer (Elementar, Hanau, Germany). The final nitrogen content was multiplied by a factor of 5.7 for wheat samples [33] and 6.25 for all other samples.

2.8. Zeleny’s Sedimentation Test

Zeleny´s sedimentation test was determined by using 3.2 g flour according to ICC standard No. 116. The sedimentation values of the flours were adjusted to 14% moisture basis.

2.9. Hagberg Falling Number

The Hagberg falling number was determined according to ICC standard No. 107 using a PerCon 1600 Falling Number machine (PerCon, Hamburg, Germany), using 7 g of flour (weight adjusted for moisture concentration to 15%).

2.10. Free Asparagine

Free asparagine was extracted from either 2 g of wheat, spelt, einkorn or emmer flour or 1 g of rye flour. Samples were mixed with 8 mL of 45% ethanol for 30 min at room temperature. After centrifugation for 10 min at room temperature with 4000 rpm and 10 min at 10 °C and 14,000 rpm, the supernatant was filtered through a 0.2 µm syringe filter and transferred into vials. Asparagine analysis was performed using Merck–Hitachi HPLC components. The pre-column derivatization with FMOC [34] was completely automated by means of an injector program. Subsequently, the derivatized Asn was separated on a LiChroCART Superspher RP 8 column (250 mm × 4 mm, Fa. Merck, Darmstadt) at a constant temperature of 45 °C. The fluorescence intensity of the effluent was measured at the excitation and emission maxima of 263 and 313 nm.

2.11. Acrylamide Formation Potential

The AA formation potential of cereal flour was assessed according to the AA contents of 5 g flour in 250 mL Erlenmeyer flasks after heating in an oven for 10 min at 200 °C. Due to the complexity of the acrylamide analysis, sample size was reduced to an overall number of 21 samples (8 winter wheat, 5 winter spelt, 5 winter rye, 1 einkorn, and 1 emmer sample).
Sample preparation was accomplished according to test procedure 200L05401 [35] of the Chemische und Veterinäruntersuchungsamt (CVUA) Stuttgart.
After cooling down to ambient temperature, 100 mL of bidestilled water and 100 µL of D3-Acrylamide were added as an internal standard to the heated flour samples in the Erlenmeyer flasks. To completely extract acrylamide from the flour, samples were put in an ultrasonic bath for 10 minutes at 40 °C. After adding 1 mL of Carrez I and II to each of the samples and shaking the flasks thoroughly, the samples were filtered using folded filter paper to separate the colloids and flour particles from the aqueous solution. Subsequently, samples were cleaned up by a solid phase extraction in a vacuum chamber after preconditioning the cartridges with 10 mL of bidestilled water and 10 mL methanol. After sample clean up, about 1 to 2 mL of the eluate from each sample was filled in an autosampler vial and was deep frozen (−18 °C) until AA was determined by LC-MS-MS by the CVUA according to test procedure 201L01301 [36]. The eluates were separated by a graphite or RP18-phase and detected by tandem-mass-spectrometer. Quantification was undertaken by using the isotope-labelled internal standard (D3-Acrylamide).

2.12. Statistical Analysis

Yield and quality data (crude protein, falling number, sedimentation value), as well as free Asn of the location Dörrmenz were subjected to analysis of variance (ANOVA) using the Procedure MIXED from the statistical software package SAS 9.1. (SAS Institute Inc., Cary, NC, USA). When necessary, data was in- or square root-transformed, to stabilize normal distribution and homogeneity of variance. A comparison of means was accomplished using the t-test.
ANOVA was done in two steps: in a first step, the main effects year, species, cultivars, and interactions were investigated. In a second step, crop species were analyzed separately for determining potential cultivar differences depending on year. For the parameter AA, no statistical analysis was undertaken as, only single samples from one field replicate were selected for analysis. The impact of year, species, and cultivar ANOVA was only analyzed for Dörrmenz.
Heritability of the trait “free Asn content” was calculated from the variances according to Miedaner [37] for Dörrmenz in the years 2006, 2007, and 2008 and for Dörrmenz and Kleinhohenheim in 2008. In this context, the impact of location on free Asn was only used for the heritability.

3. Results and Discussion

3.1. Grain Yield, Quality and Free Asn

Note: Except for chapter “Impact of locations on free Asn, Heritability”, all results refer to the Dörrmenz location.
Grain yield, crude protein, and free Asn content at Dörrmenz were significantly influenced by species and year, as well as by their interaction (Table 2).
Within the cereal species wheat and spelt, cultivar, year, and the interaction between cultivar and year affected grain yield, quality, and the Asn content considerably (Table 3). However, grain yield of wheat was not affected significantly by the cultivar × year interaction. Winter rye grain yield was significantly affected by cultivar and year but not by their interaction. Falling number of rye was neither effected by cultivar and year nor by their interactions. Free Asn of the tested rye cultivars was only affected significantly by year but neither by cultivar nor by the cultivar × year interaction (Table 3).
Especially year had a crucial impact on yield, quality, and Asn content. While yield and partially crude protein contents were significantly lower in 2007 compared to 2006 and 2008, the content of free Asn considerably increased in 2008 by about 35% in emmer and up to >100% in winter rye. While lower yields in 2007 were presumably the result of increased weed infestation due to a mild winter 2006–2007 and a reduced number of kernels per ear due to the absence of precipitation in April 2007, in 2008, free Asn contents were possibly affected by the comparably low precipitation from May until harvest in July (see Figure 1).
Grain yields of all species were generally low due to the low-input crop management (nutrient supply, and the omission of any weed control). While average grain yields across years varied less between winter wheat, winter spelt, and winter rye (from 3.5 t ha−1 of wheat to 3.8 t ha−1 of spelt), the yield potential of einkorn was about 1 t ha−1 and that of emmer about 0.5 t ha−1 lower (Table 4).
Crude protein contents were highest for spelt (mean 12.7%) and einkorn (mean 14.1%), while rye reached levels of around 7.7%. Winter wheat and emmer showed average protein contents of 10.6% and 11.2%. According to Brunner [38], crude protein contents of at least 10.5% for organically produced wheat and 11% for organically produced spelt are required to provide acceptable baking quality. Thus, mean values obtained within this work should offer a sufficient baking quality for organically produced wheat flour. Nevertheless, under organic farming, protein contents are known to be generally lower than under conventional farming [39]. As a consequence, bread bakery processing has to be adapted to the lower protein contents [40] to achieve acceptable organic bakery products.
According to Haglund et al. [40] dough from wheat flours with protein contents lower than 12% needs a longer dough mixing time. At crude protein levels below 8%, it was found that it was difficult to form an acceptable bread volume. Consequently, bakers are required to adjust their processing conditions for flours of organic origin. The sedimentation value, a further parameter to describe the baking quality, was determined from wheat samples and differed significantly between years, but in a very close range between 31 and 36 mL. Brunner [38] recommended that a range of 30 to 45 mL is needed for wheat, thus the achieved mean sedimentation values would fulfil processors requirements.
A low falling number gives evidence of pre-sprouting, and in consequence leads to an increased free Asn level due to an increased protease activity [5,41]. Falling number as a parameter to assess starch quality of bread rye lots was only marginally affected by year, ranging from 217 to 245 s. Values were within the required range [38] for which no impairment of baking quality is expected.
The potential to accumulate free Asn varied clearly between the species, with rye having the highest average Asn level across years of about 43 mg flour-DM, followed by einkorn with about 32 mg, emmer with about 16 mg and wheat and spelt with about 10 mg and 8 mg 100 g−1 flour-DM, respectively, across all years. Fredriksson et al. [42], Elmore et al. [43], and Claus et al. [5] reported up to 3 or 4 times higher free Asn levels in rye compared to wheat or spelt. This corresponds well with data obtained in this study for cereals produced under organic conditions. Therefore, the AA formation potential of bakery goods made from rye flour is considered to be higher than from wheat or spelt [5,43] independent of the cropping system. In contrast, studies of Curtis et al. [6] showed that AA formation in heated flour per unit Asn was much lower in rye than in wheat flour, suggesting that the higher Asn level compared to wheat does not inevitably mean that rye has a higher AA formation potential per se. In our study, however, AA formation potential was strongly correlated to the level of free Asn, as it was highest for rye and einkorn.
Within species grain yield of wheat and spelt varied only marginally between cultivars (cv). The mean standard deviation was only 0.38 t ha−1, whereas year influenced grain yield much more, causing variations of up to 49% between years.
Wheat crude protein content ranged from 10.1% (cv Bussard) to 13.7% (cv Tengri) in 2006, while in 2007 it varied between 8.7% (cv Magister) and 10.7% (cv Arctur). In 2008, the lowest crude protein content was found for cv Akteur (8.7%) while cultivars Tengri and Wiwa showed the highest contents with 11.7%. Crude protein of spelt ranged across years between 9.5% (cv O.Rotkorn) and 16.1% (cv Sirino). Johansson and Svensson [44] investigated the effect of weather conditions on protein concentration of wheat cultivars for 21 years. They described that climatic conditions, especially temperature, during grain filling had a high impact on grain protein level of wheat. For spring wheat, they found differences of 34% concerning crude protein concentration. Thus, crude protein content obtained during this work was most likely influenced by weather conditions and cultivars.
Wheat sedimentation values varied depending on cultivar from 24 mL in 2007 to 43.3 mL in 2008. Especially cultivars Wiwa, Wenga, Spieß 2, Clivio, Pollux, and Scaro reached higher amounts in each year when compared to the other investigated cultivars.
Rye grain yield varied based on cultivar in 2006 from 3.5 t ha−1 (cv Corona) to 4.4 t ha−1 (cv Hacada), in 2007 at a lower level from 2.8 t ha−1 (cv Firmamant) to 3.7 t ha−1 (cv Recrut) and in 2008 from 2.1 t ha−1 (cv Firmament) to 4.2 t ha−1 (cv Lichtkornroggen). Crude protein content of rye was at an expected low level in 2006 and 2007 and ranged from 6.3 (cv Carotop) to 7.2 (cv Lichtkornroggen), while in 2008 the amount of crude protein increased by up to 2.1% and varied from 8.1% to 10.5% (cv Firmament). With regards to falling number, cultivars differed from 163 s (cv Hacada) to 224 s (cv Carotop) in 2006, while in 2007 cv Lichtkornroggen reached to lowest level of 208 s compared to cv Firmament, which reached the highest falling number with 272 s. The overall highest level of falling number was found in 2008 as cv Amilo obtained 303 s. However, there was no cultivar which fell below the required amount of at least 90 s, which is recommended by [38] as the lowest level needed by processors.
No comparison of cultivars from einkorn and emmer concerning quality parameters could be made as only one cultivar of each species was grown.
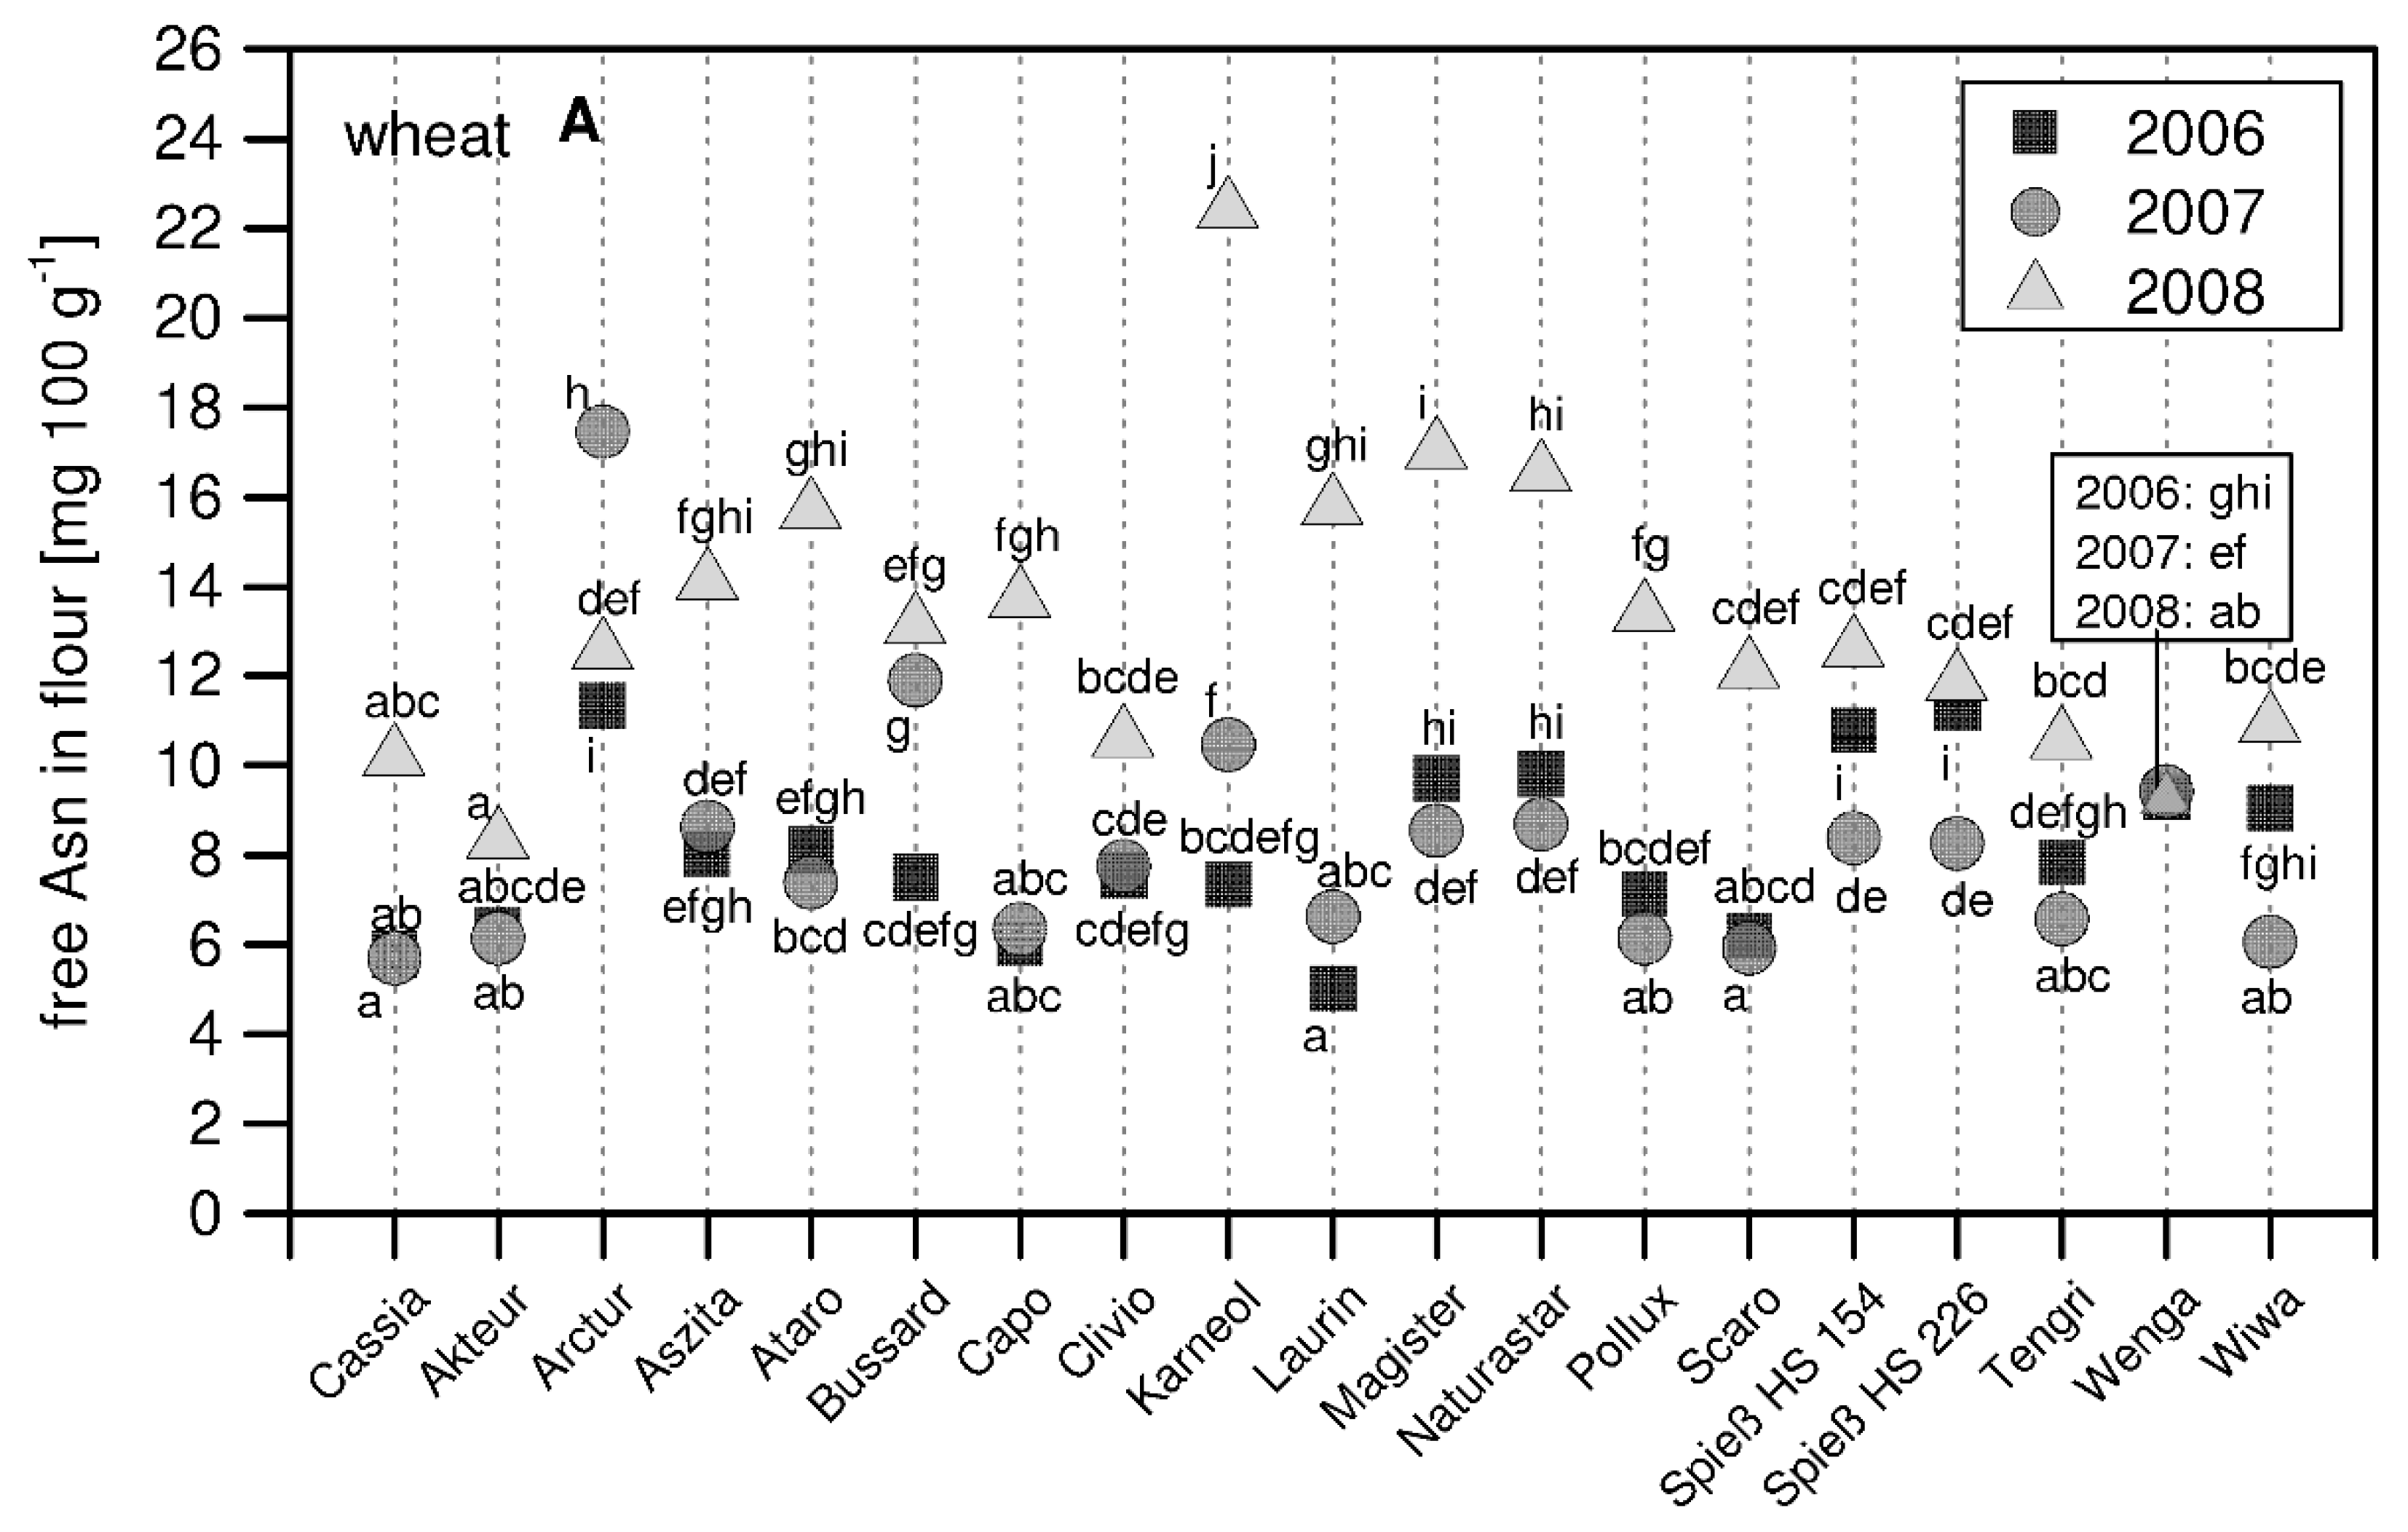
The level of free Asn for wheat was significantly influenced by cultivar and year (Table 3, Figure 2A). In general, the amount of free Asn varied between 5 and 22.4 mg 100 g−1. Similar ranges are seen in other studies: Claus et al. [5] found a range of 8.7 to 24.9 mg Asn 100 g−1 in a variety of conventionally produced winter wheat cultivars. Stockmann et al. [45] investigated a variation of organically grown wheat cultivars and found significant differences between cultivars in their Asn level ranging from 8 to 14 mg 100 g−1. Also, Taeymans et al. [22] investigated free Asn levels of a range of wheat cultivars mostly grown under European (UK) conditions during 2002. They found a broad range of 7.4 to 66.4 mg 100 g−1 including a five-fold difference between cultivars and a mean of 22 mg 100 g−1. The level of free Asn within a set of 150 wheat cultivars was analyzed as wholemeal by Corol et al. [25]. The difference between cultivars were up to 5-fold. The high variation found by Taeymans et al. [22] and Corol et al. [25] could have been caused by including grain samples from various locations across Europe, as Curtis et al. [18] found that climatic conditions can influence the level of free Asn significantly. Also, stress conditions like plant disease and water limitations can have an impact on free Asn synthesis. Curtis et al. [28] realised that fungicide treatment can reduce the level of free Asn. As all cereal samples in this study were grown under organic farming conditions stress factors like diseases could have contributed to a higher variation in the level of free Asn.
Across years, cv Akteur was found to accumulate the lowest amounts of free Asn (6.9 mg 100 g−1), while cv Arctur reached the highest average value of 13.8 mg 100 g−1. Although the level of free Asn was generally influenced by year, Asn contents in some cultivars were more or less stable over all years (year-to-year variation < 2 mg 100 g−1 flour-DM: Akteur, Clivio, Spieß HS 154, Spieß HS 226, Tengri and Wenga). However, some cultivars were highly susceptible towards year-to-year effects (year-to-year variation > 6 mg 100 g−1 flour-DM: Ataro, Capo, Karneol, Laurin, Magister, Naturastar). A third group of cultivars showed Asn contents varying between years in the range of 2 and 6 mg 100 g−1 flour-DM (Cassia, Arctur, Aszita, Bussard, Pollux, Scaro, and Wiwa). Hence, selecting or breeding cultivars with low to medium Asn levels and a robust response towards varying climatic conditions seems a more suitable measure to lower AA formation potential in the long term, while selecting cultivars with the lowest Asn contents in single years may be a short-term solution.
The free Asn level of wheat differed between cultivars by up to 50% across years and up to 67% within single years. Assuming a linear increase of AA with increasing contents of Asn in the flour [5], choosing a proper cultivar could halve free Asn levels and thus minimize AA formation during processing considerably.
In regard to wheat, the amount of free Asn in spelt flour was significantly affected by cultivar and year (Table 3, Figure 2B). The free Asn content of spelt was higher in 2008 (mean 12.0 mg 100 g−1) than in the other two years (2006: 6.5 mg 100 g−1, 2007: 5.5 mg 100 g−1). Comparing cultivars across years, free Asn amounts showed a range of 5.4 (O. Rotkorn) to 11.1 mg 100 g−1 (Sirino). Within single years, cv Tauro showed the highest content of 16.2 mg Asn 100 g−1. Cultivars O. Rotkorn and Badengold had the lowest level of free Asn in each year. While free Asn levels of spelt varied to up to 54% by year-to-year effects, the variation between cultivars by up to 77% was much higher.
Information about free Asn of spelt in the literature is rare. Claus et al. [5] reported amounts of conventionally produced spelt cultivars of 6.5 to 12.2 mg 100 g−1 and by this, a somewhat smaller range than in our study. Similar results were found by Corol et al. [25] as the range of free Asn of spelt cultivars ranged from 0.60 to 0.79 mg g−1 DM in wholemeal flour.
To date, no previous studies have investigated einkorn and emmer for their amount of free Asn in white flour. Corol et al. [25] analyzed free Asn in einkorn and emmer but the samples were cropped under conventional cropping conditions and free Asn was analyzed in wholemeal. Thus, a comparison with our results is difficult. Nevertheless, the study showed that between six cereal species, einkorn reached the highest level of free Asn with 1.12 mg g−1 DM.
In our study, einkorn showed high Asn contents when compared to wheat of up to 40 mg Asn 100 g−1 (Figure 2B). It ranged from 25.5 mg Asn 100 g−1 in 2006 (cv Saffra) to 40 mg Asn 100 g−1 (cv Terzino) in 2008. This high level was otherwise only found in rye samples. With a mean of 15.7 mg Asn 100 g−1, emmer cultivars showed comparable amounts when compared to wheat and spelt. Consequently, if einkorn is supposed to be used for preparing bread and rolls, high levels of AA in the final product are expected.
For rye there was no significant cultivar-dependent effect on free Asn, while year affected the Asn content significantly (Table 3, Figure 2C). While the average Asn levels across cultivars were comparable in 2006 and 2007 with about 30 mg 100 g−1 flour-DM, the levels more than doubled in 2008 with an average of 67 mg 100g−1 flour-DM.
These results are in agreement with studies of [5] who investigated the amount of free Asn in two rye cultivars and obtained a mean of 42.6 mg 100 g−1. In studies by Springer et al. [46], a similar range was found with rye cultivars varying between 31.9 and 79.1 mg 100 g−1. Studies by Stockmann et al. [45], who investigated the impact of cropping systems on free Asn, also found that rye cultivars had no significant impact on free Asn content no matter which cropping system was examined. A significant year impact was, however, present for conventionally treated cultivars. They found a free Asn content ranging from 31.5 to 52.3 mg Asn 100 g−1 for conventionally cropped samples and from 30.1 to 35.9 mg 100 g−1 for organically treated samples. Thus, it seems that lowering free Asn by choosing rye cultivars low in free Asn will be of minor relevance to reduce AA.
Overall, the amount of free Asn was highly influenced by species and cultivars. However, it has to be considered that abiotic factors can affect Asn levels as well, as shown for wheat by Curtis et al. [18] and for rye by Curtis et al. [6]. Until now, information on how soil type, temperature, and precipitation affect grain-Asn accumulation is lacking [47]. Investigations of Corol et al. [25] revealed that free Asn was increased if temperature was higher and precipitation was low during grain filling. In our study, temperature in June and July was similar across years and locations (see Figure 1), but during June and July rainfall was much lower in 2008 compared to 2006 and 2007 (see Figure 1). Therefore, we assume that the level of free Asn in our study was significantly influenced by year. However, as the main objective was to detect and breed cultivars with a low susceptibility to climatic conditions, cultivars with only a weak response year-to year variations (e.g., cv Wenga with a standard error across years of 0.1) are promising to effectively reduce the AA-formation potential by proper cultivar selection.
Therefore, cultivars should be tested over several years at different locations before recommendations can be made for breeding programs targeted towards lowering the AA precursor contents.

3.2. Correlation of Crude Protein, Free Asn, and AA

Free Asn is the critical factor for AA formation during processing of cereal-based bakery products [13]. Asn contents in flour of conventional origin correlated almost linearly with the AA content in heated flour or in breads [5,6].
The results of this work corresponded well with these findings as, averaged over species and cultivars, free Asn and AA correlated well with R2 = 0.69 ***. The same was found if species were separated, as AA formation was correlated with free Asn (wheat R2 0.66 *, spelt R2 0.83 n.s., rye R2 0.64 n.s.).
However, cultivars with a high baking quality do not inevitably have to be linked with having high Asn contents and therefore a high AA formation potential. This is suggested by the weak correlation found between crude protein and free Asn contents across species (R2: 0.07 n.s.) and within wheat (R2 0.00005 n.s.). This is also proven by studies of Ohm et al. [48]. They found a negative correlation between baking quality parameters and free Asn within a set of hard red spring wheat cultivars. In contrast, crude protein and free Asn correlated within spelt by R2 0.4 ** and rye by R2 0.79 ***. The close correlation between crude protein and free Asn of rye could have been caused by higher nitrogen availability as crude protein was around 1 to 2% higher in 2008 than the other years, leading to levels of free Asn approximately twice as high. As crude protein has a low relevance for baking quality of rye, choosing cultivars low in free Asn is not thought to affect the baking quality of rye.
The results show that cultivars combining high or acceptable baking quality and low Asn contents are already available, and that the AA formation potential could further be lowered by selecting and cultivating appropriate cultivars.

3.3. Impact of Location on Free Asn, Heritability

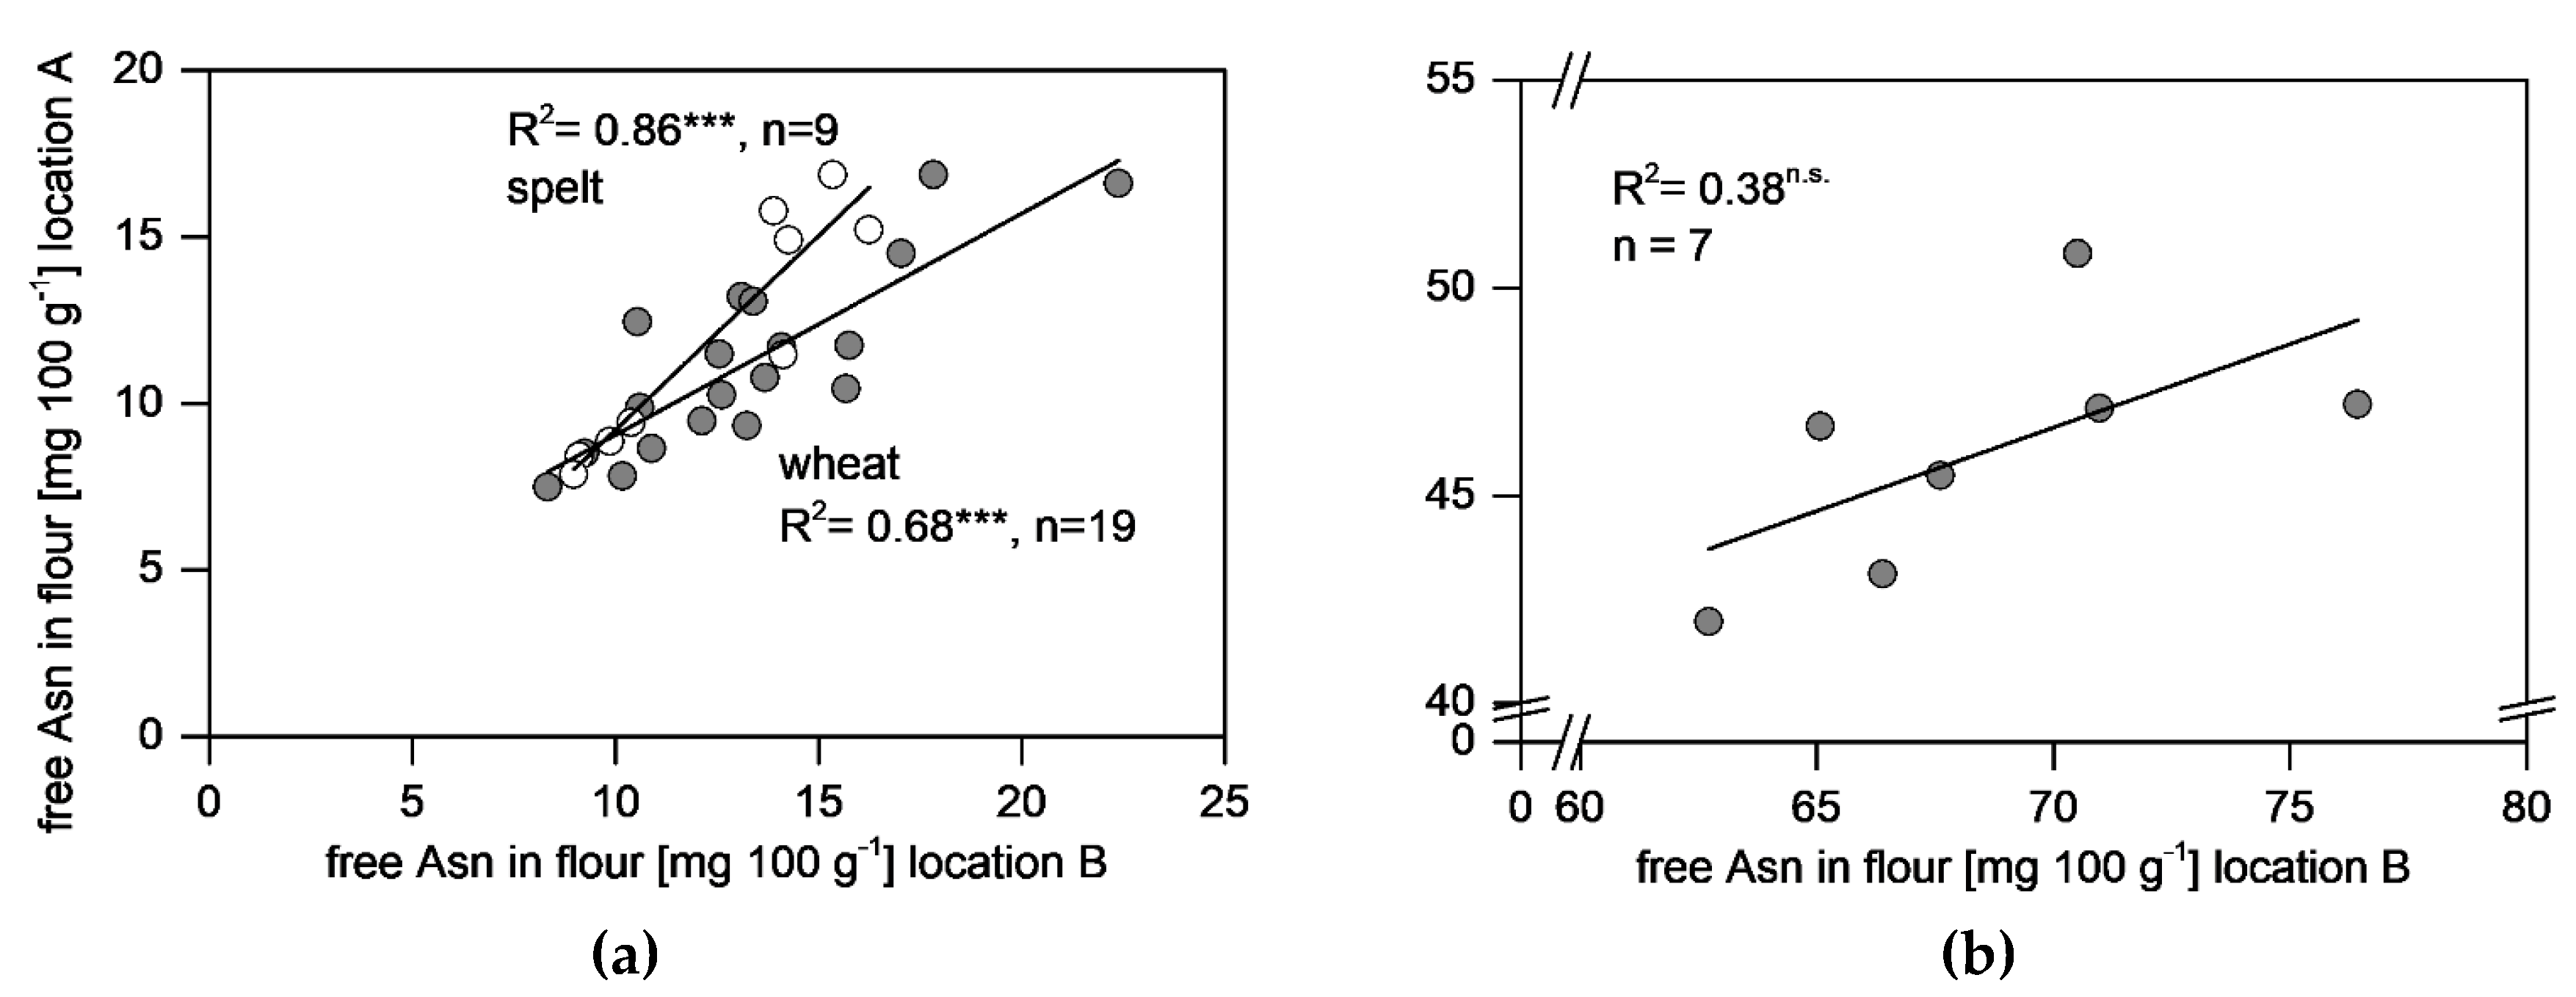
Figure 3 shows a close correlation for wheat and spelt regarding locations, meaning that the ranking of the tested cultivars concerning their Asn contents was comparable at both locations, although the absolute contents varied at least partly. For the tested rye cultivars, the correlation of Asn levels was weaker than for wheat with R² = 0.38.
This was well-supported by the calculated heritability for the free Asn concentration of wheat cultivars grown at the Dörrmenz location compared to the Kleinhohenheim location in 2008. The calculated heritability value is, in general, an indicator to which extent a factor, e.g., level of free Asn, is genetically determined or influenced by environmental conditions [37]. Heritability close to 1 indicates a high impact of the genotype, whereas a low heritability (close to 0) shows a high impact of the environment. Wheat and spelt showed a very high heritability of 0.79 and h2 0.91. Thus, the level of free Asn seemed to be bound closely to the cultivar. This was also expressed in the small variation of Asn contents between the two locations as free Asn levels changed only by 15% for wheat and 3% for spelt. In contrast, heritability for rye was 0.31 and the variation between locations regarding free Asn was about 32.8%.
A different outcome concerning heritability was obtained comparing the years at the Dörrmenz location. For wheat, a heritability of only 0.23 was found, whereas for spelt and rye, a higher impact of the cultivar was found with 0.67 for rye and 0.71 for spelt.
Investigations of Corol et al. [25] showed that genotype only had a minor effect on variation of free Asn within 26 wheat lines tested at different locations in Europe grown 2005 to 2007. Only 13% of variation in free Asn could be explained by the genotype, while 36% was the result of the environment. This is in contrast to our studies. The reason can be that the locations within the study of Corol et al. [25] were much more different. The tested wheat lines were cultivated in UK, France, Poland, and Hungary and thus growing conditions (climate conditions, soil type, cropping methods) were highly different. In our studies, cultivars were grown at only two locations. This leads to the assumption that, if locations are similar, heritability will be much higher.
However, a high genotypic impact on the degree of free Asn accumulation is the prerequisite for the significance of cultivar selection or targeted breeding efforts to lower Asn storage in cereal grains and therefore to lower AA in cereal-based bakery ware.
Thus, further experiments aiming at elucidating significant climatic or soil-specific factors on Asn accumulation are necessary to better understand the role of site-specific conditions and genotype on Asn accumulation in grains.

4. Conclusions

This study aimed to evaluate the free Asn levels in flours of winter wheat, winter spelt, winter rye, winter einkorn, and winter emmer grown under organic farming practices. Results indicated that the level of free Asn can be highly influenced by proper selection of species and cultivars. The effect was most noticeable if rye was replaced by spelt, as the free Asn amount was lowered by up to 85%. Organically grown spelt reached the lowest level of free Asn, while einkorn obtained free Asn contents similar to rye. As crude protein content of einkorn and rye (only in 2008) were high but sedimentation values were very low, the higher Asn level of both species could be explained by a higher level of soluble nitrogen fractions within the grain mostly stored as Asn.
The level of free Asn followed the order rye > einkorn > emmer > wheat > spelt. Within species, cultivars had a high impact on free Asn amount, as differences of up to 77% were found.
A close relation between free Asn and AA was also found, while crude protein and free Asn did not show any correlation, especially for wheat, where crude protein is most important for baking quality. Thus, choosing cultivars low in free Asn could be a feasible strategy to reduce AA during processing without affecting baking quality.
As heritability was high for wheat and spelt in regard to location, the level of free Asn seems to be influenced by genotype, thus breeding programs specifically for low-Asn cultivars with stable response to different environments and years are of great interest. In this context, the most important question is why species and cultivars differ in their amount of free Asn. Therefore, a deep insight into Asn synthesis is needed to answer this question.
In general, the impact of year has to be considered as free Asn contents were significantly higher in 2008 than in 2006 and 2007. Rye was affected most by year, with levels of free Asn varying up to 32%, while variation of Asn was smaller in wheat and spelt.

Author Contributions

Conceptualization, F.S., E.A.W., W.C. and S.G.-H.; Methodology, F.S. and E.A.W.; Formal Analysis, F.S.; Investigation, F.S., B.M., N.M. and P.S.; Resources, W.C.; Data Curation, F.S., B.M. and E.A.W.; Writing-Original Draft Preparation, F.S.; Writing-Review & Editing, E.A.W. and S.G.-H.; Visualization, F.S.; Supervision, S.G.-H. and W.C.; Funding Acquisition, F.S. Please turn to the CRediT taxonomy for the term explanation.

Funding

This research was funded by a scholarship to Ms. Falko Stockmann by the Faculty of Agricultural Sciences of the University of Hohenheim.

Acknowledgments

The authors would like to thank the technical staff of the experimental station “Ihinger Hof” and “Kleinhohenheim” for the agronomic management of the field trials.

Conflicts of Interest

The authors declare no conflict of interest. The funders had no role in the design of the study; in the collection, analyses, or interpretation of data; in the writing of the manuscript, and in the decision to publish the results.

References

  1. Konings, E.J.M.; Hogervorst, J.G.F.; Van Rooij, L.; Schouten, L.J.; Sizoo, E.A.; Van Egmond, H.P.; Goldbohm, R.A.; Van Den Brandt, P.A. Validation of a database on acrylamide for use in epidemiological studies. Eur. J. Clin. Nutr. 2010, 64, 534–540. [Google Scholar] [CrossRef] [PubMed] [Green Version]
  2. Mottram, D.S.; Wedzicha, B.L.; Dodson, A.T. Acrylamide is formed in the Maillard reaction. Nature 2002, 419, 448–449. [Google Scholar] [CrossRef] [PubMed]
  3. Stadler, R.H.; Blank, I.; Varga, N.; Robert, F.; Hau, J.; Guy, P.A.; Robert, M.C.; Riediker, S. Acrylamide from Maillard reaction products. Nature 2002, 419, 449–450. [Google Scholar] [CrossRef] [PubMed]
  4. Commission Regulation (EU) 2017/2158. Establishing mitigation measures and benchmark levels for the reduction of the presence as acrylamide in food. J. Eur. Union 2017, 60, 24–44. [Google Scholar]
  5. Claus, A.; Schreiter, P.; Weber, A.; Graeff, S.; Herrmann, W.; Claupein, W.; Schieber, A.; Carle, R. Influence of Agronomic Factors and Extraction Rate on the Acrylamide Contents in Yeast-Leavened Breads. J. Agric. Food Chem. 2006, 54, 8968–8976. [Google Scholar] [CrossRef] [PubMed]
  6. Curtis, T.Y.; Powers, S.J.; Balagianis, D.; Elmore, J.S.; Mottram, D.; Parry, M.A.J.; Rakszegi, M.; Bedo, Z.; Shewry, P.R.; Halford, N.G. Free Amino Acids and Sugars in Rye Grain: Implications for Acrylamide Formation. J. Agric. Food Chem. 2010, 57, 1013–1021. [Google Scholar] [CrossRef] [PubMed]
  7. Delatour, T.; Perisset, A.; Goldmann, T. Improved sample preparation to determine acrylamide in difficult matrixes such as chocolate powder, cocoa, and coffee by liquid chromatography tandem mass spectrometry. J. Agric. Food Chem. 2004, 52, 4625–4639. [Google Scholar] [CrossRef] [PubMed]
  8. Surdyk, N.; Rosen, J.; Andersson, R.; Åman, P. Effects of asparagine, fructose, and baking conditions on acrylamide content in yeast-leavened wheat bread. J. Agric. Food Chem. 2004, 52, 2047–2051. [Google Scholar] [CrossRef]
  9. Weisshaar, R. Acrylamid in Backwaren–Ergebnisse von Modellversuchen. Dtsch. Leb. Rundsch. 2004, 100, 92–97. [Google Scholar]
  10. Amrein, T.M.; Schönbächler, B.; Rohner, F.; Lukac, H.; Schneider, H.; Keiser, A.; Escher, F.; Amadò, R. Potential for acrylamide formation in potatoes: Data from the 2003 harvest. Eur. Food Res. Technol. 2004, 219, 572–578. [Google Scholar] [CrossRef]
  11. Capuano, E.; Ferrigno, A.; Acampa, I.; Serpen, A.; Acar, Ö.C.; Gökmen, V.; Fogliano, V. Effect of flour type on Maillard reaction and acrylamide formation during toasting of bread crisp model systems and mitigation strategies. Food Res. Int. 2009, 42, 1295–1302. [Google Scholar] [CrossRef]
  12. Ciesarova, Z.; Kukurova, K.; Bednarikova, A.; Morales, F.J. Effect of heat treatment and dough formulation on the formation of Maillard reaction products in fine bakery products—Benefits and weak points. J. Food Nutr. Res. 2009, 48, 20–30. [Google Scholar]
  13. Claus, A.; Carle, R.; Schieber, A. Acrylamide in cereal products: A review. J. Cereal Sci. 2008, 47, 118–133. [Google Scholar] [CrossRef]
  14. Hedegaard, R.V.; Granby, K.; Frandsen, H.; Thygesen, J.; Skibsted, L.H. Acrylamide in bread. Effect of prooxidants and antioxidants. Eur. Food Res. Technol. 2008, 227, 519–525. [Google Scholar] [CrossRef]
  15. Kotsiou, K.; Tasioula-Margari, M.; Capuano, E.; Fogliano, V. Effect of standard phenolic compounds and olive oil phenolic extracts on acrylamide formation in an emulsion system. Food Chem. 2011, 124, 242–247. [Google Scholar] [CrossRef]
  16. Levine, R.A.; Ryan, S.M. Determining the Effect of Calcium Cations on Acrylamide Formation in Cooked Wheat Products Using a Model System. J. Agric. Food Chem. 2009, 57, 6823–6829. [Google Scholar] [CrossRef]
  17. Wakaizumi, M.; Yamamoto, H.; Fujimoto, N.; Ozeki, K. Acrylamide degradation by filamentous fungi used in food and beverage industries. J. Biosci. Bioeng. 2009, 108, 391–393. [Google Scholar] [CrossRef]
  18. Curtis, T.Y.; Muttucumaru, N.; Shewry, P.R.; Parry, M.A.J.; Powers, S.J.; Elmore, J.S.; Mottram, D.S.; Hook, S.; Halford, N.G. Effects of Genotype and Environment on Free Amino Acid Levels in Wheat Grain: Implications for Acrylamide Formation during Processing. J. Agric. Food Chem. 2009, 57, 1013–1021. [Google Scholar] [CrossRef]
  19. Granvogl, M.; Wiesner, H.; Koehler, P.; Von Tucher, S.; Schieberle, P. Influence of Sulfur Fertilization on the Amounts of Free Amino Acids in Wheat. Correlation with Baking Properties as well as with 3-Aminopropionamide and Acrylamide Generation during Baking. J. Agric. Food Chem. 2007, 55, 4271–4277. [Google Scholar] [CrossRef]
  20. Martinek, P.; Klem, K.; Váňová, M.; Bartáčková, V.; Večerková, L.; Bucher, P.; Hajšlová, J. Effects of nitrogen nutrition, fungicide treatment and wheat genotype on free asparagine and reducing sugars content as precursors of acrylamide formation in bread. Plant Soil Environ. 2009, 55, 187–195. [Google Scholar] [CrossRef] [Green Version]
  21. Muttucumaru, N.; Halford, N.G.; Elmore, J.S.; Dodson, A.T.; Parry, M.; Shewry, P.R.; Mottram, D.S. Formation of High Levels of Acrylamide during the Processing of Flour Derived from Sulfate-Deprived Wheat. J. Agric. Food Chem. 2006, 54, 8951–8955. [Google Scholar] [CrossRef] [PubMed]
  22. Taeymans, D.; Wood, J.; Ashby, P.; Blank, I.; Studer, A.; Stadler, R.H.; Gondé, P.; Van Eijck, P.; Lalljie, S.; Lingnert, H.; Lindblom, M.; et al. A Review of acrylamide: An industry perspective on research, analysis, formation, and control. Crit. Rev. Food Sci. Nutr. 2004, 44, 323–347. [Google Scholar] [CrossRef] [PubMed]
  23. Weber, E.A.; Graeff, S.; Koller, W.D.; Hermann, W.; Merkt, N.; Claupein, W. Impact of nitrogen amount and timing on the potential of acrlyamide formation in winter wheat (Triticum aestivum L.). Field Crop Res. 2008, 106, 44–52. [Google Scholar] [CrossRef]
  24. Weber, E.A.; Koller, W.D.; Graeff, S.; Hermann, W.; Merkt, N.; Claupein, W. Impact of different nitrogen fertilizers and an additional sulfur supply on grain yield, quality, and the potential of acrylamide formation in winter wheat. J. Plant Nutr. Soil Sci. 2008, 171, 643–655. [Google Scholar] [CrossRef]
  25. Corol, D.I.; Ravel, C.; Rakszegi, M.; Charmet, G.; Bedo, Z.; Beale, M.H.; Shewry, P.R.; Ward, J.L. 1H-NMR screening for the high-throughput determination of genotype and environmental effects on the content of asparagine in wheat grain. Plant Biotechnol. J. 2016, 14, 128–139. [Google Scholar] [CrossRef] [PubMed]
  26. Postles, J.; Powers, S.J.; Elmore, J.S.; Mottram, D.S.; Halford, N.G. Effects of variety and nutrient availability on the acramamide-forming potential of rye grain. J. Cereal Sci. 2013, 57, 463–470. [Google Scholar] [CrossRef] [PubMed]
  27. Shewry, P.R.; Zhao, F.J.; Gowa, G.B.; Hawkins, N.D.; Ward, J.L.; Beale, M.H.; Halford, N.G.; Parry, M.A.; Abécassis, J. Sulfur nutrition differentially affects the distribution of asparagine in wheat grain. J. Cereal Sci. 2009, 50, 407–409. [Google Scholar] [CrossRef]
  28. Curtis, T.Y.; Powers, S.J.; Halford, N.G. Effects of fungicide treatment on free amino acid concentration and acrylamide-forming potential in wheat. J. Agric. Food Chem. 2016, 64, 9689–9696. [Google Scholar] [CrossRef]
  29. Murphy, K.M.; Campbell, K.G.; Lyon, S.R.; Jones, S.S. Evidence of varietal adaptation to organic farming systems. Field Crops Res. 2007, 102, 172–177. [Google Scholar] [CrossRef] [Green Version]
  30. Wolfe, M.S.; Baresel, J.P.; Desclaux, D.; Goldringer, I.; Hoad, S.; Kovacs, G.; Löschenberger, F.; Miedaner, T.; Østergård, H.; van Bueren Lammerts, E.T. Developments in breeding cereals for organic agriculture. Euphytica 2008, 163, 323–346. [Google Scholar] [CrossRef]
  31. Kunz, P.; Becker, K.; Buchmann, M.; Cuendet, C.; Müller, J.; Müller, U. Bio-Getreidezüchtung in der Schweiz. Tagungsband 2006, 2, 31–35. [Google Scholar]
  32. Dumas, A. Stickstoffbestimmung nach Dumas. Die Praxis des org. Chemikers, 41st ed.; Schrag: Nürnberg, Germany, 1962. [Google Scholar]
  33. Teller, G.L. Non-protein nitrogen compounds in cereals and their relation to the nitrogen factor for protein in cereals and bread. Cereal Chem. 1932, 9, 261–274. [Google Scholar]
  34. Lüpke, M. Entwicklung und Anwendung von Reagenzien und Verfahren zur Achiralen und Chiralen Analytik von Aminosäuren Mittels GC und HPLC. Ph.D. Thesis, Universität Hohenheim, Stuttgart, Germany, 1996. [Google Scholar]
  35. Weisshaar, R. Bestimmung von Acrylamid in Lebensmitteln, Aufarbeitungsverfahren für Die LC-MS-MS; Prüfverfahren: 200L05401; Chemisches und Veterinäruntersuchungsamt Stuttgart: Fellbach, Germany, 2003.
  36. Weisshaar, R. Bestimmung von Acrylamid in Lebensmitteln; Prüfverfahren: 201L01301; Chemisches und Veterinäruntersuchungsamt Stuttgart: Fellbach, Germany, 2003.
  37. Miedaner, T. Grundlagen der Pflanzenzüchtung; DLG-Verlag: Frankfurt am Main, Germany, 2010; ISBN 978-3769007527. [Google Scholar]
  38. Brunner, B. Qualität von Ökobrotgetreide weiter verbessern. Ökologie Landbau 2001, 121, 35–37. [Google Scholar]
  39. Baeckstrom, G.; Hanell, U.; Svensson, G. Baking quality of winter wheat grown in different cultivating systems 1992–2001—A holistic approach. J. Sustain. Agric. 2004, 3, 63–83. [Google Scholar] [CrossRef]
  40. Haglund, A.; Johansson, L.; Dahlstedt, L. Sensory evaluation of wholemeal bread from ecologically and conventionally grown wheat. J. Cereal Sci. 1998, 27, 199–207. [Google Scholar] [CrossRef]
  41. Simsek, S.; Ohm, J.B.; Lu, H.; Rugg, M.; Berzonsky, W.; Alamri, M.S.; Mergoum, M. Effect of pre-harvest sprouting on physicochemical changes of proteins in wheat. Sci. Food Agric. 2014, 94, 205–212. [Google Scholar] [CrossRef] [PubMed]
  42. Fredriksson, H.; Tallving, J.; Rosen, J.; Aman, P. Fermentation Reduces free Asparagines in Dough and Acrylamide Content in Bread. Cereal Chem. 2004, 81, 650–653. [Google Scholar] [CrossRef]
  43. Elmore, J.S.; Koutsidis, G.; Dodson, A.T.; Mottram, D.S.; Wedzicha, B.L. Measurement of acrylamide and its precursors in potato, wheat, and rye model systems. J. Agric. Food Chem. 2005, 53, 1286–1293. [Google Scholar] [CrossRef] [PubMed]
  44. Johansson, E.; Svensson, G. Variation in bread-making quality: Effects of weather parameters on protein concentration and quality in some Swedish wheat cultivars grown during the period 1975–1996. J. Sci. Food Agric. 1998, 78, 109–118. [Google Scholar] [CrossRef]
  45. Stockmann, F.; Weber, E.A.; Graeff, S.; Claupein, W. Influence of cropping systems on the potential formation of acrylamide in different cultivars of wheat. In Proceedings of the 16th IFOAM Organic World Congress, Modena, Italy, 16–20 June 2008. [Google Scholar]
  46. Springer, M.; Fischer, T.; Lehrack, A.; Freund, W. Acrylamidbildung in Backwaren. Getreide Mehl Brot 2003, 57, 274–278. [Google Scholar]
  47. Lea, P.J.; Sodek, L.; Parry, M.A.J.; Shewry, P.R.; Halford, N.G. Asparagine in Plants. Ann. Appl. Biol. 2006, 150, 1–26. [Google Scholar] [CrossRef]
  48. Ohm, J.B.; Simsek, S.; Mergoum, M. Variation of protein MWD parameters and their associations with free asparagine concentration and quality characteristics in hard red spring wheat. J. Cereal Sci. 2018, 79, 154–159. [Google Scholar] [CrossRef]
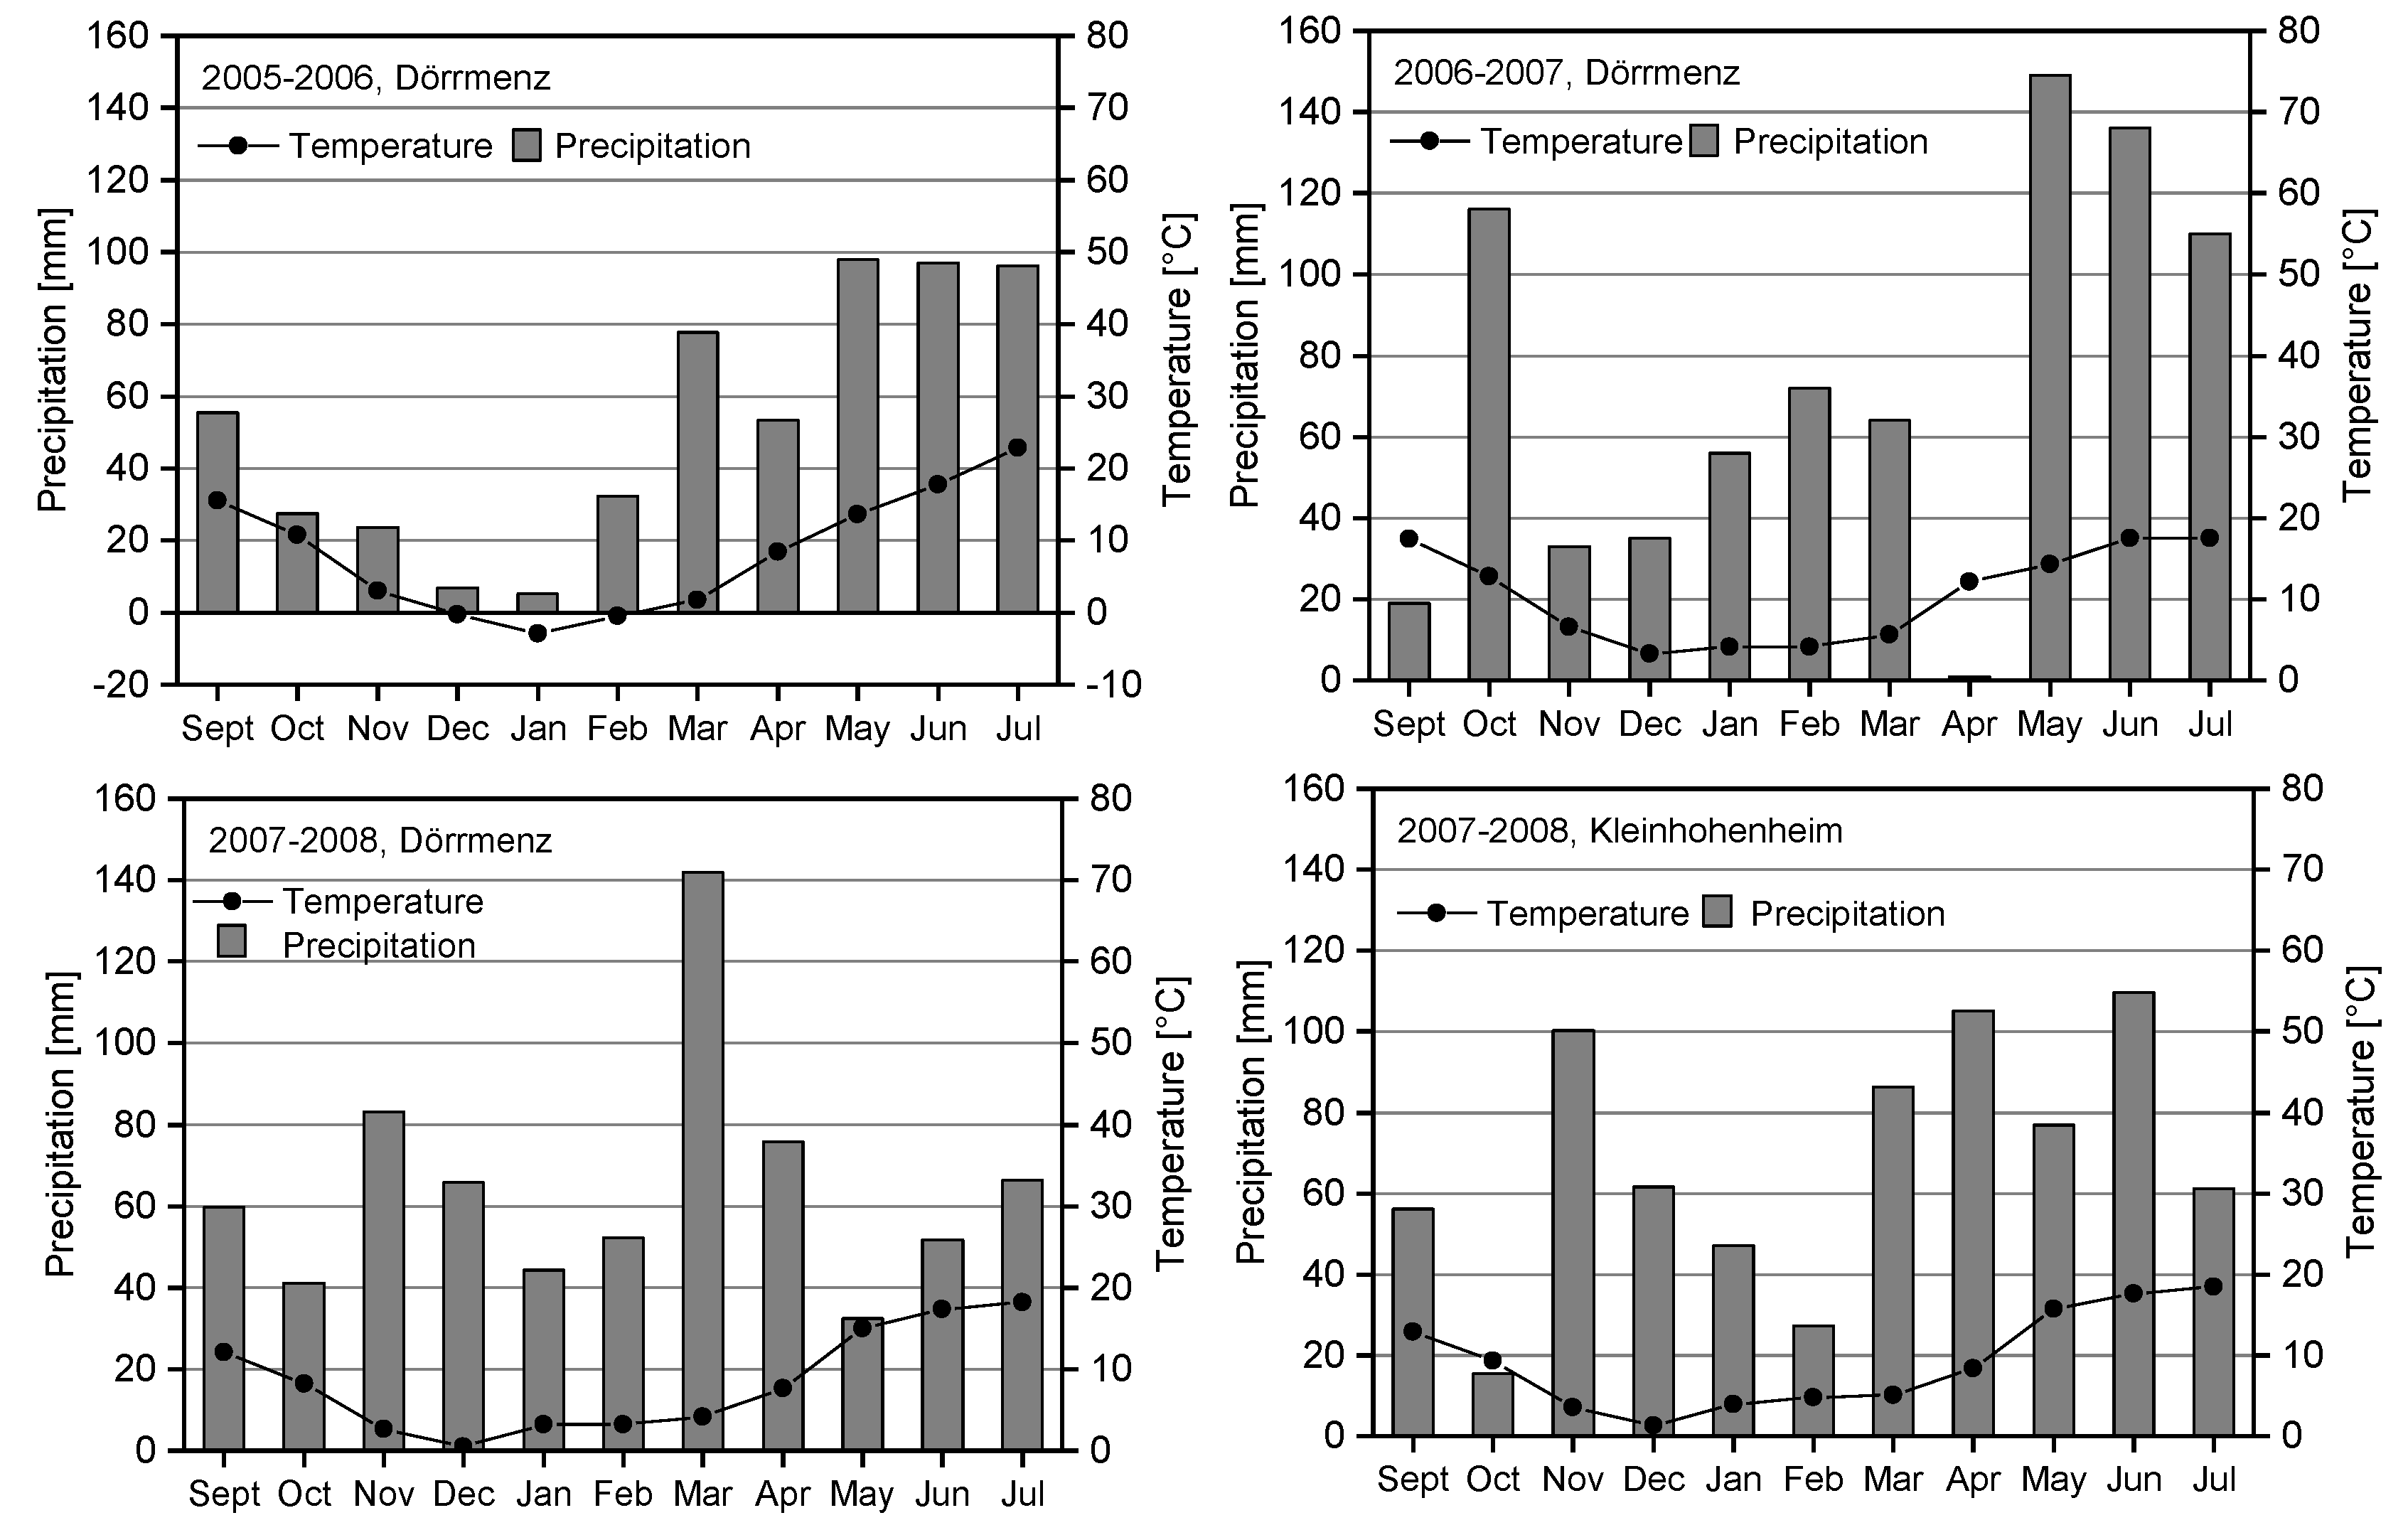
Figure 1. Temperature (●) and precipitation (bars) at the Dörrmenz organic trial site for the growing seasons 2005–2006, 2006–2007, and 2007–2008 and the Kleinhohenheim organic site for the growing season 2007–2008.
Agronomy 08 00294 g001
Figure 2. Free Asn content separated by species (A: wheat, B: spelt, einkorn, emmer, C: rye), year (2006, 2007, 2008), and cultivar. Symbols with different letters within the same year indicate significant differences (α = 0.05, t-Test) between cultivars. The right-hand y-scale of B refers to free Asn content of einkorn and emmer.
Agronomy 08 00294 g002aAgronomy 08 00294 g002b
Figure 3. Relation of free Asn at two different locations of cultivars of wheat & spelt (a), and rye (b) during the growing season 2007/2008.
Agronomy 08 00294 g003
Table 1. Tested cereal species and cultivars at the Dörrmenz and Kleinhohenheim trial sites over the years 2006–2008.
SpeciesCultivarQuality Grade *Cultivation YearCultivated in 2008
DörrmenzKleinhohenheim
Winter wheatAkteurE2006, 2007, 2008yesyes
Arctur-′′yesyes
AszitaB′′yesyes
Ataro1′′yesyes
BussardE′′yesyes
CapoE′′yesyes
CassiaTOP′′yesyes
Clivio1′′yesyes
Karneol-′′yesyes
LaurinTOP′′yesyes
MagisterE′′yesyes
NaturastarA′′yesyes
Pollux1′′yesyes
ScaroTOP′′yesyes
SpießHS154-′′yesyes
SpießHS226-′′yesyes
TengiTOP′′yesyes
WengaTOP′′yesyes
WiwaTOP′′yesyes
Winter speltFranckenkorn 2006, 2007, 2008yesyes
O. Rotkorn ′′yesyes
Alkor ′′yesyes
Sirino ′′yesyes
Badengold ′′yesyes
Tauro ′′yesyes
Titan ′′yesyes
Samir 2008yesyes
Zollernspelz 2008yesyes
Winter ryeRecrut 2006, 2007, 2008yesyes
Lichtkornroggen ′′yesyes
Amilo 2008yesyes
Carotop 2006, 2007nono
Conduct 2008yesyes
Crona 2006nono
Hacada 2006nono
Harca 2006, 2008yesyes
HS Aman 2008yesno
Firmament 2007, 2008yesno
Lauropa 2008yesyes
Rolipa 2008yesyes
Winter einkornSaffra 2006nono
Albini 2007nono
Terzino 2008yesno
Winter emmerEM07 2007nono
EM08 2008yesno
* Letters, numbers, and TOP refers to the German and Switzer quality classes (E and TOP: highest baking quality, A and 1: high baking quality), Minus means no information is available. ′′ means see above.
Table 2. F-values and p-values for main effects species, year, and interactions between factors on grain yield, crude protein content, and free Asn content of flours.
Grain YieldCrude ProteinFree Asn
DFFp1FpFp
Species (S) 7.69***62.08***134.83***
Year (Y) 16.22***12.89***48.89***
S × Y 25.49***9.36***16.78***
1 level of confidence (p < 0.05 *, 0.01 **, 0.001 ***, n.s. not significant).
Table 3. F-values and p-values for main effects, cultivar, year, and interactions between factors on grain yield (GY), crude protein content (CP), sedimentation value (SV), falling number (FN), and free Asn content of flours in dependence of the species. Because only one cultivar of einkorn and emmer was cultivated during years both species were excluded for statistical analyses (α = 0.05, t-test).
Winter WheatWinter SpeltWinter Rye
GYCPSVAsnGYCPAsnGYFNAsn
Fp1FpFpFpFpFpFpFpFpFp
Cultivar6.1***42.0***27.5***16.7***19.1***446.0***57.0***80.5***1.2n.s.0.1n.s.
Year1616.6***273.2***41.9***264.1***540.7***469.7***204.4***28.2***1.3n.s.143.2***
Cultivar × Year1.5n.s.6.5***3.0***7.3***2.5*17.67***7.1***0.9n.s.0.5n.s.0.2n.s.
1 level of confidence (p < 0.05 *, 0.01 **, 0.001 ***, n.s. not significant).
Table 4. Grain Yield (GY), crude protein (CP), sedimentation value (SV), falling number (FN), and free Asn of the five tested crop species depending on year. Treatments in the same line assigned by the same letters are not significantly different (α = 0.05, t-test).
Winter WheatWinter SpeltWinter RyeWinter EinkornWinter Emmer *
20062007200820062007200820062007200820062007200820072008
GY [t ha−1]4.2 ef2.1 a4.2 ef4.2 ef2.4 ab4.7 f4.1 de3.3 cd3.4 cd2.7 abc1.8 a3.1 bcd1.94.2
CP [%]11.6 e9.9 c10.4 d13.4 fg11.6 e12.9 f6.8 a6.6 a8.8 b15.6 g11.9 ef14.8 fg10.611.8
Asn [mg 100 g−1]8.1 b8.2 b13.2 c6.6 ab5.5 a12 c32.3 de28.6 d67.0 f25.5 d30.7 de40.0 e13.418.1
SV [ml]31.8 b30.6 a34.7 c
FN [s] 217 a224 a245 a
* Emmer was not integrated into the statistical analysis, because it was not grown each year. Nevertheless, data are presented for comparing species. Different letters assign significant differences (α = 0.05%, Tukey test).