Review

Cropping Systems and Climate Change in Humid Subtropical Environments

by
Ixchel M. Hernandez-Ochoa
and
Senthold Asseng
*
Agricultural & Biological Engineering Department, University of Florida, Frazier Rogers Hall, Gainesville, FL 32611, USA
*
Author to whom correspondence should be addressed.
Agronomy 2018, 8(2), 19; https://doi.org/10.3390/agronomy8020019
Submission received: 15 December 2017 / Revised: 7 February 2018 / Accepted: 10 February 2018 / Published: 14 February 2018
(This article belongs to the Special Issue Adapting Crop Productivity to Climate Change)

Abstract

:
In the future, climate change will challenge food security by threatening crop production. Humid subtropical regions play an important role in global food security, with crop rotations often including wheat (winter crop) and soybean and maize (summer crops). Over the last 30 years, the humid subtropics in the Northern Hemisphere have experienced a stronger warming trend than in the Southern Hemisphere, and the trend is projected to continue throughout the mid- and end of century. Past rainfall trends range, from increases up to 4% per decade in Southeast China to −3% decadal decline in East Australia; a similar trend is projected in the future. Climate change impact studies suggest that by the middle and end of the century, wheat yields may not change, or they will increase up to 17%. Soybean yields will increase between 3% and 41%, while maize yields will increase by 30% or decline by −40%. These wide-ranging climate change impacts are partly due to the region-specific projections, but also due to different global climate models, climate change scenarios, single-model uncertainties, and cropping system assumptions, making it difficult to make conclusions from these impact studies and develop adaptation strategies. Additionally, most of the crop models used in these studies do not include major common stresses in this environment, such as heat, frost, excess water, pests, and diseases. Standard protocols and impact assessments across the humid subtropical regions are needed to understand climate change impacts and prepare for adaptation strategies.

1. Introduction

Global food security faces many challenges in the future, including a growing population expected to reach more than 9 billion by mid-century, and to cause an increased demand for grain-fed, meat-based food [1,2]. Global crop production has increased over the last decades with advances in technology, land use intensification, and improvement in cultural practices [3]. Yet, increasing environmental degradation, such as soil erosion, loss of biodiversity, and pollution of water bodies, has raised concerns about improving sustainability in crop production systems, while maintaining and increasing crop production levels [4,5]. In addition, global food security faces the challenge of climate change, which can potentially cause significant reductions in global food production in the future [6,7,8]. Currently, anthropogenic greenhouse gas emissions, especially CO2, are the largest contributors to climate change [9]. Global atmospheric CO2 concentrations have reached 400 ppm by the end of 2015, which is approximately 40% higher than preindustrial levels [10]. As a direct effect of this process, combined global land and ocean mean temperature have increased approximately 0.85 °C from 1880 to 2012, with the last three decades being the warmest since 1850 [9]. Precipitation has increased, mostly in the Northern Hemisphere, while other regions show no general trend [11,12]. Climate change will also affect the occurrence of extreme events, such as increased heat waves, heavy rainfall, and drought periods [13].
Climate change and variability pose risks to food production from many perspectives. Heat stress during anthesis may reduce pollen viability, resulting in fewer grain sets [14,15,16,17]. Likewise, generalized negative effects are observed when crops are subjected to water stress, resulting in reduced dry matter accumulation and grain yield [18,19,20]. In future conditions, potential atmospheric CO2 enrichment could be advantageous for plant growth, as long as temperature and water are not limiting factors [21]. This review aims to synthesize and compare the past trends and future climate projections, as well as impacts on main agricultural crops in the humid subtropical regions of the world, and also to identify research gaps.

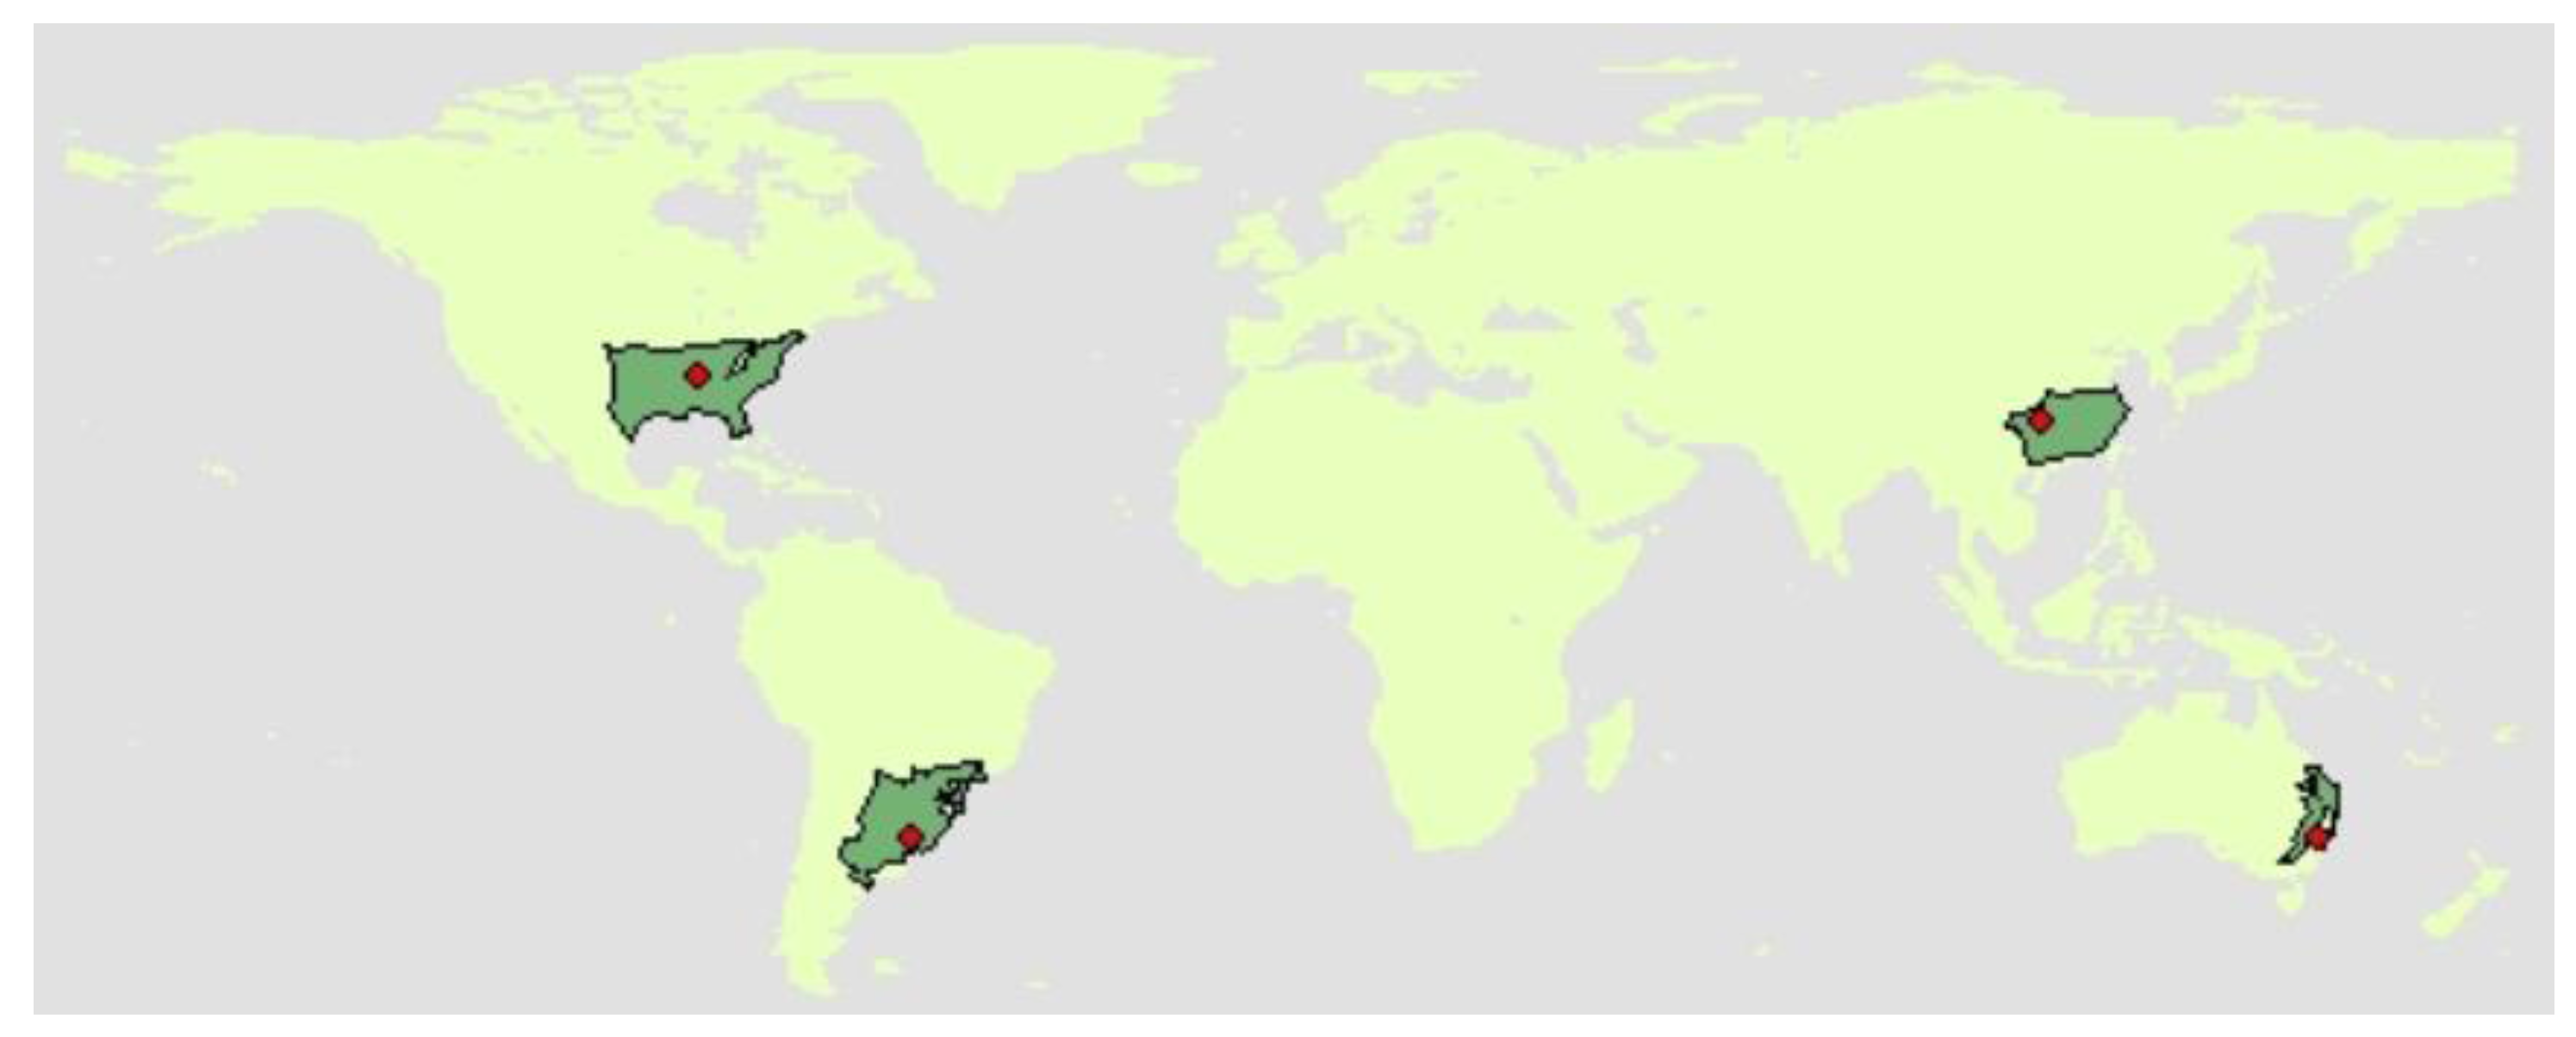
2. Humid Subtropical Environments

2.1. Importance of Agriculture

Humid subtropical regions are located within the mid-latitudes, between 20° and 35° N and S, with the major regions being the southeast U.S., southeast China, South America, and east Australia (Figure 1 and Table 1). Agriculture in these regions plays an important role in food security and the regional economies. Winter wheat constitutes the major cereal crop during the winter season in all humid subtropical regions (Table 1). Summer crops vary among these regions, with maize and soybean being the most important. In the southeast U.S., the humid subtropical region includes the states from Missouri to Virginia in the north, and Louisiana to Florida in the south (Figure 1). Approximately 10% of the U.S. national maize production occurs in this region, followed by soybean at 3% and wheat at 1% of the U.S. national production [22]. In China, the humid subtropical region is a diverse agricultural area located in the southeast, extending from the south of Shaanxi to the south of Jiangsu provinces, and to the southern border of China (Figure 1). Approximately 25% of the Chinese national wheat and soybean production occurs in this region, whereas maize accounts for approximately 6% of the Chinese national production [23]. In South America, the humid subtropical region comprises the Pampas in northeast Argentina, Uruguay, and South Brazil, including the states of Rio Grande do Sul, Santa Catarina, and Paraná. Northeast Argentina produces more than 75% of Argentina’s wheat, soybean, and maize. In Uruguay, soybean is the major production crop, contributing to 65% of the agricultural area for those three crops [24]. More than 90% of the total national wheat is produced in the southern states of Brazil [25]. In east Australia, the humid subtropical region extends to the Great Dividing Range in the states of Queensland, New South Wales, and Victoria (Figure 1). Approximately 46% of national wheat production occurs in the eastern region, but little soybean and maize are grown there [26,27].
Most wheat, soybean, and maize are grown under rain-fed conditions in humid subtropical regions. Non-tillage systems are commonly used to conserve soil, add organic matter, and improve soil moisture [28,29].

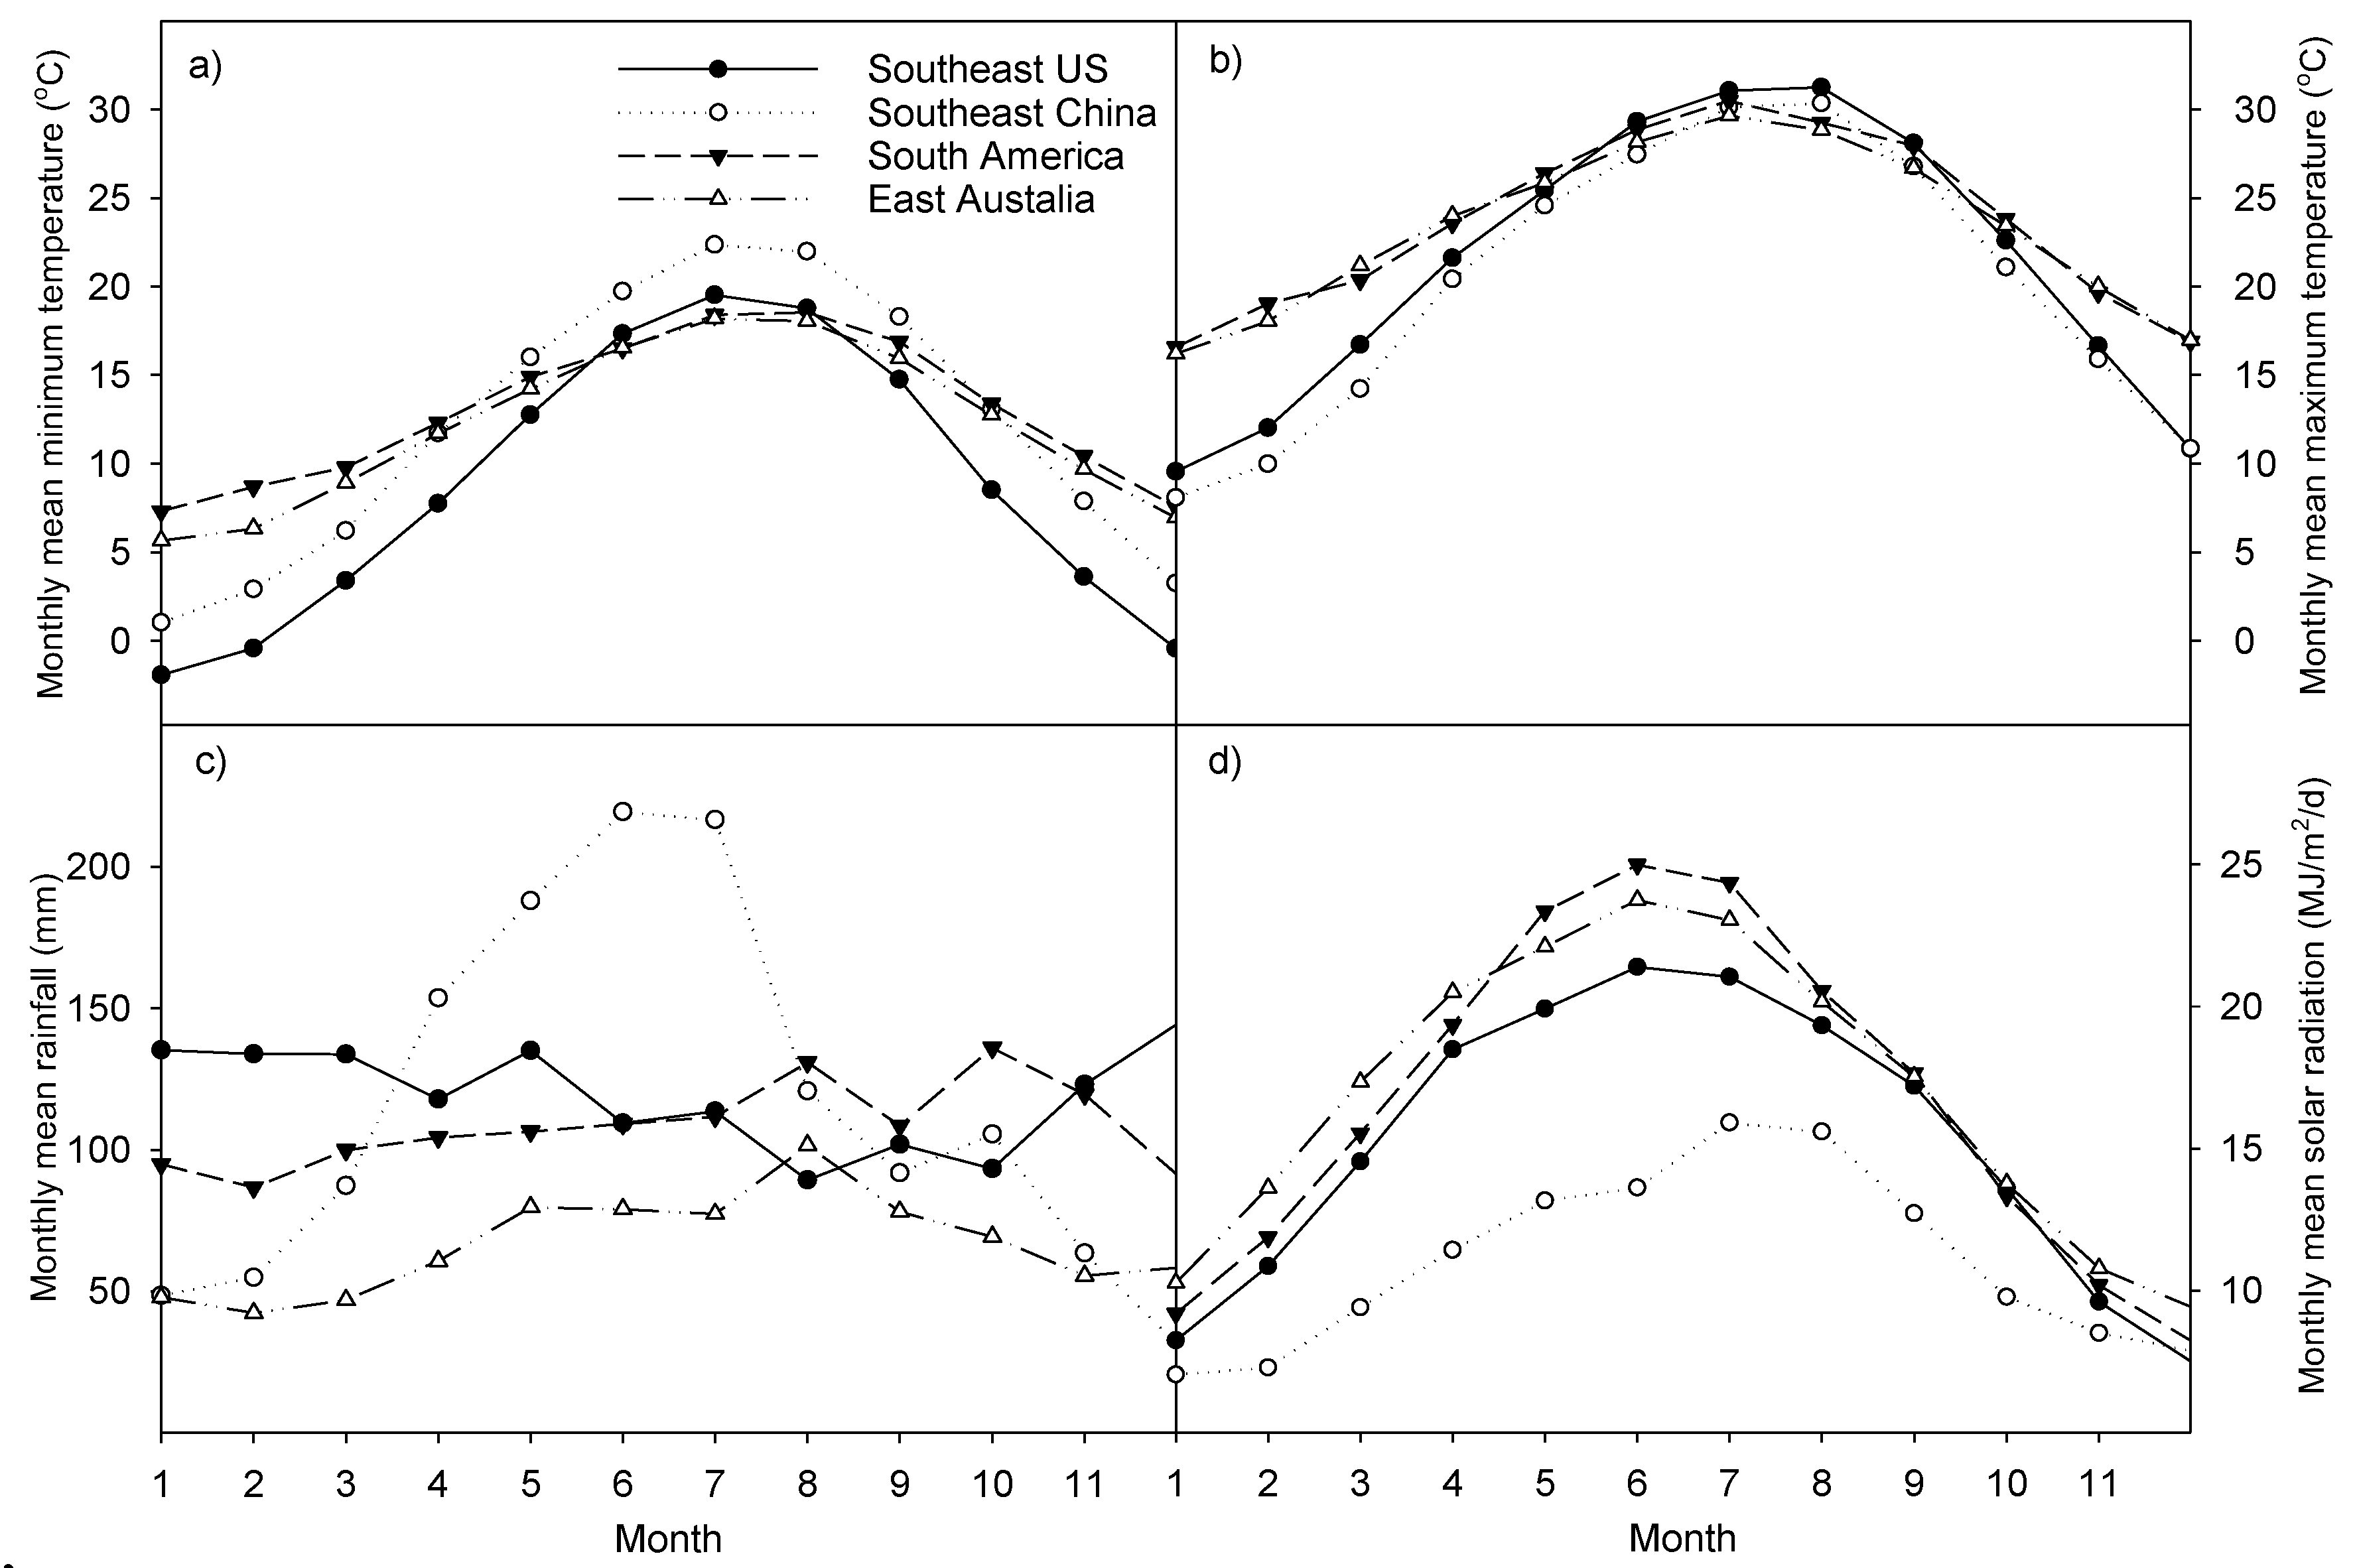
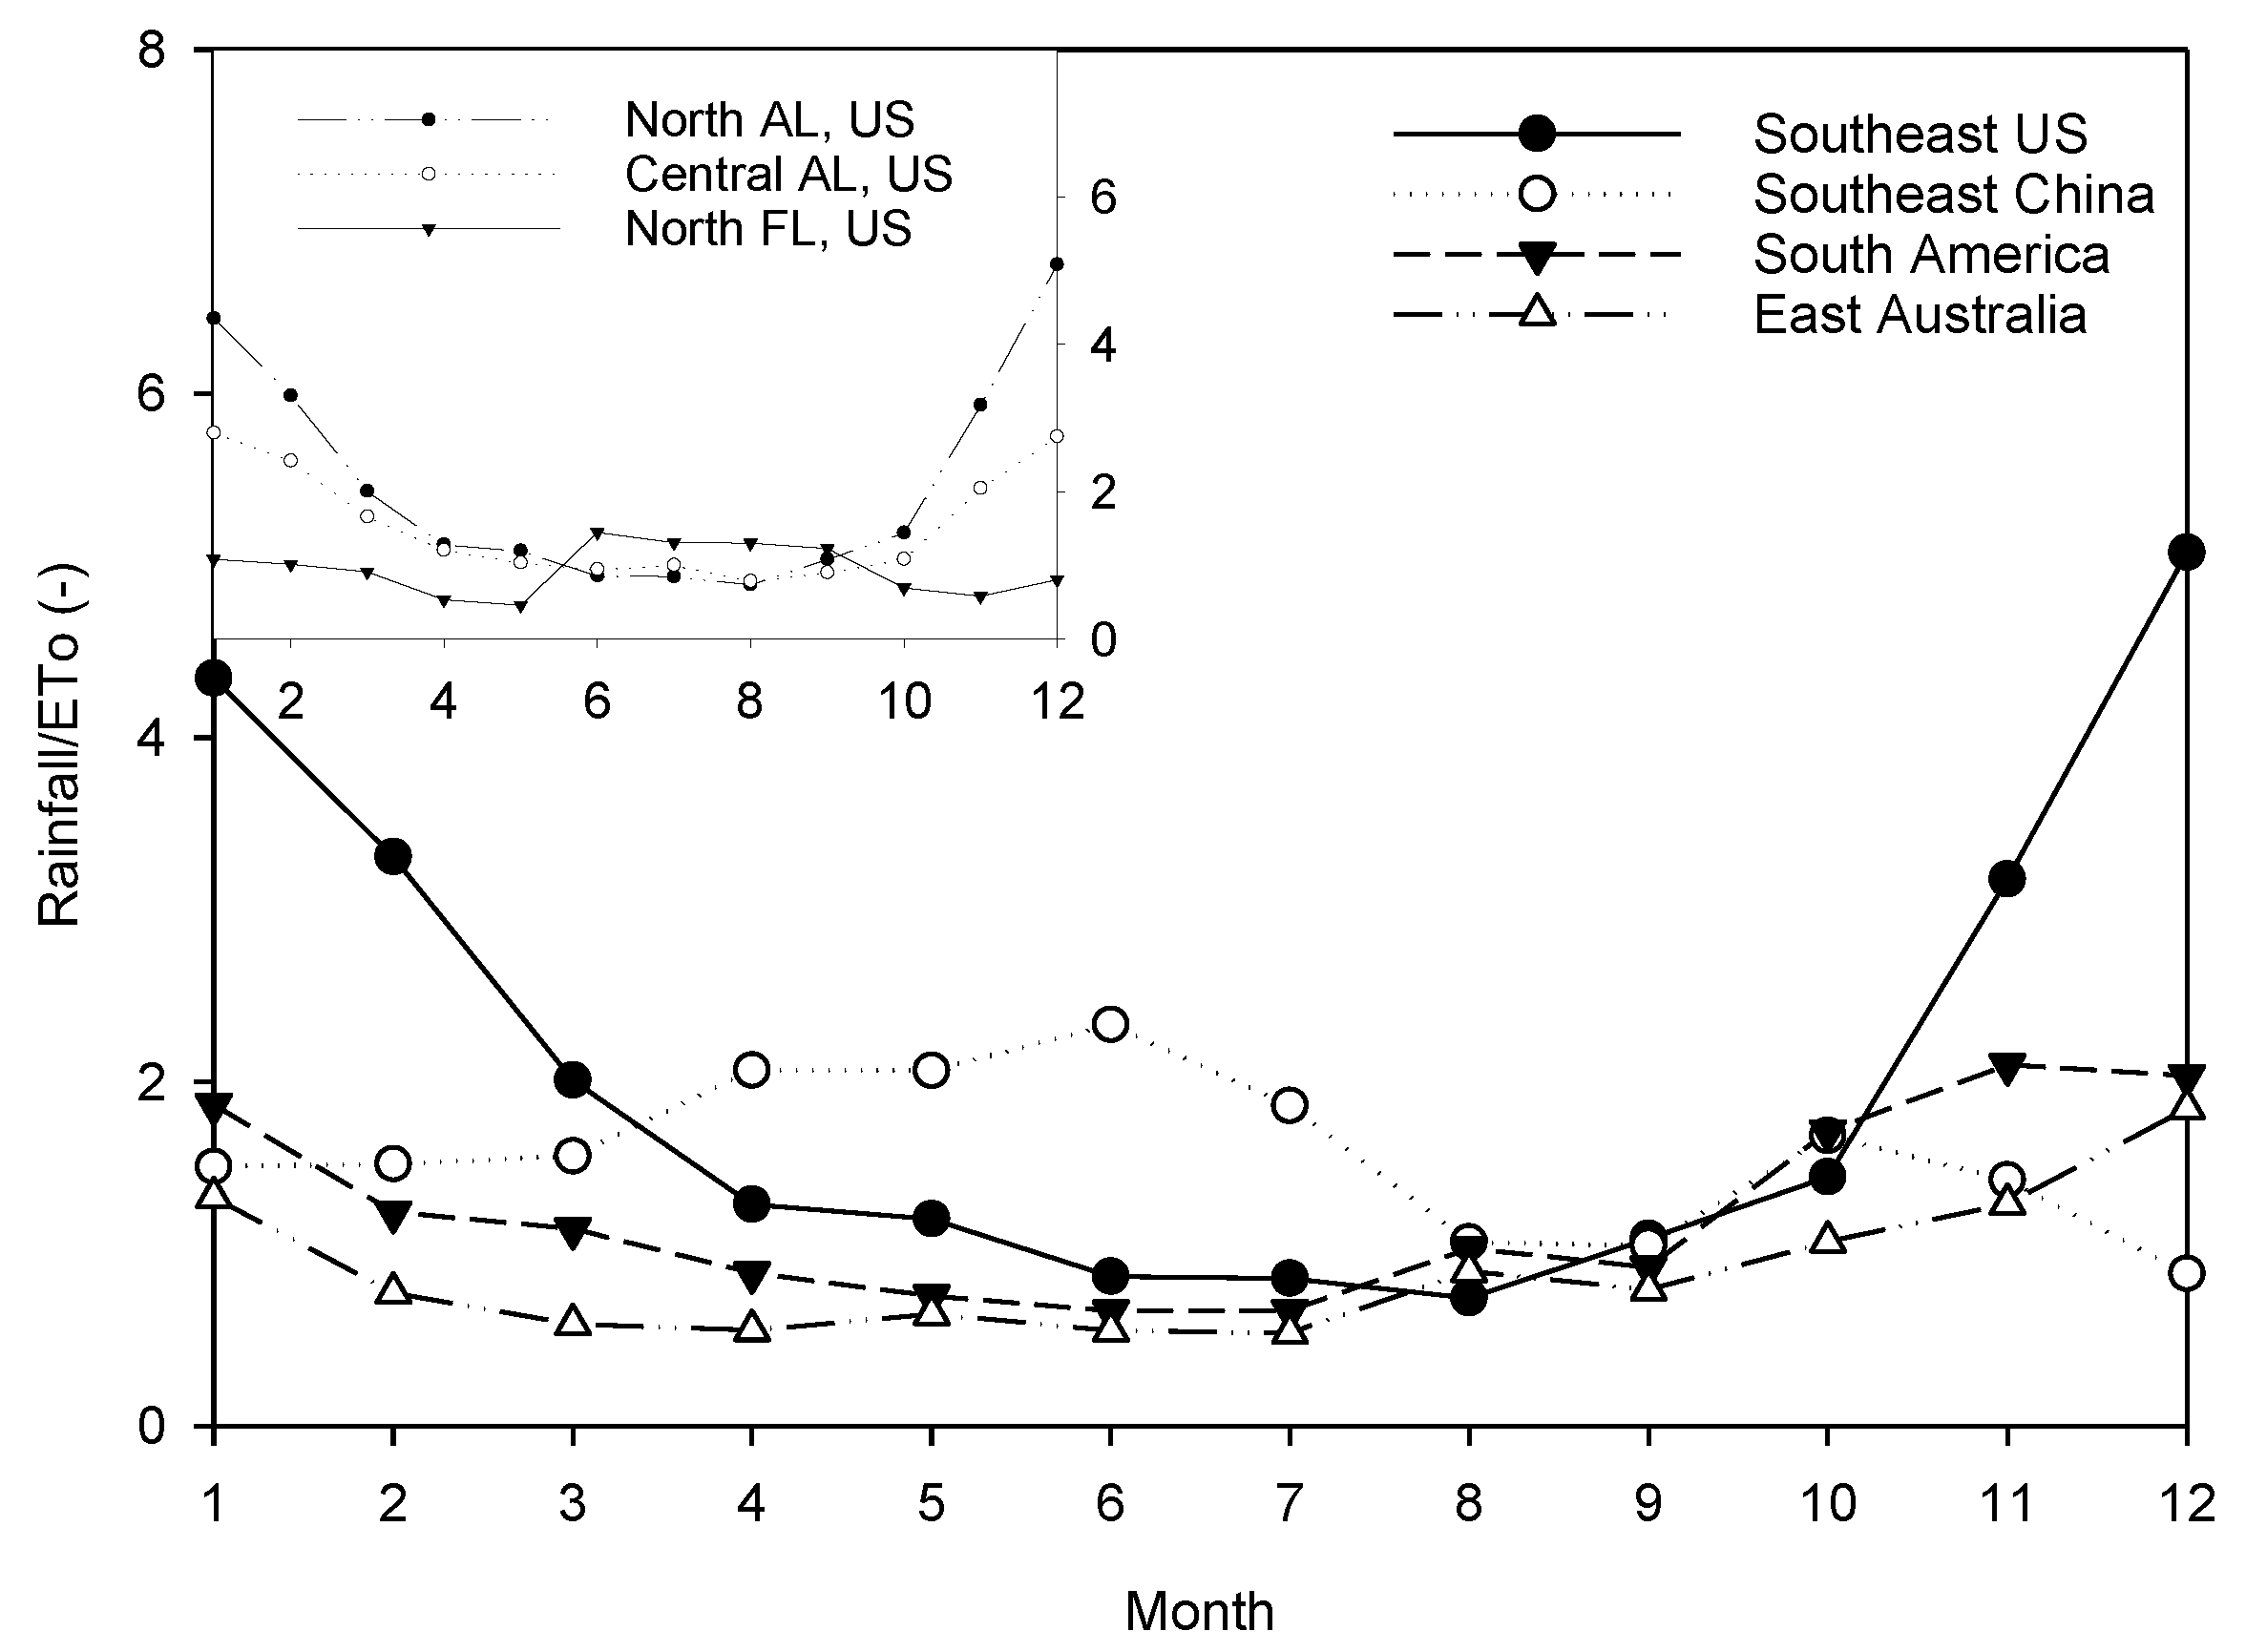
2.2. Climate Characteristics

In this study, we focus on the four main humid subtropical regions of the world, although smaller regions with such a climate exist elsewhere (e.g., parts of South Africa and Europe). The Köppen climate classification distinguishes five major climate types, based on regional temperature and rainfall characteristics [30]. The humid subtropical climate is characterized by high air humidity and hot summers [34,35,36]. Humid subtropical regions show mild winters, with a minimum temperature in the coldest month above −3 °C but below 18 °C (Figure 2a), and hot summers, a mean maximum temperature around 30 °C in the warmest months (Figure 2b). Mean monthly rainfall is a long-term average evenly distributed over the year, with annual averages ranging between 795 mm and 1430 mm. Southeast China is an exception in terms of average rainfall distribution, with higher mean rainfall during summer months due to a monsoonal influence in this region (Figure 2c). Solar radiation is similar across the humid subtropical regions, following a seasonal pattern, where summer months receive higher solar radiation compared to winter months (Figure 2d). The southeast China region shows a similar pattern in solar radiation, but with approximately 40% less solar radiation in summer than the other humid subtropical regions, due to atmospheric pollution that significantly reduces incoming solar radiation [37,38].
The occurrence of hot days during the summer (days with maximum temperature ≥32 °C) is common in the humid subtropical regions. Hot days can impact crop growth and yield if they occur during the crop reproductive or grain filling stage. From 1981 to 2010, the mean annual number of hot days ranged from 10 to 60 per year across the humid subtropical regions, with the southeast U.S. showing the highest cumulative number. During the same period, southeast China showed a lower frequency of hot days, likely related to lower incoming radiation (Figure 3).
A mostly positive water balance in humid subtropical regions allows for rain-fed production during winter and summer months. Most of the humid subtropical regions have a >0.7 rainfall/potential evapotranspiration (ETo) ratio. Southeast U.S. shows a high rainfall/ETo ratio during winter months, due to high rainfall but low evapotranspiration. However, the ratio tends to be more evenly distributed moving from north to south within the U.S., due to decreased rainfall during the winter but increased rainfall during summer months (Figure 4, top left). By contrast, east Australia shows the lowest rainfall/ETo ratio during most of the year, and tends to be drier than the other humid subtropical regions (Figure 4).

2.3. Climate Drivers

Climate in all humid subtropical regions is predominantly influenced by El Niño Southern Oscillation (ENSO), ocean air currents, and topography features [35,40,41,42,43,44]. Temperature and rainfall in the southeast U.S. are mostly influenced by the Bermuda High, which is a high-pressure system located near the U.S. Atlantic coast. In southeast China, the Southeast Asian monsoon is one of the key climate drivers; it consists of an air flow system that brings warm temperatures, heavy rainfall, and high humidity conditions during the summer months [36,45]. During the winter, the East Asian winter monsoon carries cold air from the polar region into East Asia. In the region of South America, the movement of mid-latitude cold air causes temperature variability across the region, with increased fluctuations during the winter [46]. Rainfall in this region is affected by shifts in convection over the Intertropical Convergence Zone (ITCZ), which brings heavy rainfall from Southern Brazil to Northern Argentina in the summer [41]. In addition, the South America region lies within a Hadley circulation cell, where trade winds are an important phenomenon that bring high moisture to this region [34]. In east Australia, rainfall is mostly affected by ENSO and its interactions with the Indian Ocean Dipole (IOD) and the Interdecadal Pacific Oscillation (IPO) [43,47,48,49]. Even though different phenomena affect humid subtropical regions, these regions share similar climate features, such as climatic–atmospheric systems that bring high moisture, frequent rainfall, and mild temperatures during winter.

2.4. Soil Characteristics

Soil types vary around the world depending on parental material, climate, topography, and time of soil formation [50]. In humid subtropical regions, Ultisols are the most predominant soil type in the Northern Hemisphere, whereas Mollisols are the main type in the Southern Hemisphere (Table 1). Ultisols are characterized by low natural fertility due to high leaching and weathering occurring over time. These soils usually display a low pH and a limited availability of Ca, Mg, and K [51,52]. Ultisols show a characteristic subsurface horizon with reddish or yellowish clay accumulation, which indicates the occurrence of iron oxide [51]. Improving cultural practices, conserving soil, and managing fertilizer are key to maintaining crop yields and reducing soil degradation due to intensive cropping [53]. By contrast, Mollisols are naturally fertile soils, typical of grass land ecosystems in mid-latitudes [54]. Mollisols display a dark surface layer called mollic pedon, which contains high amounts of organic material derived from root matter accumulation over time [51]. Although Mollisols are naturally high in organic matter and fertility, intensive cropping declines the natural fertility over time. Uruguay and the Pampas region in Argentina are an example of regions with such soils, where fertilizer management and no-tillage practices attempt to slow down the soil fertility loss [54,55,56].

3. Global and Regional Climate Trends and Adaptation

3.1. Global Trends

All representative concentration pathway (RCP) scenarios project an increase in global minimum and maximum temperatures relative to the period from 1986 to 2005, as atmospheric CO2 continues to increase (Table 2). Minimum temperature shows a steeper increase than maximum temperature [57]. Combined RCPs for the 2035 period show a 0.3 to 0.7 °C increase in global mean surface temperature, and atmospheric CO2 levels reaching up to 449 ppm (Table 2). The warming trend continues to the end of century, with the RCP 2.6 showing a sustained warming of 1 °C, while the RCP 8.5 shows up to 3.7 °C temperature increase (Table 2). Temperature and rainfall extremes are also expected to increase with climate change [9]. As for temperature, models show an increase in magnitude and frequency of warm daily temperature extremes and decreases in cold temperature extremes. Heat waves are expected to increase in frequency in most areas of the globe under the highest emission scenarios. Heavy rainfall will likely increase in frequency in many regions around the globe, especially in high latitudes, the tropics, and during winter in northern mid-latitudes. Similarly, droughts will likely increase due to changes in rainfall variability and increased evapotranspiration.

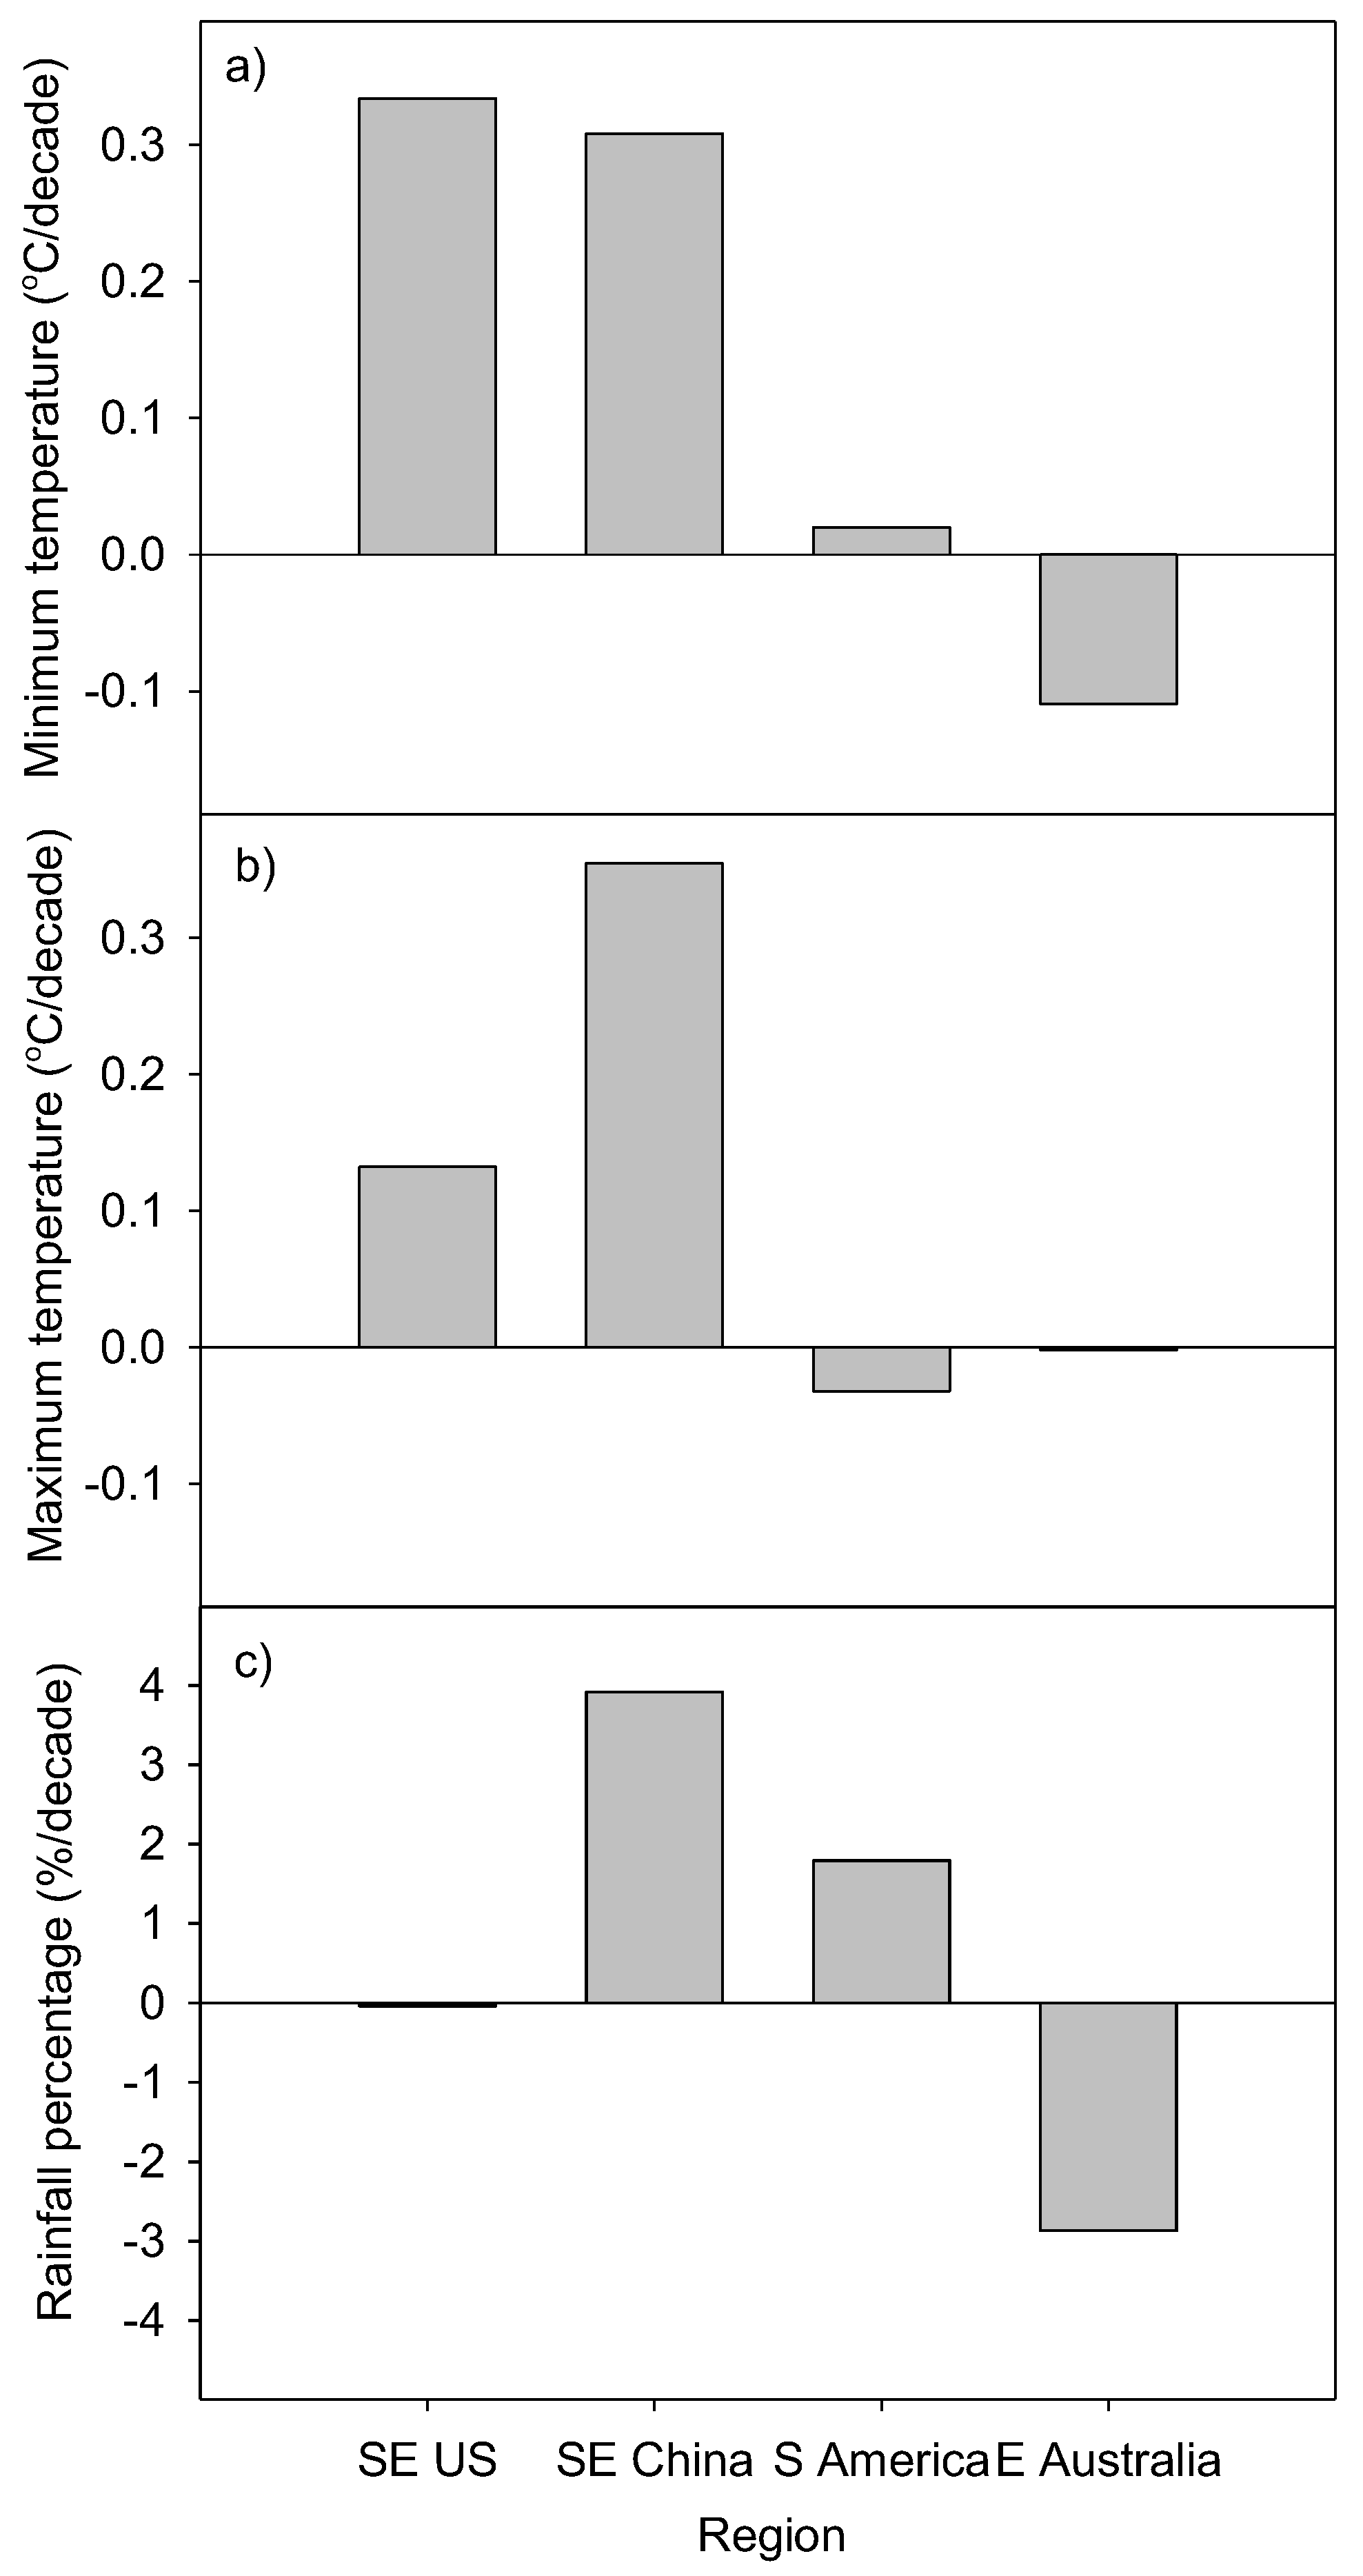
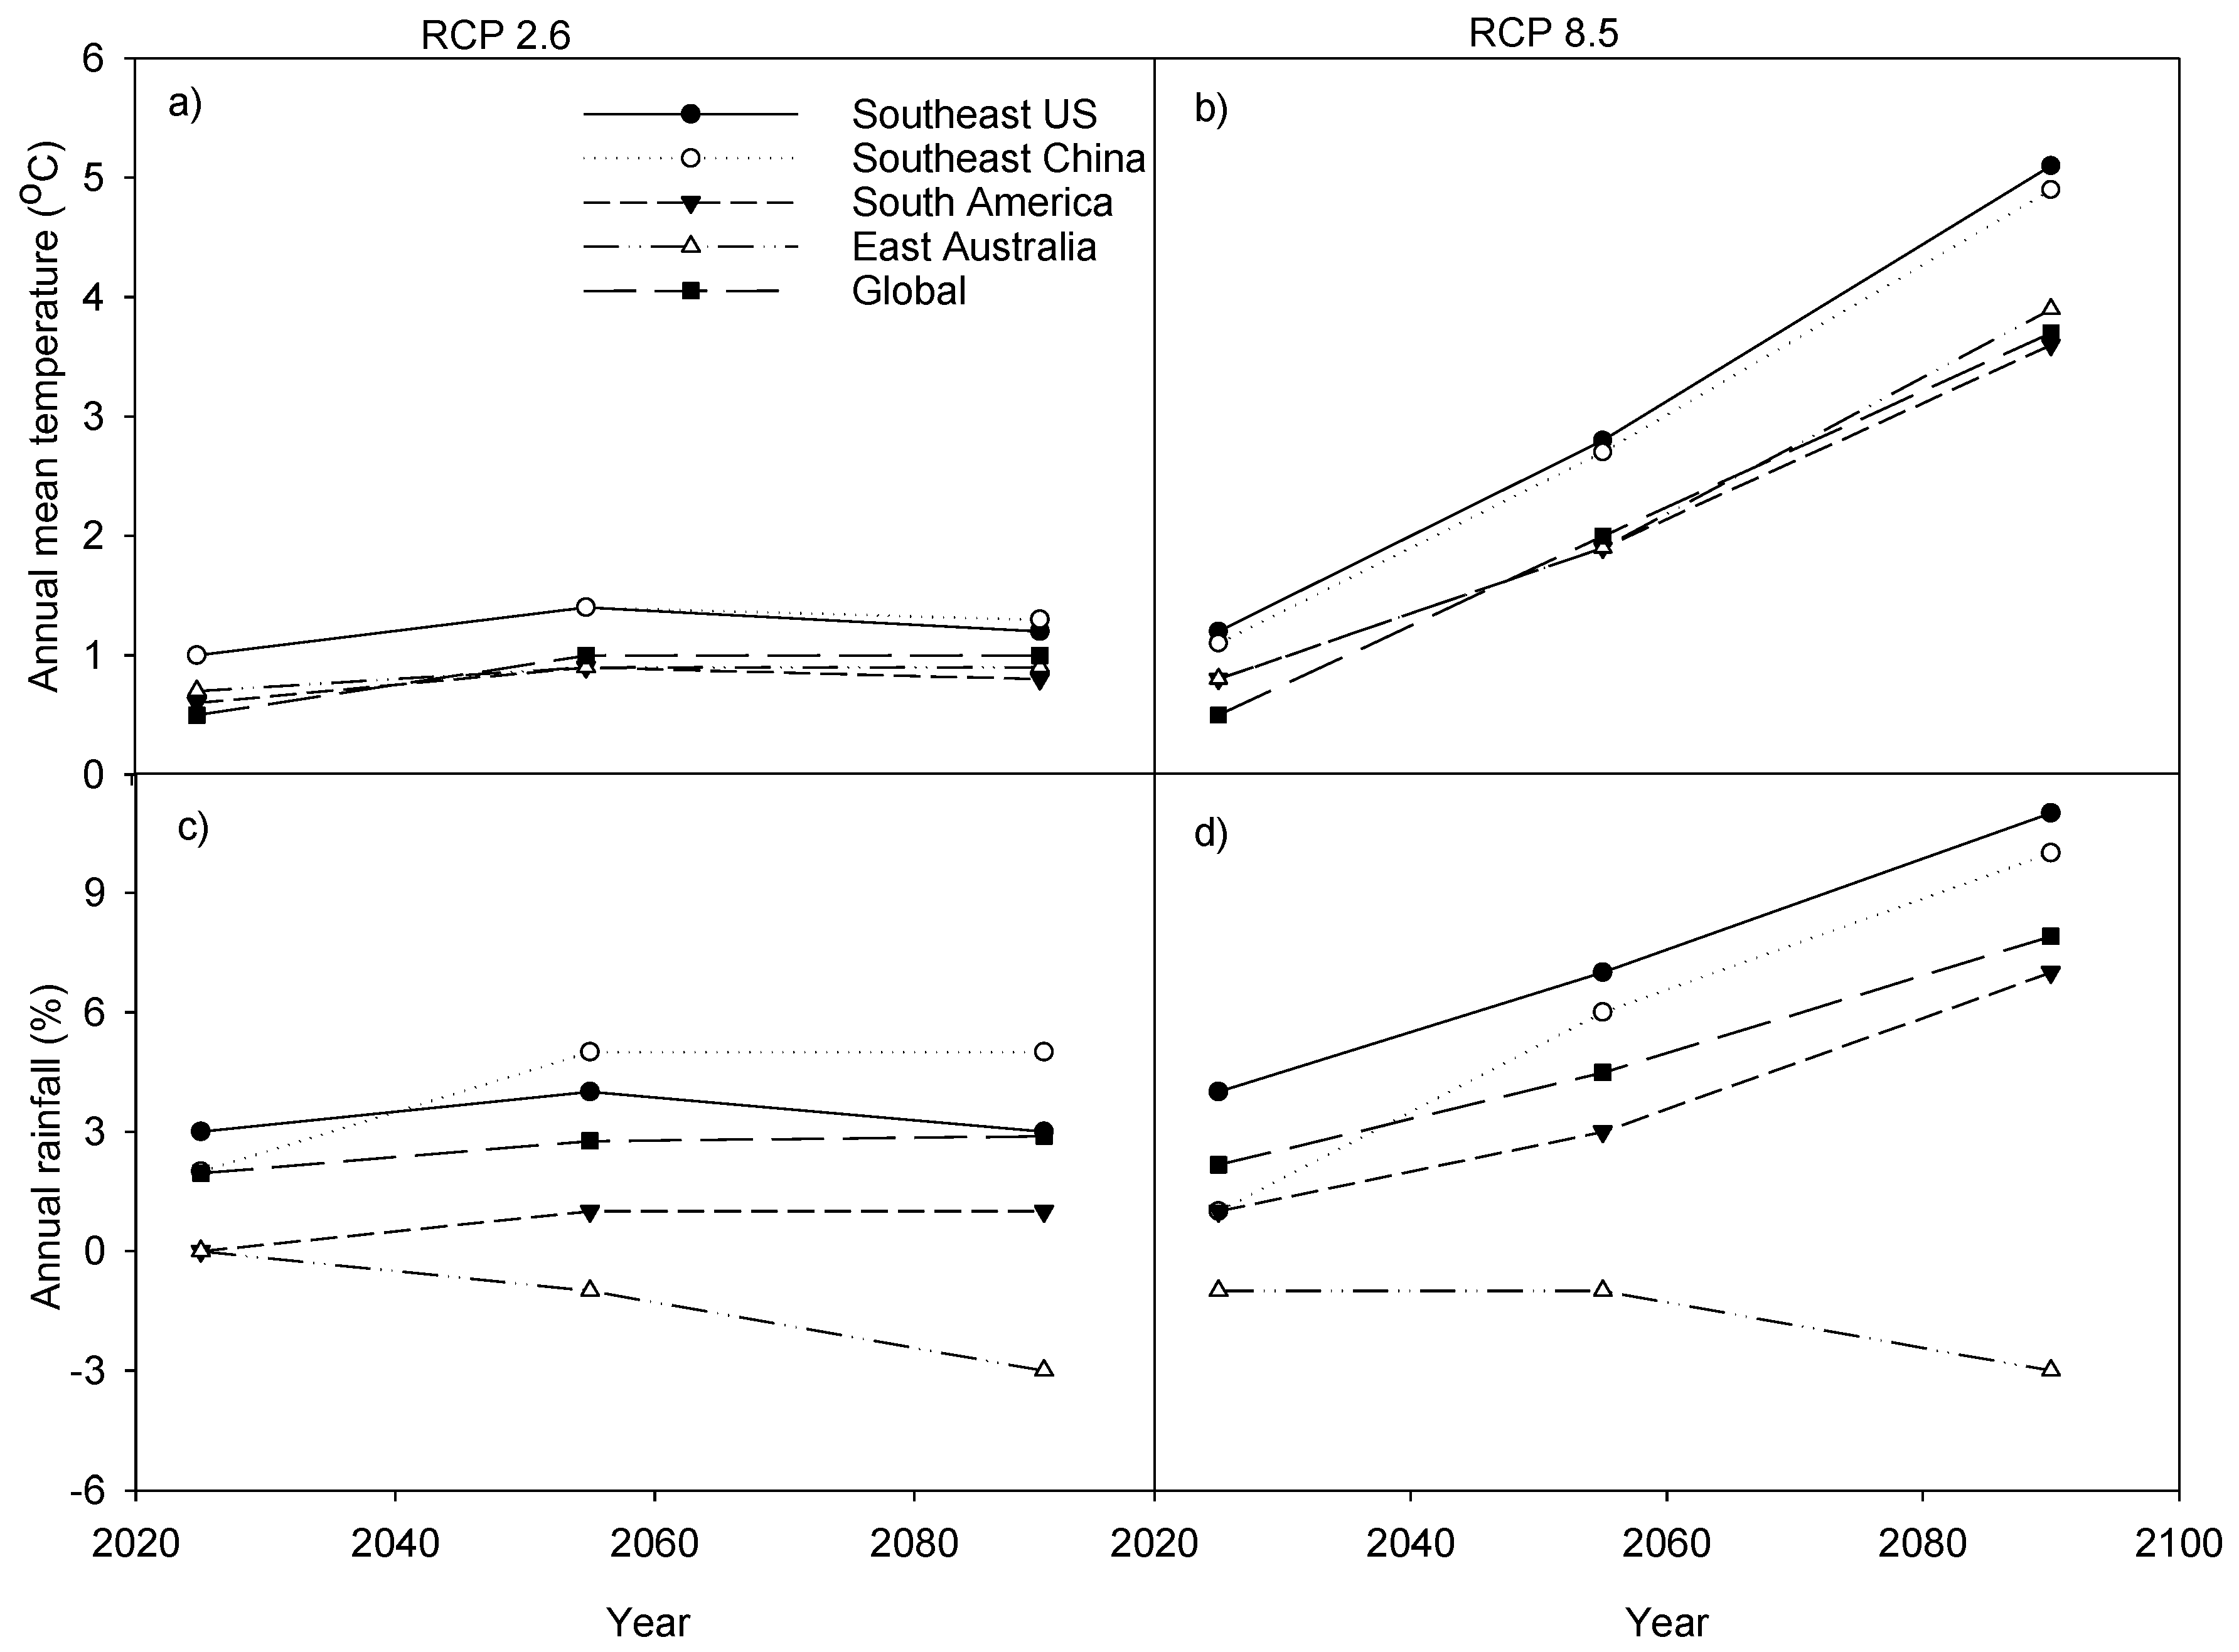
3.2. Regional Trends

Analysis of past trends from 1981 to 2010 in the humid subtropical regions shows an increase in minimum and maximum temperature in most of humid subtropical regions, especially in the Northern Hemisphere (Figure 5a,b). Past studies show cooling trends in minimum and maximum temperature during the 1960s in the southeast U.S. and southeast China, but it has been followed by a steady warming trend since that time [59,60,61,62]. By contrast, the warming trend in the Southern Hemisphere is less, with a cooling trend in minimum temperature (Figure 5a,b) consistent with reports from Messina et al. [63], Suppiah et al. [64], and Della-Marta et al. [65]. Cooling trends in the humid subtropical regions over the past are attributed to high humidity in these regions, caused by increased rainfall, changes in sea surface temperature, and land atmosphere feedback over these regions [66,67].
Rainfall trends are more variable in the humid subtropics, with Southeast China showing a 3.9% increase per decade. In the Southern Hemisphere, east Australia shows a decline of −2.9% of annual rainfall per decade (Figure 5c). Previous research shows diverse rainfall trends over the humid subtropics, which could be related to high temporal and spatial variability over these regions. Zhai et al. [68], reported a rainfall increase in southeast China for the period from 1951 to 2000. In the Southern Hemisphere, Villalba et al. [69] and Messina [63] reported increases in rainfall over the Pampas region during the 20th century. Gallant et al. [70] also observed a decrease in rainfall in east Australia, which has shown a decrease in total annual rainfall since 1950. In contrast, Ingram et al. [59] and Walthall et al. [61] reported an overall increasing trend in rainfall for the 20th century in the southeast U.S., and Hughes [71] reported an increase in rainfall for Queensland, Australia by approximately 15% during the last century. Although humid subtropical regions share a similar climate, the different magnitude in changes could be due to the different climate drivers in each region. Past trends suggest that humid subtropical regions in the Northern Hemisphere are more prone to increased temperature than the ones in the Southern Hemisphere, whereas rainfall is highly variable in all regions, with no general patterns.
Concerning the future, regional RCP 2.6 and 8.5 for the humid subtropical regions show a generalized warming trend in annual mean temperature (Figure 6a). In general, the Northern Hemisphere shows more pronounced warming trends than the humid subtropical regions in the Southern Hemisphere, as well as the global average, suggesting these Northern regions are more susceptible to climatic changes occurring in the future (Figure 6a,b). Future rainfall scenarios are variable, with most of the humid subtropical regions showing a generalized increase in rainfall for both RCPs, except for east Australia, which shows between −1% and −3% rainfall declines for the same time period (Figure 6c,d). Similar to temperature trends, humid subtropical regions in the Northern Hemisphere show higher increases in rainfall than their counterparts in the Southern Hemisphere, which are also higher than the global average. These trends suggest that increases in mean temperature are also accompanied by increases in rainfall in humid subtropical regions around the globe.

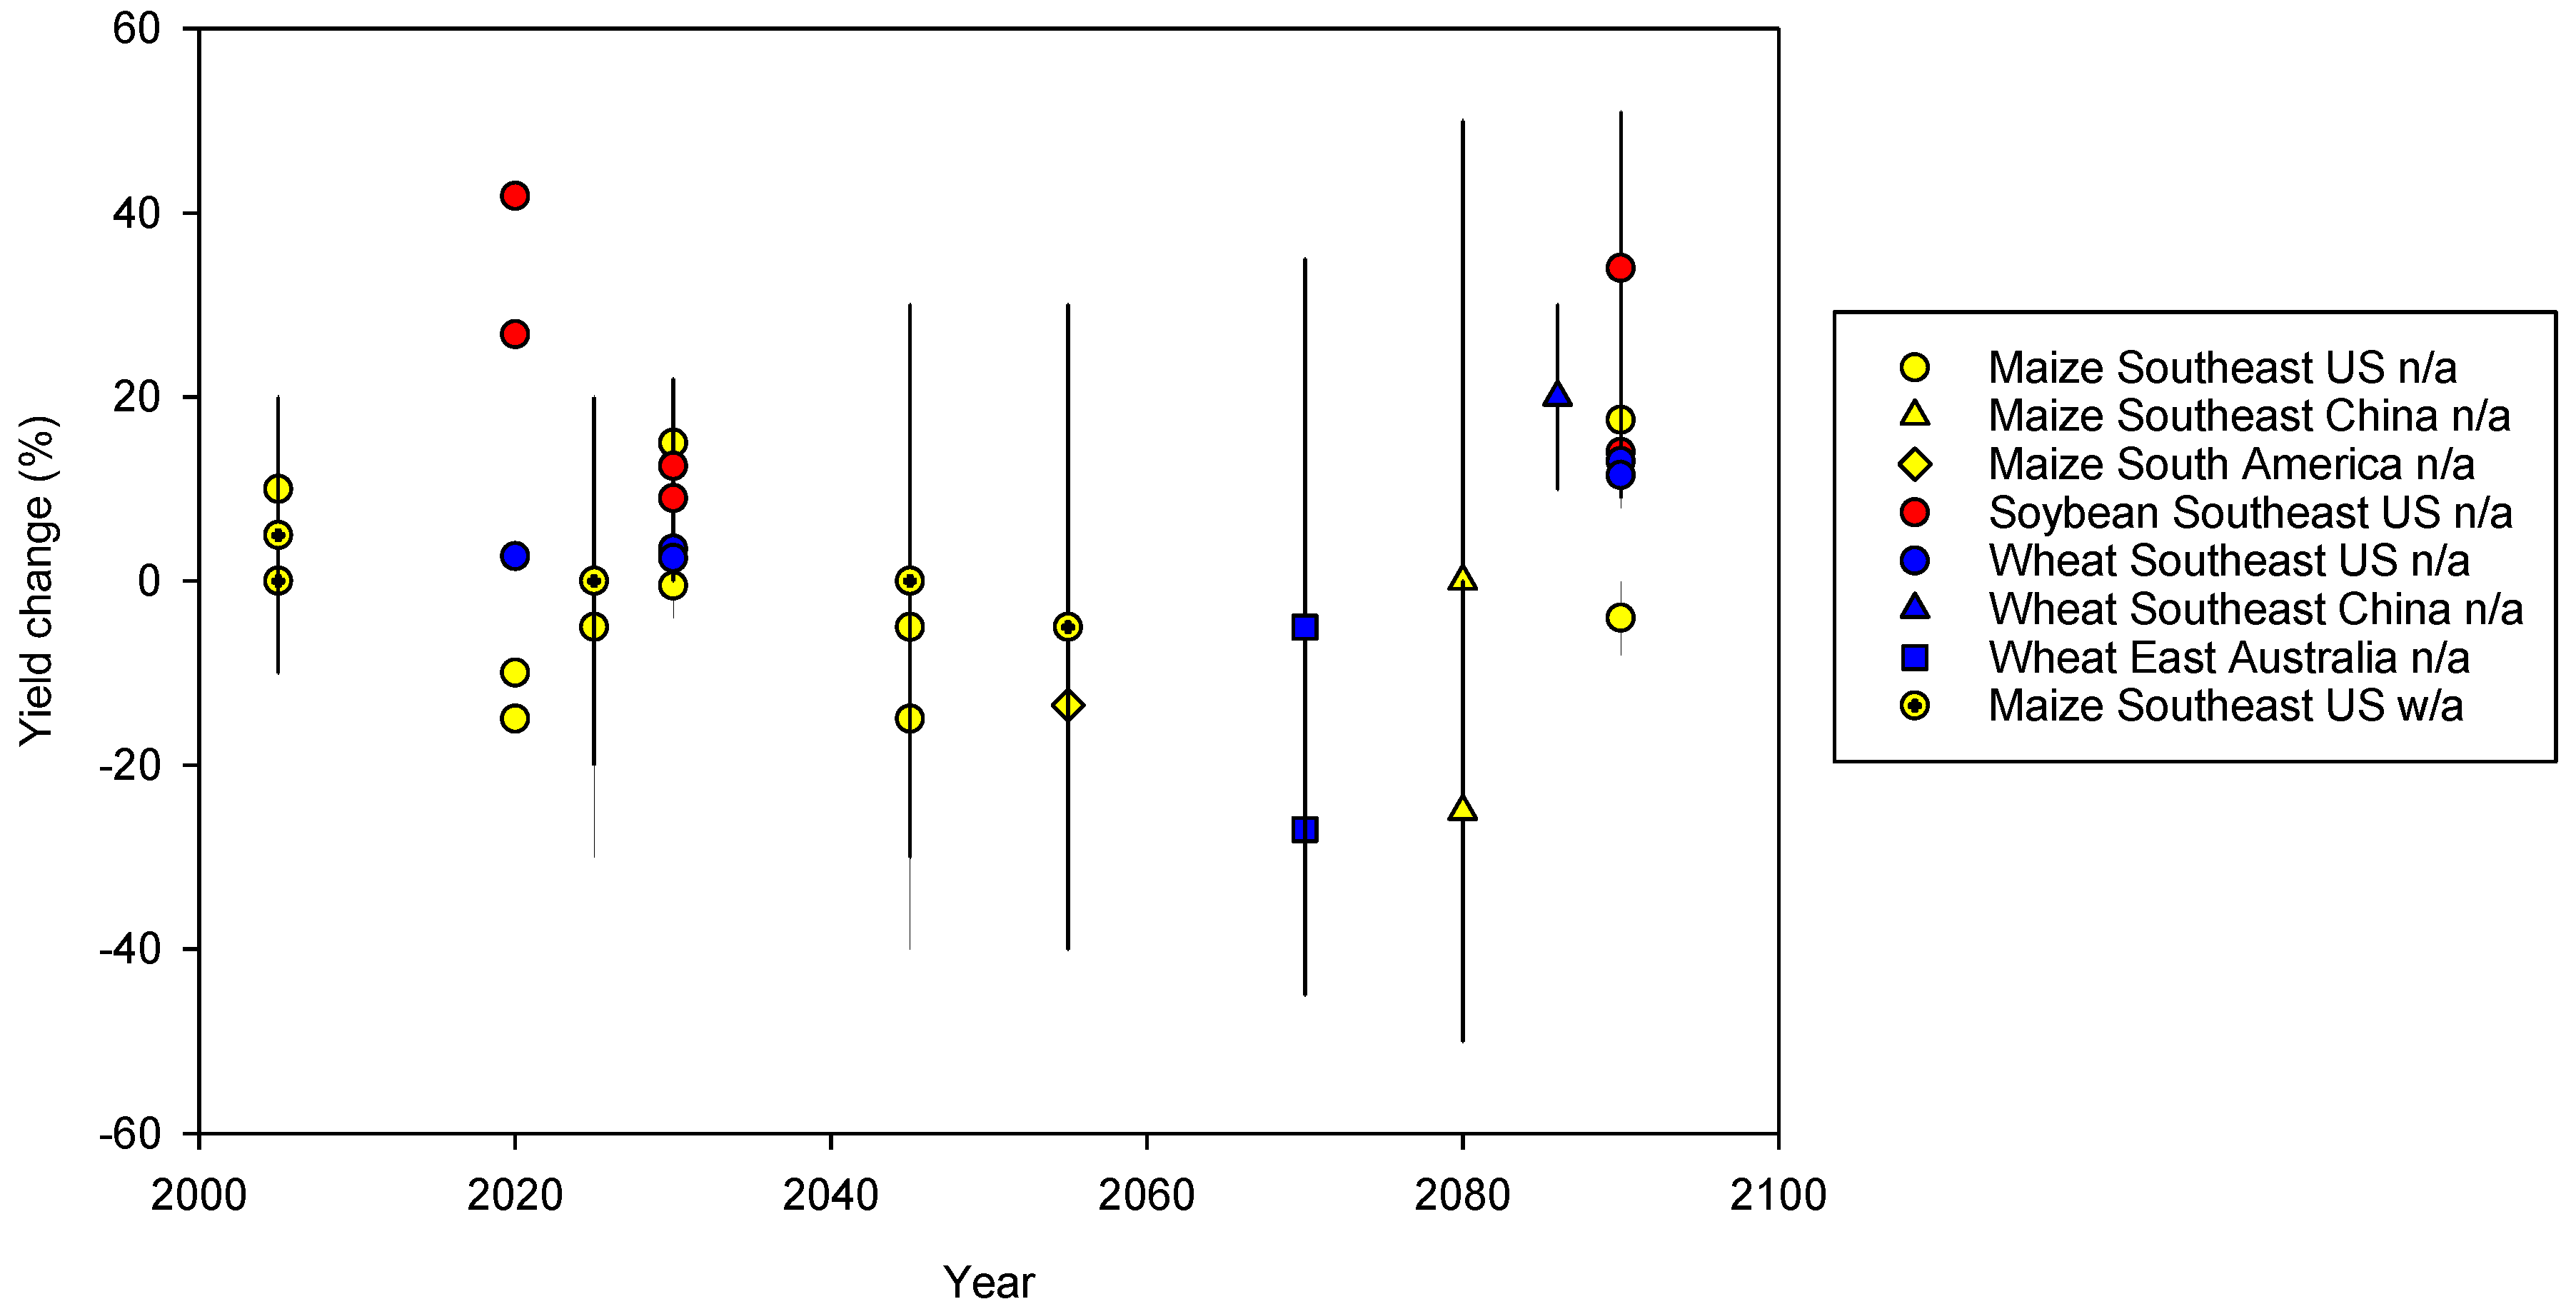
3.3. Regional Climate Change Impact Studies

Many global climate change impact studies in crop production have been conducted in previous years; however, climate change assessments for the humid subtropical regions are rather limited (Table 3 and Figure 7). Since 1990, most of the studies were performed in the southeast U.S., and only a few studies are available for the other main humid subtropical regions (Table 3). The projected increase in mean temperature in these studies varied from 0.2 to 6.3 °C (Table 3 and Figure 7). Projected rainfall changes varied from a decrease of −1% to increases of 50% (Table 3). Because the climate change scenarios have a wide range of variation, simulated crop yield responses have also varied widely. Wheat yields were projected to not change or increase by 17% by mid-century, and up to 30% by the end of the century in some regions—except for east Australia, where a potential −45% yield decline was projected (Table 3). Similarly, soybean yields were projected to increase by up to 42% at mid-century and 51% at the end of the century (Table 3 and Figure 7). Maize production in some of these studies was projected to be negatively affected by climate change, regardless of adaptation, with up to −40% yield decline by mid-century and −50% by the end of century (Table 3 and Figure 7). However, some studies showed a potential maize yield increase up to 30% by 2050 and up to 50% by 2100 (Table 3 and Figure 7).
The large range in projected crop responses under future climate change in the literature for the humid subtropical regions makes it difficult to prepare for adaptation strategies. A main reason for this large range of projected crop response is model uncertainty, as a result of different models, different assumptions, and different crop and climate models and scenarios. Most of the previous studies relied on different global climate models (GCM) and one crop simulation model for climate change assessments. The crop models often differed in structure and parameter values, depending on the region where they were developed.

3.4. Adaptation to Climate Change

Most of the climate change impact studies for the humid subtropical regions lack any adaptation measures, due to mostly simulated positive impacts on crop yields. However, adaptations were recommended to reduce some of the negative impacts for maize production in the humid subtropical regions, which some studies suggest may decline due to climate change (Table 3 and Figure 7). Particularly, technology changes related to crop breeding for heat and drought stress tolerant cultivars showed the potential to diminish negative climate change effects. Other suggested adaptations in crop management practices include earlier sowing to avoid summer heat stress during crop reproductive stages, covering crops to preserve soil water by reducing surface runoff, and promoting infiltration in soil, crop diversification, and irrigation and fertilizer applications [21,80]. The response of crop production to adaptation is also affected by model uncertainty, and this may incorrectly estimate its impact, limiting the exploration of adaptation alternatives [81]. Therefore, adaptation options in the future should be implemented, taking into account the range of yield responses of climate change impact assessments, rather than focusing on mean yield response. It is also important to focus on local and sub-regional studies, as the magnitude of an impact could vary across a region [2,82].

4. Future Research Needs

4.1. Crop Stress Factors

Dynamic crop simulation models started to be developed in the 1960s, and have evolved in their complexity and potential application [83]. However, in previous studies for humid subtropical regions, some major factors particularly important for climate change impact studies are poorly considered, or not included in the crop simulation models. These factors include crop responses to extreme weather conditions, such as high temperatures stress [84,85,86,87]. Recent improvements have been made for some wheat crop models in simulating temperature [88] and high temperature impacts [89,90]. Such routines should be included in crop simulation models for other crops. Pest and diseases are another important component in crop production, and can have large impacts on crop yields, but usually they are not included in crop simulation models [91,92]. A major difficulty of integrating crop and pest and disease models is their different spatial and temporal scales of operation [93]. Additionally, field research is limited on how pests and diseases and crop interactions may vary in a wide range of environments [94,95]. Donatelli et al. [94] proposed a framework to improve the availability and quality of data for pest and disease model improvement and validation, which may be used as a tool to complement crop model simulations. Future climate change impact studies in the humid subtropical region will also need to include the impact of frost [96,97] and excess water [98,99,100], as climate change projections show changes in minimum temperatures and excess water, due to changes in rainfall intensity.

4.2. Multi-Model Ensembles

All climate change impact studies in the humid subtropical regions were conducted by using single crop simulation models. Recent crop model inter-comparisons have shown that these models include uncertainties from their structure and parameterization, which are not quantifiable when executed as a single model. Therefore, future climate change impact studies in the humid subtropical regions should quantify uncertainties through the use of crop model ensembles, to allow a broader understanding of the climate change impacts on crop production [101,102]. Multi-model ensembles have been shown to significantly improve crop model simulations when comparing with field measurements under a diversity of environments [86,102,103,104,105,106,107].

4.3. Consistency in Methodology

Throughout the last few decades, many assessments have been conducted on the effects of climate change on crop production. However, the approach in methodology has been diverse, resulting in a wide range of model responses. In this study, we showed the diverse range of results for the climate change impacts on crop yields in the humid subtropical regions. Using standardized protocols for baseline periods, climate data sources, future scenarios, choice of GCMs, and crop models and data analysis, as suggested in the Agricultural Model Intercomparison and Improvement Project (AgMIP) [108] for the humid subtropical regions, will be critical to understand climate change impacts in these regions, prepare for adaptations, and to allow comparisons with other climate regions important for agricultural production in the world [109,110].

5. Conclusions

While the climate has been changing already, future scenarios project continuous warming, with rainfall increases and decreases in some of the humid subtropical regions. Limited climate change impact assessments in the humid subtropical regions suggest mostly positive effects on wheat and soybean yields. However, maize production will be mostly negatively affected, even when considering the use of some adaptation strategies. Yet, estimated impacts are highly variable, mostly due to uncoordinated studies varying widely in their approaches. Uncertainties in the impact studies are large, due to missing critical impact routines in crop models used in the humid subtropical regions, including routines for heat stress, excess water, and frost impacts. Future impact assessments in the humid subtropical regions must also include pest and disease impacts, which might also change with climate change. Considering these factors in a coordinated, multi-model ensemble approach as outlined in the AgMIP project [108] will be critical to better understanding future climate change impacts, in order to prepare for adaptations in the humid subtropical regions.

Conflicts of Interest

The authors declare no conflict of interest.

References

  1. Godfray, H.C.; Beddington, J.R.; Crute, I.R.; Haddad, L.; Lawrence, D.; Muir, J.F.; Pretty, J.; Robinson, S.; Thomas, S.M.; Toulmin, C. Food security: The challenge of feeding 9 billion people. Science 2010, 327, 812–818. [Google Scholar] [CrossRef] [PubMed]
  2. Parry, M.; Rosenzweig, C.; Iglesias, A.; Fischer, G.; Livermore, M. Climate change and world food security: A new assessment. Glob. Environ. Chang. 1999, 9, S51–S67. [Google Scholar] [CrossRef]
  3. Fanzo, J.; Hunter, D.; Borelli, T.; Mattei, F. Diversifying Food and Diets; Biodiversity International: Oxford, UK, 2013. [Google Scholar]
  4. Cassman, K.G.; Harwood, R.R. The nature of agricultural systems-food security and environmental balance. Food Policy 1995, 20, 439–454. [Google Scholar] [CrossRef]
  5. Fan, M.; Shen, J.; Yuan, L.; Jiang, R.; Chen, X.; Davies, W.J.; Zhang, F. Improving crop productivity and resource use efficiency to ensure food security and environmental quality in China. J. Exp. Bot. 2012, 63, 13–24. [Google Scholar] [CrossRef] [PubMed]
  6. Lobell, D.B.; Burke, M.B.; Tebaldi, C.; Mastrandrea, M.D.; Falcon, W.P.; Naylor, R.L. Prioritizing climate change adaptation needs for food security in 2030. Science 2008, 319, 607–610. [Google Scholar] [CrossRef] [PubMed]
  7. Nelson, G.C.; Rosegrant, M.W.; Koo, J.W.; Robertson, R.; Sulser, T.; Zhu, T.J.; Ringler, C.; Msangi, S.; Palazzo, A.; Batka, M.; et al. Climate Change: Impact on Agriculture and Costs of Adaptation; International Food Policy Research Institute: Washington, DC, USA, 2009; p. 30. [Google Scholar]
  8. Parry, M.L.; Canziani, O.F.; Palutikof, J.P.; van der Linden, P.J.; Hanson, C.E. Climate Change 2007: Impacts, Adaptation and Vulnerability. Contribution of Working Group II to the Fourth Assessment Report of the Intergovernmental Panel on Climate Change; Summary for Policymakers; Cambridge University Press: Cambridge, UK, 2007; p. 22. [Google Scholar]
  9. Intergovernmental Panel on Climate Change (IPCC). Climate Change 2013: The Physical Science Basis. Contribution of Working Group I to the Fifth Assessment Report of the Intergovernmental Panel on Climate Change; Stocker, T.F., Qin, D., Plattner, G.K., Tignor, M., Allen, S.K., Boschung, J., Nauels, A., Xia, Y., Bex, V., Midgley, P.M., Eds.; Cambridge University Press: Cambridge, UK; New York, NY, USA, 2013. [Google Scholar]
  10. NOAA. Trends in Atmospheric Carbon Dioxide. Available online: http://www.esrl.noaa.gov/gmd/ccgg/trends/ (accessed on 17 March 2016).
  11. Dore, M.H.I. Climate change and changes in global precipitation patterns: What do we know? Environ. Int. 2005, 31, 1167–1181. [Google Scholar] [CrossRef] [PubMed]
  12. Trenberth, K.E. Changes in precipitation with climate change. Clim. Res. 2011, 47, 123–138. [Google Scholar] [CrossRef]
  13. IPCC. Managing the Risks of Extreme Events and Disasters to Advance Climate Change Adaptation. A Special Report of Working Groups I and II of the Intergovernmental Panel on Climate Change; Field, C.B., Barros, V., Stocker, T.F., Qin, D., Dokken, D.J., Ebi, K.L., Mastrandrea, M.D., Mach, K.J., Plattner, G.K., Allen, S.K., et al., Eds.; Cambridge University Press: Cambridge, UK; New York, NY, USA, 2012; p. 582. [Google Scholar]
  14. Djanaguiraman, M.; Prasad, P.V.V.; Boyle, D.L.; Schapaugh, W.T. Soybean pollen anatomy, viability and pod set under high temperature stress. J. Agron. Crop Sci. 2013, 199, 171–177. [Google Scholar] [CrossRef]
  15. Herrero, M.P.; Johnson, R.R. High-temperature stress and pollen viability of maize. Crop Sci. 1980, 20, 796–800. [Google Scholar] [CrossRef]
  16. Wardlaw, I.F.; Moncur, L. The response of wheat to high-temperature following anthesis I. The rate and duration of kernell filling. Aust. J. Plant Physiol. 1995, 22, 391–397. [Google Scholar] [CrossRef]
  17. Wilhelm, E.P.; Mullen, R.E.; Keeling, P.L.; Singletary, G.W. Heat stress during grain filling in maize: Effects on kernel growth and metabolism. Crop Sci. 1999, 39, 1733–1741. [Google Scholar] [CrossRef]
  18. Hall, A.J.; Lemcoff, J.H.; Trapani, N. Water-stress before and during flowering in maize and its effects on yield, its components, and their determinants. Maydica 1981, 26, 19–38. [Google Scholar]
  19. Siddique, M.R.B.; Hamid, A.; Islam, M.S. Drought stress effects on water relations of wheat. Bot. Bull. Acad. Sin. 2000, 41, 35–39. [Google Scholar]
  20. Sionit, N.; Kramer, P.J. Effect of water stress during different stages of growth of soybean. Agron. J. 1977, 69, 274–278. [Google Scholar] [CrossRef]
  21. Alexandrov, V.A.; Hoogenboom, G. Vulnerability and adaptation assessments of agricultural crops under climate change in the Southeastern U.S.A. Theor. Appl. Climatol. 2000, 67, 45–63. [Google Scholar] [CrossRef]
  22. U.S.DA. Census of Agriculture. Available online: http://www.agcensus.usda.gov/Publications/2012/ (accessed on 23 March 2016).
  23. NBSC. China Statistical Yearbook; National Bureau of Statistics of China: Beijing, China. Available online: http://www.stats.gov.cn/tjsj/ndsj/2014/indexeh.htm (accessed on 15 November 2014).
  24. MGAPU. Anuario Estadistico Agropecuario 2014; Ministerio de Ganaderia, Agricultura y Pesca de Uruguay: Montevideo, Uruguay, 2014; p. 243. [Google Scholar]
  25. BIGS. Systematic Survey of Agricultural Production. Available online: http://ibge.gov.br/english/estatistica/indicadores/agropecuaria/lspa/default.shtm (accessed on 15 November 2014).
  26. M'Gee, D. Soybeans in the Australian and Global Market 2011; Soy Australia Ltd., Australian Soybeans: Sydney, Australia, 2011; p. 22. [Google Scholar]
  27. ABS. Year Book Australia 2009–2010. Available online: http://www.abs.gov.au/ausstats/[email protected]/0/EB2DDFE1DCA0FC79CA25773700169CB9?opendocument (accessed on 16 March 2015).
  28. Hungria, M.; Franchini, J.C.; Campo, R.J.; Graham, P.H. The importance of nitrogen fixation to soybean cropping in South America. In Nitrogen Fixation in Agriculture; Springer: Dordrecht, The Netherlands, 2005; pp. 25–42. [Google Scholar]
  29. Wani, S.P.; Rockstrom, J.; Oweis, T. Rainfed Agriculture: Unlocking the Potential; CABI: Oxfordshire, UK, 2009; Volume 7. [Google Scholar]
  30. Kottek, M.; Grieser, J.; Beck, C.; Rudolf, B.; Rubel, F. World map of the Koppen-Geiger climate classification updated. Meteorol. Z. 2006, 15, 259–263. [Google Scholar] [CrossRef]
  31. FAO. Legacy Soil Maps and Soils Databases. Available online: http://www.fao.org/soils-portal/soil-survey/soil-maps-and-databases/en/ (accessed on 18 March 2016).
  32. United States Department of Agriculture (USDA). Crop Production 2014 Summary; USDA: Washington, DC, USA, 2015; p. 99.
  33. Schnepf, R.D.; Dohlman, E.N.; Bolling, C. Agriculture in Brazil and Argentina: Developments and Prospects for Major Field Crops; United States Department of Agriculture: Washington, DC, USA, 2001; p. 77.
  34. Grimm, A.M.; Barros, V.R.; Doyle, M.E. Climate variability in southern South America associated with El Nino and la Nina events. J. Clim. 2000, 13, 35–58. [Google Scholar] [CrossRef]
  35. Konrad, C.E., II; Fuhrmann, C.M.; Billiot, A.; Keim, B.D.; Kruk, M.C.; Kunkel, K.E.; Needham, H.; Shafer, M.; Stevens, L. Climate of the Southeast U.S.A: Past, present, and future. In Climate of the Southeast United States: Variability, Impacts and Vulnerability; Ingram, K.T., Dow, K., Carter, L., Anderson, J., Eds.; Island Press: Washington, DC, USA, 2013. [Google Scholar]
  36. Qian, W.; Kang, H.S.; Lee, D.K. Distribution of seasonal rainfall in the East Asian monsoon region. Theor. Appl. Climatol. 2002, 73, 151–168. [Google Scholar] [CrossRef]
  37. Che, H.Z.; Shi, G.Y.; Zhang, X.Y.; Arimoto, R.; Zhao, J.Q.; Xu, L.; Wang, B.; Chen, Z.H. Analysis of 40 years of solar radiation data from China, 1961–2000. Geophys. Res. Lett. 2005, 32, 5. [Google Scholar] [CrossRef]
  38. Qian, Y.; Wang, W.; Leung, L.R.; Kaiser, D.P. Variability of solar radiation under cloud-free skies in China: The role of aerosols. Geophys. Res. Lett. 2007, 34, 2111–2121. [Google Scholar] [CrossRef]
  39. NASA. AgMIP Climate Forcing Datasets: AgMERRA Climate Forcing Dataset for Agricultural Modeling. Available online: https://data.giss.nasa.gov/impacts/agmipcf/agmerra/ (accessed on 27 July 2016).
  40. Ropelewski, C.F.; Halpert, M.S. North-American precipitation and temperature patterns associated with the El Nino Souththern Oscillation (ENSO). Mon. Weather Rev. 1986, 114, 2352–2362. [Google Scholar] [CrossRef]
  41. Garreaud, R.D.; Vuille, M.; Compagnucci, R.; Marengo, J. Present-day South American climate. Palaeogeogr. Palaeoclimatol. Palaeoecol. 2009, 281, 180–195. [Google Scholar] [CrossRef]
  42. Zhou, L.T.; Tam, C.Y.; Zhou, W.; Chan, J.C.L. Influence of South China Sea SST and the ENSO on winter rainfall over South China. Adv. Atmos. Sci. 2010, 27, 832–844. [Google Scholar] [CrossRef]
  43. Murphy, B.F.; Timbal, B. A review of recent climate variability and climate change in Southeastern Australia. Int. J. Climatol. 2008, 28, 859–879. [Google Scholar] [CrossRef]
  44. Gao, X.J.; Xu, Y.; Zhao, Z.C.; Pal, J.S.; Giorgi, F. On the role of resolution and topography in the simulation of East Asia precipitation. Theor. Appl. Climatol. 2006, 86, 173–185. [Google Scholar] [CrossRef]
  45. Lau, K.M.; Yang, S. Climatology and interannual variability of the Southeast Asian summer monsoon. Adv. Atmos. Sci. 1997, 14, 141–162. [Google Scholar] [CrossRef]
  46. Garreaud, R.D. Cold air incursions over subtropical South America: Mean structure and dynamics. Mon. Weather Rev. 2000, 128, 2544–2559. [Google Scholar] [CrossRef]
  47. Jones, D.A. Characteristics of Australian land surface temperature variability. Theor. Appl. Climatol. 1999, 63, 11–31. [Google Scholar] [CrossRef]
  48. Risbey, J.S.; Pook, M.J.; McIntosh, P.C.; Wheeler, M.C.; Hendon, H.H. On the remote drivers of rainfall variability in Australia. Mon. Weather Rev. 2009, 137, 3233–3253. [Google Scholar] [CrossRef]
  49. Verdon, D.C.; Wyatt, A.M.; Kiem, A.S.; Franks, S.W. Multidecadal variability of rainfall and streamflow: Eastern Australia. Water Resour. Res. 2004, 40, 333–341. [Google Scholar] [CrossRef]
  50. Whalen, J.K.; Sampedro, L. Soil Ecology and Management; CABI: Cambridge, UK, 2010; pp. 6–26. [Google Scholar]
  51. NRCS. The Twelve Orders of Soil Taxonomy. Available online: http://www.nrcs.usda.gov/wps/portal/nrcs/detail/soils/edu/?cid=nrcs142p2_053588 (accessed on 23 March 2016).
  52. Zhang, M.K.; He, Z.L. Long-term changes in organic carbon and nutrients of an Ultisol under rice cropping in Southeast China. Geoderma 2004, 118, 167–179. [Google Scholar] [CrossRef]
  53. Huang, S.; Zhang, W.; Yu, X.; Huang, Q. Effects of long-term fertilization on corn productivity and its sustainability in an Ultisol of Southern China. Agric. Ecosyst. Environ. 2010, 138, 44–50. [Google Scholar] [CrossRef]
  54. Liu, X.; Burras, C.L.; Kravchenko, Y.S.; Duran, A.; Huffman, T.; Morras, H.; Studdert, G.; Zhang, X.; Cruse, R.M.; Yuan, X. Overview of Mollisols in the world: Distribution, land use and management. Can. J. Soil Sci. 2012, 92, 383–402. [Google Scholar] [CrossRef]
  55. Duran, A.; Morras, H.; Studdert, G.; Liu, X. Distribution, properties, land use and management of Mollisols in South America. Chin. Geogr. Sci. 2011, 21, 511–530. [Google Scholar] [CrossRef]
  56. Fabrizzi, K.P.; Moron, A.; Garcia, F.O. Soil carbon and nitrogen organic fractions in degraded vs. non-degraded Mollisols in Argentina. Soil Sci. Soc. Am. J. 2003, 67, 1831–1841. [Google Scholar] [CrossRef]
  57. Seneviratne, S.I.; Nicholls, N.; Easterling, D.; Goodess, C.M.; Kanae, S.; Kossin, J.; Luo, Y.; Marengo, J.; McInnes, K.; Rahimi, M.; et al. Changes in climate extremes and their impacts on the natural physical environment. A special report of working groups I and II of the Intergovernmental Panel on Climate Change (IPCC). In Managing the Risks of Extreme Events and Disasters to Advance Climate Change Adaptation; Field, C.B., Barros, V., Stocker, T.F., Qin, D., Dokken, D.J., Ebi, K.L., Mastrandrea, M.D., Mach, K.J., Plattner, G.K., Allen, S.K., et al., Eds.; Cambridge University Press: Cambridge, UK; New York, NY, USA, 2012; pp. 109–230. [Google Scholar]
  58. IPCC. Annex II: Climate System Scenario Tables. In Climate Change 2013: The Physical Science Basis. Contribution of Working Group I to the Fifth Assessment Report of the Intergovernmental Panel on Climate Change; Prather, M., Flato, G., Friedlingstein, P., Jones, C., Lamarque, J.F., Liao, H., Rasch, P., Eds.; Cambridge University Press: Cambridge, UK; New York, NY, USA, 2013; p. 1427. [Google Scholar]
  59. Ingram, K.K.; Dow, L.; Carter, J.; Anderson, J. Climate of the Southeast of the United States: Variability, Change, Impacts, and Vulnerability; NCA Regional Input Reports: Washington, DC, USA, 2013; p. 358. [Google Scholar]
  60. Easterling, D.R.; Horton, B.; Jones, P.D.; Peterson, T.C.; Karl, T.R.; Parker, D.E.; Salinger, M.J.; Razuvayev, V.; Plummer, N.; Jamason, P.; et al. Maximum and minimum temperature trends for the globe. Science 1997, 277, 364–367. [Google Scholar] [CrossRef]
  61. Walthall, C.L.; Hatfield, J.; Backlund, P.; Lengnick, L.; Marshall, E.; Walsh, M.; Adkins, S.; Aillery, M.; Ainsworth, E.A.; Ammann, C.; et al. Climate Change and Agriculture in the United States: Effects and Adaptation; U.S.DA Technical Bulletin 1935; U.S.DA: Washington, DC, USA, 2012; p. 186.
  62. Liu, Y.; Li, X.; Zhang, Q.; Guo, Y.; Gao, G.; Wang, J. Simulation of regional temperature and precipitation in the past 50 years and the next 30 years over China. Quat. Int. 2010, 212, 57–63. [Google Scholar] [CrossRef]
  63. Messina, C.D.; Hansen, J.W.; Hall, A.J. Land allocation conditioned on El Nino Southern Oscillation phases in the Pampas of Argentina. Agric. Syst. 1999, 60, 197–212. [Google Scholar] [CrossRef]
  64. Suppiah, R.; Collins, D.; Della-Marta, P. Observed Changes in Australian Climate; NSW Government: Melbourne, Australia, 2001.
  65. Della-Marta, P.; Collins, D.; Braganza, K. Updating Australia's high-quality annual temperature dataset. Aust. Meteorol. Mag. 2004, 53, 75–93. [Google Scholar]
  66. Portmann, R.W.; Solomon, S.; Hegerl, G.C. Spatial and seasonal patterns in climate change, temperatures, and precipitation across the United States. Proc. Natl. Acad. Sci. USA 2009, 106, 7324–7329. [Google Scholar] [CrossRef] [PubMed]
  67. Nicholls, N.; Della-Marta, P. 20th century changes in temperature and rainfall in New South Wales. Aust. Meteorol. Mag. 2004, 53, 263–268. [Google Scholar]
  68. Zhai, P.M.; Zhang, X.B.; Wan, H.; Pan, X.H. Trends in total precipitation and frequency of daily precipitation extremes over China. J. Clim. 2005, 18, 1096–1108. [Google Scholar] [CrossRef]
  69. Villalba, R.; Grau, H.R.; Boninsegna, J.A.; Jacoby, G.C.; Ripalta, A. Tree-ring evidence for long-term precipitation changes in subtropical South America. Int. J. Climatol. 1998, 18, 1463–1478. [Google Scholar] [CrossRef]
  70. Gallant, A.J.E.; Hennessy, K.J.; Risbey, J. Trends in rainfall indices for six Australian regions: 1910–2005. Aust. Meteorol. Mag. 2007, 56, 223–239. [Google Scholar]
  71. Hughes, L. Climate change and Australia: Trends, projections and impacts. Austral Ecol. 2003, 28, 423–443. [Google Scholar] [CrossRef]
  72. Chhetri, N.B.; Easterling, W.E.; Terando, A.; Mearns, L. Modeling path dependence in agricultural adaptation to climate variability and change. Ann. Assoc. Am. Geogr. 2010, 100, 894–907. [Google Scholar] [CrossRef]
  73. Easterling, W.E.; Chhetri, N.; Niu, X.Z. Improving the realism of modeling agronomic adaptation to climate change: Simulating technological substitution. Clim. Chang. 2003, 60, 149–173. [Google Scholar] [CrossRef]
  74. Hatch, U.; Jagtap, S.; Jones, J.; Lamb, M. Potential effects of climate change on agricultural, water use in the Southeast U.S. J. Am. Water Resour. Assoc. 1999, 35, 1551–1561. [Google Scholar] [CrossRef]
  75. Chavas, D.R.; Izaurralde, R.C.; Thomson, A.M.; Gao, X. Long-term climate change impacts on agricultural productivity in Eastern China. Agric. For. Meteorol. 2009, 149, 1118–1128. [Google Scholar] [CrossRef]
  76. Xiong, W.; Conway, D.; Holman, I.; Lin, E. Evaluation of CERES-Wheat simulation of wheat production in China. Agron. J. 2008, 100, 1720–1728. [Google Scholar] [CrossRef]
  77. Jones, P.G.; Thornton, P.K. The potential impacts of climate change on maize production in Africa and Latin America in 2055. Glob. Environ. Chang. 2003, 13, 51–59. [Google Scholar] [CrossRef]
  78. Anwar, M.R.; O'Leary, G.; McNeil, D.; Hossain, H.; Nelson, R. Climate change impact on rainfed wheat in south-eastern Australia. Field Crop. Res. 2007, 104, 139–147. [Google Scholar] [CrossRef]
  79. Howden, M.; Jones, R.N. Risk assessment of climate change impacts on Australia’s wheat industry. In Proceedings of the 4th International Crop Science Congress, Brisbane, Australia, 26 September–1 October 2004. [Google Scholar]
  80. Lobell, D.B.; Schlenker, W.; Costa-Roberts, J. Climate trends and global crop production since 1980. Science 2011, 333, 616–620. [Google Scholar] [CrossRef] [PubMed]
  81. Challinor, A.J.; Watson, J.; Lobell, D.B.; Howden, S.M.; Smith, D.R.; Chhetri, N. A meta-analysis of crop yield under climate change and adaptation. Nat. Clim. Chang. 2014, 4, 287–291. [Google Scholar] [CrossRef]
  82. Rosenzweig, C.; Parry, M.L. Potential impact of climate change on world food supply. Nature 1994, 367, 133–138. [Google Scholar] [CrossRef]
  83. Boote, K.J.; Jones, J.W.; White, J.W.; Asseng, S.; Lizaso, J.I. Putting mechanisms into crop production models. Plant Cell Environ. 2013, 36, 1658–1672. [Google Scholar] [CrossRef] [PubMed]
  84. Porter, J.R.; Gawith, M. Temperatures and the growth and development of wheat: A review. Eur. J. Agron. 1999, 10, 23–36. [Google Scholar] [CrossRef]
  85. Porter, J.R.; Semenov, M.A. Crop responses to climatic variation. Philos. Trans. R. Soc. B Biol. Sci. 2005, 360, 2021–2035. [Google Scholar] [CrossRef] [PubMed]
  86. Rotter, R.P.; Carter, T.R.; Olesen, J.E.; Porter, J.R. Crop-climate models need an overhaul. Nat. Clim. Chang. 2011, 1, 175–177. [Google Scholar] [CrossRef]
  87. Wheeler, T.R.; Craufurd, P.Q.; Ellis, R.H.; Porter, J.R.; Prasad, P.V.V. Temperature variability and the yield of annual crops. Agric. Ecosyst. Environ. 2000, 82, 159–167. [Google Scholar] [CrossRef]
  88. Wang, E.; Martre, P.; Zhao, Z.G.; Ewert, F.; Maiorano, A.; Rotter, R.P.; Kimball, B.A.; Ottman, M.J.; Wall, G.W.; White, J.W.; et al. The uncertainty of crop yield projections is reduced by improved temperature response functions. Nat. Plants 2017, 3, 17102. [Google Scholar] [CrossRef] [PubMed]
  89. Liu, B.; Liu, L.; Asseng, S.; Zou, X.; Li, J.; Cao, W.; Zhu, Y. Modelling the effects of heat stress on post-heading durations in wheat: A comparison of temperature response routines. Agric. For. Meteorol. 2016, 222, 45–58. [Google Scholar] [CrossRef]
  90. Maiorano, A.; Martre, P.; Asseng, S.; Ewert, F.; Müller, C.; Rötter, R.P.; Ruane, A.C.; Semenov, M.A.; Wallach, D.; Wang, E.; et al. Crop model improvement reduces the uncertainty of the response to temperature of multi-model ensembles. Field Crop. Res. 2017, 202, 5–20. [Google Scholar] [CrossRef]
  91. Oerke, E.C. Crop losses to pests. J. Agric. Sci. 2006, 144, 31–43. [Google Scholar] [CrossRef]
  92. Jones, J.W.; Antle, J.M.; Basso, B.; Boote, K.J.; Conant, R.T.; Foster, I.; Godfray, H.C.J.; Herrero, M.; Howitt, R.E.; Janssen, S.; et al. Toward a new generation of agricultural system data, models, and knowledge products: State of agricultural systems science. Agric. Syst. 2017, 155, 269–288. [Google Scholar] [CrossRef] [PubMed]
  93. Chakraborty, S.; Tiedemann, A.V.; Teng, P.S. Climate change: Potential impact on plant diseases. Environ. Pollut. 2000, 108, 317–326. [Google Scholar] [CrossRef]
  94. Donatelli, M.; Magarey, R.D.; Bregaglio, S.; Willocquet, L.; Whish, J.P.M.; Savary, S. Modelling the impacts of pests and diseases on agricultural systems. Agric. Syst. 2017, 155, 213–224. [Google Scholar] [CrossRef] [PubMed]
  95. Orlandini, S.; Magarey, R.D.; Park, E.W.; Sporleder, M.; Kroschel, J. Methods of Agroclimatology: Modeling Approaches for Pests and Diseases. In Agroclimatology: Linking Agriculture to Climate, Agronomy Monographs 60; Hatfield, J.L., Sivakumar, M.V.K., Prueger, J.H., Eds.; ASA, CSSA, and SSSA Inc.: Madison, WI, USA, 2017. [Google Scholar]
  96. Brisson, N.; Gary, C.; Justes, E.; Roche, R.; Mary, B.; Ripoche, D.; Zimmer, D.; Sierra, J.; Bertuzzi, P.; Burger, P.; et al. An overview of the crop model STICS. Eur. J. Agron. 2003, 18, 309–332. [Google Scholar] [CrossRef]
  97. Bergjord, A.K.; Bonesmo, H.; Skjelvag, A.O. Modelling the course of frost tolerance in winter wheat I. Model development. Eur. J. Agron. 2008, 28, 321–330. [Google Scholar] [CrossRef]
  98. Asseng, S.; Keating, B.; Huth, N.; Eastham, J. Simulation of perched watertables in a duplex soil. In Proceedings of the International Conference on Modelling and Simulation, Hobart, Australia, 3–8 December 2017; pp. 538–543. [Google Scholar]
  99. Raes, D.; Steduto, P.; Hsiao, T.C.; Fereres, E. AquaCrop-The FAO Crop Model to Simulate Yield Response to Water: II. Main Algorithms and Software Description. Agron. J. 2009, 101, 438–447. [Google Scholar] [CrossRef]
  100. Rosenzweig, C.; Tubiello, F.N.; Goldberg, R.; Mills, E.; Bloomfield, J. Increased crop damage in the U.S. from excess precipitation under climate change. Glob. Environ. Chang. 2002, 12, 197–202. [Google Scholar] [CrossRef]
  101. Aggarwal, P.K.; Mall, R.K. Climate change and rice yields in diverse agro-environments of India. II. Effect of uncertainties in scenarios and crop models on impact assessment. Clim. Chang. 2002, 52, 331–343. [Google Scholar] [CrossRef]
  102. Martre, P.; Wallach, D.; Asseng, S.; Ewert, F.; Jones, J.W.; Rotter, R.P.; Boote, K.J.; Ruane, A.C.; Thorburn, P.J.; Cammarano, D.; et al. Multimodel ensembles of wheat growth: Many models are better than one. Glob. Chang. Biol. 2015, 21, 911–925. [Google Scholar] [CrossRef] [PubMed]
  103. Asseng, S.; Ewert, F.; Rosenzweig, C.; Jones, J.W.; Hatfield, J.L.; Ruane, A.C.; Boote, K.J.; Thorburn, P.J.; Rotter, R.P.; Cammarano, D.; et al. Uncertainty in simulating wheat yields under climate change. Nat. Clim. Chang. 2013, 3, 827–832. [Google Scholar] [CrossRef]
  104. Rotter, R.P.; Palosuo, T.; Kersebaum, K.C.; Angulo, C.; Bindi, M.; Ewert, F.; Ferrise, R.; Hlavinka, P.; Moriondo, M.; Nendel, C.; et al. Simulation of spring barley yield in different climatic zones of Northern and Central Europe: A comparison of nine crop models. Field Crop. Res. 2012, 133, 23–36. [Google Scholar] [CrossRef]
  105. Fleisher, D.H.; Condori, B.; Quiroz, R.; Alva, A.; Asseng, S.; Barreda, C.; Bindi, M.; Boote, K.J.; Ferrise, R.; Franke, A.C.; et al. A potato model intercomparison across varying climates and productivity levels. Glob. Chang. Biol. 2017, 23, 1258–1281. [Google Scholar] [CrossRef] [PubMed]
  106. Li, T.; Hasegawa, T.; Yin, X.; Zhu, Y.; Boote, K.; Adam, M.; Bregaglio, S.; Buis, S.; Confalonieri, R.; Fumoto, T.; et al. Uncertainties in predicting rice yield by current crop models under a wide range of climatic conditions. Glob. Chang. Biol. 2015, 21, 1328–1341. [Google Scholar] [CrossRef] [PubMed]
  107. Bassu, S.; Brisson, N.; Durand, J.-L.; Boote, K.; Lizaso, J.; Jones, J.W.; Rosenzweig, C.; Ruane, A.C.; Adam, M.; Baron, C.; et al. How do various maize crop models vary in their responses to climate change factors? Glob. Chang. Biol. 2014, 20, 2301–2320. [Google Scholar] [CrossRef] [PubMed]
  108. Rosenzweig, C.; Jones, J.W.; Hatfield, J.L.; Ruane, A.C.; Boote, K.J.; Thorburn, P.; Antle, J.M.; Nelson, G.C.; Porter, C.; Janssen, S.; et al. The Agricultural Model Intercomparison and Improvement Project (AgMIP): Protocols and pilot studies. Agric. For. Meteorol. 2013, 170, 166–182. [Google Scholar] [CrossRef]
  109. Köchy, M.; Bannink, A.; Banse, M.; Brouwer, F.; Brüser, K.; Ewert, F.; Foyer, C.; Kipling, R.; Rötter, R.; Scollan, N.; et al. MACSUR Phase 1 Final Administrative Report: Public Release; Thünen-Institut: Braunschweig, Germany, 2015; p. D-C1.3. [Google Scholar]
  110. Hillel, D.; Rosenzweig, C. Handbook of Climate Change and Agroecosystems: The Agricultural Model Intercomparison and Improvement Project (AgMIP) Integrated Crop and Economic Assessments (In Two Parts); Rosenzweig, C., Hillel, D., Eds.; Imperial College Press: London, UK, 2015; Volume 3. [Google Scholar]
Figure 1. Main humid subtropical regions, according to the Köppen climate classification [30]: southeast U.S., southeast China, South America, and east Australia. Red diamonds indicate reference locations for climate characteristics.
Agronomy 08 00019 g001
Figure 2. Mean climate characteristics of humid subtropical regions for reference locations in the southeast U.S., southeast China, South America, and east Australia: (a) monthly mean minimum temperature, (b) monthly mean maximum temperature, (c) monthly mean rainfall, and (d) monthly mean solar radiation. Means based on 30 years from 1981 to 2010. Months 1 to 12 in the Northern Hemisphere represent January to December, whereas in the Southern Hemisphere 1 to 6 correspond to the period from July to December, and 7 to 12 from January to June [39].
Agronomy 08 00019 g002
Figure 3. Cumulative frequency of annual number of days with maximum temperature ≥32 °C from 1981 to 2010. Temperature for reference locations for humid subtropical regions in the southeast U.S., southeast China, South America, and east Australia [39].
Agronomy 08 00019 g003
Figure 4. Mean monthly rainfall/potential evapotranspiration (ETo) ratio for reference locations in the main humid subtropical regions in the southeast U.S., southeast China, South America, and east Australia. Monthly means based on data from 1981 to 2010. Months 1 to 12 in the Northern Hemisphere represent January to December, whereas in the Southern Hemisphere 1 to 6 correspond to the period from July to December and 7 to 12 from January to June [39]. Top left monthly rainfall/ETo ratio for three locations within the southeast U.S. humid subtropical region, including reference locations: north Alabama, central Alabama, and north Florida. Inlet figure units are the same as the main figure.
Agronomy 08 00019 g004
Figure 5. Past decadal trend in (a) minimum temperature, (b) maximum temperature, and (c) annual mean rainfall for humid subtropical regions in the southeast U.S. (SE U.S.), southeast China (SE China), South America (S America), and east Australia (E Australia) from 1981 to 2010. [39].
Agronomy 08 00019 g005
Figure 6. Projected changes in annual mean temperature for the (a) representative concentration pathway (RCP) 2.6 and (b) RCP 8.5, as well as annual mean rainfall for (c) the RCP 2.6, and (d) RCP 8.5 for humid subtropical regions in the southeast U.S., southeast China, South America, and east Australia, according to regional projections from the Coupled Model Intercomparison Project Phase 5 (CMIP5), relative to the period from 1986 to 2005. The mean temperature and rainfall change are averaged over all projection models for 2016–2035, 2046–2065, and 2081–2100, and compared to 1986 to 2005 period. Values indicate 50th percentile of mean responses of the model ensemble used for each RCP projection: RCP 2.6 with 32 models and RCP 8.5 with 39 models [57].
Agronomy 08 00019 g006
Figure 7. Impact of climate change with adaptation (w/a) and without adaptation (n/a), if available, for wheat, soybean, and maize yields for humid subtropical regions in the southeast U.S., southeast China, South America, and east Australia (See Table 3 for details). Note: bars refer to reported ranges of yield changes, whereas single points refer to mean yield change.
Agronomy 08 00019 g007
Table 1. Reference locations and main characteristics for the main humid subtropical regions of the world.
RegionLat. aLong. bSoil cSeasonMajor CropsArea (ha × 1000)Area (ha × 1000) d
SE U.S.35.0−87.3UltisolWinterwheat17,3831953
Summermaize, soybean, cotton, peanut15,430
SE China28.5110.0UltisolWinterwheat30,6915799
Summerrice, corn, soybean24,892
S America−33.0−56.0MollisolWinterwheat42,5575813
Summersoybean, maize36,744
E Australia−33.0151.0MollisolWinterwheat89076465
Summercanola, sorghum2442
a Latitude; b Longitude; c Dominant soil type according to [31]; d Cultivated area corresponding to 2013–14 season for Southeast U.S. (SE U.S.) [32], Southeast China (SE China) [23], South America (S America) [24,25,33], and 2007–2008 season for East Australia (E Australia) [27].
Table 2. Change in global mean surface temperature and atmospheric CO2 concentrations for mid-century and end of century, relative to the period from 1986 to 2005 [9,58].
YearScenarioTemperature (Mean ± 1SD) (°C)Atmospheric CO2 (ppm)
2035RCP a 2.60.3 to 0.7 b431
RCP 4.5435
RCP 6.0429
RCP 8.5449
2065RCP 2.61.0 ± 0.3442
RCP 4.51.4 ± 0.3509
RCP 6.01.3 ± 0.3511
RCP 8.52.0 ± 0.4604
2100RCP 2.61.0 ± 0.4421
RCP 4.51.8 ± 0.5538
RCP 6.02.2 ± 0.5670
RCP 8.53.7 ± 0.7936
a RCP: representative concentration pathway; b RCP scenarios are similar by 2035 and therefore combined here.
Table 3. Climate change impact studies for wheat, soybean, and maize in the humid subtropical regions of southeast U.S., southeast China, South America, and east Australia.
RegionGCMzCrop ModelCO2 (ppm)Δ Mean T y (°C)Δ Rainfall (%)CropRainfed (R)/Irrigated (I)YearYield Variation (%)AdaptationReference
Southeast U.S.HCGS y, OSU x, and GISS wmaize-wheat: CERES5502.1 to 4−54 to −0.9maizeI2020−15noAlexandrov and Hoogenboom, [21]
soybeanI202026.8no
wheatI20207no
v. 3.5 soybean: CROPGRO v. 3.5maizeR2020−10no
soybeanR202041.8no
wheatR20202.7no
RegCM2 v nested with the CSIRO u Mark 2 GCMEPIC540n/an/amaizeI2005−10 to +10yesChhetri et al., [72]
maizeI2025−20 to +20yes
maizeI2045−30 to +30yes
maizeR200510no
maizeR2025−30 to +20no
maizeR2045−30 to +20no
RegCM tEPIC5400.2 to 6.3−15 to +15maizeI2005−10 to +20yesEasterling et al., [73]
maizeI2025−20 to 20yes
maizeI2045−40 to 30yes
maizeR2005−10 to 10no
maizeR2025−20 to 10no
maizeR2045−40 to 10no
HadCM sPNTPLAN4451+2 to +7maizeI2030−4 to 3noHatch et al., [74]
soybeanI2030+8 to +10no
wheatI2030+1 to +4no
maizeR2030+8 to +22no
soybeanR2030+3 to +22no
wheatR20300 to +7no
6802+7 to +17maizeI2090−8 to 0no
soybeanI2090+12 to +16no
wheatI2090+10 to +13no
maizeR2090+8 to +27no
soybeanR2090+17 to +51no
wheatR2090+9 to +17no
Southeast ChinaICTP RegCM3 rEPIC7802.5−5 to +25maizeR2086−20 to +30noChavas et al., [75]
wheatR2086+10 to +30no
HadCM3H qCERES v. 3.57213.9+12.9maizeI2080−50 to 0noXiong et al., [76]
maizeR2080−50 to +50no
South AmericaHadCM2 pCERES v. 3.5n/an/an/amaizeR2055−2 to −25noJones and Thornton, [77]
East AustraliaCSIROCropSyst v. 47000.5 to 1.4−7wheatR2070−29 to −25noAnwar et al., [78]
9 GCMsI-Wheat716n/an/awheatR2070−45 to +35noHowden and Jones, [79]
z GCM = Global Climate Model; y GCGS = Hadley Centre Greenhouse and Sulfate; x OSU = Oregon State University; w GISS = Goddard Institute for Space Studies; v regCM2 = Regional Climate Model; u CSIRO = Commonwealth Scientific and Industrial Research Organization Climate Models; t RegCM = Regional Climate Model; s HadCM = Hadley Centre Climate Model; r ICTP RegCM3 = International Centre for Theoretical Physics Regional Climate Model 3; q HadCM3H = Hadley Center's Coupled Global Climate Model, version 3; p HadCM2 = Hadley Centre for Climate Prediction and Research’s Climate Model version 2.

