Article

Diversity of Maize Kernels from a Breeding Program for Protein Quality III: Ionome Profiling

by
Abdullah A. Jaradat
1,* and
Walter Goldstein
2
1
USDA-ARS and Department of Agronomy and Plant Genetics, University of Minnesota, 803 Iowa Ave., Morris, MN 56267, USA
2
Mandaamin Institute, W2331 Kniep Road, Elkhorn, WI 53121, USA
*
Author to whom correspondence should be addressed.
Agronomy 2018, 8(2), 9; https://doi.org/10.3390/agronomy8020009
Submission received: 27 November 2017 / Revised: 8 January 2018 / Accepted: 15 January 2018 / Published: 23 January 2018

Abstract

:
Densities of single and multiple macro- and micronutrients were estimated in the mature kernels of 1348 accessions in 13 maize genotypes. The germplasm belonged to stiff stalk (SS) and non-stiff stalk (NS) heterotic groups (HGs) with one (S1) to four (S4) years of inbreeding (IB), or open pollination (OP), and with opaque or translucent endosperm (OE and TE, respectively). Indices were calculated for macronutrients (M-Index), micronutrients (m-Index) and an index based on Fe and Zn densities (FeZn-Index). The objectives were to (1) build predictive models and quantify multivariate relationships between single and multiple nutrients with physical and biochemical constituents of the maize kernel; (2) quantify the effects of IB stages and endosperm textures, in relation to carbon and nitrogen allocation, on nutrients and their indices; and (3) develop and test the utility of hierarchical multi-way classification of nutrients with kernel color space coordinates. Differences among genotypes and among IB stages accounted for the largest amount of variation in most nutrients and in all indices, while genotypic response to IB within HGs explained 52.4, 55.9, and 76.0% of variation in the M-Index, m-Index, and FeZn-Index, respectively. Differences in C and N allocation among HGs explained more variation in all indices than respective differences in allocation among endosperm (E) textures, while variation decreased with sequential inbreeding compared to OP germplasm. Specific color space coordinates indicated either large macronutrient densities and M-Index, or large micronutrient densities, m-Index, and FeZn-Index. These results demonstrated the importance of genotypes and the C:N ratio in nutrient allocation, as well as bivariate and multiple interrelationships.

1. Introduction

Human manipulation of carbon and nitrogen partitioning, such as the selective concentration of carbohydrates and storage proteins in larger kernels of maize (Zea mayz L.) during domestication from its wild progenitor [1], is evident from the earliest examples of crop domestication [2]. This process was concomitant with the manipulation of key physical, biochemical, and nutrient traits of the maize kernel [3]. Besides being critical factors that can affect the early development and vigor of maize seedlings, these traits have been exploited by traditional [4] and advanced breeding and selection methods in developing crop cultivars with high food and feed nutritional quality [5]. Nutrient densities in plant seeds are critical to the life cycle of plants as well as to human and animal nutrition. Recent research-based evidence indicated that abiotic stresses trigger shifts of the ionome of plants exposed to elevated CO2 and drought [6,7] and may compromise future nutrient availability.
In grain crops, such as maize, the mature seed represents a distinct developmental end point that summarizes the life history and genetic composition of a particular genotype [8]. However, nutrients are not distributed uniformly throughout the seeds of grain crops: some elements are concentrated in the embryo (e.g., Fe and Zn), while others (Ca and S) are mostly accumulated in the maternal tissues of the pericarp and endosperm [9]. Macro- and micronutrients constitute an important part of seed quality and contribute to the quality of food and feed crops [10,11]. Although maize, as a major staple crop in the context of global nutrition, supplies many macro- and micro-nutrients necessary for human and animal metabolic needs, the amounts of some essential nutrients, such as Fe and Zn, are inadequate for people who rely on it as a main food source [3]. Significant differences in densities of grain nutrients, especially Fe and Zn, were reported among large numbers of traditional landraces, open-pollinated cultivars, and inbred lines of maize in developed [12] and developing countries [13]. However, current data [14,15] suggests that the range in density of essential nutrients in maize kernels is not as large as it is in other major grain crops. Nevertheless, plant breeders succeeded in developing and releasing crop cultivars with high nutrient densities as an inexpensive means for enhancing the nutritional quality of major food and feed crops [16]. The process of enhancing mineral accumulation in grain through genetic improvement (i.e., biofortification) is an efficient way to help solve global nutrient malnutrition, especially in the Global South [17].
There has been a growing interest as well as developments in profiling the dynamic network of nutrients (i.e., the ionome) in biological systems (e.g., seeds) that are controlled by several genetic, physiological, and biochemical processes [18,19]. The availability of high-throughput, high-accuracy analytical chemical methods such as inductively coupled plasma-mass spectrometry (ICP-MS), which can measure densities of multiple nutrients in a relatively short time, allows for comprehensive examination of single and multiple nutrients in relation to other single or multiple (groups) of nutrients [20]. Nutrient profiling can simultaneously measure most of the macronutrients, micronutrients, and trace elements in such systems [19], while full analysis of the ionome provides important insights into the networks underlying ion homeostasis beyond single nutrient studies [19]. In addition, colorimetric technologies have been advocated as screening methods [21] to relate color spectrums of whole seed images with their pigment and nutrient densities. There is ample evidence [22] of strong relationships between color space coordinates and densities of certain nutrients in a wide range of grain crops, including maize landraces [4].
The germplasm of 1348 accessions from 13 maize populations was classified according to parentage, endosperm type, affinity to heterotic groups, and level of inbreeding. Part of the current maize germplasm contains the opaque endosperm2 (o2) mutation with lower levels of protein, more digestible starch, and increased lysine and tryptophan [23]. However, progressive selection for opaque kernels coupled with inbreeding led to a decrease in the proportion of opaque kernels selected for better agronomic traits in this germplasm, as compared with the initial o2 maize cultivars, having inferior agronomic traits associated with soft kernels [24]. In previous studies, Jaradat and Goldstein [25,26] quantified the diversity of maize kernels for protein quality and their components for 31 physical, biochemical, nutrient, and color traits. The experimental results identified correlative relationships between groups of biochemical and nutrient traits linked to certain populations or physical or kernel color traits [26]. New insights into the relative importance of several phytochemicals in these studies indicated that nutrients had positive relationships with several biochemicals, whereas color space coordinates had mixed relationships with these biochemicals, including nutrients, depending on combinations of heterotic groups and endosperm texture.
The objectives of the current study were to: (1) build predictive models and quantify multivariate relationships between single and multiple nutrients with physical attributes and biochemical constituents of the maize kernel in different combinations of heterotic groups and endosperm textures; (2) quantify the effects of inbreeding stages and endosperm textures, in relation to carbon and nitrogen allocation, on single and multiple nutrients and their indices; and (3) develop and test the utility of hierarchical multi-way classification procedure of single and multiple nutrients with kernel color space coordinates.

2. Materials and Methods

2.1. The Germplasm

A sample of 1348 breeding accessions (hereafter referred to as germplasm) was selected from 13 populations, representing unbalanced combinations of parentage (first and second male and female parents), level of inbreeding (from 1 to 4 years of inbreeding and open-pollinated germplasm), and opaque endosperm (OE) and translucent endosperm (TE) textures [25,26]. The germplasm derived from initial crosses through inbreeding is referred to hereafter as a family. Kernel samples were selected from germplasm grown under rain-fed conditions and predominantly under organic management practices.
Kernel samples used in this study consisted of all seed samples from individual self-pollinated ears (except the open-pollinated population). The majority of the germplasm (61.3%) had non-stiff stalks, and the remaining 38.7% had a stiff-stalk genetic background. Progressive selection for agronomic traits and for opaque kernels, coupled with inbreeding during the course of the breeding program, resulted in 36.8% of the germplasm accessions having OE and 63.2% having TE. Initial screening for endosperm opacity was performed in a light box and was verified by digital imagery. Kernels were classified as opaque if they were fully opaque and devoid of any translucent sectors; however, if ears were segregated for opaque and translucent kernels, the two textures were analyzed separately. Forty-six percent of the crosses were GEM (Germplasm Enhancement of Maize) crosses [27] between exotic maize and inbreeds; they were included in this breeding program with the objective of introducing more diversity into commercial Corn Belt Dent, stiff-stalk, and non-stiff stalk genetic backgrounds. Three inbred lines (B73, LH82, and Mo17), included in the genetic background of the germplasm, are among the most important commercial maize genetic resources in the United States. Two of these (B73 and Mo17) provided large variation for endosperm texture and hardness, besides variation in zein composition. Exotic germplasm, including Central and South American “tropical” maize landraces as well as southwestern floury native North American landrace, was successfully incorporated into the genetic background of the breeding program. The germplasm included in the current study was phenotypically selected for early vigor, acceptable maturity, disease resistance, and kernel quality.
Nokomis Gold was derived from recurrent selection of southwestern Pueblo landrace (Hopi, Zuni, Navajo) flour corn at the MFAI (Michael Fields Agricultural Institute) in southeastern Wisconsin, USA. Original landrace accessions were obtained directly from the Hopi or from USDA-ARS (United States Department of Agriculture-Agricultural Research Service) Plant Introduction in Ames, Iowa. Mo508 and Mo506 were obtained from USDA-ARS Columbus, Missouri (Larry Darrah, personal communications, 2005), and as a cross from Cornell University, New York (Frank Kutka, personal communications, 2006). N220A was a Lancaster-derived breeding line obtained from the University of Nebraska-Lincoln (Ken Russelle, personal communications, 2007). Mo42, LH82, LH119, AR16035, and AR16021 were obtained from USDA-ARS Plant Introduction in Ames, Iowa. Crosses between these accessions were made at the MFAI. All other crosses were obtained from the USDA GEMS program.
The germplasm accessions within the 13 populations represented all HGEs and OE and TE textures, except Mo42-N220A, whose accessions only represented OE. Also, accessions of the stiff stalk (SS) population AR16021-B73 included open pollination (OP), OE, and TE textures besides the inbreeding (IB) lines. Nine of the 13 populations (1895-DKXL212-N11a, CH05015-Mo17, GQ-N16-N12, DKXL370-N11a-N20, DKXL888-N11aN17, LH82-AR16021, Mo42-N220A, Nokomis Gold, and NG-Mo508-Mo506) had a non-stiff stalk genetic background, whereas the remaining four populations (AR16021-B73, CHIS740-S14-S12, DKXL370-S11, and LH119-AR16035) had a stiff stalk genetic background.

2.2. Chemical Analyses

Kernel samples were dried at 45 °C in a forced air oven until no further reduction in weight occurred. Kernels were ground through a 1-mm screen (Thomas Scientific, Swedesboro, NJ, USA). One subsample was used to determine C and N and another to determine macro- and micronutrients. Carbon and N were determined using a LECO FP-428 analyzer (LECO, Saint Joseph, MI, USA) and then the C:N ratio was calculated. Digestion of kernel ground material for macro- (Ca, K, Mg, P and S) and micronutrient (Cu, Fe, Mn, and Zn) determination followed the procedure outlined in the USEPA 5051 method (USEPA, 2007). We adapted this procedure using the Mars Xpress Microwave System from CEM Corp. sample preparation note XprAg-1. The procedure uses 55-mL Teflon tubes in a 40-unit carousel. A 0.5-g sample weight was digested with 6.5 mL HNO3 (70% trace material analysis) using a 15-min ramp program set to a power maximum of 1200 W and was held for 15 min. The samples were allowed to cool to room temperature and then transferred to 50-mL volumetric flasks and taken to volume with Milli-Q water (Millipore Corp., Allentown, PA, USA). Chemical analyses were completed using the Varian Vista-Pro charged coupled device (CCD, Varian Inc., Palo Alto, CA, USA) simultaneously with an inductively coupled plasma–optical emission spectroscopy (ICP–OES) instrument. The elemental standards “MNUSDA-STD 1A” and “MNUSDA-STD 2” were prepared according to Inorganic Ventures, Lakewood, NJ. In previous studies the protein, oil, density, methionine, cysteine/cysteine, and lysine contents of the kernels were determined by near-infrared spectroscopy; the methodology was fully described by Jaradat and Goldstein [25,26].

2.3. Kernel Color Analyses

The three-dimensional red-green-blue color space dimensions of 10 kernels, each from 1348 samples, were captured using single lens reflex Nikon 5000 (12.30 megapixel resolution) camera, and then used to estimate their L*a*b* color space (darkness–lightness L*, redness–greenness a*, and yellowness–blueness b*) coordinates according to the recommendations of the Commission International de l’Eclairage [28].

2.4. Statistical Analyses

A relational database was constructed from physical, biochemical, nutrient, and color space coordinate data on each of the 1348 accessions, including nine NS and four SS genotypes, each with O or T endosperm texture, except Mo42-N220A with only OE texture. The [nutrient] (mg kg−1) portion of the database included macronutrients (C, Ca, K, Mg, N, P, and S), and micronutrients (Cu, Fe, Mn, and Zn). The C:N ratio was calculated and used as a factor or covariate in statistical analyses of nutrients. Raw data for each variable was inspected for outliers and normality; appropriate transformation(s) were carried out when indicated by a significant (p < 0.05) SW-W (Shapiro-Wilk Statistical) test and before conducting statistical tests, and then back-transformed for statistical reporting. Three indices were developed using normalized means of macronutrients (M-Index), micronutrients (m-Index), and one based on Fe and Zn densities (FeZn-Index). The restricted maximum likelihood method of variance estimation (REML) procedure was used to estimate variances in variance components analyses, and correlation coefficients between normalized nutrient densities, thus presenting more realistic indicators of these associations. Basic statistics and mean separation between genotypes were calculated for each nutrient and index using one-way ANOVA (Analysis of Variance) and Duncan’s multiple range test (DNMRT; p < 0.05).

2.5. Variance Components Estimation

A correlation matrix was developed between all 11 nutrients in each HGE combination which was then subjected to 2-way hierarchical clustering and factor analysis using the REML method for variance estimation. Correlation coefficients between each nutrient in all four GHEs and each of the three indices (M-Index, m-Index, and FeZn-Index) were developed and tested for significance (p < 0.05). Canonical discriminant analysis was performed on a matrix of physical and biochemical kernel traits to identify the variables and to what extent they can be used to correctly classify the four HGE combinations (i.e., non-stiff stalk with opaque endosperm (NSO), non-stiff stalk with translucent endosperm (NST), stiff stalk heterotic group with opaque endosperm (SSO), and stiff stalk heterotic group with translucent endosperm (SST)).This analysis also aimed to determine how positive or negative nutrient loadings on the first (Root 1) and second (Root 2) canonical roots in relation to centroids of each HGE group determine non-dimensional distances (squared Mahalanobis distance, D2) between these groups [29,30].
A mixed model, with fixed (heterotic group (HG), endosperm (E), IB, and genotype (G)), and random (E(HG), G(HG), IB(HG), and G × IB(HG)) factors, as well as covariates based on kernel physical traits (K-weight, K-density, and K-volume), and biochemical constituents (C:N, amino acids, protein, starch, moisture and oil) was utilized for analyzing each nutrient and index. The REML was used on transformed data in all variance component analyses. Univariate R2 estimates were reported for a fixed factor if its effect was significant (p < 0.05); percent variation explained by each random factor was reported if it was significant (z < 0.05), and the R2 value from a polynomial regression was reported for each covariate if the linear (β1) or quadratic (β2) values (or both) were significant (p < 0.05).
The C:N ratio was used to predict nutrients in each HGE and IB group; then secondary statistics predicted by regression models (i.e., response, and residual mean squares error estimated by the partial least squares regression model (RMSE)) were contrasted with those based on measured data (i.e., mean and S.D.) using a paired t-test. Both regression coefficients (β1 and β2) were tested for significant differences from zero, and the adjusted R2 value derived from the quadratic regression equation was tested for significant differences from zero and from 1.0 using the appropriate t-test.
Centered and scaled coefficients for each macronutrient were extracted from a partial least squares regression (PLSR) model used to predict the m-Index the HG, E, HGE, IB, and G; the measures (mean and S.D.) were contrasted with estimates predicted by the PLSR model (response and RMSE). Another set of PLSR models was developed to assess the relationship between each of the kernel color space coordinates (L*, a*, and b*) for each nutrient and the index in genotypes within the NS and SS heterotic groups. The PLSR validation coefficient of determination (Q2Y) was reported if the model was significant (p < 0.05). In each case, values of R2 and Q2, commonly quoted as descriptors of a multivariate model, represent the percentage of variation within a data set that can be explained by the model, often referred to as a measure of fit (R2), and percent variation of the response predicted by the model (Q2Y; i.e., how accurately a model can be expected to predict new data), respectively, according to cross-validation [31].
The output matrix (1348 rows and 215 columns) from color space coordinates was inspected for the magnitude of variance per column and the significance of its correlation with the density in mg kg−1 of a nutrient (hereafter referred to as [nutrient] density). A final matrix of a set of 2190 correlation coefficients between the [nutrient] density and the L* (59), a* (37), and b* (50) coordinates was used in further statistical analyses. The data matrix was analyzed at four successive stages using hierarchical two-way clustering of correlation coefficients between [nutrient] density and all L*a*b* coordinates, and individually with each set of L*, a*, and b* coordinates. Then, the frequency distribution for the r-estimates was developed for each clustering stage. A pseudo-F value was used in each case to determine the maximum number of statistically different (p < 0.05) clusters for a maximum number of variables, and then the linkage distances (%) were documented.

2.6. Nutrient Indices

Three interrelated indices were computed for each HGE and for the genotypes within each group. The macronutrient (C, Ca, K, Mg, N, P and S) index (M-Index) and the micronutrient (Cu, Fe, Mn and Zn) index (m-Index) were calculated as the normalized values of total macronutrient and micronutrient densities (mg kg−1), respectively; a third index (the FeZn-Index) was calculated from the combined densities of Fe and Zn. All indices were subjected to ANOVA and mean separation (DNMRT; p < 0.05) between GHEs, between genotypes within each HG, and between the OE- and TE-based indices of genotypes within HGs. They were then subjected to variance component analysis using kernel physical, biochemical, and color attributes as covariates. The R2 values (explained variance) derived for this analysis were subjected to 2-way hierarchical clustering at the HGE, HG, and G levels; then the frequency of significant (p < 0.05) R2 for each variable and grouping was determined. Where applicable, summary statistics and their associated significant indicators are reported in the results without details. Relevant modules in JMP 13 Pro [29], and TIBCO Statistica [30] were used in data processing, analyses and visualization.

3. Results

Basic statistics and a wide range (18.0–50.0%) of percent significant pairwise differences (p < 0.05) between 13 maize genotypes for kernel nutrient densities (mg kg−1) classified into four HGEs and based on 1348 maize accessions are presented in Table 1. Mean macronutrient density (mg kg−1) was dominated, in decreasing order, by [K, P, Mg and S] densities, whereas [Fe and Zn] densities dominated for micronutrients. Four macronutrients [K, P, Mg and S], in decreasing order, accounted for 91.0% of total [nutrient] densities in this germplasm. Coefficient of variation (C.V.) was larger for micronutrients (16.0–36.0%) as compared to macronutrients (4.0–16.1%). The Shapiro-Wilk Statistical test of normality (i.e., SW-W was significant for all nutrients, except Mg and P. Two nutrients (N and S) were negatively skewed, while the remaining nutrients were positively skewed. Summary statistics based on ANOVA and mean separation (DNMRT; p < 0.05) indicated that more significant pairwise differences for macronutrients (32.3%) existed between genotypes as compared to micronutrients (26.5%) or the FeZn-Index (23.0%). The largest (50%) and smallest (23%) values were recorded between genotypes for [K and C] densities, respectively, whereas the respective values for micronutrients were 35% for Mn and 19% for Zn densities. The M-Index (0.78 ± 0.05; C.V. = 6.0%) differed (p < 0.05) from the m-Index (0.61 ± 0.07; C.V. = 11.0%), and from the FeZn-Index (0.63.0 ± 0.07; C.V. = 11.0%).

3.1. Variance Components

The effects of fixed and random factors and covariates on macro-and micronutrients are shown in Table 2. The univariate significant (p < 0.05) R2 estimates due to fixed factors (i.e., HG, E, IB, and G) on macronutrients ranged from 1.8% of E on Mg to 56.9% of G on K density; the respective values for micronutrients were 1.5% for HG on Mn and 54.4% for G on Cu density. The only non-significant effects were those for HG for all macronutrients, and E for both Ca and S densities. The effects of IB and G on macro- and micronutrients were, in general, larger than those of HG and E. Significant (z < 0.05) total variation explained by random factors (i.e., nested E, G, IB within HG; and G × IB nested within HG) ranged from 45.3% S to 76.7% K density for macronutrients, and from 50.8% Mn to 70.1% Cu density for micronutrients. The largest percent variation explained by E(HG) in macronutrients was 12.2% for Mg density and in micronutrients it was 16.2% for Cu density. The respective values for G(HG) were 46.3% K and 44.2% Cu densities, for IB(HG) the respective values were 31.2% N and 15.2% Fe, and for G × IB(HG) these values were 47.7 P, and 42.6% Mn densities.
Significant covariate effects (R2) on macro- and micronutrients were presented (Table 2) if linear (β1), quadratic (β2), or both regression coefficients were significant (p < 0.05). Biochemical constituents of the maize kernel had positive (32%) or negative (32%) linear effects on macronutrients, while 23% and 11% of their quadratic effects were positive and negative, respectively. The largest negative effects on macronutrients were those of the C:N ratio, followed, in decreasing order, by starch and K-moisture. Starch and C:N ratio, in particular, had negative linear and quadratic effects on [Ca and N], respectively. Protein and amino acid contents generally had positive effects on most macronutrients; whereas oil content had the smallest negative effects on a few [Ca, N and S] macronutrients.
Kernel biochemicals had almost equal positive (28%) and negative linear effects (29%) on micronutrients. Protein, amino acid (lysine, methionine, cysteine), and oil contents had positive effects on all micronutrients, while the remaining biochemicals had negative linear effects. Kernel physical attributes mainly had negative effects on all macronutrients, except N, while both negative linear and positive quadratic effects were observed for micronutrients. Kernel density was the only attribute with significant negative linear and quadratic effects on all micronutrients. None of the kernel physical attributes affected S estimates, while estimates of Fe, Mn and Zn were not affected by K-volume.
All fixed factors had significant effects on the M-Index and m-Index, as indicated by significant R2 estimates. Both G and IB, in decreasing order, had larger effects on both indices than HG and E. All fixed factors, except E, had significant effects on the FeZn-Index; while all random factors accounted for some variation in each of the three indices, with two exceptions (Table 2). The largest portion (41.3%) of total variation (76.0%) in the FeZn-Index was attributed to G × IB(HG); it was larger than variation explained in the M-Index (52.4%), or the m-Index (55.9%). However, effects of individual random factors differed among these indices. The G × IB(HG) accounted for the most variation in the M-Index and FeZn-Index, while G(HG) accounted for most of the variation in the m-Index.
Covariate effects on all indices mirrored, to a large extent, their effects on the respective nutrients used in their estimation. The C:N ratio had a significant negative effect on all indices; protein and amino acids had positive linear and quadratic effects on all three indices with large R2 estimates; and starch and K-moisture had parallel and significant negative linear and positive quadratic effects on all but the FeZn-Index. K-density was the only physical trait with negative linear and quadratic effects on all indices, while oil had a negligible positive effect on the m-Index.
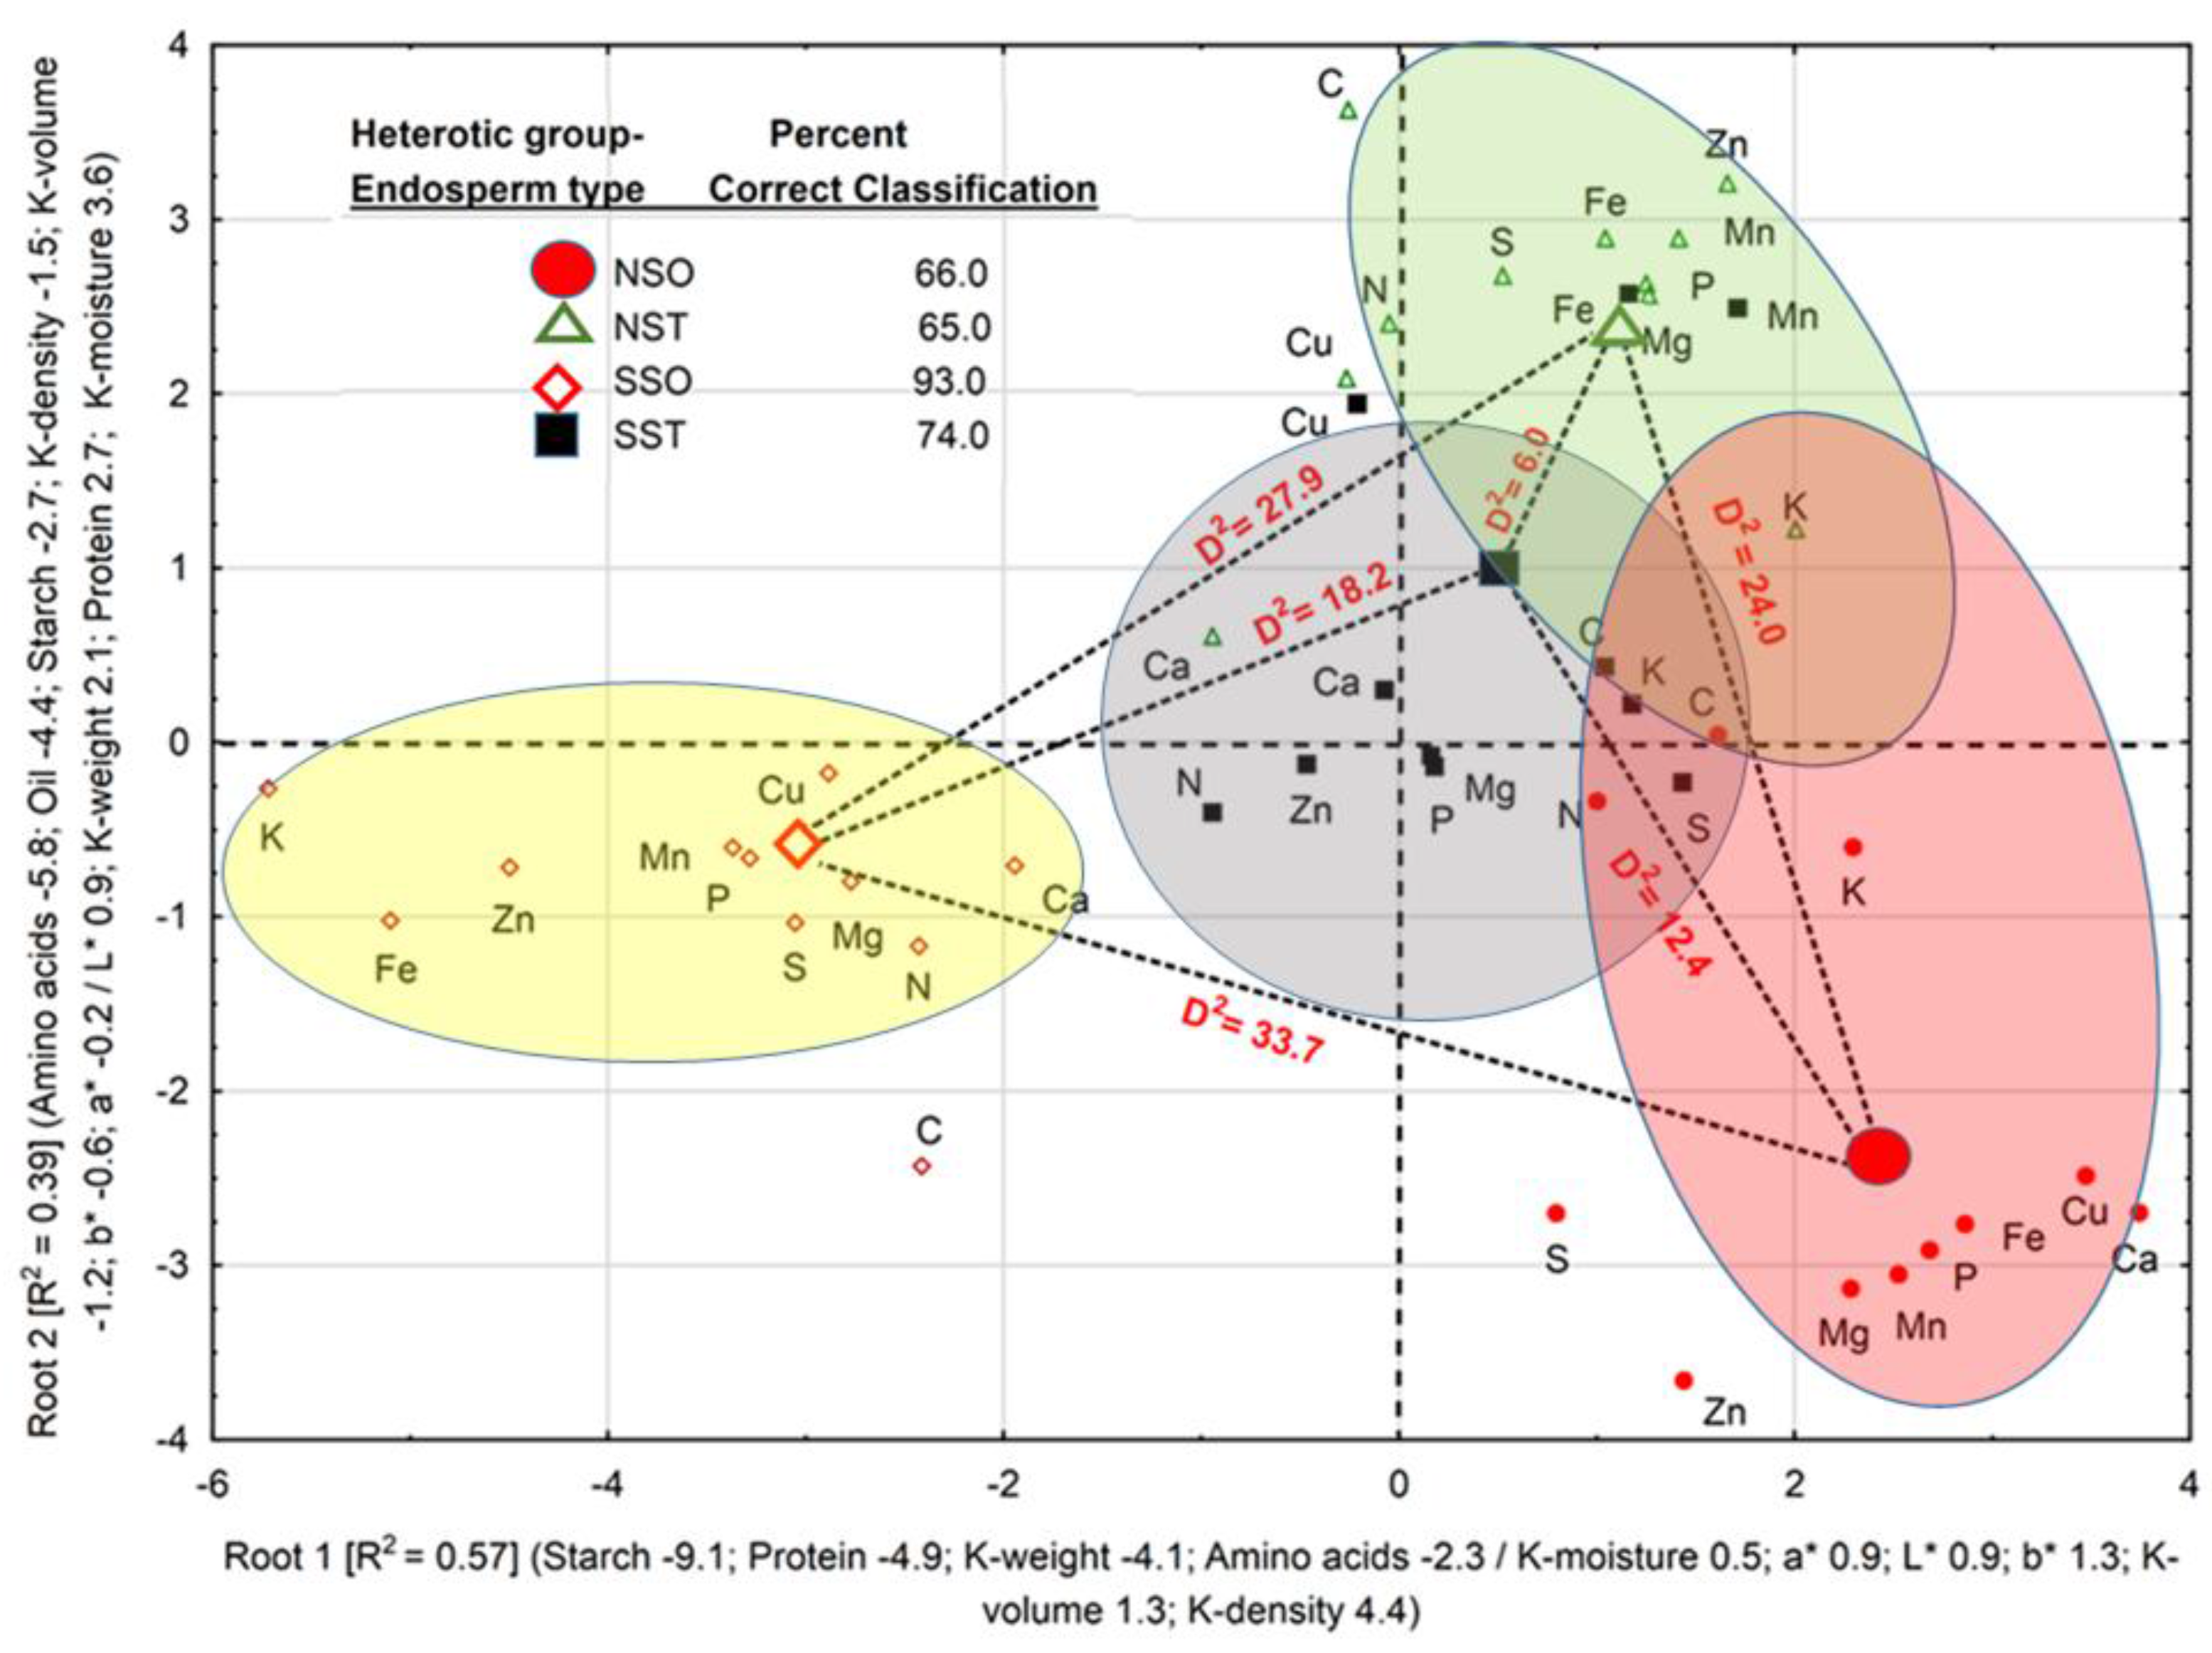
Physical, biochemical, and color space coordinates discriminated between HGEs with 74.5% correct classification, and in two discriminant roots, accounted for 96.0% of total variation (Figure 1). Percent correct classifications of HGEs were 66.0 (NSO), 65.0 (NST), 93.0 (SSO), and 74.0% (SST). Positive loadings of K-density, K-volume, b*, L*, a*, and K-moisture, in decreasing order, and negative loadings of starch, protein, K-weight and amino acids, in decreasing order, accounted for 57.0% of total variation and separated the SSO from the remaining HGEs along Root 1, while Root 2 accounted for 39.0% of total variation and separated the SSO and NSO from the SST and NST. All D2 values were significant (p < 0.05); the largest D2 (33.0) was found between the NSO and SSO, followed, in decreasing order, by D2 between the NST and the SSO (27.9), between the NST and NSO (24.0), between the SST and SSO (18.2), between the SST and NSO (12.4), and between the NST and SST (6.0).
The association in each root between centroids and loadings of physical attributes, biochemical constituents, and nutrients, suggested that accessions within the SSO have larger values for those attributes and constituents with negative loadings on Root 1 and Root 2. Accessions of the NSO, NST, and SST, in decreasing order, have larger values of kernel attributes and constituents with positive loadings on Root 1. The same reasoning can be applied to loadings on Root 2. Nutrients in accessions within each HGE clustered around its centroid in accordance with its percent correct classification. The association of a few nutrients (e.g., [C and K] in NST, NSO and SST) with their HGEs centroids was weaker than most nutrients; thus contributing to smaller percent correct classification of HGEs.

3.2. Single and Multiple Nutrient Associations
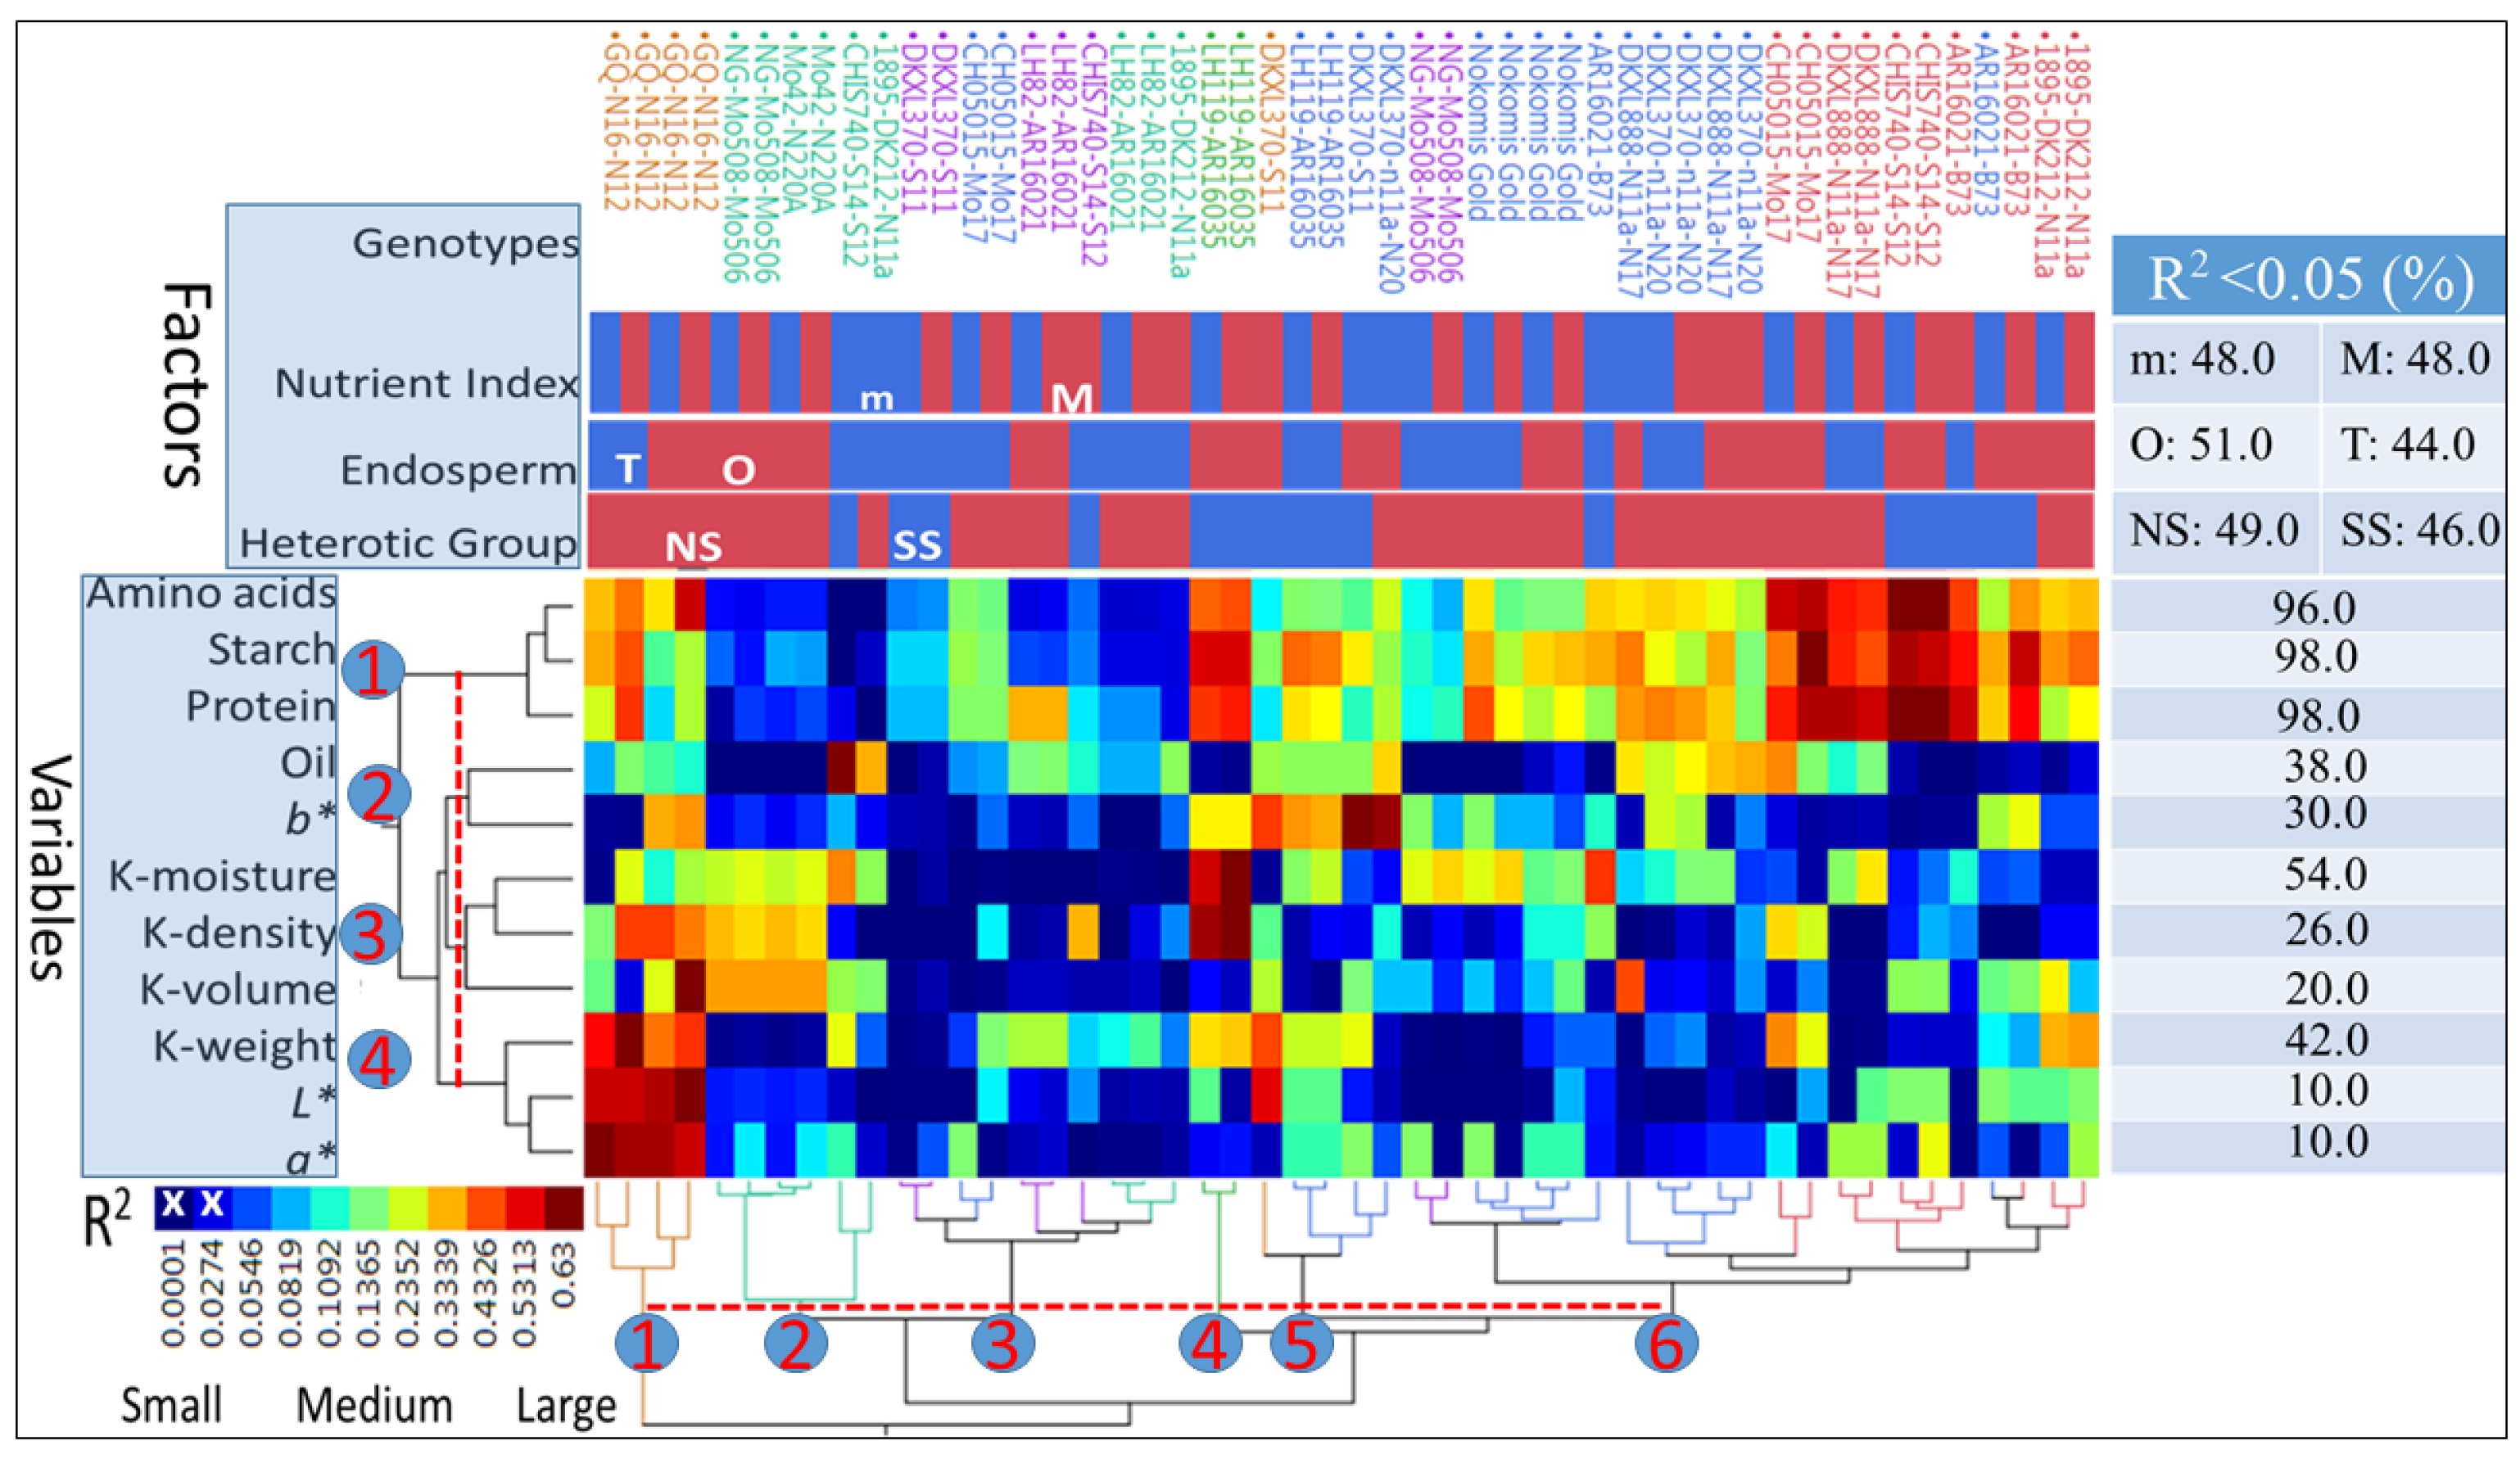
Variance (R2) explained by kernel physical, biochemical, and color space coordinates, in the M-Index and the m-Index for each genotype with OE or TE and classified into the SS or NS heterotic groups, ranged from 0.001 to 0.63 (Figure 2). Four clusters (p < 0.05) were delineated at the 40% linkage distance (Y-axis). Cluster (1) was composed of amino acid, starch, and protein values, cluster (2) joined oil and b* values, cluster (3) was composed of K-moisture, K-density, and K-volume values, and cluster (4) joined K-weight, L*, and a* values. The 50 combinations of genotypes-indices-endosperm textures were separated into several color-coded clusters based on similarities of R2 estimates (X-axis). The 40% linkage distance delineated six (p < 0.05) clusters; the smallest (4) was composed of the genotype LH119-AR16035, while the largest (6) had 23 combinations of M-Index and m-Index under HGE. The clustering procedure resulted in uniform or mixed grouping of genotypes within HGEs. Both of the genotypes (GQ-N16-N12 and Nokomis Gold) formed uniform clusters across HGs, but not E types. Others were separated among two (e.g., NG-Mo508-Mo506), three (e.g., 1895-DK212-N11a), or four clusters (e.g., DKXL370-S11). Clustering distance (from the origin) was the largest for GQ-N16-N12 and the smallest for two genotypes (1895-DK212-N11a and AR16021-B73), while LH119-AR16035, for example, formed a single cluster. The hierarchical classification of genotypes within HGEs and results of statistical tests indicated that the percentages of significant R2 values (>5%) for both indices were equal (48.0%). However, slight differences were found between R2 (p < 0.05) values of OE (51.0%) and TE (44.0%) textures, and between the NS (49.0%) and SS (46.0%) HGs. The largest differences, however, were attributed to protein, amino acids, and starch with the largest (>0.96%) R2, followed, in decreasing order, by K-moisture (54.0%) and K-weight (42.0%), oil% (38.0%), b* (30.0%), K-density (26.0%), K-volume (0.20%), and then L* and a* with 10.0% each.
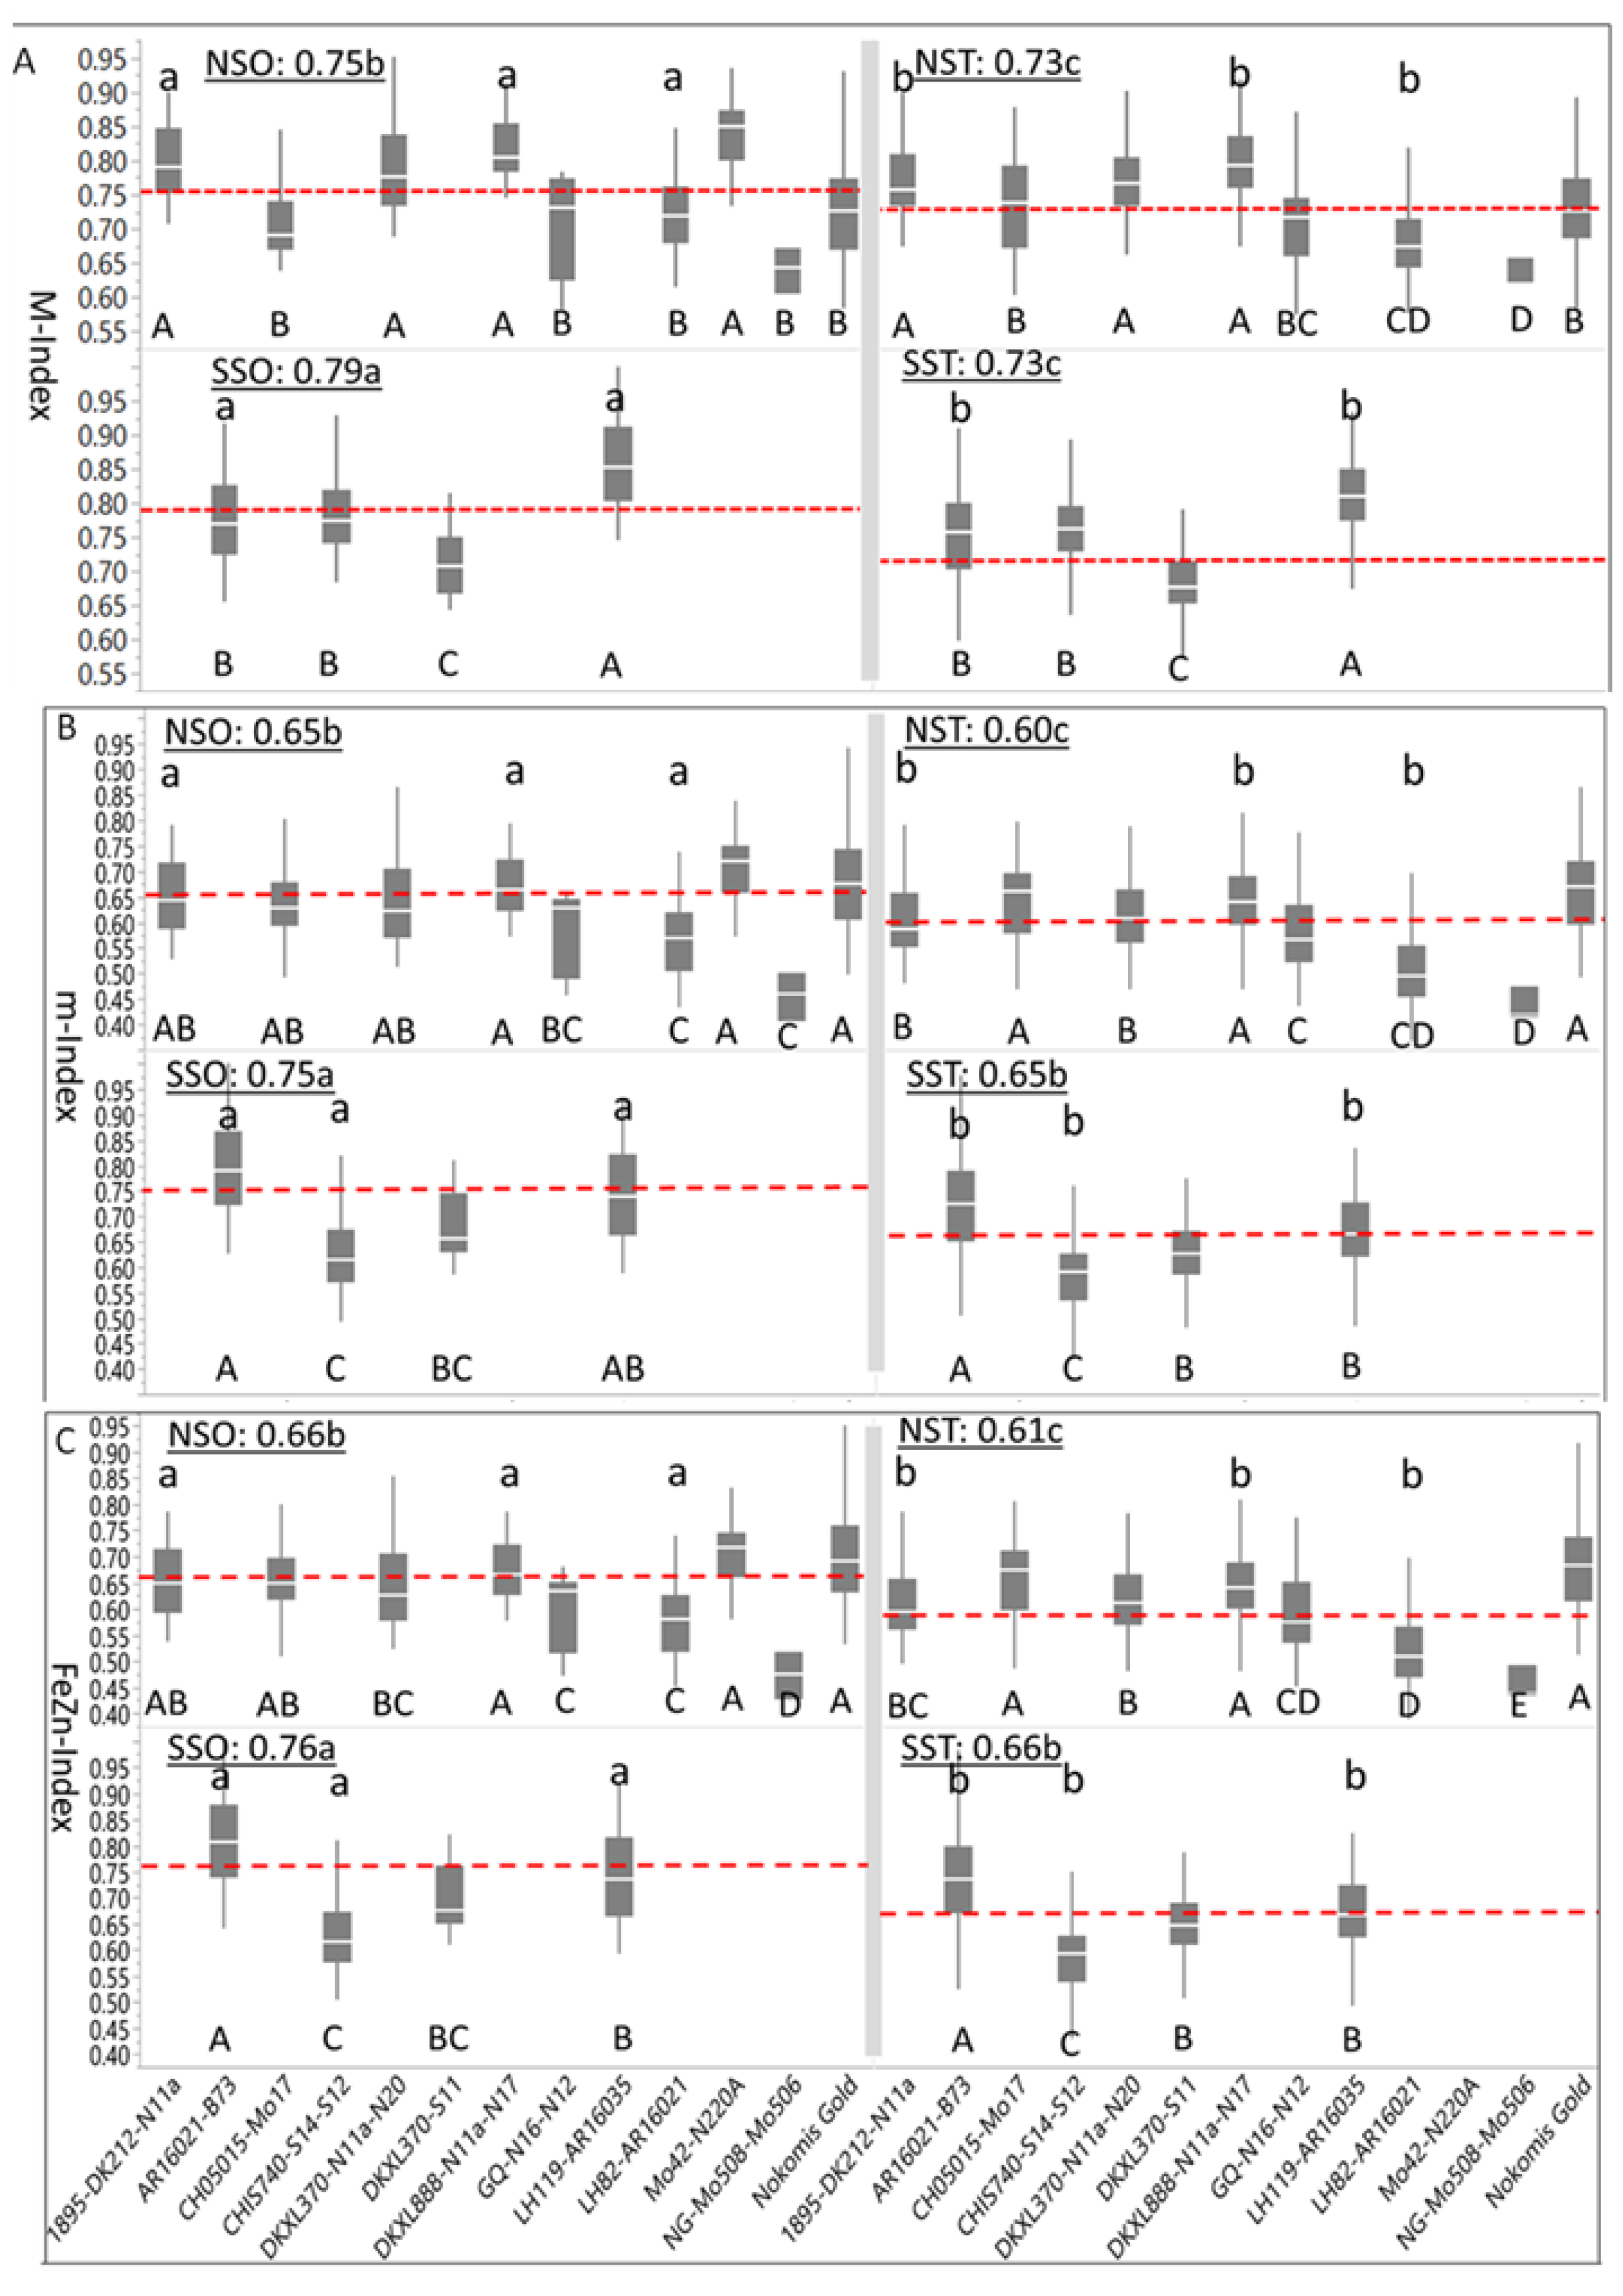
Box-plots and mean separation between M-indices (Figure 3A), m-Indices (Figure 3B), and FeZn-Indices (Figure 3C) were based on normalized [nutrient] density in maize kernels. Summary statistics indicated that the overall Index (0.75 ± 0.08) was similar in magnitude and level of variation to the M-Index (0.76 ± 0.08); however, the m-Index (0.65 ± 0.11) was smaller in magnitude and larger in variation, but closely similar to FeZn-Index (0.66 ± 0.11). When averaged over genotypes, the positive skewness of the M-Index (0.15 ± 0.07), m-Index (0.24 ± 0.07), and FeZn-Index (0.26 ± 0.07) was confirmed; however, when HGEs were considered, the m-Index and FeZn-Index of the SSO were negatively skewed, while all other indices of the HGEs were positively skewed. On the other hand, all indices of four genotypes of the NSO (DKXL888-N11a-N17, GQ-N16-N12, Mo42-N220A, and NG-Mo508-Mo506), as well as all indices of two genotypes of the NST (CH05015-Mo17 and DKXL370-S11), and of one genotype (LH119-AR16035) of the SST were negatively skewed.
The weighted average of the M-Index for all genotypes and HGE groups was 0.74 ± 0.08. The SSO genotypes had the largest mean M-Index (0.79), differing (p < 0.05) from the following M-Index of the NSO (0.75), which also differed (p < 0.05) from M-Indices of both the NST (0.73) and the SST (0.73) (Figure 3A). Mean M-Indices of four and six genotypes for the NSO and NST were above the average of their respective HGE means, respectively, whereas one and three genotypes had above average M-Indices for the SSO and SST, respectively. Mean M-Indices for individual genotypes of the NSO were separated into two (p < 0.05) groups as indicated by capital letters below their boxplots (DNMRT; p < 0.05), whereas their NST counterparts were separated into five (p < 0.05) groups. The number of (p < 0.05) groups of genotypes was three each for SSO and SST. Genotypes in the SSO, with the largest M-Index (0.79), differed (p < 0.05) from their translucent counterparts (SST) which had the smallest M-Index (0.73). Three NSO genotypes (1895-DK212-N11a, DKXL888-N11a-N17 and LH82-AR16021) had larger (p < 0.05) M-Indices than their NST counterparts, whereas the same was observed for AR16021-B73 and LH119-AR16021 in the SSO as compared to their SST counterpart.
The weighted average of the m-Index for all genotypes and HGEs was 0.65 ± 0.11; the mean m-Index of SSO (0.75) was larger (p < 0.05) than for NSO and SST (0.65), while the m-index of NST (0.60) was (p < 0.05) smaller than the rest (Figure 3B). Genotypes of the NSO and NST were separated into four and five (p < 0.05) groups, respectively, whereas all four genotypes within each of the SSO and SST groups differed (p < 0.05) from each other. Differences between three genotypes of NSO (1895-DK212-N11a, DKXL888-N11a-N17 and LH82-AR16021) from their NST counterparts were significant, while all genotypes but one (DKXL370-S11) in the SSO differed (p < 0.05) from their SST counterparts.
Numerically, descriptive statistics of the FeZn-Index (Figure 3C) resembled those of the m-Index. Summary statistics indicated that the weighted average of FeZn-Index for all genotypes and HGE groups was 0.66 ± 0.11. The mean FeZn-Index of SSO was the largest (0.76) and differed (p < 0.05) from SST (0.66) and NST (0.66), both of which differed significantly from NST (0.61). Genotypes of NSO and NST were separated into five groups each (p < 0.05), whereas all four genotypes within SSO and SST differed from each other (p < 0.05). Three genotypes for NSO (1895-DK212-N11a, DKXL888-N11a-N17, and LH82-AR16021) and for SSO (AR16021-B73, CHIS740-S14-S12, and LH119-AR16035) differed (p < 0.05) from their NST and STT counterparts, respectively.

3.3. Modeling Effect of C:N Allocation

Variance (adjusted R2) estimates due to β1 and β2 values of C:N on macro- and micronutrients and their indices for HGEs ranged from 0.0 for Cu in SSO to >0.90 for S densities (Table 3). All β1 values were negative (p < 0.05) except for Cu in SSO and [Cu and K] densities in SST, whereas all β2 values, regardless of OE or TE texture, were negative for SS and positive for NS. Both sets were significant (p < 0.05), except for Fe and Zn in the SST, and Ca densities in NS, regardless of OE or TE texture. Most β1 values differed (t < 0.05) from zero, except [Cu and K]. Meanwhile, β2 values for [Ca, Cu, Mg, Mn, P, K, S, and Zn] densities, as well as those for the M-Index and m-Index, did not (t > 0.05). In addition, R2 estimates for [Cu and Fe] densities, and m-Index were not different (t > 0.05) from zero, while all R2 estimates differed (t < 0.05) from 1.0.
Summary statistics suggested that the overall “Mean” and “Response” estimates were positively correlated (r > 0.90; p < 0.001) and, on average, both were negatively correlated with β1 (r = −0.66; p < 001). Also, S.D. and RMSE were correlated (r = 0.88; p < 0.001); S.D. was only correlated with β1 (r = −0.57; p < 0.001), while RMSE was equally correlated with β1 and β2 (−0.34; p < 0.02). Both coefficients were negatively correlated (r = −0.51; p < 0.001), hence the negative (p < 0.05) correlation between β1 (r = −0.43; p < 0.05), but not β2 (r = 0.24; p > 0.05) with R2.
In addition, differences (p < 0.002) in R2 were found between SS (0.34) and NS (0.59), but not between OE (0.51) and TE (0.43) textures (p < 0.38). However, when HGEs were considered, the R2 for NST (0.62) and NSO (0.57) differed (p < 0.01) from SST (0.24), but not from SSO (0.44), which in turn did not differ from NSO or NST. The R2 estimates for genotypes ranged from 0.09 for Cu, to 0.91 for S. Three nutrients had R2 values between 0.60 and 0.66 [Mg, P, and Mn], while Ca (0.46) and Zn (0.42) R2 values were intermediate. The R2 estimates for M-Index (0.48) and m-Index (0.38) did not differ significantly from each other. However, at the genotypic levels, estimates differed significantly (p < 0.01) between SS and NS, respectively for RMSE in Cu, (0.51 and 0.37) and β2 (0.0012 and 0.0035); in Fe for RMSE (4.00 and 2.68), β1 (−0.30 and −0.65), and R2 (0.09 and 0.47); in S for RMSE (54.5 and 36.1); and in Zn for RMSE (2.76 and 1.75), β1 (−0.28 and −0.64), β2 (−0.005 and 0.17), and R2 (0.19 and 0.65). Also, m-Index estimates in SS and NS, respectively, differed (p < 0.01) for RMSE (0.095 and 0.060), β1 (−0.008 and −0.020), and R2 (0.15 and 0.60). On the other hand, differences (p < 0.05) between OE and TE textures were limited to S.D. for Ca (54.4 and 43.7), R2 for Cu (0.01 and 0.17), SD for Fe (3.5 and 3.9), and mean K (3680 and 3520). The estimated M-Index and m-Index averages for NS (0.745 ± 0.02; and 0.628 ± 0.04, respectively) were (p < 0.05) smaller than the respective SS (0.763 ± 0.02; and 0.705 ± 0.04) estimates; however, the respective R2 values were not different.
Also, differences were found between mean M-Index and mean m-Index for OE (0.772 ± 0.012 and 0.703 ± 0.04) and the respective TE texture, with the respective means of 0.736 ± 0.012 and 0.631 ± 0.04, while the respective R2 values were not significantly different. However, when HG and OE/TE data were combined, HGE mean M-Indices were ranked as follows: SSO (0.789) > NSO (0.755) > SST (0.737) = NST (0.735), while the ranking of m-Indices was slightly different: SSO (0.730) > SST (0.656) = NSO (0.652) > NST (0.605).
Large differences were found for β1 and β2 of C:N on [nutrients] and their indices in response to OP or IB (Table 4). All β1 estimates were negative (p < 0.05), while β2 estimates for S1 and S2 were positive (p < 0.05) and those for OP, S3 and S4 were positive but not significant (p > 0.05). Summary statistics indicated that most β1 values (for [Ca, Fe, Mg, Mn, P, K, S and Zn]) differed from zero (t < 0.001); however, only the β2 value for Zn did not. Averaged over all IB groups, “Mean” and “Response” did not differ significantly from each other; however, those for S.D. (81.8 ± 122.6) and RMSE (55.6 ± 95.8) differed at p < 0.07. Similarly, on average, RMSE was negatively (−0.66; p < 0.05) correlated with β1; however, the large correlation for OP and S1 (−0.80; p < 0.05) dropped to −0.76 for S2, then to −0.67 for S3 (p < 0.05), and finally to −0.40 (p > 0.05) for S4.
Average R2 (0.51 ± 0.26) differed (t < 0.05) from zero and from 1.0. All R2 estimates for individual nutrients differed (t < 0.05) from zero, including the smallest (0.12 ± 0.06, for Cu); also, all R2 estimates, except the largest (0.89 ± 0.04, for S), differed (t < 0.05) from 1.0. Averaged over IBs, similar R2 estimates were found for the M-Index (0.50 ± 0.18) and m-Index (0.46 ± 0.21). Comparisons between mean R2 estimates of IBs indicated that three IB groups OP (0.64) = S1 (0.64) = S2 (0.64) differed (p < 0.05) from the remaining two S3 (0.39) = S4 (0.31). The R2 estimates were negatively (p < 0.05) correlated with β1 in S4 (r = −0.64), and in Fe, K, Mg, Mn and P (r ≥ −0.88), and positively (p < 0.05) with β2 in only Cu (r = 0.91) and S (r = 0.88), as well as with the m-Index (r = 0.89).

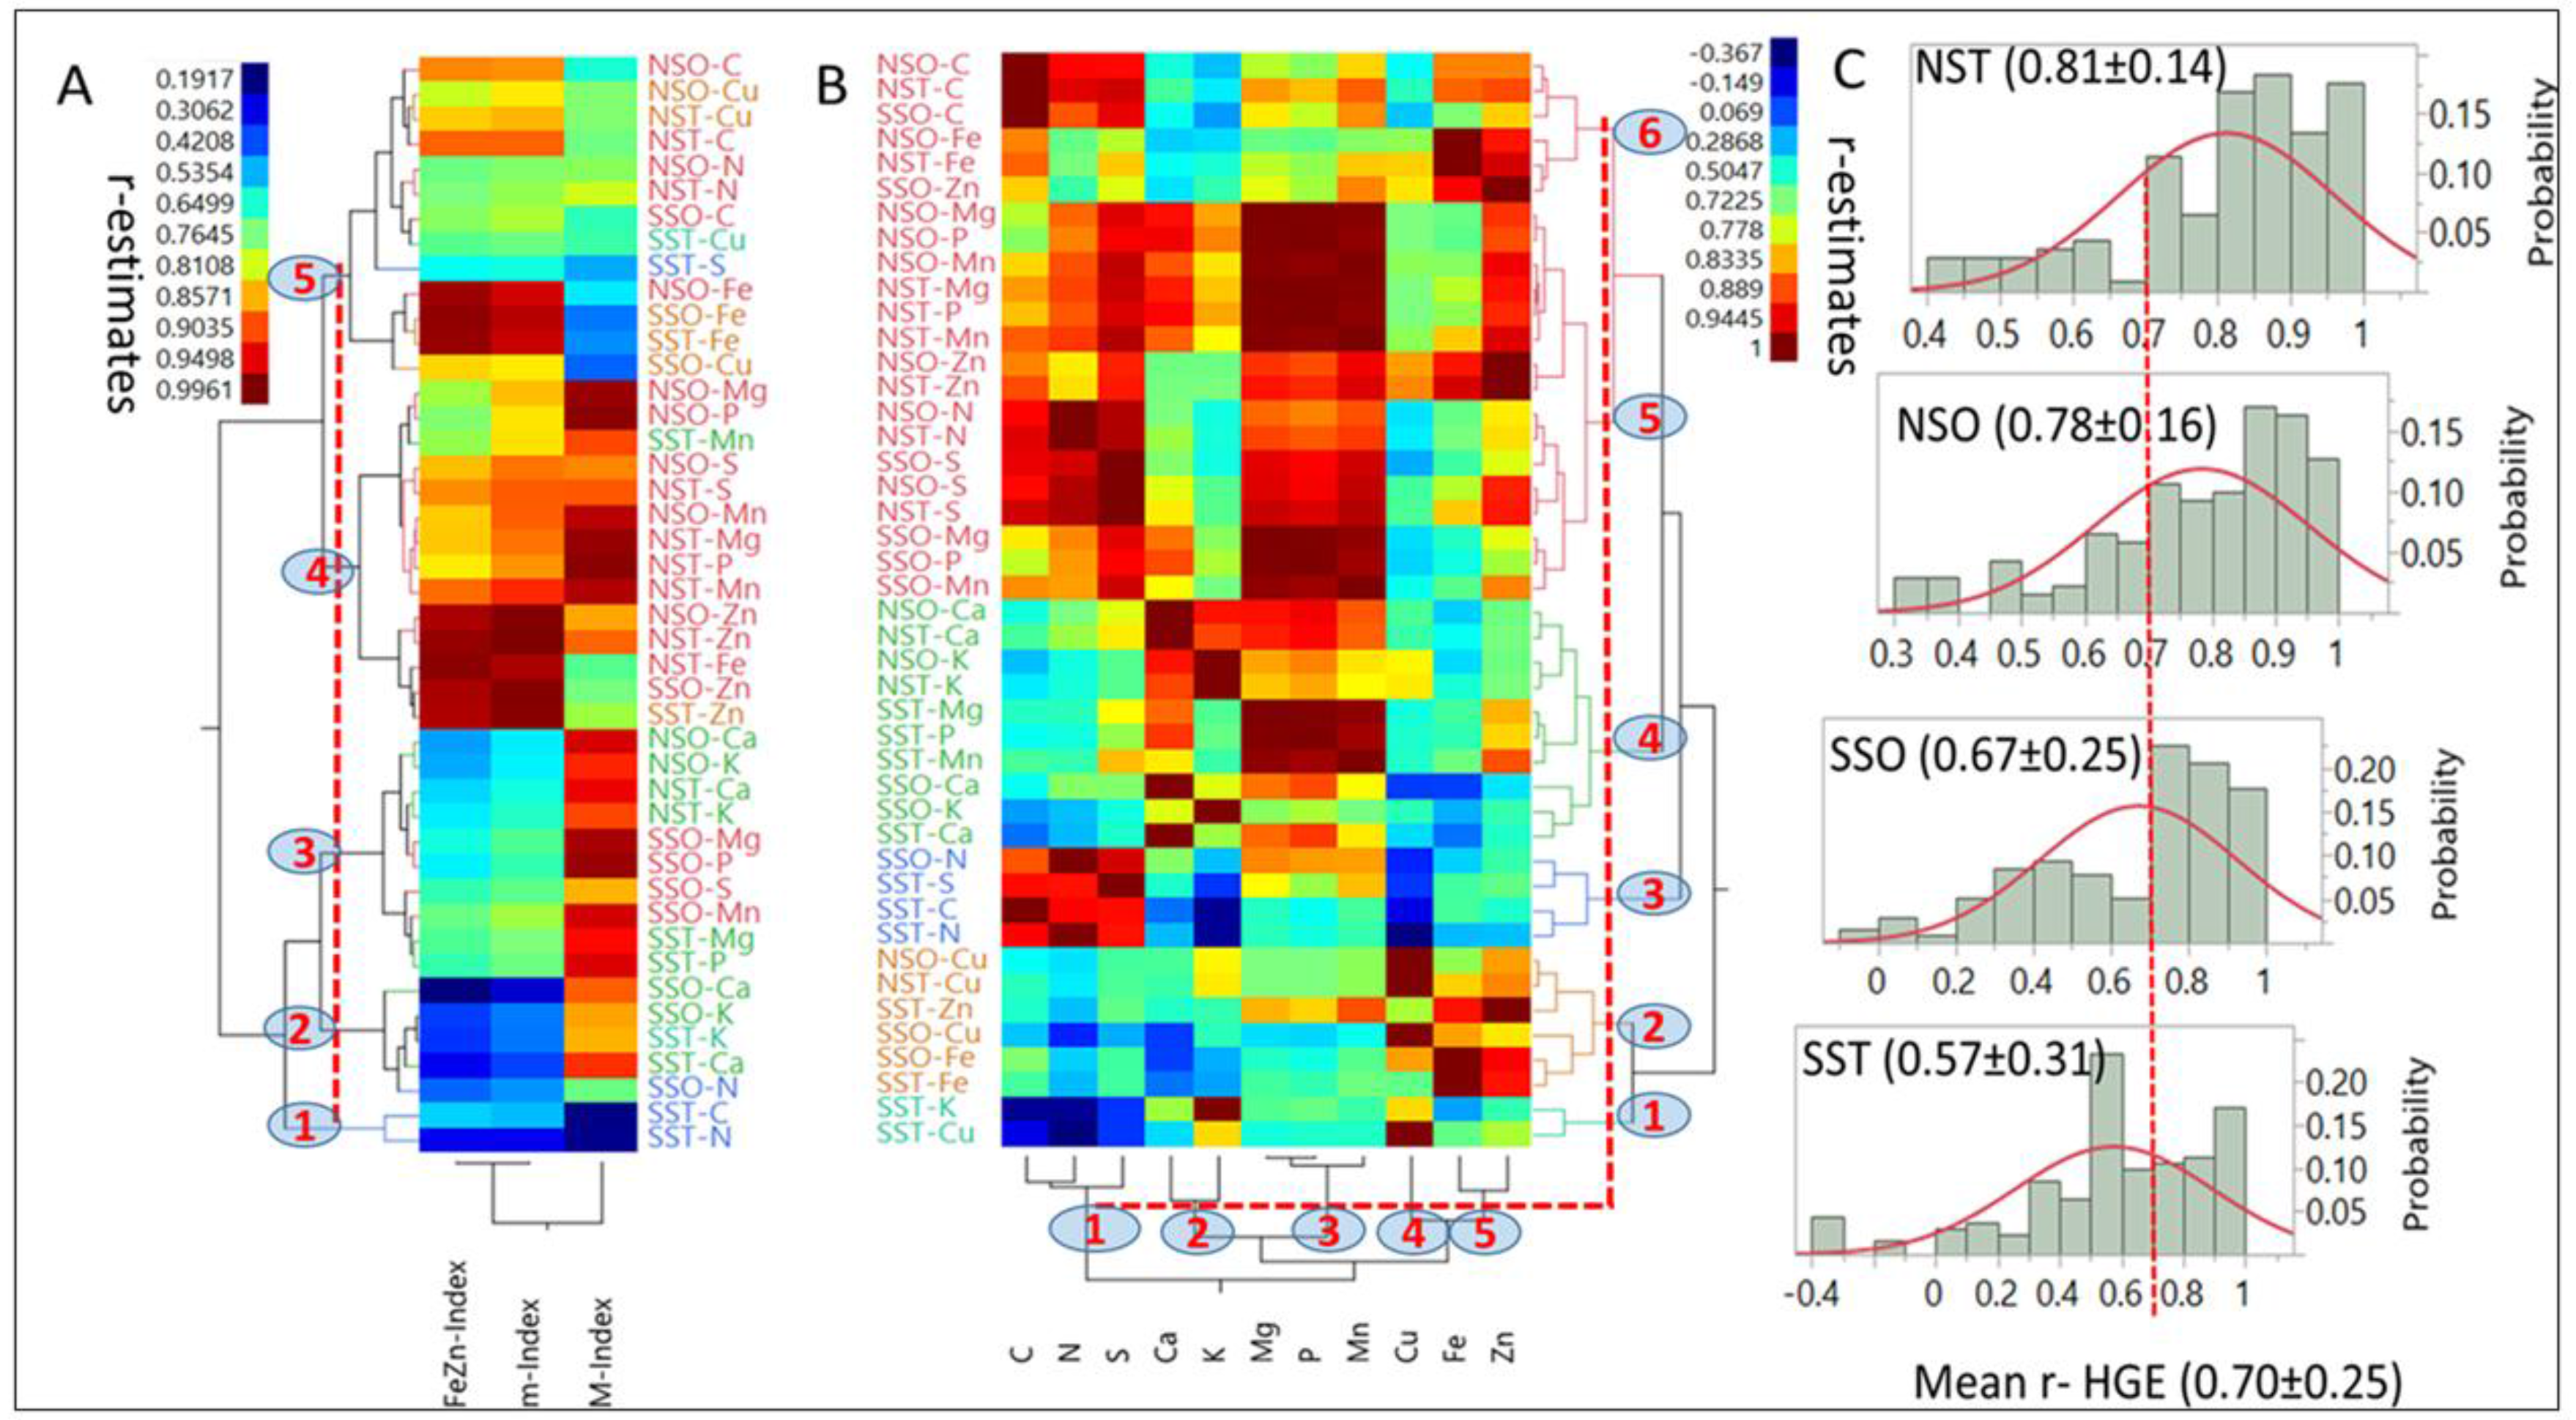
3.4. Modeling Nutrient Indices

Hierarchical, two-way clustering based on correlation coefficients (r = 0.19 to 0.99; p < 0.05) between each index and nutrients in each HGEs (Figure 4A) generated five clusters (p < 0.05) at the 40% linkage distance. Although mean r-estimates between indices and nutrients were not statistically different (p > 0.05), there were clear differences in their level of association with individual (e.g., M-Index with C in NSO) or multiple nutrients (e.g., m-Index with [Mg, Mn and P] as compared with their association with the FeZn-Index).
Only Mn had a larger affinity to the M-Index than to the m-Index. Single nutrients exhibited a wide range of associations (r = −0.367 to 0.944; p < 0.05) with other nutrients in different HGEs and generated five (X-axis) and six (Y-axis) clusters (p < 0.05) at the 40% linkage distance (Figure 4B). The smallest cluster (1; Y-axis) was characterized by negative associations between [K and Cu] with [C, N and S], while the largest (5) was comprised of 18 combinations of six nutrients and three HGEs. Most associations were positive; however, a few small negative ones were found with nutrients in the SST group (notably with K and Cu). On average, [Mg, P, Mn, S and Zn], as a group, were the most interactive (p < 0.05) with other nutrients. They differed (p < 0.05) from [C and Fe] which followed as a second group, [Ca and N] were intermediate, and [K and Cu], were the least interactive. Means and probability distributions of r-estimates for each HGE (Figure 4C) suggested that NST (0.81) and NSO (0.78) means did not differ (p > 0.05), and were larger (p < 0.05) than SSO means (0.67), which differed (p < 0.05) from SST (0.57). The probability distributions, especially above the mean of each HGE, differed markedly between NS and SS HGs regardless of endosperm texture.
Individual macronutrients predicted FeZn-Indices with large probability (Q2Y; 0.50 to 0.95) at all levels of classification (Table 5). Measured and predicted FeZn-Indexes were similar in magnitude (r > 0.97; p < 0.0001); however, S.D. estimates were generally larger than their respective RMSE estimates. The centered and scaled PLSR coefficients suggested that most macronutrients [C, Ca, Mg, P and S] influenced the FeZn-Index positively, with a few exceptions (e.g., P in SS −0.29). Invariably, [K and N] had the largest negative coefficients for all sub-groups. Three macronutrients [P, C and S] in decreasing order, had the largest positive coefficients as compared to [Ca and Mg]. Variation (R2X) extracted by PLSR models from independent variables ranged from 0.65 (SS) to 0.92 (OP) and accounted for 0.50 (SS) to 0.94 (OP) of Q2Y in the FeZn-Index. However, 50% of Q2Y estimates were >0.90 and mostly were attributed to genotypic effects, while the remaining large estimates were associated with IB (except S3). Numerical differences between Q2Y estimates were observed between each SS (0.50) and NS (0.75), between OE (0.54) and TE (0.67) textures, and between SSO (0.50) and SST (0.54), on the one hand, and NSO (0.75) and NST (0.78), on the other. Differences between IB sub-groups were minimal, except for the smaller value (0.83) for S3. In addition, both S.D. and RMSE estimates decreased as the level of classification (i.e., sub-groups) moved from main groups (SS and NS) to genotypes.

3.5. Modeling Nutrient-Color Space Association

Hierarchical two-way clustering provided selection criteria based on associations between L*a*b* and densities of 11 nutrients and their indices (Figure 5A), as well as L* (Figure 5B), a* (Figure 5C), and b* (
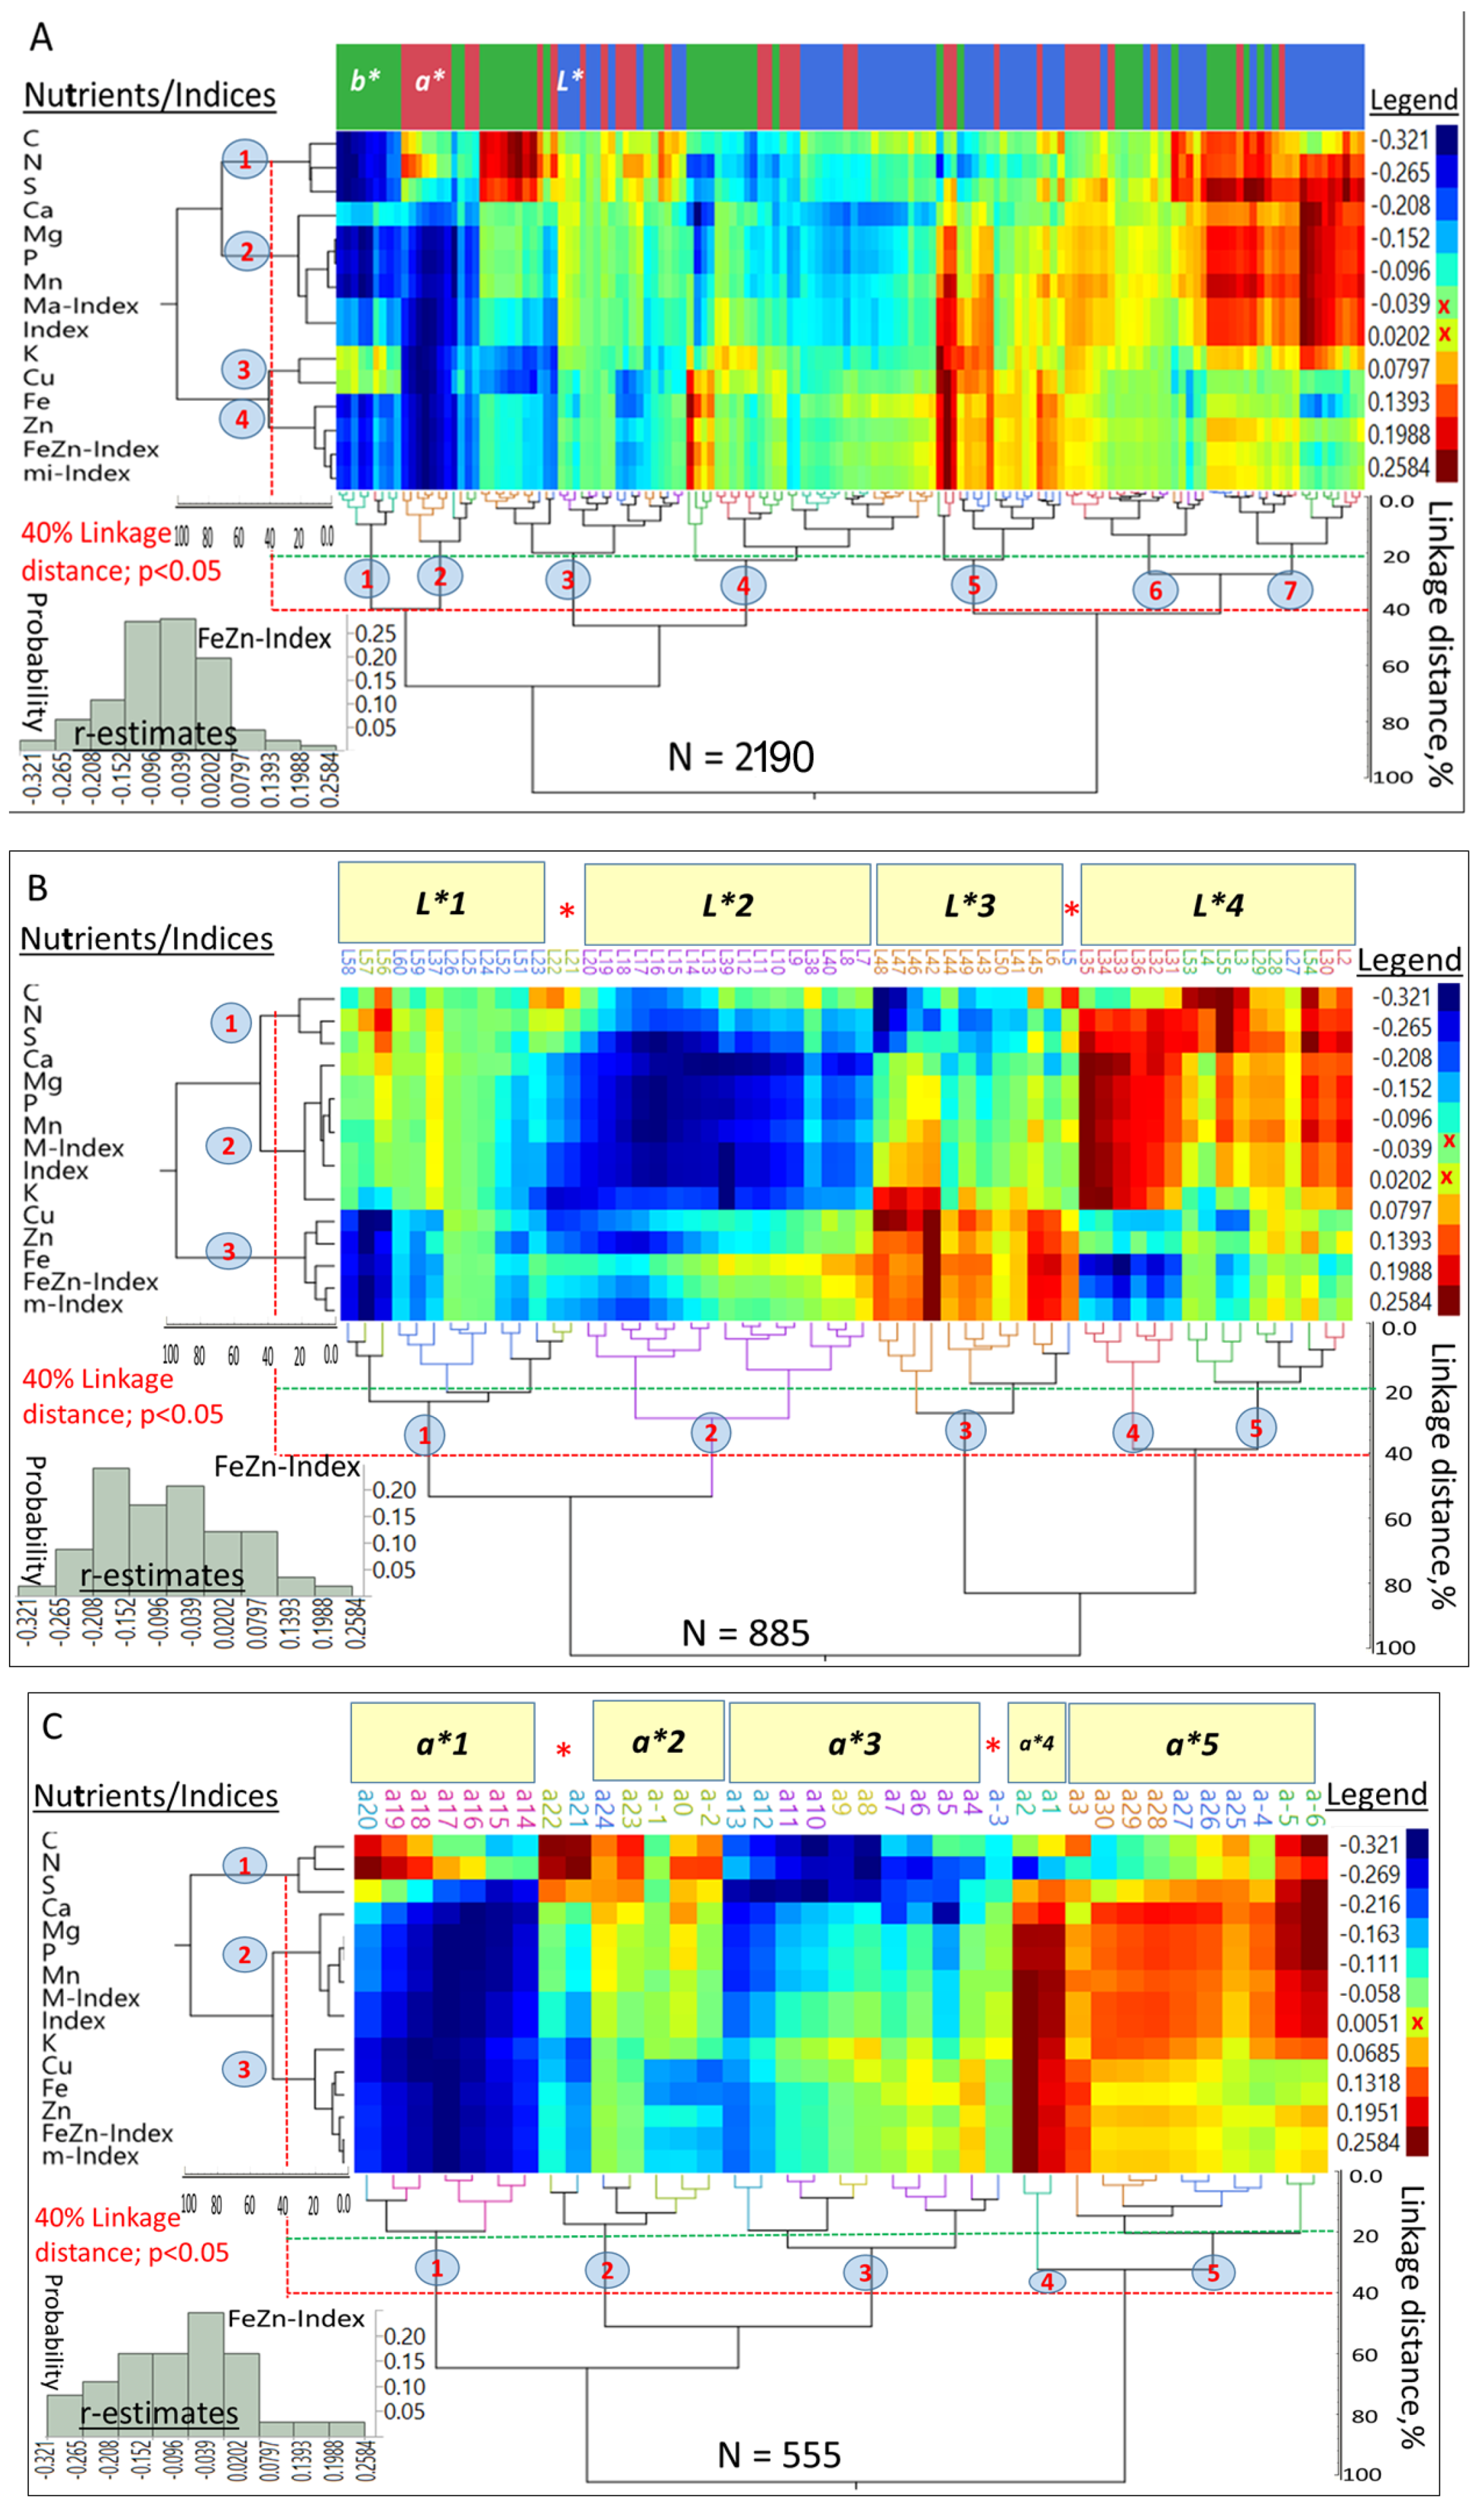
Figure 5D). At the whole color space level, Figure 5A summarized 2190 observations, and at the 40% linkage distances, macro- and micronutrients and their respective indices (Y-axis) were separated into four clusters (p < 0.05), while seven clusters were formed by the color space coordinates (X-axis). The r-estimates between both sets of variables ranged from −0.321 to 0.258.
An overall “Index” was closely associated with M-Index; the FeZn-Index was closely associated with the m-Index, while K and Cu formed an intermediate cluster between macro- and micronutrients and displayed different patterns of associations when compared with most other nutrients. Large differences in r-estimates were found between a* (−0.32 to 0.25), b* (−0.28 to 0.26), L* (−0.15 to 0.21) and different [nutrients]. Mean r-estimates between a* (−0.11), b* (−0.08), L* (−0.04) and the overall Index differed significantly from each other (p < 0.05) and suggested that they were, in decreasing order, negatively skewed. The r-estimates between the M-Index and a* (−0.25 to 0.09), b* (−0.27 to 0.08), and L* (−0.12 to 0.12) supported this suggestion. Both the m-Index and FeZn-Index showed similar trends in their r-estimates with a* (−0.22 to 0.18), b* (−0.20 to 0.15), and L* (−0.11 to 0.09).
Nutrients (and their indices) in combination with 59 L* coordinates formed five main and several minor clusters (Figure 5B) reflecting the large variation in associations between nutrients and L*. Nutrients and their indices formed three clusters (Y-axis); [C, N and S] formed the first, all cations and Mn formed the second, and micronutrients formed the third cluster, at increasing linkage distances. Four L* clusters (X-axis) summarized 885 r-estimates and demarcated some unique combinations of macro- or micronutrients. L*1 (“L58-L21”) separated macro- from micronutrients; L*2 captured negative associations with all nutrients; L*3 differed from the preceding one by having relatively positive correlations with micronutrients; and L*4 defined strong associations with macronutrients. However, two sub-clusters (4 and 5) can be identified within this cluster based on the association with macro- or micronutrients.
A small number of a* coordinates (37) in combinations with [nutrients] formed four major clusters and one minor one (X-axis; Figure 5C), while [nutrients] and Indices formed three clusters (Y-axis) similar to those in Figure 5B. However, K clustered with micronutrients. a*1 separated C, N, and S from other nutrients, and a*2 featured relatively strong associations with C, N and S. However, no clear trend can be identified for association with other nutrients. a*3 showed strong negative correlations with most macronutrients (except a-3); a*4 had strong positive correlation of a small band (a1–a2) with most nutrients, except C and N; and a*5 had broad positive correlations with macronutrients, but mostly small (p > 0.05) correlations with micronutrients.
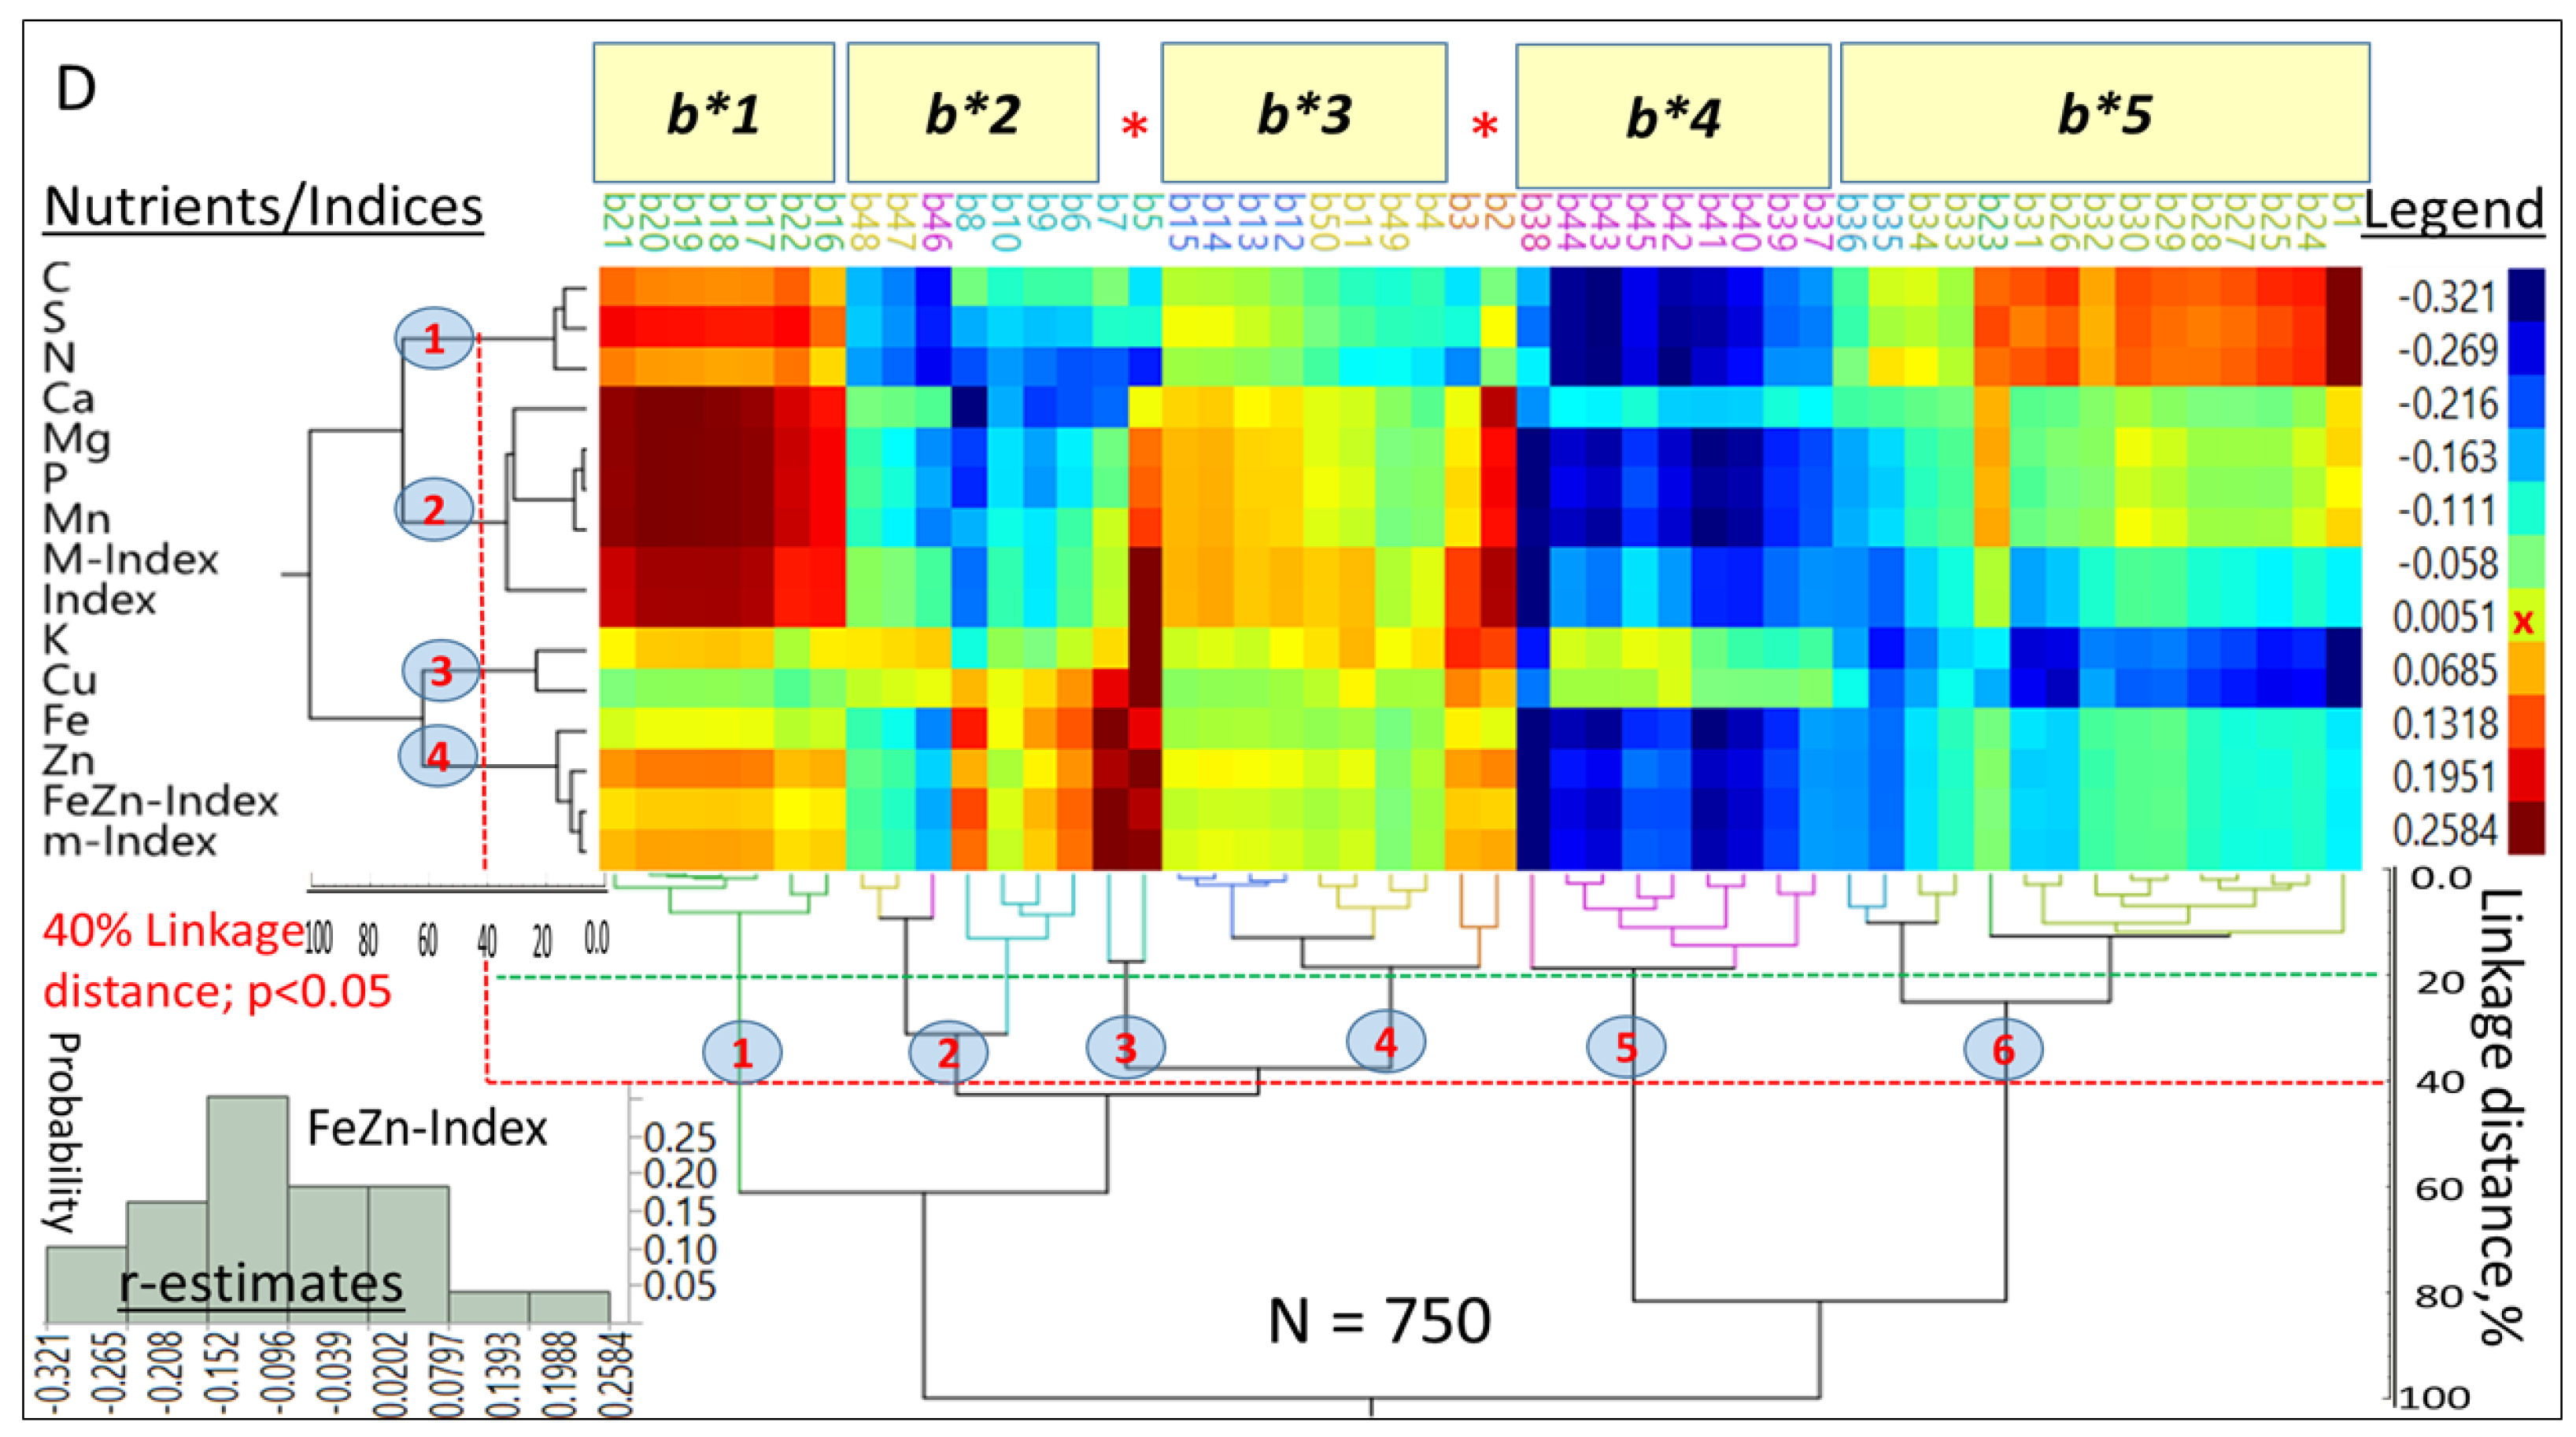
Nutrients (and their indices), in a 2-way clustering with the b* (yellow–blue) coordinates, formed four clusters (Figure 5D; Y-axis) similar in their general composition to those in Figure 5C; however, Cu and K formed a separate cluster. Six main clusters were formed by b* (X-axis), while two small sub-clusters (b5–b7, and b2–b3) were separated from b*3 due to strong positive associations with most nutrients. b*1 had widespread positive associations, especially with P and associated cations; b*2 was dominated by negative and positive associations with macro- and micronutrients, respectively; b*3 largely showed non-significant to slightly positive associations with macronutrient (except b5–b7, and b2–b3); b*4 had strong negative associations with almost all nutrients (however, K and Cu were the exception); and b*5 was vertically stratified and had strong positive associations with C, S and N, followed by largely non-significant associations with most macronutrients, and negative associations with most micronutrients, but with strong negative associations with K and Cu.
Comparisons between NS and SS, between OE and TE, and between genotypes within HGs suggested that L*a*b* accounted for a wide range of significant (p < 0.05) Q2Y values (Table 6). The largest Q2Y estimates in NS were found for S (b*; 0.05) and Fe (b*; 0.07), and in SS they were found for K (L*; 0.13; and a*; 0.12), and Cu (a*; 0.11). The Q2Y estimates were generally <0.08 for OE/TE textures; the largest estimates for OE and TE were found for N (b*; 0.08) and Mn (b*; 0.05), respectively. Genotypes within NS exhibited small (e.g., LH82-AR16021) and large Q2Y estimates (GQ-N16-N12). However, some genotypes within SS displayed uniform Q2Y estimates across macro- and micro-nutrients (e.g., b* in LH119-AR16035), while others (e.g., DKXL370-S11) had very few and variable estimates (i.e., 0.12 and 0.05 for a* and b*, respectively). The Q2Y estimates for the M-Index ranged from small (0.05) to relatively large (0.29; L*) values, while the respective values for the m-Index were 0.05 and 0.32 (L*). The Q2Y estimates for the FeZn-Index were similar to those of one or both micronutrients, with exceptionally large values (e.g., DKXL370-N11a-N20 and GQ-N16-N12). Summary statistics indicated that L*a*b* combined explained 33.3 and 25.0% of Q2Y values in macro- and micro-nutrients in NS, respectively; the respective values for SS were 72.0 and 67.0%. Similarly, they explained 17.0% and 8.0% of Q2Y in macro- and micro-nutrients in OE, and 28.0 and 33.0% in TE, respectively. The Q2Y estimates for genotypes within NS were significant in 31.0 and 28.0% in macro- and micro-nutrients, respectively, while the respective values for genotypes within SS were 35.0% and 40.0%. Moreover, L*, a*, and b*, accounted for variable Q2Y estimates for macro- and micro-nutrients in NS genotypes (41.0% and 31.0%, respectively), and SS genotypes (29.0% and 25.0%, respectively). The respective values for a* were 19.0% and 17.0% for NS genotypes, and 21.0% and 50.0% for SS genotypes, while those for b* were 54.0% and 25.0% for NS genotypes, and 50.0 and 50.0% for SS genotypes. Significant Q2Y estimates for the M-Index and m-Index were 44.0% and 41.0%, respectively, while 33.0% and 50.0% were the respective values for the FeZn-Index.
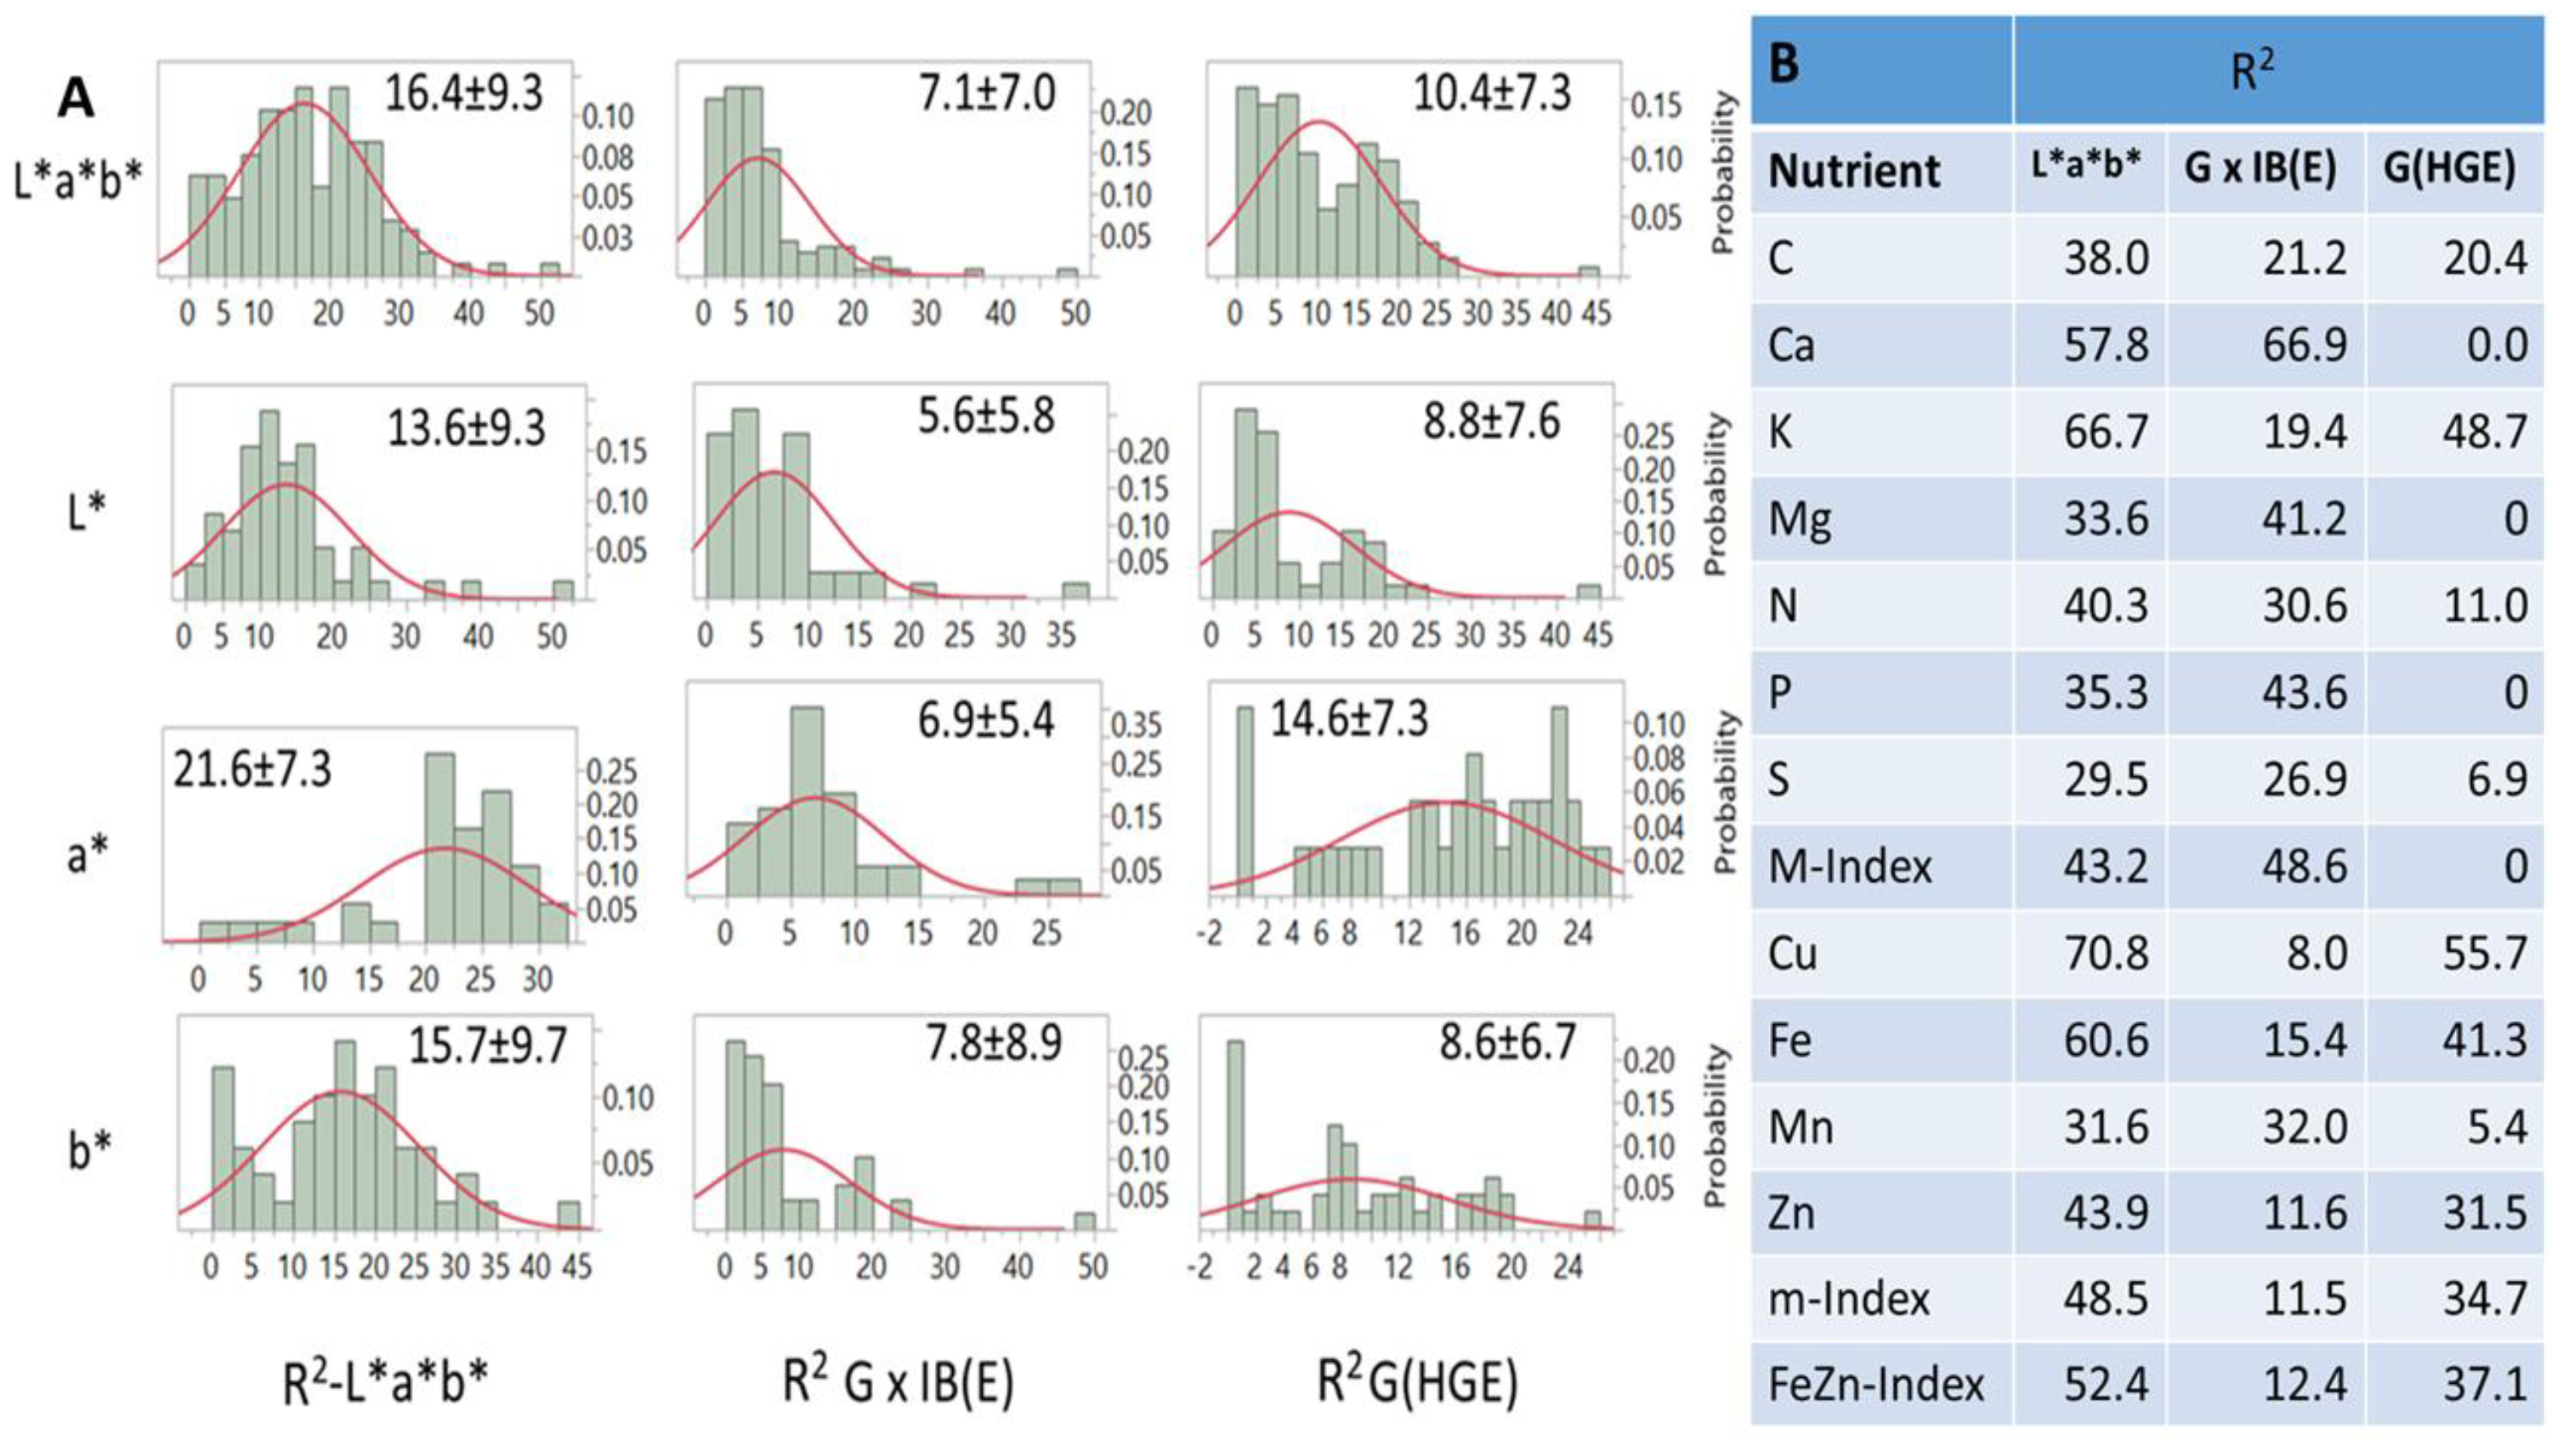
Frequency distributions of R2 values generated by PLSR models and explained by variation in L*a*b*, G × IB(E), and G(HGE) differed between and within factors (Figure 6A) and between nutrients and their indices (Figure 6B). On average, R2 estimates ranged from zero to ~50.0, however, with mostly negatively skewed probability distributions (Figure 6A). For all distributions, summary statistics indicated that correlations between L*a*b* and G(HGE) and G × IB(E) were positive (r = 0.66; and 0.59; p < 0.001), while those between the latter two were negative (r = −0.14; p < 0.05). In addition, differences between a* (21.6), b* (15.7) and L* (13.6) for R2-L*a*b*; between a* (14.6) and L* (8.8) and b* (8.6) for G(HGE); and between b* (7.8) and L* (6.57) and a* (6.92) for G × IB(E) were all significant. The same R2 estimates for each nutrient and index (Figure 6B) averaged over macronutrients were 43.0, 35.7, and 12.4%, respectively, while the respective estimates for micronutrients were 51.7, 16.8, and 33.3%. Index values were close to those used in their estimation. Differences in variation (R2) explained by each L*a*b factor were found for almost all nutrients and their indices (Figure 6B). Averaged over nutrients, *, G × IB(E), and G(HGE) explained 43.0, 35.7, and 12.4% of variation, respectively. The respective averages for micronutrients were 51.7, 16.8, and 33.5%. Some (but not all) averages were in line with R2 estimates for the respective indices, while pair estimates for some nutrients (e.g., K/Cu; and Mg/Mn) across factors were similar.

4. Discussion

Readily available and widely variable maize germplasm, as a model biological system with tremendous genetic diversity [32], is a prerequisite to continue yield increases and to improve multiple quality traits for human food and animal feed. Earlier Jaradat and Goldstein [25,26] identified sources of variation of single and multiple quality traits, determined the level of genetic diversity present in a large maize germplasm, and quantified phenotypic variation that may be useful for developing high-quality maize cultivars. Concerns are rising over the declining density of micronutrients, especially Fe and Zn, and some macronutrients (e.g., Ca and Mg) in grains of staple food and feed crops. As a paramount staple crop in the context of global nutrition [3], larger maize grain yields and harvest indices may have contributed to its current low nutrient densities, especially of essential micronutrients. People in the Global South who mostly consume maize as a staple food are at risk of malnutrition due to insufficient densities to meet minimum daily requirements [33].
The age-old agronomic enhancement of nutritional quality may have temporarily improved micronutrient densities in grains of staple crops [34]; however, maize is physiologically weaker in Fe uptake from the soil than small grains [35]. Therefore, genetic biofortification could be a more durable solution for its micronutrient deficiencies [5]. Natural variation of Fe (8.0 to 62 mg kg−1) and Zn (12.0 to 58.0 mg kg−1) has been extensively reported as a prerequisite for genetic biofortification [36,37]. However, a genetic approach may not always be adequate due to several interacting factors, including lack of readily available germplasm, unfavorable genetic, physiological, and chemical interactions within the ionome [38], and negative relationships with grain yield [17,20]. These perceived shortcomings of genetic biofortification recently led to promoting molecular breeding [38,39] as a means of improving [nutrient] and bioavailability of micronutrients in maize and other grain crops.

4.1. Phenotypic Variation and Variance Components

A mature maize kernel summarizes the life history and genetic composition of the maize plant. Physical, biochemical, and nutrient traits of the maize kernel are critical factors affecting the early development and vigor of maize seedlings. These traits have been criteria for selecting varieties with higher food and feed nutritional quality [13,40]. We constructed a comprehensive picture of diversity and interrelationships within and among most of the physical and biochemical constituents of the maize kernel. Earlier studies targeting macro- and micronutrients in maize identified sources of genetic variation [12], densities of single and multiple nutrients [18], relationships between target and non-target nutrients [41], and potential for genetic enhancement of nutritional quality through breeding and selection [39,40]. In its early phases of development [41], biofortification breeding was focused on the most limiting nutrients in human diets such as Zn and Fe, without considering other nutrients such as Ca or Mg [42].
Nevertheless, the development of multi-nutrient rich maize cultivars would help achieve nutritional security in a more holistic and sustainable way by reducing micronutrient malnutrition [39], especially in the Global South [3]. Understanding the dynamics of the ionome plays an important role for this objective [19,43]. We explored ionome dynamics by measuring and statistically analyzing multiple nutrients as indices (Table 2). Small vs. large ranges of r-estimates between nutrients are indicators of the level of variation in one or more nutrients [8,44]. The ranges in Fe and Zn in maize kernels in this and other studies e.g., [45] were much smaller than those in small grains [46] and may hinder progress towards breeding maize with high nutrient densities [41]. Moreover, differences between the highest mean values for genotypes were 4.2× higher for Fe and 2.8× higher for Zn than the lowest mean values (Table 1). These differences are larger than the 20% differences reported for tropical maize cultivars [44]. This level of variation could be valuable if it is associated with a large genetic component and high heritability [41]. Genetic components may account for different portions of variation in kernel nutrients [42]. More variation in Fe (52.6%) was accounted for than in Zn (37.0%) in this study (Table 2). Additionally, G(HG) accounted for almost equal portions of variation in both nutrients (33.9 and 31.1%, respectively). However, the inbreeding factor may have acted differently on these nutrients; IB(HG) accounted for more variation in Fe (15.2%) than in Zn (2.8). There were consistent relationships between starch and protein (r = −0.90; p < 0.001) and starch and oil (r = −0.25; p > 0.05) in all HGEs. However, and despite their variable effects on nutrient densities and indices (Table 2), starch and protein, but not oil, clustered together in accordance with G(HG) differences (Figure 2). These relationships and cluster-affiliations may render selection of desirable trait combinations much easier; however, due to negative relationships, selection for some nutrient combinations (e.g., Cu and K with N or S; Figure 4) may be more difficult to achieve [17].

4.2. Kernel Physical Traits and Nutrient Dynamics

Unlike small grains, where variation in [nutrient] density was not closely associated with grain shape [47], most physical attributes of the maize kernel had reasonably significant effects on densities of most nutrients (Figure 2; Table 2). Evidence of K-weight dilution effect on nutrient densities (e.g., Fe and Zn) has not been shown to be conclusive [48]. On the other hand, understanding relationships between kernel weight and nutrient associations (e.g., P > Mg > Mn > Cu > Ca > Fe) was found to be crucial for breeding maize cultivars with larger nutrient densities [41,49]. Other kernel physical attributes (K-volume and K-density), depending on the genetic background, may enhance or diminish kernel sink capacity [48]. In this study there were variable loadings of K-weight for discriminating between nutrients within HGEs, and variable magnitudes of its association with m-Index in different HGEs. Kernel weight had negative and smaller effects on most nutrients than biochemical constituents, as indicated by the magnitude of linear regression and determination coefficients (Table 2); however, it exerted larger effects (R2 = 0.42) on the M-Index and m-Index than K-density (0.26) or K-volume (0.20) (Figure 2), and as a covariate, it expressed positive and negative, albeit small effects on single nutrient densities and their indices (Table 2).On the other hand, K-moisture had larger positive effects on most nutrients (Figure 1 and Figure 2). However, as a covariate (Table 2), K-moisture contributed to a downward adjustment of most nutrient densities. Moisture-dependent physical attributes of the maize kernel (e.g., K-volume, K-density and K-weight) are non-linearly related to its moisture content [43]. Therefore, directly, and indirectly through physical attributes, K-moisture influenced [nutrient] density as indicated by the R2 estimates (Figure 2).
Summary statistics indicated a strong correlation between K-moisture and K-volume in all HGEs (r = 0.60 to 0.70; p < 0.05), and between K-moisture and K-density (r = 0.30; p < 0.05) in SST. Variable effects of physical attributes are confirmed by the positive and negative loadings of these traits on the first and second discriminant roots, respectively (Figure 1), and by the magnitude of their linear and quadratic regression coefficients (Table 2). Similar effects were validated irrespective of how the nutrient is accumulated in the endosperm, embryo, or seed coat [2]. Although the direct and indirect effects of the physical attributes of the maize kernel on [nutrients] are smaller in magnitude than biochemical traits (Table 2; Figure 2), they need to be taken into consideration as confounding factors in ionome phenotyping.

4.3. Biochemical Constituents and Nutrient Dynamics

Biochemical constituents had larger R2 estimates than physical attributes (Table 2), and therefore, had stronger positive relationships with M-Index and m-Index; however, the magnitude of these relationships depended on genetic factors (i.e., HG, E, and G). The R2 values for protein, amino acids, and starch (>0.96) were logically larger than for oil (0.38), presumably due to their larger genetic components [26]. Others have found that densities of some nutrients (e.g., Mg, S, Fe and Zn) are correlated with grain protein content (GPC) [15]. Some of these nutrients showed strong bivariate relationships (S, as well as Fe and Zn; Figure 4B); this is probably due to the synergistic effect of N [50,51]. This association may help stabilize these nutrients in the maize kernel [42], and may provide a rapid and efficient selection method for a micronutrient (e.g., Zn) when selecting for a macronutrient (e.g., Mg). Unique differences have been found between K, in association with Cu, and other macronutrients (e.g., Figure 5A). Three macronutrients [N, S and P], are constituents of important primary and secondary organic compounds. K is not assimilated into organic matter but functions as a co-factor for enzymatic reactions and counter-ion for metabolite transport [51]. Though K either acts alone or, under specific conditions in combination with Na, its density was affected negatively by starch and positively by oil and protein concentrations. Transport of Cu (and Zn) to kernels depends on K. Hence, there exists a close association between the magnitude of the densities of K, Cu, and Zn and the large portions of their variances accounted for by biochemicals (Table 2; Figure 6B).

4.4. Single and Multiple Nutrient Associations

Nutrient density are reflections of a dynamic network of interactions, signifying unique functions and bivariate or multivariate synergistic or antagonistic relationships [8,17]. That nutrients do not behave independently can be gleaned from their joint clustering and associations with one or more nutrient indices (Figure 3 and Figure 4). On the other hand, for any nutrient, patterns of accumulation are inconsistent for a correlation between nutrients within kernels [19]. Therefore, we employed a wide range of in-depth multivariate statistical analyses procedures on single, bivariate (e.g., Fe and Zn) and multiple combinations (M-Index and m-Index) of nutrients for the phenotypes of interest. Nutrients differed in the intensity of their relationships [52]. However, our results indicated that divalent cations were the most interactive, while K and Cu, contrary to other findings [46], were the least interactive. This may be interpreted as evidence of no common genetic control of such nutrients [47]. However, several genetic, physiological, and (bio)chemical factors within the complex kernel composition may influence these relationships [53].
Densities of different nutrients varied in their level of plasticity. This was shown by C.V. values (Table 1), Q2Y values in PLSR models (Table 3 and Table 4), the level of dependence on physical traits and biochemical constituents of the maize kernel as quantified by loadings on discriminant roots (Figure 1), and more precisely by density variance estimates attributed to these traits and constituents (Figure 2). This plasticity is usually held under tight genotypic control [19] as indicated by the small percent of significant pairwise differences in nutrient densities between genotypes (Table 1). These differences were slightly larger (32.3%) for macronutrients than micronutrients (23.0%). The strong effects of genotype on single and multiple nutrient densities, especially Fe and Zn, suggest high potential for biofortification [33]. However, these genotype effects were mediated by effects of heterotic groups, and to some extent, by endosperm texture. In comparison with factors in the mixed model (Table 2), the large genotypic variances (R2) for single and multiple nutrients were also confirmed as indicators of ample genetic variance available in the germplasm. Genotypic variances were 3.6-fold to 15.0-fold larger than HG effects on the M-Index and FeZn-Index, respectively.

4.5. Modeling C:N, Nutrients and Indices

Summary statistics indicated that the germplasm exhibited a wide range of C:N ratios (17.7 to 48.8) and 40% of these ratios were above the mean of 25.0 (C.V. = 17.6%). Larger variance (29.8%; z < 0.03) was attributed to how genotypes within HGs responded to inbreeding (i.e., G × IB(HGs), rather than variance caused by differences between endosperm types within genotypes (2.9%; z = 0.07). These results corroborated differences between HGs, but not between endosperm types. Mean C:N ratios for HGEs were numerically close, but differed (p < 0.05) between the SSO (27.75) and NSO (24.85), NST (24.82), and SST (24.17). C:N was negatively (p < 0.05) correlated with all indices (r = −0.53 with M-Index; −0.42 with the m-Index; and −0.39 with the FeZn-Index). R relationships of C:N with all indices at the HGE level were almost as consistent and large (r > −0.70), but were much smaller (r = −0.30 to −0.47) with the m-Index and FeZn-Index of SSO and SST. At the genotypic level, Nokomis Gold with OE and TE textures, but an NS background, had the smallest and comparable C:N ratios (17.7 and 19.0, respectively), while AR16021-B73 with OE or TE and SS backgrounds had the largest C:N ratios (48.8 and 46.0, respectively). In spite of differences in C:N ratios between genotypes, and in reference to variation accounted for by G × IB(GH); C:N had no significant effects on M-Index; while both the m-Index and FeZn-Index for AR16021-B73 were less impacted by its larger C:N ratio than Nokomis Gold (Figure 3). These differences can be partially explained by IB stage, where 50% of germplasm in AR16021-B73 was advanced to S4, while 55% of germplasm in Nokomis Gold was advanced to S3 only.
As a covariate, C:N effects on single nutrients and their indices (Table 2) can be understood on the basis of interrelationships between C and N with other nutrients. Most of the significant effects of C:N were negative, except for K (0.0) and Cu (1.8%). Potassium is not incorporated into organic compounds [45], while the positive effect on Cu was negligible. However, as indicated by the positive quadratic regression coefficients, most negative effects diminished after C:N reached a nutrient-specific threshold. For example, C:N thresholds for Fe (27.5) and S (35.0) paralleled the respective variation (14.4 and 85.1%) accounted for by C:N ratios. Differences in C and N allocation and the ensuing C:N ratio among HGs explained more variation in all nutrient indices than respective differences in C and N allocation among E types, while less variation was explained in germplasm subjected to sequential inbreeding (S1 to S4) compared to OP germplasm (Table 4). Very few negative (p < 0.05) or non-significant correlations were found. These were mainly in genotypes within the SS heterotic group (e.g., between Cu and K, and each of C and N) (Figure 4). The preponderance of univariate relationships was confirmed, though indirectly, by the small variance (R2) in both nutrients explained by C:N variation (Table 3). These results suggest that selection for target [nutrients] may not reduce densities of other nutrients [39].

4.6. Modeling Color Space, Nutrients and Indices

Natural variation in seed color was associated with seed composition in a wide range of crops [4,22]. Color was used as a visual [41] and analytical [18,32] selection criterion for improving nutritional quality. Most commonly consumed maize is white- or yellow-colored. However, other colors with varying intensities and combinations (e.g., blue, green, orange, purple and red) are found in maize landraces and OPVs (Open Pollinated Varieties) [4,54]. In an earlier study, Jaradat and Goldstein [25] documented large HG- and EO/ET-specific associations between the contents of protein and essential amino acids with several nutrients (e.g., Fe, K, P, S and Zn). Modern maize cultivars, unlike the more colorful (Native American) landraces and OPVs [4], show little variation for kernel color [55]. Historically, the loss of kernel color can be attributed to a combination of natural and artificial selection. However, increased interest in and demand for colored maize has recently prompted research into the genetics, biochemistry and physiology of color formation and its association with nutritional quality.
Contradictory results have been reported on the association between kernel coloration and micronutrient densities, such as Fe, Mn, and Zn [22,45]. Recent reports indicated that large Zn density was associated with orange endosperm and small Fe density with yellow endosperm. It was also suggested that Zn and Fe densities in yellow or purple maize kernels has been reduced due to QPM (Quality Protein Maize) conversion [23,51]. Color space coordinates of most accessions in the current study ranged from L* 2 to 60, a* −6 to 30, and b* 1 to 50. These values are typical of yellow (dent) maize [55]. However, there were several exceptions, especially in a genotype (GQ-N16-N12) characterized by intensely bright orange-colored kernels (Figure 2). The color spectrum of kernels in this genotype had a narrow range of L* (80–83), a* (−2 to −3), and b* (9 to 11). Large values of L* contributed more than b* to discrimination between HGEs (Figure 1) and were reported to be strongly associated with larger Fe, Mn, and Zn densities in beans (Phaseolus vulgaris L.) [22] and Native American maize landraces [4]. The L* color space was associated with one or more large [nutrients] (Figure 5B), and in at least one genotype (GQ-N16-N12) it accounted for 50–60% of variation (R2) in its M-Index and m-Index (Figure 2). Although differences in FeZn-Index due endosperm texture were significant (p < 0.05); the magnitude of these differences depended, to some extent, on the genetic background (e.g., HG) in addition to endosperm texture. Larger differences in FeZn-Indices found between the SSO and SST (0.76 vs. 0.66) than those between the NSO and NST (0.66 vs. 0.61) can be attributed to HG effect (Figure 3C). Nevertheless, the joint variation of kernel color and nutrient densities may provide a practical and inexpensive initial selection step for certain nutrients in diverse germplasm. The underlying genetic variation in nutrient densities and association in relation to kernel color [22] was evident and significant in our study, but not for all nutrients (Figure 6). Despite the narrow color spectrum in this germplasm in comparison with Native American or landrace maize [4], joint patterns of color and nutrient density variation were evident at the genotypic level, and were mostly associated with endosperm texture (Figure 6B). Frequency distribution of R2, especially >0.30 (Figure 6A), in conjunction with clusters identified in Figure 5, offer an opportunity to classify and select genotypes with specific color patterns and their associated large nutrient densities.

5. Conclusions

There is ample genetic potential in 1348 accessions of 13 maize genotypes with diverse genetic background for simultaneous improvement of essential micronutrients and macronutrients without compromising densities of other nutrients. Genotype-, heterotic group-, and endosperm-specific nutrient associations were documented as well as data and interpretation of how densities of individual nutrients and groups of nutrients were affected by physical and biochemical constituents of the maize kernel. Starch and protein content had respectively large negative or positive effects on ion densities and this was generally reflected in relationships with C:N ratios. Parallel variation of specific kernel color descriptors and nutrient densities found in this germplasm may provide a practical and inexpensive initial selection step for certain nutrients. Due to correlative patterns, selection for densities of micronutrients is likely to increase rather than decrease densities of other micronutrients. The breeding stocks in this study could be part of a durable solution for increasing micronutrient densities in maize. The breeding lines in this study harbor tremendous genetic diversity for a wide range of nutritional traits. Target densities of macro- and micronutrients to meet minimum human nutritional requirements are readily available. Target nutritional densities of Fe (60 mg kg−1) and Zn (38 mg kg−1) may be achievable through focused breeding that utilizes genetic variation, such as that found in this study.

Author Contributions

A.A.J. and W.G. conceived and designed this experiment; A.A.J. performed this experiment, analyzed the data and wrote this manuscript.

Conflicts of Interest

The authors declare no conflict of interest.

Abbreviations

a*Color space dimension for red–green
b*Color space dimension for yellow–blue
β1Linear regression coefficient
β2Quadratic regression coefficient
CIECommission International de l’Eclairage
C.V.Coefficient of variation
D2Squared Mahalanobis distance (dimensionless)
DNMRTDuncan’s multiple range test
FeZn-IndexIron + zinc Index
GGenotype
GPCGrain protein content
HGHeterotic group
IBInbreeding
©©ICP-MSInductively coupled plasma-mass spectrometry
L*Color space dimension for light–dark
“Mean”Statistic based on measured variable (e.g., nutrient density)
M-IndexMacronutrient index
m-IndexMicronutrient index
NSNon-stiff stalk heterotic group
NSONon-stiff stalk with opaque endosperm
NSTNon-stiff stalk with translucent endosperm
[Nutrient]Density in mg kg−1 of a nutrient
OEOpaque endosperm texture
OPVOpen pollinated variety
PLSRPartial least squares regression
Q2YValidation coefficient of determination in PLSR model
R2Coefficient of determination
R2XCoefficient of determination for independent variable(s) in PLSR model
R2YCalibration coefficient of determination for dependent variable in PLSR model
REMLRestricted maximum likelihood method of variance estimation
“Response”Statistic predicted by PLSR model (e.g., nutrient density)
RMSEResidual mean squares error estimated by PLSR model
S.D.Standard deviation
S1–S4Inbreeding (selfing) for 1 to 4 years
NSNon-stiff stalk heterotic group
SSStiff stalk heterotic group
SSOStiff-stalk heterotic group with opaque endosperm
SSTStiff stalk heterotic group with translucent endosperm
SW-WShapiro-Wilk statistical test
TETranslucent endosperm texture

References

  1. Yadav, U.P.; Ayre, B.G.; Bush, D.R. Transgenic approaches to altering carbon and nitrogen partitioning in whole plants: Assessing the potential to improve crop yields and nutritional quality. Front. Plant Sci. 2015, 6, 275. [Google Scholar] [CrossRef] [PubMed]
  2. Sekhon, R.S.; Hirsch, C.N.; Childs, K.L.; Breitzman, M.W.; Kell, P.; Duvick, S.; Spalding, E.P.; Buell, C.R.; de Leon, N.; Kaeppler, S.M. Phenotypic and transcriptional analysis of divergently selected maize Populations reveals the role of developmental timing in seed size determination. Plant Physiol. 2014, 165, 658–669. [Google Scholar] [CrossRef] [PubMed]
  3. Nuss, E.T.; Tanumihardjo, S.A. Maize: A paramount staple crop in the context of global nutrition. Compr. Rev. Food Food Saf. 2010, 9, 417–436. [Google Scholar] [CrossRef]
  4. Jaradat, A.A. Perceptual distinctiveness in Native American maize (Zea mays L.) landraces has practical implications. Plant Genet. Resour. 2013, 11, 266–278. [Google Scholar] [CrossRef]
  5. Ortiz-Monasterio, J.I.; Palacios-Rojas, N.; Meng, E.; Pixley, K.; Trethowan, R.; Peña, R.J. Enhancing the mineral and vitamin content of wheat and maize through plant breeding. J. Cereal Sci. 2007, 46, 293–307. [Google Scholar] [CrossRef]
  6. Loladze, I. Hidden shift of the ionome of plants exposed to elevated CO2 depletes minerals at the base of human nutrition. eLife 2014, e02245. [Google Scholar] [CrossRef] [PubMed]
  7. Myers, S.S.; Zanobetti, A.; Kloog, I.; Huybers, P.; Leakey, A.D.P.; Bloom, A.J. Increasing CO2 threatens human nutrition. Nature (London) 2014, 510, 139–142. [Google Scholar] [CrossRef] [PubMed]
  8. Asaro, A.; Ziegler, G.; Ziyomo, C.; Hoekenga, O.A.; Dilkes, B.P.; Baxter, I. The interaction of genotype and environment determines variation in the maize kernel ionome. G3 Genes Genomes Genet. 2016, 6, 4175–4183. [Google Scholar] [CrossRef] [PubMed]
  9. Fageria, V.D. Nutrient interactions in crop plants. J. Plant Nutr. 2001, 28, 1269–1290. [Google Scholar] [CrossRef]
  10. Liu, K. Effects of particle size distribution, compositional and color properties of ground corn on quality of distillers dried grains with solubles (DDGS). Bioresour. Technol. 2009, 100, 4433–4440. [Google Scholar] [CrossRef] [PubMed]
  11. White, P.J.; Veneklaas, E.J. Nature and nurture: The importance of seed phosphorus content. Plant Soil 2012, 357, 1–8. [Google Scholar] [CrossRef]
  12. Prassanna, B.M.; Mazumdar, S.; Chakraborty, M.; Hossain, F.; Manjaiah, K.M.; Agrawal, P.K.; Guleria, S.K.; Gupta, H.S. Genetic variability and genotype × environment interactions for kernel iron and zinc concentrations in maize (Zea mays) genotypes. Indian J. Agric. Sci. 2011, 81, 704–711. [Google Scholar]
  13. Gupta, H.S.; Hossain, F.; Muthusamy, V. Biofortification of maize: An Indian perspective. Indian J. Genet. 2015, 75, 1–22. [Google Scholar] [CrossRef]
  14. Ancuceanu, R.; Dinu, M.; Hovanet, M.V.; Anghel, A.I.; Popescu, C.V.; Negreş, S. A survey of plant iron content—A semi-systematic review. Nutrients 2015, 7, 10320–10351. [Google Scholar] [CrossRef] [PubMed]
  15. Gomez-Becerra, H.F.; Erdemb, H.; Yazici, A.; Tutus, Y.; Torun, B.; Ozturk, L.; Cakmak, I. Grain concentrations of protein and mineral nutrients in a large collection of spelt wheat grown under different environments. J. Cereal Sci. 2010, 52, 342–349. [Google Scholar] [CrossRef]
  16. Dwivedi, S.; Sahrawat, K.; Upadhyaya, H.; Ortiz, R. Food, nutrition and agrobiodiversity under climate change. Adv. Agron. Ed. 2013, 120, 1–128. [Google Scholar]
  17. Gu, R.; Chen, F.; Liu, B.; Wang, X.; Liu, J.; Li, P.; Pan, Q.; Pace, J.; Soomro, A.A.; Lübberstedt, T.; et al. Comprehensive phenotypic analysis and quantitative trait locus identification for grain mineral concentration, content, and yield in maize (Zea mays L.). Theor. Appl. Genet. 2015, 128, 1777–1789. [Google Scholar] [CrossRef] [PubMed]
  18. Salt, D.E.; Baxter, I.; Lahner, B. Ionomics and the study of the plant ionome. Annu. Rev. Plant Biol. 2008, 59, 709–733. [Google Scholar] [CrossRef] [PubMed]
  19. Baxter, I.R. Should we treat the ionome as a combination of individual elements, or should we be deriving novel combined traits? J. Exp. Bot. 2015, 66, 2127–2131. [Google Scholar] [CrossRef] [PubMed]
  20. Mallikarjuna, M.G.; Thirunavukkarasu, N.; Hoassain, F.; Bhat, J.S.; Jha, S.K. Stability performance of inductively coupled plasma mass spectrometry-Phenotyped kernel minerals concentration and grain yield in maize in different agro-climatic zones. PLoS ONE 2015, 10, e0139067. [Google Scholar] [CrossRef] [Green Version]
  21. Mercado-Luna, A.; Rico-Garcia, E.; Lara-Herrera, A.; Soto-Zarzua, G.; Ocampo-Velazquez, R.; Guevara-Gonzalez, R.; Herrera-Ruiz, G.; Torres-Pachecco, I. Nitrogen determination on tomato (L. esculentum Mill.) seedlings by color image analysis (RGB). Afr. J. Biotechnol. 2010, 9, 5326–5332. [Google Scholar]
  22. Hacisalihoglu, G.; Settles, A.M. Natural variation in seed composition of 91 common bean genotypes and their possible association with seed color. J. Plant Nutr. 2013, 36, 772–780. [Google Scholar] [CrossRef]
  23. Asjim, J.H.; Richuwong, S.; Scott, M.P.; Jane, J.L. Kernel composition, starch structure, and enzyme digestibility of opaque-2 maize and quality protein maize. J. Agric. Food Chem. 2009, 57, 2049–2055. [Google Scholar] [CrossRef] [PubMed]
  24. Gustafson, T.J.; de Leon, N. Genetic analysis of maize (Zea mays L.) endosperm vitreousness and related hardness traits in the intermated B73 × Mo17 recombinant inbred line population. Crop Sci. 2010, 50, 2318–2327. [Google Scholar] [CrossRef]
  25. Jaradat, A.A.; Goldstein, W. Diversity of maize kernels from a breeding program for protein quality: I. Physical, biochemical, nutrient, and color traits. Crop Sci. 2013, 53, 956–976. [Google Scholar] [CrossRef]
  26. Jaradat, A.A.; Goldstein, W. Diversity of maize kernels from a breeding program for protein quality. II. Correlatively expressed functional amino acids. Crop Sci. 2015, 54, 2639–2662. [Google Scholar] [CrossRef]
  27. Germplasm Enhancement of Maize. Available online: www.public.iastate.edu/~usda-gem/GEM_Project/GEM_Project.htm (accessed on 17 July 2017).
  28. Commission International de l’Eclairage (CIE). Part 4: CIE 1976 L*a*b* Colour Space; CIE Standard S014-4/E: 2007; CIE: Vienna, Austria, 2007. [Google Scholar]
  29. JMP® Pro; Version 13.1.0; Statistical Analysis System; SAS (The Statistical Analysis System) Institute Inc.: Cary, NC, USA, 2016.
  30. TIBCO (The Information Bus Company) Statistica; Version 13.3; Data Analysis Software System; TIBCO (The Information Bus Company) Software Inc.: Palo Alto, CA, USA, 2017.
  31. Kirwan, G.M.; Johansson, E.; Kleemann, R.; Verheij, E.R.; Wheelock, Å.M.; Goto, S.; Tryg, J.; Wheelock, C.E. Building multivariate systems biology models. Anal. Chem. 2012, 84, 7064–7071. [Google Scholar] [CrossRef] [PubMed]
  32. Wen, W.; Brotman, Y.; Willmitzer, L.; Yan, J.; Fernie, A.R. Broadening our portfolio in the genetic improvement of maize chemical composition. Trends Genet. 2016, 32, 459–469. [Google Scholar] [CrossRef] [PubMed]
  33. Hirschi, K.D. Nutrient biofortification of food crops. Annu. Rev. Nutr. 2009, 29, 401–421. [Google Scholar] [CrossRef] [PubMed]
  34. De Valença, A.W.; Bake, A.; Brouwer, I.D.; Giller, K.E. Agronomic biofortification of crops to fight hidden hunger in sub-Saharan Africa. Glob. Food Secur. 2017, 12, 8–14. [Google Scholar] [CrossRef]
  35. Benke, A.; Urbany, C.; Marsian, J.; Shi, R.; von Wirén, N.; Stich, B. The genetic basis of natural variation for iron homeostasis in the maize. BMC Plant Biol. 2014, 14, 12. [Google Scholar] [CrossRef] [PubMed]
  36. Shobhana, V.G.; Senthil, N.; Kalpana, K.; Abirami, B.; Sangeetha, J.; Saranya, B.; Jeevan, R.J.; Tamilkumar, P.; Nagarajan, P.; Velu, V.; et al. Comparative studies on the iron and zinc contents estimation using atomic absorption spectrophotometer and grain staining techniques (Russian Blue and DTZ). J. Plant Nutr. 2013, 36, 329–342. [Google Scholar] [CrossRef]
  37. Vasconcelos, M.W.; Gruissem, W.; Bhullar, N.K. Iron biofortification in the 21st century: Setting realistic targets, overcoming obstacles, and new strategies for health nutrition. Curr. Opin. Biotechnol. 2017, 44, 8–15. [Google Scholar] [CrossRef] [PubMed]
  38. Tako, E.; Hoekenga, O.A.; Kochian, L.V.; Glahn, R.P. High bioavailablilty iron maize (Zea mays L.) developed through molecular breeding provides more absorbable iron in vitro (Caco-2 model) and in vivo (Gallus gallus). Nutr. J. 2013, 12, 3. [Google Scholar] [CrossRef] [PubMed]
  39. Messias, R.; Galli, V.; Silva, S.; Schirmer, M.; Rombaldi, C.V. Micronutrient and functional compounds biofortification of maize grains. Crit. Rev. Food Sci. Nutr. 2015, 55, 123–139. [Google Scholar] [CrossRef] [PubMed]
  40. Pucher, A.; Høgh-Jensen, H.; Gondah, J.; Hash, C.T.; Haussmann, B.I.G. Micronutrient density and stability in West African pearl millet—Potential for biofortification. Crop Sci. 2015, 54, 1709–1720. [Google Scholar] [CrossRef]
  41. Welch, R.M.; Graham, R.D. Breeding crops for enhanced micronutrient content. Plant Soil 2002, 245, 205–214. [Google Scholar] [CrossRef]
  42. Hänsch, R.; Mendel, R.R. Physiological functions of mineral micronutrients (Cu, Zn, Mn, Fe, Ni, Mo, B, Cl). Curr. Opin. Plant Biol. 2009, 12, 259–266. [Google Scholar] [CrossRef] [PubMed]
  43. Zhang, M.; Pinson, S.R.M.; Tarpley, L.; Huang, X.-Y.; Lahner, B.; Yakubova, E.; Baxter, I.; Guerinto, M.L.; Salt, D.E. Mapping and validation of quantitative trait loci associated with concentrations of 16 elements in unmilled rice grain. Theor. Appl. Genet. 2014, 127, 137–165. [Google Scholar] [CrossRef] [PubMed]
  44. Minkir, A. Genetic variation for grain mineral content in tropical-adapted maize inbred lines. Food Chem. 2008, 110, 454–464. [Google Scholar] [CrossRef] [PubMed]
  45. Chandler, K.; Lipka, A.E.; Owens, B.F.; Li, H.; Buckler, E.S.; Rocheford, T.; Gore, M.A. Genetic analysis of visually scored orange kernel color in maize. Crop Sci. 2013, 53, 189–200. [Google Scholar] [CrossRef]
  46. Ourya, F.-X.; Leenhardt, F.; Remesy, C.; Chanliaud, E.; Duperrier, B.; Balfourier, F.; Charmet, G. Genetic variability and stability of grain magnesium, zinc and iron concentrations in bread wheat. Eur. J. Agron. 2006, 25, 177–185. [Google Scholar] [CrossRef]
  47. Pinson, S.R.M.; Tarpley, L.; Yan, Y.; Yeater, K.; Lahner, B.; Yakubova, E.; Huang, X.-Y.; Zhang, M.; Guerinot, M.L.; Salt, D.E. Worldwide genetic diversity for mineral element concentrations in rice grain. Crop Sci. 2015, 55, 294–311. [Google Scholar] [CrossRef]
  48. Gambin, B.L.; Borras, L.; Otegui, M.E. Is maize kernel size limited by its capacity to expand? Maydica 2007, 52, 431–441. [Google Scholar]
  49. Kutman, U.B.; Yildiz, B.; Cakmak, I. Improved nitrogen status enhances zinc and iron concentrations both in the whole grain and the endosperm fraction of wheat. J. Cereal Sci. 2010, 53, 118–125. [Google Scholar] [CrossRef]
  50. Amtmann, A.; Armengaud, P. Effects of N, P, K, and S on metabolism: New knowledge gained from multi-level analysis. Curr. Opin. Plant Biol. 2009, 12, 275–283. [Google Scholar] [CrossRef] [PubMed]
  51. Pii, Y.; Cesco, S.; Mimmo, T. Shoot ionome to predict the synergism and antagonism between nutrients as affected by substrate and physiological status. Plant Physiol. Biochem. 2015, 94, 48–56. [Google Scholar] [CrossRef] [PubMed]
  52. Carvalho, I.R.; Nardino, M.; de Pelegrin, A.J.; Hoffmann, J.F. Estimate of genetic parameters in bioactive and micronutrients compounds of maize. Afr. J. Agric. Res. 2016, 11, 3123–3133. [Google Scholar] [CrossRef]
  53. Suri, D.J.; Tanumihardjo, S.A. Effects of different processing methods on the micronutrient and phytochemical contents of maize: From A to Z. Compr. Rev. Food Sci. Food Saf. 2016, 15. [Google Scholar] [CrossRef]
  54. Somavat, P.; Lib, Q.; de Mejiab, E.G.; Liua, W.; Singh, V. Coproduct yield comparisons of purple, blue and yellow dent corn for various milling processes. Ind. Crops Prod. 2016, 87, 266–272. [Google Scholar] [CrossRef]
  55. Akinwale, R.O.; Adewopo, O.A. Grain iron and zinc concentrations and their relationship with selected agronomic traits in early and extra-early Maize. J. Crop Improv. 2016, 30, 641–656. [Google Scholar] [CrossRef]
Figure 1. Percent correct classification and significant (p < 0.05) squared Mahalanobis distances (D2) between four combinations of heterotic groups–endosperm types (NSO, NST, SSO, SST) of maize. Variance, explained by two canonical discriminant roots based on loadings of kernel physical-biochemical constituents and color space (L*, a*, and b*) coordinates, along with a scatter diagram of [nutrients] estimated in kernels of 1348 maize accessions used in a breeding program for protein quality (see list of abbreviations) is also shown. Misclassified accessions: 34% of the NSO were misclassified as NST (24%) and SST (10%); 35% of the NST were misclassified as N (5%) SO (30%) and SST; 7% of the SSO were misclassified as SST; and 26% of the SST were misclassified as NST (20%) and NSO (10%). NSO: non-stiff stalk with opaque endosperm; NST: non-stiff stalk with translucent endosperm; SSO: stiff stalk heterotic group with opaque endosperm; SST: stiff stalk heterotic group with translucent endosperm.
Agronomy 08 00009 g001
Figure 2. Hierarchical two-way clustering of 13 maize genotypes classified into stiff (SS) and non-stiff stalk (NS) heterotic groups and opaque (O) and translucent (T) endosperm types on the basis of variance (R2) in a normalized macronutrient or micronutrient index explained by kernel physical and biochemical constituents, as well as kernel color spaces (L*, a*, and b*) of 1348 maize accessions used in a breeding program for protein quality (R2 values larger than 0.05 are significant; p < 0.05). L*: color space dimension for light–dark; a*: color space dimension for red–green; b*: color space dimension for yellow–blue.
Agronomy 08 00009 g002
Figure 3. Box-plots and mean separation between average indices of macronutrients (A), micronutrients (B), and the (Fe + Zn): micronutrient Index ratio (C) (i.e., variables) based on normalized nutrient densities in kernels of 1348 maize accessions used in a breeding program for protein quality. Means of the NSO, NST, SSO, and SST followed by the same letter in (AC) do not differ significantly (p < 0.05); genotypic means within NSO, NST, SSO, or SST (individually), followed by different capital letters differ significantly (p < 0.05), and means of the same genotype with opaque or translucent endosperm followed by different small letters, differ significantly (p < 0.05).
Agronomy 08 00009 g003
Figure 4. Two-way clusters based on three indices based on correlation coefficients between macronutrients (M-Index), micronutrients (m-Index), and the FeZn-Index (A); joint clustering of nutrients and HGE-nutrient combinations (B); and mean, S.D. and probability distribution of same correlation coefficients for each HGE (C).
Agronomy 08 00009 g004
Figure 5. Hierarchical two-way clustering providing selection criteria based on associations (product moment correlation coefficients) between combined color space coordinates and each of 11 nutrient densities and their indices (A), as well as the light–dark, L* (B), red–green, a* (C), and yellow–blue, b* (D) color space coordinates in kernels of 1348 maize accessions used in a breeding program for protein quality. r values < |0.05| are not significant.
Agronomy 08 00009 g005aAgronomy 08 00009 g005b
Figure 6. Frequency distribution of total variation in nutrient density (A) explained by all three (L*a*b*) and individual color space coordinates, as well as variance in nutrient density partitioned among genotypes within endosperm types in response to inbreeding G × IB(E), and among genotypes within heterotic groups–endosperm groups G(HE), and the same statistics for each nutrient (B).
Agronomy 08 00009 g006
Table 1. Basic statistics and percent significant pairwise differences (p < 0.05) between 13 maize genotypes for kernel nutrient (mg kg−1) contents classified into four combinations of heterotic groups and endosperm types and based on 1348 maize accessions used in a breeding program for protein quality. M-Index: macronutrient index; m-Index: micronutrient index. C.V.: coefficient of variation. Min.: Minimum. Max.: Maximum. S.D.: standard deviation. SE: standard error of the mean. SW-W: Shapiro-Wilk Test of Normality.
GroupingNutrientMean (mg kg−1)Min.Max.S.D.SEC.V. %Skewness (SE = 0.067)SW-WpPercent Significant Pairwise Differences (<0.05) between Genotypes
MacronutrientsCarbon455.0449.6460.01.860.0514.00.1720.9960.001523.0
Calcium445.2335.4556.953.96.116.10.9820.9430.000128.0
Magnesium1397.61027.81825.8145.53.96210.00.0670.9980.105036.0
Nitrogen19.010.527.32.970.08116.0−0.2490.9870.000130.0
Potassium3626.42332.55166.8433.011.7812.00.3210.9930.000150.0
Phosphorus3453.42556.04505.7350.09.52910.00.0830.9980.209040.0
Sulfur1242.5824.51658.2152.04.13812.0−0.2630.9900.000128.0
Mean 10,638.9 32.3
M-Index 0.780.670.900.050.0076.00.2380.9960.000743.0
MicronutrientsCopper2.70.928.70.980.01736.01.9690.7800.000126.0
Iron23.613.054.74.350.11818.00.5280.9820.000126.0
Manganese6.723.210.71.370.03720.00.1150.9960.002735.0
Zinc23.915.141.93.350.09116.00.5000.9860.000119.0
Mean 56.92 26.5
m-Index 0.610.410.790.070.00911.00.5150.9860.000123.0
Table 2. Level of significance in the analysis of variance p(F) due to fixed factors, and significant variance p(z) due to random factors and covariates in variance component analysis of macro- and micro-nutrients and their indices estimated in kernels of 1348 maize accessions classified into 13 genotypes and four heterotic groups–endosperm type combinations from a breeding program for protein quality.
FactorsCovariateResponse Variables
IndexMacronutrientsMicronutrients
Macro-NutrientsMicro-NutrientsFeZnCaKMgNPSCuFeMnZn
Fixed Univariate R2 (%) if the effect of a fixed factor was significant (F-probability < 0.05)
Heterotic group (HG)9.06.43.3 19.111.21.57.0
Endosperm (E) 4.18.9 9.11.82.21.9 14.08.22.47.8
Inbreeding (IB) 12.715.339.235.437.65.022.77.06.531.531.61.69.8
Genotype (G) 32.741.549.442.056.923.630.028.921.254.452.622.937.0
Percent variation (R2) if β1, β2, or both were significant (p < 0.05); #: positive effect, §: negative effect on nutrient
Kernel
C:N ratio28.3 §20.1 §#22.2 §#35.7 §§ 51.6 §N/A48.7 §85.1 §#1.8 ##14.4 §#50.8 §22.9 §#
Amino acids26.9 #17.9 #19.3 #29.5 ##3.4 ##41.7 #62.0 40.0 #58.4 # 11.8 #41.3 #21.1 #
Protein35.6 ##25.5 #25.3 ##38 #5.1 #56.0 ##84.2 ##53.5 ##79.5 #1.3 ##17.4 ##55.6 ##29.3 ##
Oil 1.8 # 2.5 §12.5 # 5.6 § 1.4 §7.8 #2.1 ## 1.6 #
Starch41.2 §#30.2 §#27.2 §37.4 12.2 §#54.6 §#57.0 §§52.9 §#63.4 §4.5 §#20.9 §54.4 §#34.4 §#
Moisture16.8 §#13.3 §#9.4 §6.5 §#34.6 §8.5 §#6.4 ##9.3 §#2.6 §#20.5 §#10.2 §#8.9 §#14.6 §#
Density××5.6 §§4.1 §§10.5 §§4.8 §§12.5 §§2.5 §§3.1 #2.8 §§ 9.6 §§3.0 §§2.6 §§4.7 §§
Weight7.1 §2.5 §#6.3 §4.2 §17.0 §3.0 §3.5 ##3.5 § 7.8 §#3.4 §#2.7 §#3.2 §#
Volume5.9 § 5.2 #2.1 §3.8 § 3.1 § 3.8 §#
Random Percent variation explained by random factors if z < 0.05
E(HG) 7.27.5 3.610.912.211.614.3 16.27.58.27.5
G(HG) 33.77.925.246.3 14.3 20.144.233.9 31.1
IB(HG) 9.76.826.830.411.0 31.2 18.6 15.2 2.8
G × IB(HG) 38.57.941.39.58.543.14.547.76.69.75.942.610.2
Total 52.455.976.068.776.755.361.662.045.370.162.550.851.6
Table 3. Variance (adjusted R2) due to the linear and quadratic effect of C:N ratio on macro- and micronutrients and their indices in kernels of 1348 accessions classified into four heterotic groups–endosperm types. RMSE: Residual mean squares error estimated by the partial least squares regression (PLSR) model. HG: heterotic group. SS: Stiff stalk heterotic group. NS: Non-stiff stalk heterotic group.
HGENutrientMean (mg kg−1)S.D. Response (mg kg−1)RMSE (mg kg−1)Interceptβ1β2Adjusted R2
SSOCalcium445.762.7455.254.4664.8−0.68 *−0.010.55
Potassium4006.0 a330.03680.0395.04703.0−24.3 *−1.20.09
Magnesium1447.0 a77.01410.0153.52220.0−27.7 *−0.230.73
Phosphorus3572.0 a190.03485.0371.05407.0−65.8 *−0.610.71
Sulfur1237.0 ab52.01248.3152.02167.0−33.5 *−0.060.90
Copper2.5 a0.512.50.412.320.005−0.00040.00
Iron28.0 a4.323.73.537.2−0.33 *0.0020.10
Manganese7.3 a0.76.821.414.4−0.25 *−0.0020.70
Zinc27.0 a2.724.13.038.0−0.39 *−0.0020.29
M-Index0.79 a0.050.7890.071.11−0.01 *−0.00020.54
m-Index0.75 a0.10.7530.111.07−0.01 *−1.980.22
SSTCalcium445.258.3445.243.6549.6−0.14 *−0.05 *0.19
Potassium3485.0 c463.03485.3509.02430.048.7 *−5.7 *0.17
Magnesium1395.0 bc106.01394.6128.21717.0−12.4 *−1.1 *0.32
Phosphorus3438.0 bc264.03438.63.114136.0−26.4 *−2.9 *0.28
Sulfur1270.0 a57.01269.5142.01948.0−27.9 *−0.28 *0.84
Copper2.02 b0.51.580.610.290.06 *−0.002 *0.15
Iron24.1 b3.724.13.8730.3−0.27 *0.010.08
Manganese6.7 b0.986.731.29.94−0.13 *−0.009 *0.33
Zinc23.9 b2.824.03.028.3−0.17 *−0.0080.09
M-Index0.74 c0.070.7370.070.79−0.001 Cu*−0.0008 *0.10
m-Index0.66 b0.090.6560.090.81−0.006 *−0.00010.08
NSOCalcium465.253.0445.254.4565.7−0.82 *0.0090.52
Potassium3680.0 b345.03680.0395.34933.0−51.2 *1.710.24
Magnesium1410.0 b74.01410.0153.52275.0−34.9 *0.45 *0.77
Phosphorus3484.0 b189.03485.0371.15540.0−82.9 *1.09 *0.74
Sulfur1248.0 ab36.21248.3152.02194.0−38.0 *0.29 *0.94
Copper1.95 b0.572.160.332.43−0.037 *0.003 *0.17
Iron23.7 b2.6523.73.538.6−0.6 *0.02 *0.43
Manganese6.8 b0.76.821.414.9−0.33 *0.005 *0.78
Zinc24.0 b1.724.03.039.4−0.62 *0.014 *0.64
M-Index0.76 b0.050.7550.081.15−0.02 *0.0003 *0.61
m-Index0.65 b0.060.6520.0921.11−0.019 *0.0004 *0.59
NSTCalcium444.92.4445.043.7563.1−0.74 *0.010.58
Potassium3555.0 c290.03555.0335.04637.0−44.8 *2.26 *0.25
Magnesium1374.0 c65.11374.6146.02213.5−34.0 *0.6 *0.80
Phosphorus3402.0 c163.03402.0349.05383.0−80.4 *1.44 *0.78
Sulfur1222.0 b36.01222.5153.02174.0−38.4 *0.38 *0.94
Copper2.00 b0.862.360.492.08−0.03 *0.004 *0.19
Iron21.7 c2.721.83.838.8−0.7 *0.024 *0.50
Manganese6.4 c0.66.41.414.4−0.32 *0.006 *0.81
Zinc22.6 c1.822.63.138.7−0.66 *0.02 *0.65
M-Index0.73 c0.040.7350.071.1−0.02 *0.0004 *0.66
m-Index0.60 c0.060.6050.0971.1−0.02 *0.0006 *0.61
Means followed by the same letter do not differ significantly at the 5% level of probability. * Significant at the 5 level of probability.
Table 4. Variance (adjusted R2) due to linear and quadratic effects of C:N ratio on macro- and micronutrients and their indices in kernels of 1348 maize accessions in response to open pollinating or one or more cycles of inbreeding. OP: Open Pollinated. S1: Selfing for 1 year. S2: Selfing for 2 years. S3: Selfing for 3 years. S4: Selfing for 4 years.
InbreedingNutrientMeanS.D.ResponseRMSEInterceptβ1β2Adj. R2
OPCalcium442.7 bc58.8442.761.33584.3−0.74 *0.0120.77
Potassium3745.0 ab293.03745.0250.05140.0−48.6 *2.60.28
Magnesium1364.0 ab134.31365.062.52392.0−35.3 *0.680.78
Phosphorus3362.0 b319.03362.0152.05787.0−83.3 *1.650.77
Sulfur1181.2 bc139.01180.036.02337.0−39.5 *0.430.93
Copper1.72 d0.42.50.364.14−0.058 *0.0040.24
Iron28.8 a3.3329.02.0551.6−0.78 *0.030.62
Manganese6.65 ab1.36.650.6116.5−0.34 *0.0070.78
Zinc26.5 a3.026.51.847.3−0.72 *00220.64
M-Index0.742 ab0.070.740.0381.2−0.12 *0.00040.66
m-Index0.749 a0.0930.750.061.39−0.22 *0.00070.64
S1Calcium457.0 a53.4451.456.8560.0−0.74 *0.033 *0.71
Potassium3780.0 a350.03386.0295.04527.0−47.3 *4.7 *0.29
Magnesium1423.4 a147.01342.075.02234.0−35.3 *1.12 *0.77
Phosphorus3527.0 a350.03303.0184.05402.0−83.1 *2.8 *0.76
Sulfur1241.6 b151.01220.045.82240.0−39.8 *0.58 *0.92
Copper2.05 b0.51.560.42.1−0.03 *0.006 *0.18
Iron21.9 d3.625.72.645.6−0.82 *0.025 *0.61
Manganese6.84 a1.46.340.7415.0−0.34 *0.01 *0.77
Zinc23.3 c0.0724.32.242.8−0.73 *0.03 *0.63
M-Index0.767 a0.0730.710.051.1−0.016 *0.0008 *0.65
m-Index0.621 c0.10.670.071.15−0.023 *0.0008 *0.62
S2Calcium441.4 c63.4445.062.1564.0−0.68 *0.008 *0.59
Potassium3386.5 c350.03780.0315.04777.0−41.0 *1.58 *0.19
Magnesium1341.3 b159.21423.077.32245.0−33.3 *0.42 *0.72
Phosphorus3302.5 b377.03527.0190.5462.0−78.4 *1.0 *0.71
Sulfur1220.7 bc168.61242.044.02188.0−38.2 *0.26 *0.91
Copper1.70 d0.561.570.472.90−0.042 *0.005 *0.10
Iron25.7 b4.221.82.4639.3−0.71 *0.02 *0.54
Manganese6.35 b1.556.840.7414.7−0.32 *0.0042 *0.72
Zinc24.3 b3.6423.32.139.4−0.65 *0.013 *0.57
M-Index0.711 cd0.080.770.051.13−0.015 *0.0003 *0.57
m-Index0.673 b0.110.620.074.58−0.02 *0.0004 *0.56
S3Calcium442.5 b58.76443.161.5556.2−0.65 *0.010.52
Potassium3682.0 b348.62960.0290.03525.0−27.9 *0.420.05
Magnesium1367.7 b130.11365.071.01981.0−30.2 *0.110.52
Phosphorus3370.3 b142.33345.0173.04790.0−71.0 *0.230.50
Sulfur1198.4 c142.31342.039.02090.0−36.7 *0.060.84
Copper2.61 a0.641.060.361.73−0.033 *0.0020.04
Iron28.1 a3.6324.42.137.4−0.64 *0.00010.35
Manganese6.65 ab1.266.540.6812.5−0.29 *0.00090.52
Zinc26.1 a3.123.31.935.0−0.58 *0.00130.35
M-Index0.739 b0.060.690.040.95−0.13 *0.00010.33
m-Index0.733 a0.10.640.051.0−0.018 *0.00010.35
S4Calcium443.1 b2.14442.662.0555.2−0.45 *0.0040.45
Potassium2959.1 d296.03680.0350.03668.0−0.08 *0.880.00
Magnesium1365.4 b102.51367.092.02000.0−22.5 *0.20.50
Phosphorus3345.7 b245.33370.0220.04842.0−52.3 *0.490.48
Sulfur1342.6 a99.01198.058.02085.0−31.4 *0.090.83
Copper1.85 c0.372.240.621.360.03 *0.00060.05
Iron24.4 c2.628.13.436.8−0.31 *0.0040.12
Manganese6.55 ab1.06.650.9212.59−0.21 *0.0020.47
Zinc23.3 c2.3826.02.835.0−0.32 *0.0050.17
M-Index0.693 d0.0540.740.050.97−0.008 *0.00010.27
m-Index0.644 bc0.0730.730.091.0−0.009 *0.00010.15
* Significant at the 5% level of probability. Means followed by the same letter do not differ significantly at the 5% level of probability.
Table 5. Coefficients and PLSR validation model (Q2Y) for centered and scaled data in predicting FeZn-Index in heterotic groups, endosperm types, inbreeding, and maize genotypes as function of macronutrients in kernels of 1348 maize accessions from a breeding program for quality protein. R2X: coefficient of determination for independent variables(s) in the PLSR model.
GroupingSub-GroupsCentered and Scaled PLSR Coefficients for the MacronutrientsR2XQ2YFeZn-Index
CCaKMgNPS Measured (S.D.)Predicted (RMSE)
Heterotic Group (HG)Stiff Stalk (SS)1.030.43−0.530.43−2.82−0.291.840.650.500.69 ± 0.110.69 ± 0.07
Non-Stiff Stalk (NS)0.660.17−2.580.08−3.524.880.490.840.750.62 ± 0.090.62 ± 0.05
Endosperm (E)Opaque (O)1.050.55−0.530.46−2.59−0.101.680.790.540.69 ± 0.110.69 ± 0.07
Translucent (T)0.720.17−2.860.09−3.734.400.480.750.670.62 ± 0.100.62 ± 0.06
HGESSO1.090.50−0.510.55−2.75−0.071.740.800.500.75 ± 0.110.75 ± 0.08
SST0.690.12−3.930.04−4.384.680.430.650.540.66 ± 0.090.65 ± 0.07
NSO0.570.11−3.24−0.01−3.846.000.440.830.750.65 ± 0.090.64 ± 0.06
NST0.750.20−2.270.13−3.504.430.530.850.780.60 ± 0.090.60 ± 0.05
Inbreeding (IB)Open pollinated (OP)0.18−0.10−2.520.16−3.365.370.620.920.940.74 ± 0.090.75 ± 0.03
One Year (S1)0.620.13−2.470.07−3.384.750.440.870.900.73 ± 0.090.73 ± 0.04
Two Years (S2)0.550.09−2.25−0.13−3.324.870.450.890.940.67 ± 0.110.67 ± 0.03
Three Years (S3)1.140.41−0.500.49−2.77−0.161.680.810.830.62 ± 0.100.64 ± 0.04
Four Years (S4)0.550.11−2.830.09−3.014.480.420.840.920.64 ± 0.070.64 ± 0.02
Genotypes1895-DK212-N11a0.900.23−2.340.07−3.844.240.460.840.920.62 ± 0.080.62 ± 0.08
AR16021-B731.250.49−0.480.62−3.05−0.061.800.870.710.75 ± 0.100.75 ± 0.04
CHIS740-S14-S120.790.16−2.560.18−4.255.090.260.850.910.60 ± 0.070.59 ± 0.01
CH05015-Mo170.840.28−2.69−0.08−4.425.780.550.890.750.65 ± 0.080.64 ± 0.04
DKXL370-N11a-N200.630.13−2.480.34−3.464.590.410.890.950.62 ± 0.080.62 ± 0.01
DKXL370-S110.630.14−2.530.09−3.354.600.460.870.940.63 ± 0.060.63 ± 0.01
DKXL888-N11a-N170.740.16−2.230.05−3.794.820.510.890.950.65 ± 0.070.65 ± 0.01
GQ-N16-N120.540.04−2.45−0.13−4.886.260.820.900.780.56 ± 0.080.57 ± 0.04
LH119-AR160350.34−0.02−2.78−0.15−3.525.390.570.860.910.69 ± 0.090.70 ± 0.01
LH82-AR160210.590.11−2.520.15−3.524.940.430.890.940.52 ± 0.080.52 ± 0.01
Mo42-N220A0.09−0.17−3.160.38−3.585.650.590.870.920.70 ± 0.060.71 ± 0.01
Nokomis Gold (NG)0.600.13−2.700.08−3.795.380.530.870.840.67 ± 0.090.66 ± 0.04
NG-Mo508-Mo5061.360.41−0.530.72−3.32−0.091.960.840.930.45 ± 0.040.44 ± 0.01
Table 6. Validation model variance (Q2Y) in partial least squares regression using color space (L*, a*, and b*) in predicting macro- and micronutrients in kernels of 1348 maize accessions classified into genotypes with opaque or translucent endosperm within stiff-stalk and non-stiff stalk heterotic groups from a breeding program for quality protein.
HG GenotypeColor SpaceMacronutrientsM-IndexMicronutrientsm-IndexFe + Zn Index
CaKMgNPS CuFeMnZn
Non-stiff Stalk PLSR validation model variance, Q2Y
L*0.03
a*
b* 0.020.020.040.040.05 0.070.040.060.050.06
Genotypes
1895-DK212-N11aL*0.15 0.140.220.140.190.08 0.070.130.090.100.08
a* 0.15 0.08 0.08 0.04
b*0.06 0.060.170.060.12 0.06
CH05015-Mo17L*0.080.090.05 0.05
a* 0.08 0.05
b*0.06
DKXL370-N11a-N20L*0.18
a*
b* 0.050.210.310.200.270.160.070.170.200.160.160.18
DKXL888-N11a-N17L* 0.04
a* 0.05
b*
GQ-N16-N12L*0.300.190.340.320.340.350.290.080.230.350.300.320.27
a*0.170.050.230.300.220.290.190.050.170.240.200.180.20
b*0.090.080.090.070.090.080.07 0.09 0.090.06
LH82-AR16021L*
a* 0.07 0.080.05
b* 0.05 0.050.05
NG-Mo42-N220AL*0.14 0.130.070.120.110.120.120.150.120.150.130.21
a*
b*
Nokomis GoldL*
a* 0.12 0.09
b* 0.05 0.150.120.090.070.15
Stiff Stalk
L*0.090.130.06 0.07 0.090.05 0.06 0.11
a*0.050.120.04 0.04 0.080.11 0.060.050.05
b*0.150.060.10 0.100.060.100.060.070.090.060.060.09
Genotypes
AR16021-B73L* 0.03 0.030.05 0.150.040.05 0.09
a* 0.04 0.060.120.08 0.05 0.06
b*0.05 0.060.090.060.080.04 0.050.060.030.050.05
CHIS740-S14-S12L*0.050.070.040.060.040.06 0.04
a* 0.08 0.06 0.10
b*
DKXL370-S11L*
a* 0.12
b* 0.05
LH119-AR16035L* 0.06 0.08
a* 0.15 0.060.170.07 0.060.060.08
b*0.070.050.070.070.080.070.070.060.070.090.070.070.10
Endosperm type
OpaqueL* 0.03 0.05
a* 0.04
b* 0.04 0.08 0.060.08 0.050.04
TranslucentL*
a*
b*0.040.040.05 0.040.05 0.040.050.040.04 0.06

