Article

The Effect of Community-Based Soil and Water Conservation Practices on Abundance and Diversity of Soil Macroinvertebrates in the Northern Highlands of Ethiopia

1
College of Agriculture and Environmental Sciences, Haramaya University, Dire Dawa P.O.Box 138, Ethiopia
2
Ethiopian Agricultural Transformation Agency, Addis Ababa P.O.Box 708, Ethiopia
3
Mekelle University Department of Land Resources Management and Environmental Protection, Mekelle P.O.Box 231, Ethiopia
4
Faculty of Environmental Sciences and Natural Resource Management Norwegian University of Life Sciences, Ås P.O. Box 5003,1432, Norway
*
Author to whom correspondence should be addressed.
Agronomy 2018, 8(4), 56; https://doi.org/10.3390/agronomy8040056
Submission received: 16 January 2018 / Revised: 23 March 2018 / Accepted: 28 March 2018 / Published: 22 April 2018

Abstract

:
Soil and water conservation (SWC) practices in the northern highlands of Ethiopia have important implications for land restoration and biodiversity recovery. The present study determined soil macroinvertebrate (SMI) abundance and diversity in response to spatial conditions i.e., generated by different conservation practices, soil depth, and temporal seasonality with the wet and dry season. The SWC practices considered were exclosure + terrace, exclosure alone, terraces, and non-conserved grazing lands. Each SWC measure was selected in three sites that were considered as replications due to low heterogeneity in terms of human and livestock disturbances and biophysical factors. Soil macroinvertebrates were collected using a monolith according to tropical soil biology and fertility (TSBF) method. The highest density (55%) of SMI was found in exclosures followed by terraces 26%. Non-conserved communal grazing lands account for only 19% of the total. Shannon diversity index was significantly (P < 0.05) higher (1.21) in the exclosures supported with terraces and the lowest (0.9) was observed in the non-conserved communal grazing lands. Diversity was also significantly (P < 0.05) higher (1.26) in wet than dry season (0.70). The highest (41%) Sorensen similarity index among SMI was found between exclosures with terraces and exclosures alone during the wet season. The lowest (20%) Sorensen similarity index was found between terraces alone and exclosures with terraces in dry season. Soil macroinvertebrate abundance was higher in upper (0–10 cm) than lower (10–20 and 20–30 cm) soil depth. Soil macroinvertebrate abundance was positively and strongly correlated with soil moisture (R2 = 0.85) and soil organic carbon stock (R2 = 0.95). However, it was negatively (R2 = −0.71) correlated with bulk density. Generally, the abundance and diversity of SMI increased as exclosures and communal grazing lands are supported with terraces.

1. Introduction

Land degradation is a common problem in Ethiopian highlands [1]. It is manifested in the form of soil erosion and decline of biodiversity resources in Tigray highlands, northern Ethiopia [2]. It is mainly the result of clearing the natural vegetation and includes deterioration in soil physical, biological, and chemical properties [1]. Grazing on hillsides and other fragile areas is also another common problem in the region. This free grazing contributed to land degradation [3]. To alleviate the problem, the government has mobilized communities and resources for the construction of physical soil and water conservation structures (terraces) [4] and biological (exclosures) [3]. Construction of stone terraces on grazing lands combats land degradation [1]. Terraces enhanced soil properties and vegetation growth [5] and improved land productivity [6]. Exclosure is practiced in badly eroded lands to protect cutting of trees and restrict grazing to enable vegetative regeneration [4,7]. It was found that restoring degraded drylands is technically promising when using area exclosures [3]. They are important biological measures to combat land degradation and to increase biomass production [8]. Physical conservation structures are designed in fields where biological control practices alone are insufficient to reduce soil erosion [6]. Thus, exclosures are supported with terraces to enhance their capacity of decreasing soil erosion and improve vegetation growth (BoANR, 2014).
Soil is one of the most essential and diverse natural habitats for biodiversity on earth [9]. The abundance and diversity of soil organisms integrate physical, chemical, and biological properties of soil [10] and reveal general ecological change [11,12]. Tropical soil macroinvertebrates (SMI) are highly diverse and provide a number of important ecosystem services. They have direct effect on soil properties through their feeding and burrowing activities [13]. They contribute to a wide variety of soil processes within the soil system [12]. For instance, earthworms, ants, and termites are considered as ecological engineers that mobilize the soil and redistribute the soil organic carbon within the profile [14,15]. They ingest soil particles with their food and contribute to aggregate formation by mixing organic and mineral matter in their gut [16]. These activities influence soil physical, chemical, and biological properties [15].
Decomposition of organic matter, the formation of humic substances, and nutrient cycling are facilitated by the action of soil macroinvertebrates [10]. This has considerable significance for plant growth and maintenance of soil health [17,9].
The beneficial role of SMI has been ignored [13]. Thus, SMI are affected by land degradation caused by anthropogenic and livestock disturbances [13,12]. This reduction of SMI resulted in soil degradation in the tropics [15]. Many previous studies conducted in the area focused on the role of terraces and exclosures on erosion control, vegetation diversity, and soil fertility [1,4]. However, no studies were conducted on the effect of SWC measures on soil macroinvertebrates. Therefore, this study was conducted to investigate the effect of community based SWC practices on SMI abundance, diversity, and selected soil properties.
The research questions answered include: Did the support of free grazing lands with terraces increase abundance and diversity of soil macroinvertebrates? Could protection of free grazing lands through exclosures increase abundance and diversity of soil macroinvertebrates? Could exclosures supported with terraces result in significant increase in abundance and diversity of soil macroinvertebrates? Did soil depth and seasonal variation affect abundance and diversity of soil macroinvertebrates? And finally, could soil properties affect the abundance of soil macroinvertebrates?

2. Materials and Methods

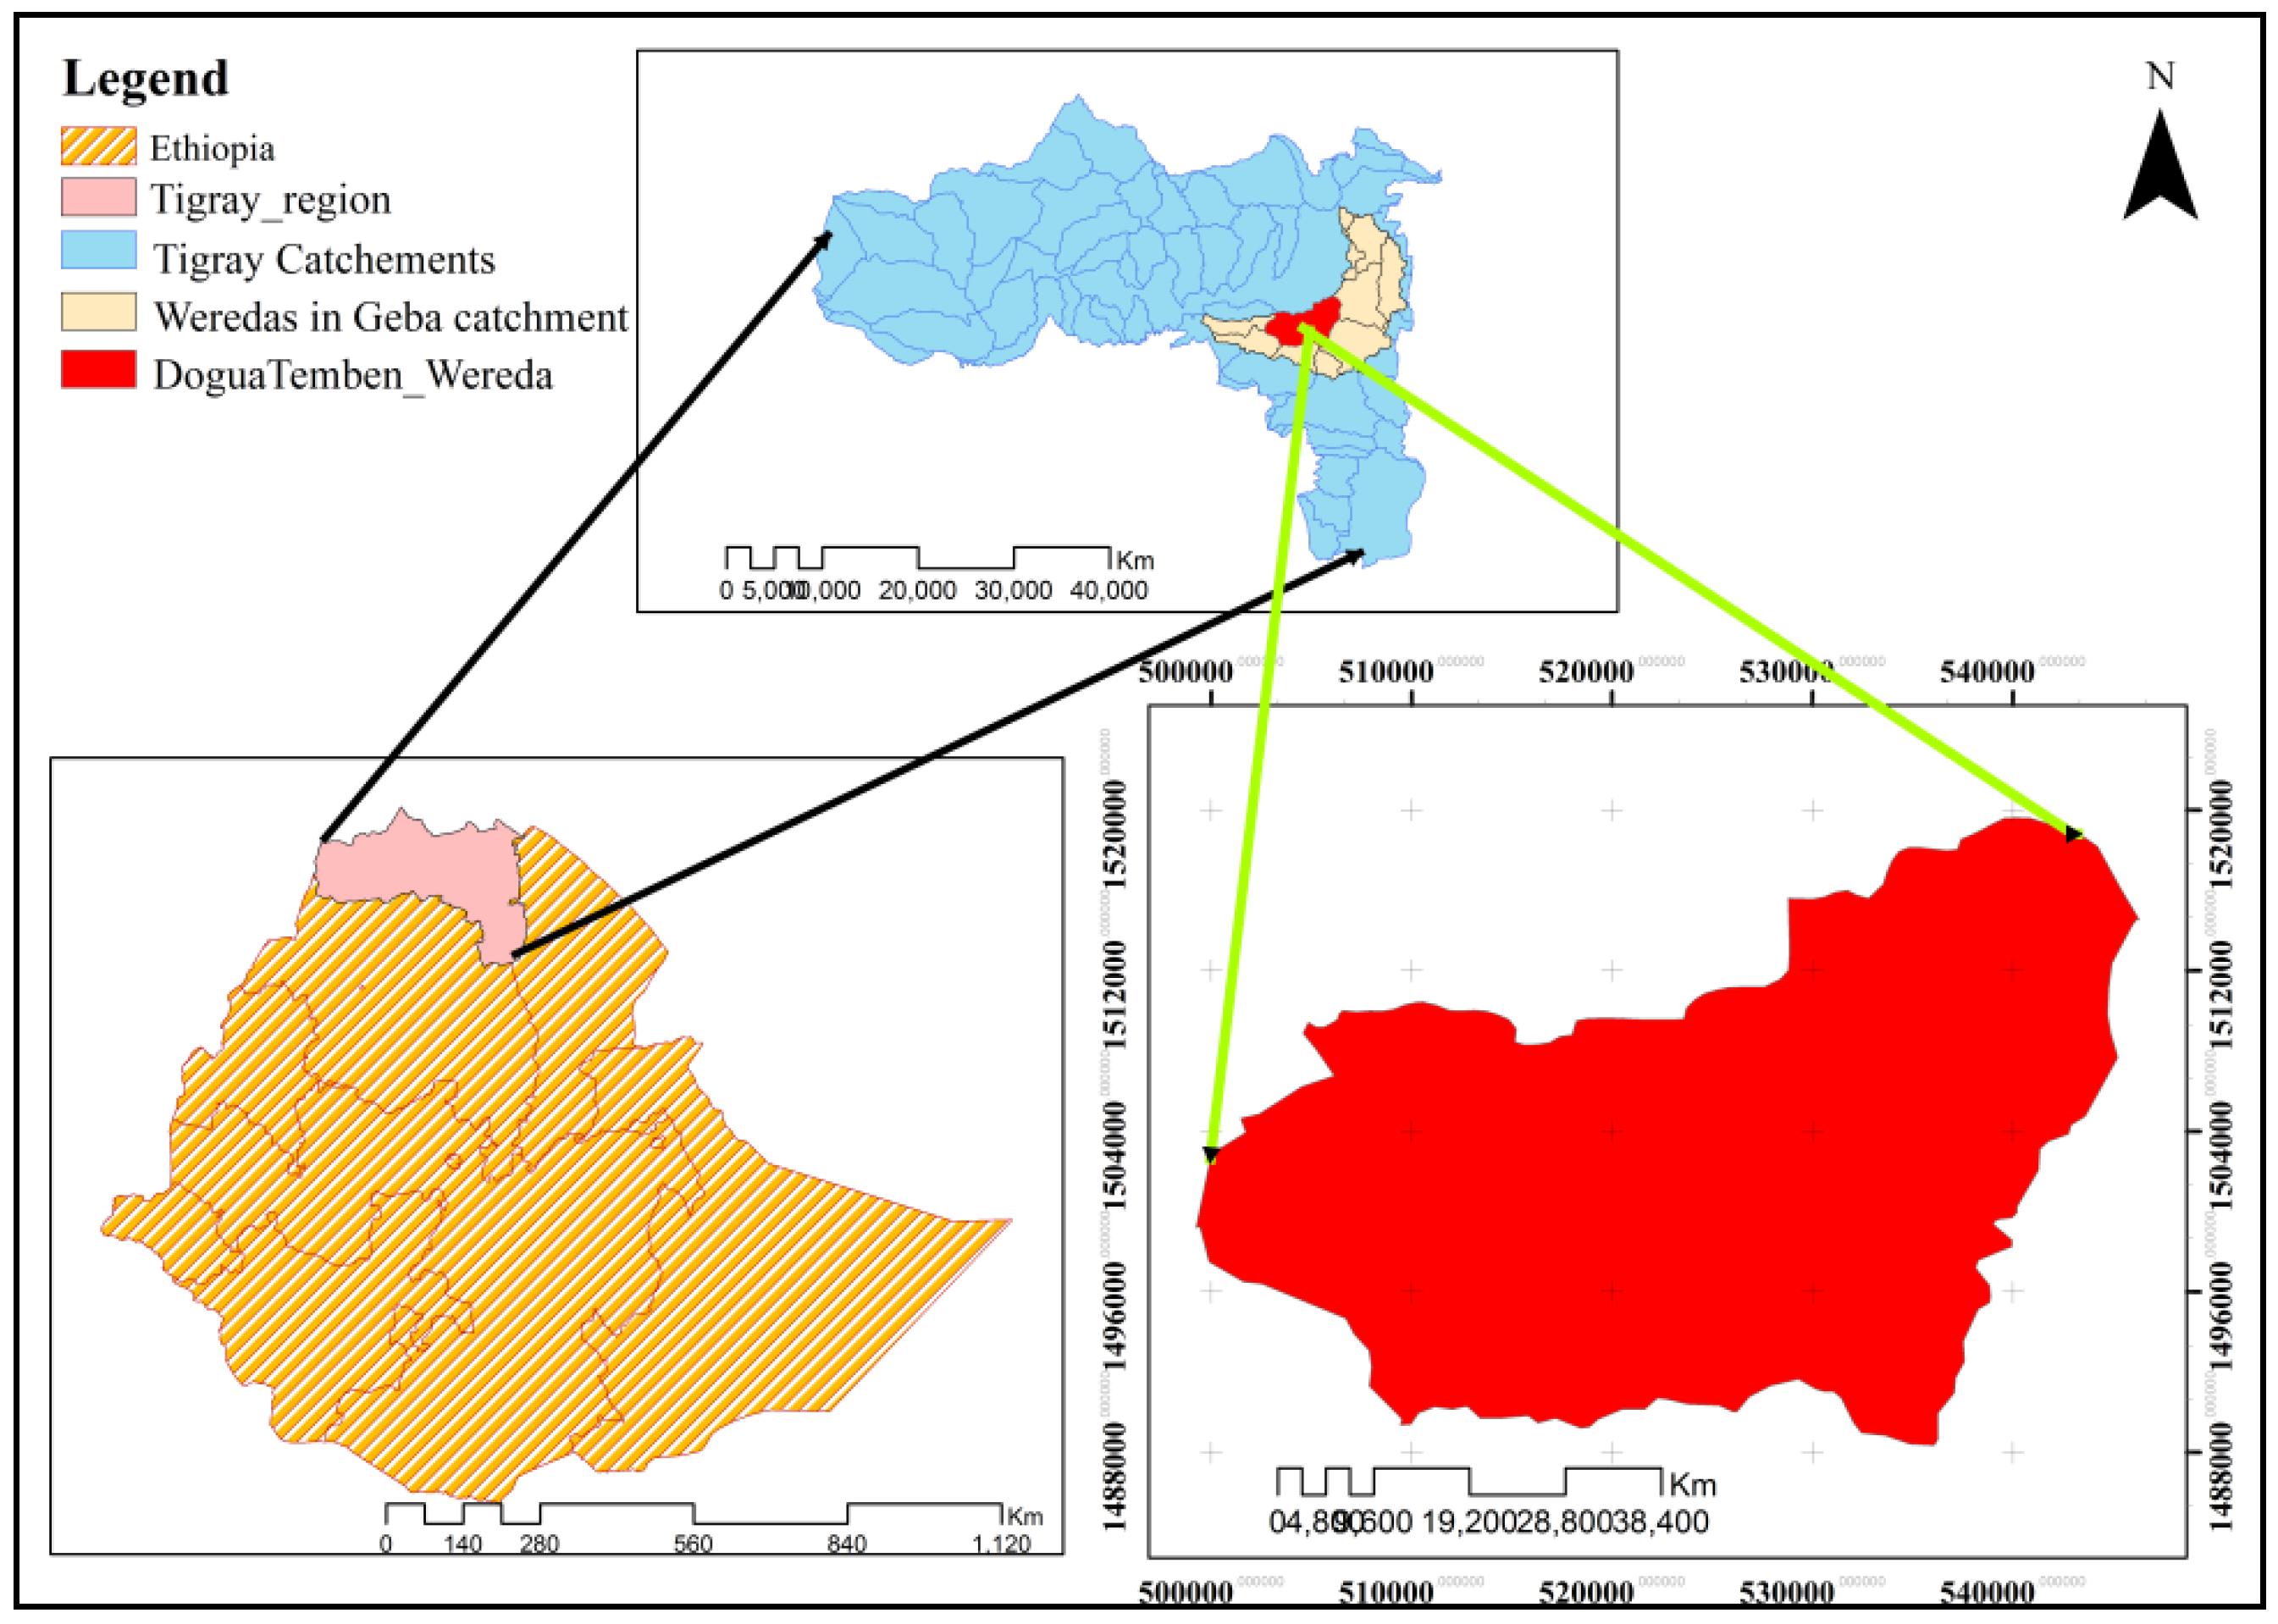
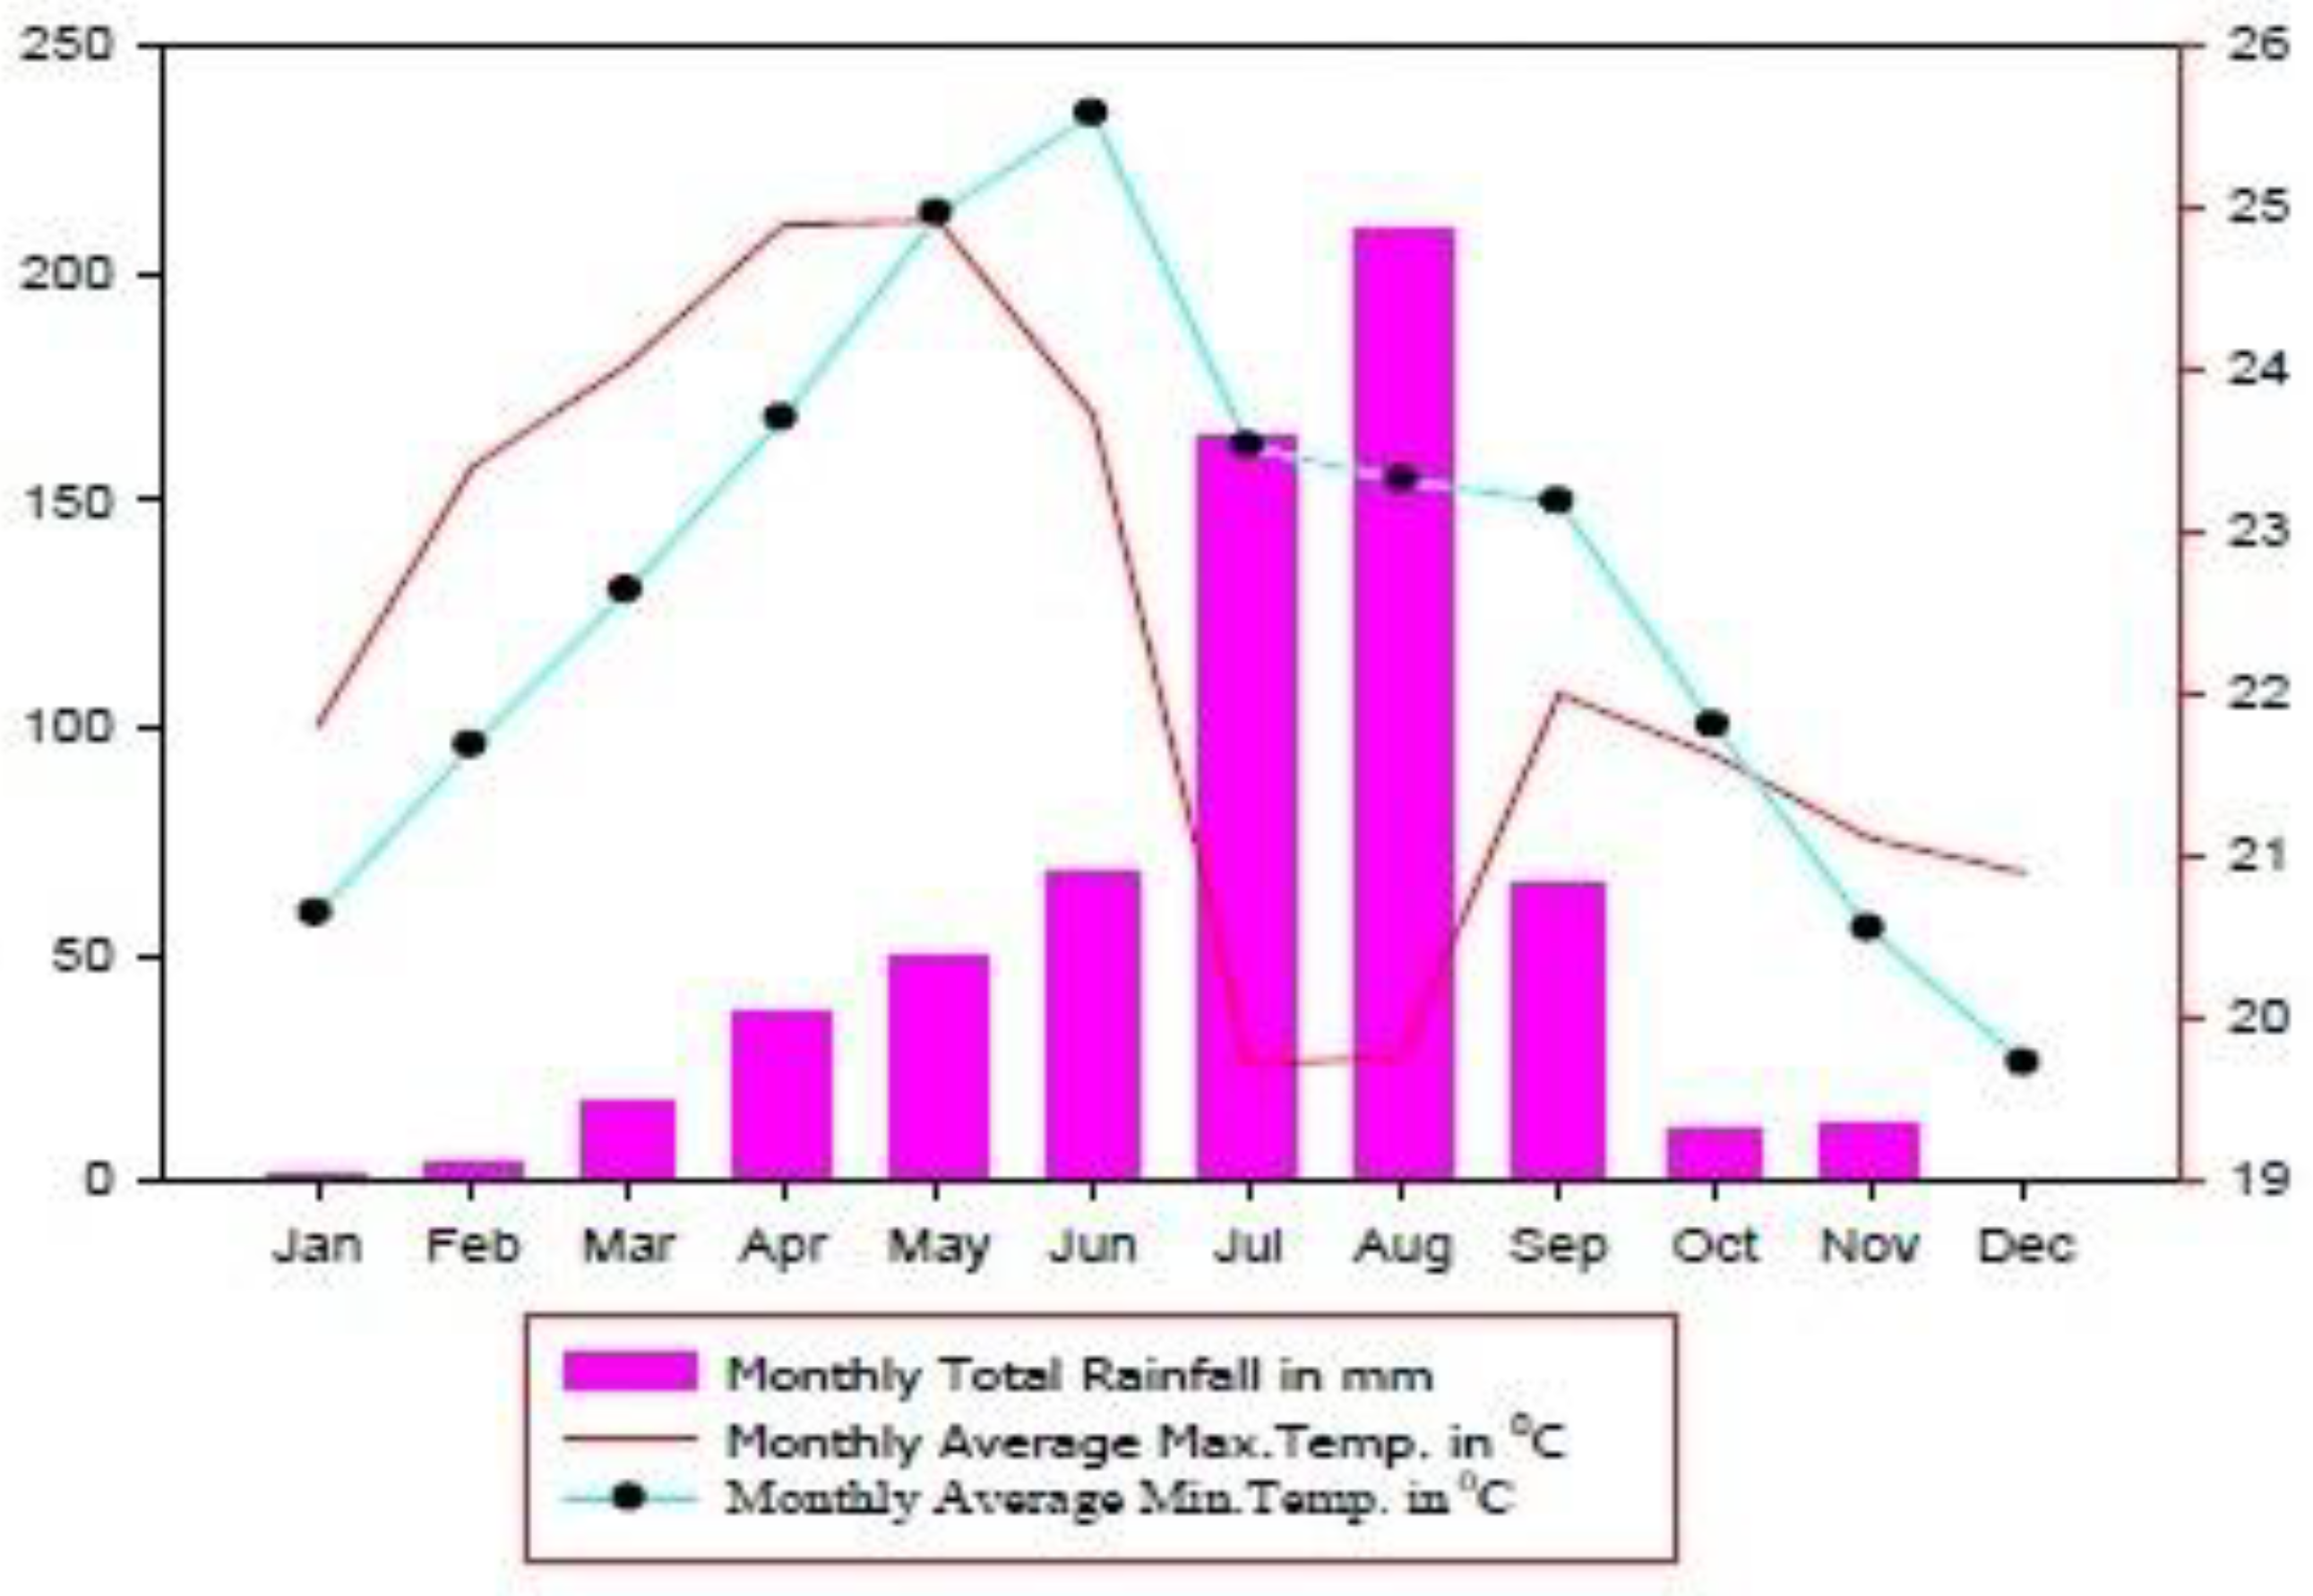
2.1. Description of the Study Area

The study was conducted in Degua Temben district, which is located 50 km west of Mekelle, regional capital of Tigray region, northern Ethiopia. Geographically, it is located at 13°16’23’’ to 13°47’44’’ Latitude and 39°3’17’’ to 39°24’48’’ Longitude (Figure 1). The majority of the area has rugged topography which is typical for the Northern Ethiopian Highlands [4]. It is also known for extensive SWC measures (BoANR, 2014).
The area receives an annual rainfall of 290 to 900 mm year−1 with an average value of 615 mm year−1. The rainy season usually occurs between June and September. The highest rainfall is in July and August. The growing season varies between 90–120 days. The maximum temperatures occur in May and June (Figure 2).
The lithology of the study area comprises Mesozoic sedimentary rocks and tertiary basalt [18]. Soils of the study sites developed from calcium carbonate-rich parent material of the Agula shale formation, which consists mainly of marble and limestone [19]. According to World Reference Base [20] soil classification system, Calcaric Cambisols, Vertic Leptosols, Vertic Cambisols, and Lithic Leptosols are the dominant soil types in the study area. Water erosion is an extremely serious problem; and sheet, rill, and gully erosions are observed elsewhere in the study area.
The common woody vegetation species identified in exclosures and in communal grazing lands include Acacia etbaica, Carissa edulis, Dodonea angustifolia, Stereospermum kunthianum, Rhus vulgaris, Senna singueana, and Euclea racemosa. Mixed farming systems (crop and livestock) are the main livelihood in the study area. Forest land, cultivated lands, exclosures, and communal grazing lands are the major land uses in the area.
Almost all the accessible land is over cultivated or used intensively for grazing; protection and conservation of these degraded sites is through integrated SWC that involve stone faced terraces, grazing restrictions, and plantation development [1,4]. The most common soil and water conservation measures were terraces in grazing lands and exclosures with or without terraces. They were established since 1997 by the community (Table 1). Before their establishment, the selected SWC measures had similar history with the non-conserved communal grazing lands in terms of grazing. Besides, the number of mammals in each site was similar.
The area coverage of terraces in grazing lands ranged from 13.87–24.42 ha and that of exclosure with and without terrace ranged 12.74−51.80 ha and 14.02−34.70 ha respectively while area of the adjacent non-conserved communal grazing lands was 11–34.96 ha.

2.2. Experimental Design

The three nearby sites selected (i.e., Tesemat, Kerano, and Alasa), considered as replications, were within the same agro ecology in the district. There was no significant difference between spatial heterogeneity in terms of human and livestock disturbance and other biophysical (topography, soil type, and vegetation) among the selected sites. Each of the three selected sites was categorized into four management units described as terraces in grazing lands, exclosures with terraces, exclosures alone, and non-conserved open communal grazing lands (Table 1).
Three 40 m long and 5 m meter wide (200 m2) transects were laid along the slope gradient and sampling monoliths with a dimension of 25 cm long, 25 cm wide, and 30 cm deep were opened [21]. The transects were considered as sampling locations. The minimum distance between the transects was 75 m. Within the transects or sampling locations, two sampling monoliths at 10 m distance from each other were opened per season (i.e., 4 monoliths within the 40 m transect for the two seasons). In both seasons, a total of 144 monoliths were opened across the three sites. (i.e., 4 SWC measures × 3 sampling locations/transects × 2 monoliths × 2 season × 3 sites)

2.3. Soil Macro-Invertebrate Sampling and Identification

The samples were collected during wet (August and September) and dry seasons (April and May) of 2015/16 at 8:00–12:00 a.m. in the morning and 2:00–4:00 p.m. in the afternoon once per month. The soil samples obtained were then carefully hand-sorted on a large plastic tarp and the soil macroinvertebrates (SMI) were preserved in 97% alcohol until identification. Soil macroinvertebrates were identified to family level. The families have been identified in Mekelle University Zoology Laboratory and identification was based on morphological characteristics.

2.4. Determination of Diversity Indices of Soil Macroinvertebrates

Shannon’s Index of Diversity was used for determining the diversity and its associated evenness [22]. It was calculated as
H = Σ Pi   lnPi ;   i   = 1 n
where: Pi = xi/Σxi
xi is the number of individuals in the family i and
Pi is the proportion of the total number of individuals belonging to the family i.
Evenness or equitability which indicates the degree of homogeneity in abundance between families and is based on the Shannon index of diversity. It assumes a value between 0 and 1, with 1 representing a situation in which all families were equally abundance evenly distributed, and 0 represents complete absence of the family.
E = H / Hmax = H / lnS
where H is the Shannon diversity index and S the number of families
Simpson’s index was used for determining dominance of SMI in response to SWC measures.
Simpson s   index = Σ ( ni / N ) 2
where
ni is the number of individuals of a family and
N is the total number of individuals of all families.
The similarity in the composition of the families of SMI within the different SWC measures was determined by using Sorensen’s index of similarity [23]. It is calculated as follows
I   ( Sorensen ) = 2 c / ( 2 c + a + b )
where a is the family number in one of the SWC measures
b is the number family in another SWC measure, and
c is the number of family common to both SWC measures.

2.5. Soil Sampling and Analysis

Soil pH was measured by using a combined glass electrode ph meter [24] in 1:2.5 soil-water, soil bulk density (bd) was measured by the core method; soil organic (oc) by wet oxidation using potassium dichromate [25]. Percent of soil moisture content was calculated as the difference between weight of moist soil and weight of oven dry soil divided by weight of oven dry soil multiplied by 100. Soil organic carbon stock was determined from bulk density, concentration of soil organic carbon, soil thickness, and coarse fragments [26].

3. Statistical Analysis

We tested significance level of mean richness, Shannon–Weiner index, Simpson diversity index, evenness and Sorenson similarity index in response to community based SWC measures, depth, and season using SAS 9.2. Comparison of means was made based on Duncan’s multiple range tests (DMRT). Principal component analysis (PCA) using Canoco 4.5 and Pearson correlation coefficient analysis using SAS 9.2 was carried out and used to see the relationship between soil properties and abundance of soil macroinvertebrates.

4. Results and Discussion

4.1. Effect of Soil and Water Conservation Measures on Abundance and Diversity of Soil Macroinvertebrates

Comparison of total soil macroinvertebrate (SMI) contents among the community based SWC measures indicated 29.63% of the SMI were recorded in exclosures with terraces followed by terraces 26% and exclosures alone 25%. The lowest abundance (19%) of SMI was found in non-conserved communal grazing lands (Table 3).
The presence of higher abundance of SMI in exclosures could be due to low human and livestock interference. Besides, exclosures had high vegetation cover and this might have created a suitable micro habitat for soil macroinvertebrates. Terraces also acted as an important niche for the soil macroinvertebrates. Soil macroinvertebrate abundance increased with plantation or vegetation cover [13]. The lowest SMI in non-conserved communal grazing lands could be due to relatively low organic matter and moisture content. Low organic matter causes a decrease in abundance [27]. Soil compaction through trampling during grazing reduces soil organisms [28,12].
Many of the SMI families were found in all the SWC measures. However, certain families—such as family Lumbricidae, Acrididae, Dytiscidae, Staphylinidae, Scutigeridae, Ligiidae, Argasidae and Japygidae—were not found on non-conserved open communal grazing lands (Table 3). This could be their degree of sensitivity to disturbance and low organic matter in non-conserved grazing lands. The total abundance of SMI was in the order of exclosures with terraces > terraces > exclosures alone > non-conserved grazing lands.
Exclosures with terraces had significantly higher (1.21) Shannon diversity index followed by exclosures alone (1.01) while the lowest (0.9) was found on non-conserved communal grazing lands and terraced grazed lands (Table 4). The presence of significantly higher Shannon diversity index in exclosures could be due to high organic matter, moisture content, and low disturbance. Adeniyi [29] observed high diversity of soil macro fauna in areas where light penetrates, litters of leaves fall and ground is rocky. Other studies suggested that grazing exclusion is important for the recovery of soil fauna [30] because livestock and human activities are restricted [31]. Therefore, grazing decreases macro invertebrate diversity [32,33] due to decrease of plant biomass [34].
Richness was significantly higher in exclosures with terraces followed by exclosures alone and terraces in grazed lands. This could be due to the presence of micro patches under trees in exclosures that create habitat heterogeneity and better moisture content on terraces in grazed lands. This is in line with Liu et al. [30], who reported that grazing exclusion has a remarkable effect on richness, where it was significantly higher at the exclosure than at the continuous grazing site. Reduced grazing pressure can increase species richness [35,36]. The decreasing order of family richness was as follows: exclosures with terraces > terraces in grazed lands > exclosures alone > non-conserved communal grazing lands.
Simpson’s diversity index was relatively higher in exclosures supported with terraces followed by exclosures without terraces (Table 4) which could be due to availability of relatively more moisture and organic matter on exclosures soil. Soil organic matter improves soil aeration, temperature, and moisture; and provides a resilient resource base for a wide variety of soil organisms [37]. Tree litter contains high diversity and large numbers of macrofauna [12].
Non-conserved grazing lands and terraces in grazed land had relatively lower Simpson’s diversity index which indirectly shows higher dominance of a certain family that can tolerate disturbances by humans and livestock. A study by Mehraj and Bhat [28] showed that trampling by livestock reduces the diversity of macroinvertebrates. The other reason could be land degradation by erosion, because eroded soils have low diversity of soil invertebrates [38,39].

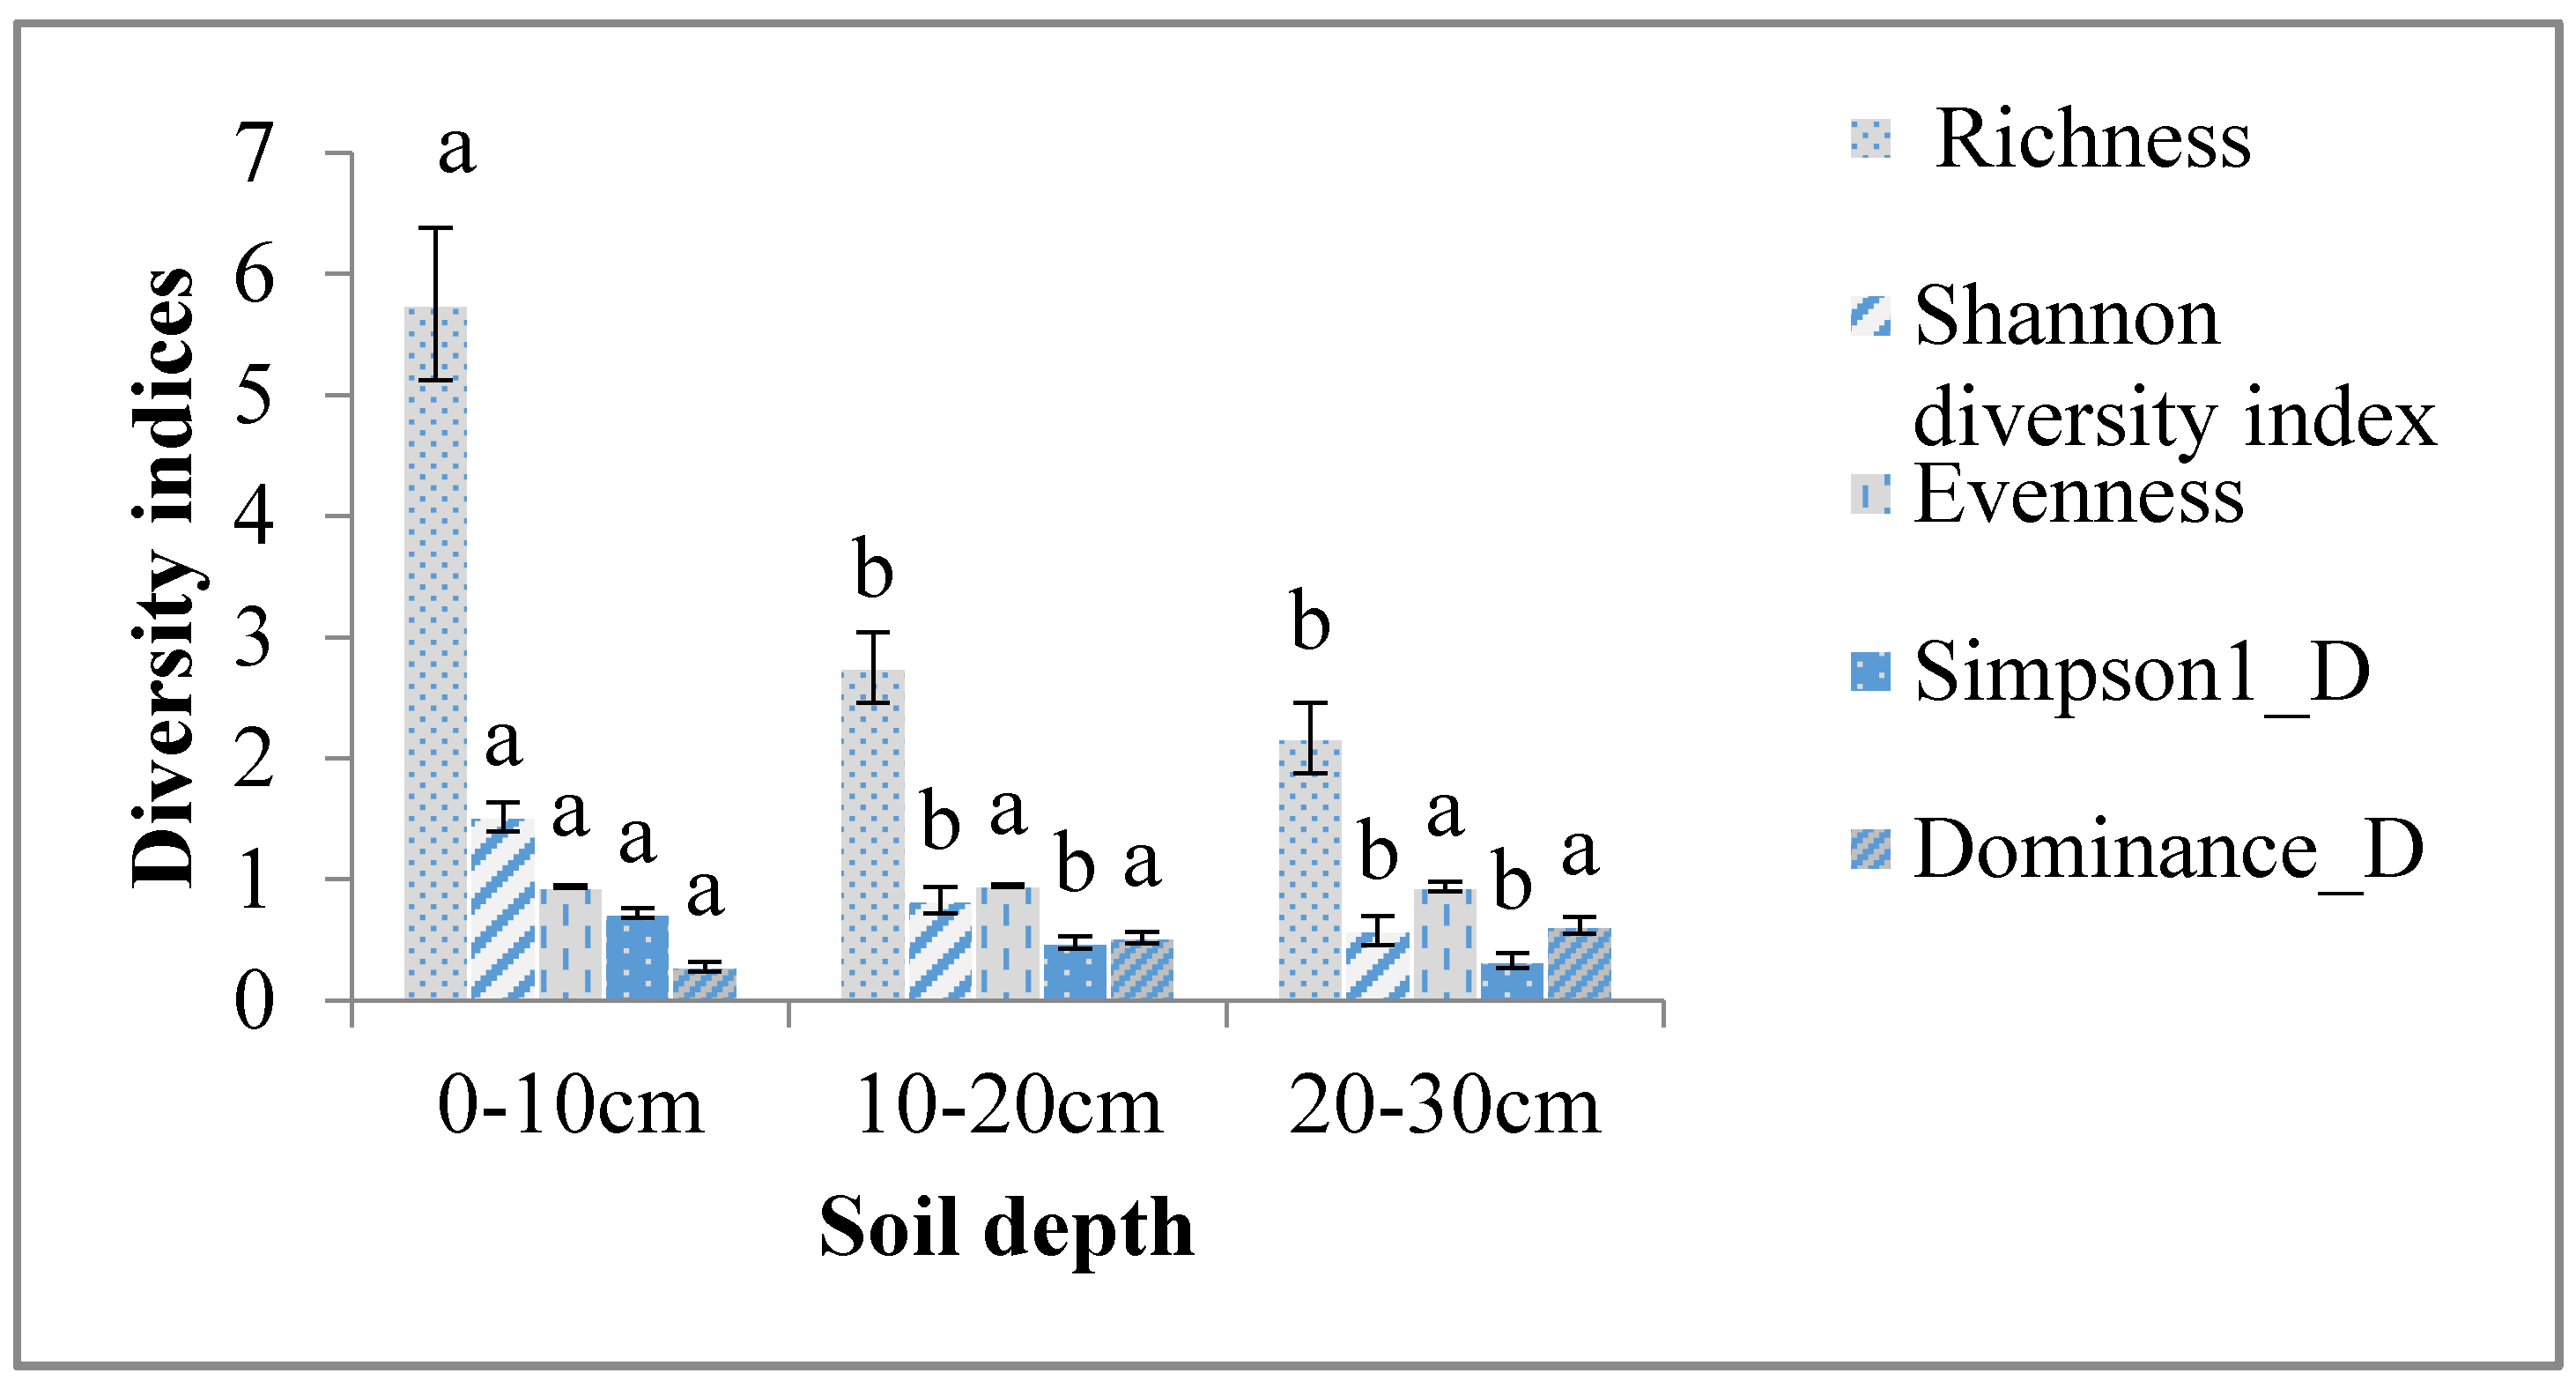
4.2. Effect of Soil Depth on Abundance and Diversity of Soil Macroinvertebrates

Mean total abundance of SMI showed a significant (P < 0.05) differences along the three depths where it was higher in 0–10 cm (1852.4 individuals m−2), followed by 10–20 cm (894.7 individuals m−2), and was the lowest in 20–30 cm (434.20 individuals m−2). Thus, SMI in the top soil (0–10 cm) are 51.7 and 76.6% higher than SMI in the 10–20 and 20–30 cm depths respectively (Table 5). This shows deeper soil is less preferred by most SMI due to SOC decrease down in depth.
The most abundant SMI families in each soil depth were Formicidae followed by Termitidae (Table 5). This show Formicidae and Termitidae can inhabit wide ranges of environmental conditions in tropical environments. Lal [15] also described them as the most dominant SMI in the tropics.
Specifically—except for Lumbricidae, Dytiscidae, Staphylinida, Ligiidae, Scutigeridae, Bostrichidae, Argasidae, and Japygidae—the abundance of the other SMI were significantly (P < 0.05) higher in the top soil (0–10 cm) than lower (10–20 cm and 20–30 cm) soil depths (Table 5). This revealed surface soil is more appropriate for these soil macroinvertebrates. This could indicate their preference to high amount of organic matter. They could also have better tolerance to light and temperature changes. Even though low in number, the presence of surface dwelling (epigeal) SMI—such as Grylidae, Acrididae, Blattoidae, Cryptopidae, Spirostreptidae, and Japygidae—below 10 cm and soil dwelling (hypogeal) SMI—such as Carabidae, Cryptopidae, Staphylinidae, Formicidae, Termitidae, and Scorpionidae—in subsurface soil (20–30 cm depth) could be their temporal relocation in search of moisture or to hide and protect themselves from predators.
Soil SMI richness was significantly (P < 0.05) higher at the surface (0–10 cm) depth than lower (10–20 cm and 20–30 cm) depths. Surface soil (0–10 cm) was 52% and 62% richer in SMI than the 10–20 and 20–30 cm depths respectively. Furthermore, surface soil (0–10 cm) had significantly (P < 0.05) higher (1.52) Shannon diversity index than the lower 10–20 cm (0.83) and 20–30 cm depths (0.58) respectively. Similarly, Simpson index was higher in surface soil than lower depths which show variation in SMI composition decreased down in depth (Figure 4). This could be due to the presence of more pore space, good aeration, and more available food in surface soil. Surface soil is more appropriate to presence of macroinvertebrates [40]. A similar study found that most tropical soil fauna live on the top 10 cm soil depth where organic matter is decomposed [28].

4.3. Effect of Seasonal Changes on Abundance and Diversity of Soil Macroinvertebrates

Comparison of mean total SMI abundance across seasons indicated significantly (P < 0.05) higher (1784.6 individuals m−2) in wet than in dry season (336 individuals m−2). Total SMI in the wet season are 81% higher than in the dry season. This indicated most of the SMI are sensitive to high temperatures of the dry season which might have hindered their reproduction or they might have been hidden under stones as a mechanism to adapt to the temperature changes.
A total of 20 families during the wet season and 13 families during the dry season were identified (Table 6). The families commonly found in both season were family Formicidae, Termtidae, Gryllidae, Lycosidae, Scarabaeidae, Scorpionidae, Carabidae, Cryptopidae, Blatidae, Acrididae, Bostrichidae, Spirostreptidae, and Argasidae. The SMI families that were common in both season decreased their abundance due to seasonal changes as follows: Lycosidae > Termitidae > Carabidae > Scorpionidae > Spirostreptidae > Formicidea > Scarabaeidae > Acrididae > Blattoidae > cryptopidae. The others—such as Lumbricidae, Staphylinidae, Dytiscida, Scutigeridae, Japygidae, Ligiidae, and Rhinotermitidae—were not found during the dry season (Table 6). This indicated these SMI are more sensitive to high temperatures (Figure 2) and this might have hindered their reproduction or they might have died. The other reason is they might be hidden under stones as a mechanism to adapt high temperature. This aspect requires further investigation. Many of the families (i.e., Carabidae, Scarabaeidae, Staphylinidae, Dytiscidae and Bostrichidae) in both seasons belong to the order Coleoptera. This could be due to the presence of sclerotized elytra which cover the membranous flight wings and which might protect them from environmental stress and attack by predators. The most abundant SMI in each season were family Formicidae followed by family Termitidae (Table 6).
Seasons also brought significant (P < 0.05) variation in SMI richness. The highest was found during the wet season while the lowest was found during dry season (Figure 5). The decrease in abundance and richness of SMI during the dry season (Table 6, Figure 5) could be due to lack of resources such as moisture and presence of high temperatures.
The highest (1.26) Shannon diversity index was found during the wet season but the lowest (0.70) occurred during the dry season. Similarly, Simpson index was high during the wet season (Figure 5). Begum et al., [9] reported that season had greater influence on soil macroinvertebrates. Barros et al., [41] observed high SMI abundance at the rainy season. The decrease in SMI abundance and diversity during the dry season could be due to low moisture content. Besides, diversity is driven by stress such as temperature changes [42]. Similarly, Ali et al., [12] reported that most SMI avoid risk of open space during dry period with high light intensity and temperature.
In both seasons, family Formicidae was the most abundant. This could be due to their ability to adapt to adverse conditions. Ants are found in any type of habitat with greater local diversity and under different types and extent of land disturbances [43]. However, many SMI are sensitive to changes in their environmental conditions [13].
During the wet season, the Sorenson similarity index in macro invertebrate composition between two SWC measures revealed the greatest (41%) between exclosures with terraces and exclosures alone and the lowest (33%) was between exclosures with terraces and non-conserved communal grazing lands (Table 7). During the dry season, the highest (39%) Sorenson similarity index among SMIs was found between exclosures alone and non-conserved communal grazing lands, while the lowest (20%) was between terraces and exclosures with terraces. The overall similarity index of SMIs between pairs of SWC measures was not significant (at P < 0.05) except the similarity index between exclosures with terraces and terraces in grazed land in dry season.

4.4. Relative Contribution of Soil Properties to Soil Macroinvertebrates

Soil properties affected the abundance of soil macroinvertebrates. Abundance of SMI was higher in the SWC measures with higher soil moisture content and soil organic carbon stock (i.e., in exclosures and terraces) than non-conserved communal grazing lands, showing that organic matter and moisture are necessary for SMIs (Figure 6). Principal component analysis for the linear relationship between soil properties (Figure 6) in response to SWC measures indicated that axis 1 and axis 2 accounted 78.41% and 19.58% of the total variability, respectively. The abundance of SMI was positively and strongly correlated with soil moisture, organic matter (OM) and soil carbon stock (Table 8). This result agrees with Santorufo et al., [44] who found high abundance of SMI in areas with high soil organic carbon content. Pearson correlation also indicated a positive correlation between abundance, soil moisture, and organic matter. Besides, there is a strong and significant correlation between abundance and SOC stock (Table 8).
Soil bulk density, pH, and coarse fragment content were higher in non-conserved communal grazing lands followed by terraces and were lower in exclosures (Figure 6). However, SMI abundance was inversely proportional—i.e., abundance decreased with the increase of bulk density, pH, and coarse fragment content. The decrease in soil bulk density and soil pH in exclosures is due to the presence of high organic matter. Thus, soils with low bulk density are less compacted and contain enough aeration for soil macroinvertebrates. However, livestock trampling in grazing lands increased soil bulk density and affected the biological soil surface [45].

5. Conclusions

Exclosures improved soil macroinvertebrate (SMI) diversity and abundance. Abundance and diversity of SMI was higher in exclosures that were supported with terraces, followed by exclosures without terraces, while it was the lowest in non-conserved communal grazing lands. Terraces in grazing lands also improved abundance and diversity of soil macroinvertebrates. Land degradation by grazing and other human interferences decreased diversity and abundance of soil macroinvertebrates.
The abundance and diversity of SMI was significantly higher during the wet than dry seasons; and on the top soil than in the lower soil depths. Soil nutrients relatively influenced SMI abundance, as it was positively and strongly correlated with soil carbon stocks and soil moisture, while it was negatively correlated with bulk density and coarse fragment content.
To better protect communal grazing lands, they should either be supported with terraces or establishment of exclosures as these measures improved SMI abundance and diversity.

Acknowledgments

The authors are grateful to Haramaya University and Wollega University for their financial support. They also appreciate and thank to Mekelle University Aquatic Ecology and Zoology laboratory for the technical and facility assistance.

Author Contributions

Mengistu Welemariam was a PhD student in soil science and participated in proposing the study, ran and managed all experiments, conducted all laboratory analyses performed statistical analyses, and interpretation of results and drafted the manuscript. Fassil Kebede and Bobe Bedadi as supervisors participated in guiding and reviewing the manuscript. Emiru Birhane was supervisor and participated in designing the field experiment and reviewed the manuscript in depth. All authors read and approved the final manuscript.

Conflicts of Interest

The authors declare no conflict of interest.

References

  1. Nyssen, J.; Munro, N.; Haile, M.; Poesen, J.; Descheemaeker, K.; Haregeweyn, N.; Decker, J. Understanding the Environmental Changes in Tigray: A Photographic Record Over 30 Years. Tigray Livelihood Papers No. 3, VLIR – Mekelle University IUC Programme and Zala-Daget Project. 2007; 82 p. [Google Scholar]
  2. Carolyn, T.; Kwadwo, A. Responding to Land Degradation in the Highlands of Tigray Northern Ethiopia; Discussion Paper; International Food Policy Research Institute (IFPRI) Eastern and Southern Africa Regional Office: Washington, DC, USA, 2011. [Google Scholar]
  3. Gebreegziabher, T.; Nyssen, J.; Govaerts, B.; Getnet, F.; Behailu, M.; Haile, M.; Deckers, J. Contour furrows for in situ soil and water conservation, Tigray, northern Ethiopia. Soil Tillage Res. 2009, 103, 257–264. [Google Scholar] [CrossRef]
  4. Mekuria, W. Effectiveness of exclosures to restore ecosystem carbon stock and vegetation in the highlands of Tigray, northern Ethiopia. J. Arid Environ. 2007, 69, 270–284. [Google Scholar] [CrossRef]
  5. Gebrehiwot, T.; Veen, A.V.D. The effect of enclosures in rehabilitating degraded vegetation: A case of Enderta District, northern Ethiopia. For. Res. 2014, 3, 128. [Google Scholar]
  6. Amdemariam, T.; Selassie, YG.; Haile, M.; Yamoh, C. Effect of soil and water conservation measures on selected soil physical and chemical properties and barley (Hordeum spp.) yield. J. Environ. Sci. 2011, 5, 1483–1495. [Google Scholar]
  7. Mastewal, Y.; Mekuria, W.; Hauser, M. The effectiveness of village bylaws in sustainable management of community-managed exclosures in northern Ethiopia. Sustain. Sci. 2013, 8, 73–86. [Google Scholar]
  8. Descheemaeker, K.; Muys, B.; Nyssen, J.; Poesen, J.; Raes, D.; Haile, M.; Deckers, J. Litter production and organic matter accumulation in exclosures of the Tigray highlands, Ethiopia. For. Ecol. Manag. 2006, 233, 21–35. [Google Scholar] [CrossRef]
  9. Begum, F.; Bajracharya, R.M.; Sitaula, B.K.; Sharma, S.; Ali, S.; Ali, H. Seasonal dynamics and land use effect on soil microarthropod communities in the mid-hills of Nepal. Int. J. Sustain. Dev. World Ecol. 2014, 5, 114–123. [Google Scholar]
  10. Menta, C. Soil fauna diversity function, soil degradation, biological indices, soil restoration. Environ. Sci. 2012. [Google Scholar] [CrossRef]
  11. Paolo, A.G.; Raffaella, B.; Danio, A.M.D.; Ettore, C. Assessment of soil-quality index based on microarthropods in corn cultivation in northern Italy. Ecol. Indic. 2010, 10, 129–135. [Google Scholar]
  12. Ali, A.; Bhat, GA.; Ali, M. Epigeal and hypogeal macroinvertebrate diversity in different microhabitats of the Yusmarg Hill Resort (Kashmir, India). Ecol. Balk. 2012, 4, 21–30. [Google Scholar]
  13. Ayuke, F.O.; Karanja, N.K.; Muya, E.M.; Musombi, B.K.; Mungatu, J.; Nyamasyo, G.H.N. Macrofauna diversity and abundance across land use systems in Embu, Kenya. Trop. Subtrop. Agroecosyst. 2009, 11, 371–384. [Google Scholar]
  14. Jouquet, P.; Dauber, J.; Lagerlof, J.; Lavelle, P.; Lepage, M. Soil invertebrates as ecosystem engineers: Intended and accidental effects on soil and feedback loops. Appl. Soil Ecol. 2006, 32, 153–164. [Google Scholar] [CrossRef]
  15. Lal, R. Effect of macrofauna on soil properties in tropical ecosystems. Agric. Ecosyst. Environ. 1988, 24, 101–116. [Google Scholar] [CrossRef]
  16. Ruiz, N.; Lavelle, P. Soil Macro-Fauna Field Manual; FAO: Rome, Italy, 2008; pp. 1–100. [Google Scholar]
  17. Maharning, A.R.; Mills, A.A.; Adl, S.M. Soil community changes during secondary succession to naturalized grasslands. Appl. Soil Ecol. 2008, 41, 137–147. [Google Scholar] [CrossRef]
  18. Nyssen, J.; Poesen, J.; Moeyersons, J.; Luyten, E.; Veyret-Picot, M.; Deckers, J.; Mitiku, H.; Govers, G. Impact of road building on gully erosion risk: A case study from the northern Ethiopian highlands. Earth Surf. Process. Landf. 2002, 27. [Google Scholar] [CrossRef]
  19. Beyth, M. Paleozoic–mesozoic sedimentary basin of Makalle outlier. Am. Assoc. Pet. Geol. Bull. 1972, 56, 2426–2439. [Google Scholar]
  20. World Reference Base (WRB). A Framework for International Classification, Correlation and Communication; FAO: Rome, Italy, 2006. [Google Scholar]
  21. Anderson, J.M.; Ingram, J.S.I. Tropical Soil Biology and Fertility: A Handbook of Methods, 2nd ed.; CABI: Wallingford, UK, 1993. [Google Scholar]
  22. Magurran, A.E. Measuring of Biological Diversity; Blackwell Publishing: London, UK, 2004. [Google Scholar]
  23. Sorensen, T.A. A method of establishing groups of equal amplitude in plant sociology based on similarity of species contents, and its application to analyses of vegetation of Danish commons. Biol. Skr. Kongl. Danske Vidensk. Selsk. 1948, 5, 1–34. [Google Scholar]
  24. Chopra, S.H.; Kanwar, J.S. Analytical Agricultural Chemistry; Kalyani Publisher Ludhiana: New Delhi, India, 1976. [Google Scholar]
  25. Walkeley, A.; Black, I. An examination of Degtjareff methods for determining soil organic matter and a proposed modification of the chromic acid titration method. Soil Sci. 1934, 37, 29–38. [Google Scholar] [CrossRef]
  26. Lal, R.; Follett, R.F.; Stewart, B.A.; KimbIe, J.M. Soil carbon sequestration to mitigate climate change and advance food security. Soil Sci. 2007, 172, 943–956. [Google Scholar] [CrossRef]
  27. Wiwatwitaya, D.; Takeda, H. Seasonal changes in soil arthropod abundance in the dry evergreen forest of north-east Thailand, with special reference to collembolan communities. Ecol. Soc. Japan 2005, 20, 59–70. [Google Scholar] [CrossRef]
  28. Mehraj, S.S.; Bhat, G.A. Epigeal macroinvertebrate diversity in different microhabitats of the Sonamarg Hill Resort (Kashmir, India). Ecol. Balk. 2013, 4, 392–401. [Google Scholar]
  29. Adeniyi, S. Diversity and abundance of soil mesofauna and microbial population in southwestern Nigeria. Afr. J. Plant Sci. 2009, 3, 210–216. [Google Scholar]
  30. Liu, R.-T.; ZHAO, H-L.; Zhao, X.Y. Influence of grazing exclusion on soil macroinvertebrate diversity in degraded sandy grassland (Inner Mongolia, China). J. Ecol. 2012, 60, 375–385. [Google Scholar]
  31. Mekuria, W.; Aynekulu, E. Exclosure land management for restoration of the soils in degraded communal grazing lands in northern Ethiopia. Land Degrad. Dev. 2010. [Google Scholar] [CrossRef]
  32. Anagement, M.; State, I. Evaluation of arthropod diversity and abundance in contrasting habitat Uyo, Akwa. J. Appl. Sci. Environ. 2014, 18, 403–408. [Google Scholar]
  33. Mills, A.A.; Adl, M.S. Changes in nematode abundances and body length in response to management intensive grazing in a low-input temperate pasture. Soil Biol. Biochem. 2011, 43, 150–158. [Google Scholar] [CrossRef]
  34. Liu, R.; Zhao, H.; Zhao, X. Desertification impact on macroinvertebrate diversity in grassland soil in Horqin, northern China. Proced. Environ. Sci. 2011, 10, 1401–1409. [Google Scholar] [CrossRef]
  35. Bugalho, M.N.; Lecomte, X.; Goncalves, M.; Branco, M.C.; Caldeira, M. Establishing grazing and grazing excluded patches increases plant and invertebrate diversity in a Mediterranean oak woodland. For. Ecol. Manag. 2011, 261, 2133–2139. [Google Scholar] [CrossRef]
  36. Parfitta, R.L.; Yeates, G.W.; Rossa, D.J.; Schon, N.L.; Mackay, A.D.; Wardle, D.A. Effect of fertilizer, herbicide and grazing management of pastures on plant and soil communities. App. Soil. Ecol. 2010, 45, 175–186. [Google Scholar] [CrossRef]
  37. Lehman, R.M.; Cambardella, C.A.; Stott, D.E.; Acosta-Martinez, V.; Halvorson, J.J.; Kremer, R.J.; Ducey, T.F. Understanding and enhancing soil biological health: The solution for reversing soil degradation. Sustainability 2015, 7, 988–1027. [Google Scholar] [CrossRef]
  38. Balan, A.; Senicovscaia, I.; Daniliuc, R. Contribution of soil invertebrates to the stability of eroded soils in the south of the Republic of Moldova. Ser. A Agron 2012, LV-2012, 19–24. [Google Scholar]
  39. Barrios, E. Soil biota, ecosystem services and land productivity. Ecol. Econ. 2007, 64, 269–285. [Google Scholar] [CrossRef]
  40. Kooch, Y.; Haghverdi, K. Earthworms—good indicators for forest disturbance. J. Bibliogr. Sci. Biotech. 2014, 3, 155–162. [Google Scholar]
  41. Barros, E.; Grimaldi, M.; Sarrazin, M.; Chauvel, A.; Mitja, D.; Desjardins, T.; Lavelle, P. Soil physical degradation and changes in macrofaunal communities in central Amazon. Appl. Soil Ecol. 2004, 26, 157–168. [Google Scholar] [CrossRef]
  42. Decaëns, T. Macro-ecological patterns in soil communities. Glob. Ecol. Biogeogr. 2010, 19, 287–302. [Google Scholar] [CrossRef]
  43. Folgarait, P.J. Ant biodiversity and its relationship to ecosystem functioning: A review biodiversity and conservation. Biodivers. Conserv. 1998, 7, 1221–1244. [Google Scholar] [CrossRef]
  44. Santorufo, L.; Cornelis, A.M.; Gestel, V.; Rocco, A.; Maisto, G. Soil invertebrates as bio indicators of urban soil quality. Environ. Pollut. 2012, 16, 57–63. [Google Scholar] [CrossRef] [PubMed]
  45. Khosravi, H.; Mahdieh, E. Effects of rangeland exclusion on plant cover and soil properties in a steppe rangeland of southeastern Iran. Arid Land Res. Manag. 2017. [Google Scholar] [CrossRef]
Figure 1. Location map of the study area.
Agronomy 08 00056 g001
Figure 2. Monthly total rain fall and average maximum and minimum temperatures of the study area (2002–2015).
Agronomy 08 00056 g002
Figure 3. Major soil and water conservation measures in one site (A) non-conserved grazing land; (B): terraces in grazed land; (C) exclosure + terrace; and (D) exclosure alone in one site.
Agronomy 08 00056 g003
Figure 4. Effect of soil depth on SMI diversity. Different letters above the bars indicate significant differences among soil depth. Bars indicate mean ± SEM.
Agronomy 08 00056 g004
Figure 5. Effect of season on SMI diversity. Different letters above the bars indicate significant differences between seasons. Bars indicate mean ± SEM.
Agronomy 08 00056 g005
Figure 6. PCA bi plot graph of studied soil properties.
Agronomy 08 00056 g006
Table 1. Characteristics of the community based SWC measures.
SWC MeasuresCharacteristics
Non-conserved communal grazing landsLow vegetation cover (Figure 3)
High proportion of bare soil (personal observation)
High stone cover/coarse fragment (Table 2)
Sheet, rill, and gully erosion very common(personal observation)
Low organic carbon (Table 2)
Low moisture content (Table 2)
Approximately not more than 10% vegetation cover (from plot wise estimation)
Stone terraces in grazing landsRelatively more stable and durable than other physical SWC measures
Higher organic matter than non-terraced fields (Table 2)
Significantly higher moisture content than non-conserved grazing lands (Table 2)
High sediment deposit (personal observation)
Approximately not more than 10%vegetation cover (from plot wise estimation)
Exclosures + terracesClosed from the interference of humans and livestock
Enrichment planting common
Supported with terraces (Figure 3)
High organic carbon (Table 2)
Sheet, rill, and gully erosion are less common (personal observation)
Approximately greater than 50% vegetation cover (from plot wise estimation)
Significantly higher moisture content than non-conserved grazing lands (Table 2)
Exclosures aloneClosed from humans and livestock interference
No enrichment planting
No physical SWC measures (Figure 3)
High organic carbon (Table 2)
Sheet, rill, and gully erosion are less common than non-conserved grazing lands (personal observation)
Approximately greater than 50% vegetation cover (from plot wise estimation)
Table 2. Mean values of soil properties in response to SWC measures 30 cm depth (mean ± SEM).
SWCSoil Moisture (%)pHBulk Density (kg m−3)SOC (%)Coarse Fragment (%)SOC Stock (kg m−2)
Non-conserved grazing lands 8.59 ± 0.02 b8.22 ± 0.04 b1290 ± 31.9 a1.9 ± 0.1 c57.03 ± 1.6 b160.7 ± 11.2 c
Terraces in grazing lands9.61 ± 0.01 a8.21 ± 0.04 b1260 ± 27.8 a2.5 ± 0.1 b53.2 ± 2.3 b210 ± 12.5 b
Exclosures + terraces10.06 ± 0.01 a8.08 ± 0.03 a1240 ± 20.7 a2.9 ± 0.1 a45.5 ± 2.0 a288.7 ± 14.0 a
Exclosures alone8.70 ± 0.03 b7.9 ± 0.04 a1220 ± 47.6 a2.8 ± 0.1 a54.4 ± 2.1b236 ± 12.6 b
Means of each soil property followed by the same letter across each row do not differ significantly at P ≤ 0.05. a, b and c represent mean separation codes or letters.
Table 3. Effect of SWC on abundance of soil macroinvertebrates (individuals m−2).
SMINon Conserved Communal Grazing Lands%Terraces in Grazed Lands%Exclosures with Terraces%Exclosure alone %
Formicidae745.823.8755.624.1858.727.4780.024.8
Termitidae0.90.1250.737.5241.336.1175.126.2
Carabidae10.416.33.65.622.234.927.643.3
Rhinotermitidae0.00.08.920.829.368.84.410.4
Spirostreptidae9.816.711.519.712.421.224.942.4
Gryllidae12.417.918.726.924.034.614.220.5
Lycosidae 6.217.57.120.015.142.57.120.0
Scarabaeidae10.726.713.333.311.628.94.411.1
Scorpionidae2.79.116.054.53.612.17.124.2
Cryptopidae9.828.22.77.713.338.58.925.6
Blattidae2.715.06.234.97.139.91.810.0
Lumbricidae0.00.04.431.35.337.54.431.3
Acrididae0.00.00.99.16.263.62.727.3
Dytiscidae0.00.00.00.02.7100.00.00.0
Staphylinidae0.00.01.825.02.737.52.737.5
Scutigeridae 0.00.02.6100.00.00.00.00.0
Ligiidae 0.00.00.00.00.00.00.9100.0
Bostrichidae0.933.30.933.30.00.00.933.3
Argasidae 0.00.00.950.00.950.00.00.0
Japygidae0.00.00.000.00.00.9100
Total 811.619.11105.726.11256.429.61068.025.2
Table 4. Effect of SWC measures on abundance and diversity of soil macroinvertebrates (family level) (Mean ± SEM).
IndicesSWC Measures
Non Conserved Communal Grazing LandTerraces in Grazed LandExclosures with TerracesExclosures alone
Abundance 811.6 ± 318.9 a1105.7 ± 318.9 bc1256.4 ± 318.9 a1067.1 ± 318.9 ab
Family richness2.8 ± 0.32 b3.3 ± 0.76 b4.4 ± 0.68 a3.7 ± 0.61 ab
Shannon diversity index0.9 ± 0.12 b0.9 ± 0.19 b1.21 ± 0.16 a1.0 ± 0.17 ab
Evenness 0.9 ± 0.01 a0.9 ± 0.05 a0.9 ± 0.01 a0.9 ± 0.01 a
Simpson index (1_D)0.5 ± 0.06 a0.4 ± 0.08 a0.6 ± 0.07 a0.5 ± 0.07 a
Dominance_D0.5 ± 0.06 a0.5 ± 0.08 a0.4 ± 0.07 a0.5 ± 0.07 a
Means followed by the same letter across each column do not differ significantly at P ≤ 0.05. a, b and c represent mean separation codes or letters.
Table 5. Effect of soil depth on abundance of soil macroinvertebrates (individuals m−2) (Mean ± SEM).
SMISoil Depth
0–10 cm10–20 cm20–30 cm
Formicidae1424.4 ± 300.04 a664.4 ± 117.33 b266.2 ± 31.19 b
Termitidae207.3 ± 156.97 a177.0 ± 130.51 a116.7 ± 107.09 a
Carabidae32.0 ± 15.51 a15.3 ± 8.14 ab1.3 ± 0.92 b
Rhinotermitidae8.7 ± 6.16 a0.7 ± 0.66 a22.7 ± 19.99 a
Spirostreptidae 35.3 ± 13.44 a8.7 ± 3.72 b0.0 ± 0 b
Gryllidae36.7 ± 11.00 a10.7 ± 6.22 b 4.7 ± 2.80 b
Lycosidae23.3 ± 8.28 a2.0 ± 1.46 b1.3 ± 0.92 b
Scarabaeidae25.3 ± 7.69 a1.3 ± 1.33 b3.3 ± 2.15 b
Scorpionidae18.7 ± 6.78 a1.3 ± 0.92 b2.0 ± 1.46 b
Cryptopidae14.0 ± 4.00 a 6.0 ± 2.69 a6.0 ± 3.02 a
Blattoidae6.0 ± 2.11 a6.0 ± 3.01 a1.3 ± 0.92 a
Lumbricidae6.0 ± 2.69 a4.7 ± 3.53 a0.0 ± 0 a
Acrididae6.0 ± 2.85 a1.3 ± 1.33 b 0.0 ± 0.0 b
Dytiscidae2.0 ± 2.00 a0.0 ± 0.0 a0.0 ± 0 a
Staphylinidae2.7 ± 1.57 a1.3 ± 1.33 a1.3 ± 0.92 a
Scutigeridae 2.0 ± 1.08 a0.0 ± 0.0 b0.0 ± 0 b
Ligiidae 0.7 ± 0.66 a0.0 ± 0.0 a0.0 ± 0 a
Bostrichidae1.3 ± 0.92 a0.7 ± 0.66 a0.0 ± 0 a
Argasidae 1.3 ± 0.92 a0.0 ± 0.0 a0.0 ± 0 a
Japygidae0.0 ± 0 a0.7 ± 0.66 a0.0 ± 0 a
Mean total1852.4 ± 350.59 a902.0 ± 218.58 b326.9 ± 112.66 c
Means followed by the same letter across each column do not differ significantly at P ≤ 0.05. a, b and c represent mean separation codes or letters.
Table 6. Effect of season on abundance of SMI (individuals m−2) (Mean ± SEM).
Soil MacroinvertebratesWet SeasonDry Season
Formicidae1289.3 ± 10.00 a280.7 ± 21.22 b
Termitidae326.4 ± 147.93 a7.6 ± 5.11 b
Carabidae28.0 ± 11.13 a3.7 ± 1.61 b
Rhinotermitidae21.3 ± 13.79 a0.0 ± 0.00 a
Spirostreptidae 24.0 ± 9.29 a5.3 ± 2.62 a
Gryllidae16.4 ± 5.96 a18.2 ± 6.98 a
Lycosidae16.9 ± 5.77 a0.9 ± 0.61 b
Scarabaeidae15.6 ± 5.31 a4.4 ± 2.35 b
Scorpionidae12.4 ± 4.73 a2.2 ± 1.13 b
Cryptopidae8.9 ± 2.95 a8.4 ± 2.50 a
Blattoidae6.7 ± 2.24 a2.2 ± 1.13 a
Lumbricidae7.1 ± 2.88 a0.0 ± 0.00 b
Acrididae3.6 ± 1.92 a1.3 ± 0.98 a
Dytiscidae1.3 ± 1.33 a0.0 ± 0.00 a
Staphylinidae3.6 ± 1.44 a0.0 ± 0.00 b
Scutigeridae 1.3 ± 0.73 a0.0 ± 0.00 b
Ligiidae 0.4 ± 0.44 a0.0 ± 0.00 a
Bostrichidae0.4 ± 0.44 a0.9 ± 0.61 a
Argasidae 0.4 ± 0.44 a0.4 ± 0.44 a
Japygidae0.4 ± 0.44 a0.0 ± 0.00 a
Mean total1784.6 ± 263.87 a336.2 ± 26.06 b
Means of each SMI followed by the same letter across each column do not differ significantly at P ≤ 0.05. a, b and c represent mean separation codes or letters.
Table 7. Effect of SWC measures on Sorenson’s similarity index of soil macroinvertebrates (Mean ± SEM).
SWC MeasuresWet Season
Non-Conserved Grazing LandsTerraces in Grazed LandsExclosures with TerracesExclosures alone
Non-conserved grazing land
Terraces in grazed lands0.37 ± 0.04 ab
Exclosures with terraces0.38 ± 0.02 ab0.39 ± 0.0 a
Exclosures without terraces0.33 ± 0.05 ab0.38 ± 0.02 ab0.41 ± 0.01 a
Dry Season
Non conserved grazing lands
Terraces0.32 ± 0.03 ab
Exclosures with terraces0.36 ± 0.04 ab0.20 ± 0.0 c
Exclosures without terraces0.39 ± 0.03 ab0.26 ± 0.07 bc0.35 ± 0.05 ab
Means followed by the same letter across each column do not differ significantly at P ≤ 0.05. a, b and c represent mean separation codes or letters.
Table 8. Relationship between SMI abundance and soil properties.
Parameters AbundanceSoil MoisturepHBulk DensityCoarse FragmentSocSoc Stock
Abundance 1
Soil moisture0.85 ns1
pH−0.46 ns0.85 ns1
Bulk density−0.71 ns−0.22 ns0.30 ns1
Coarse fragment−0.89 ns−0.89 ns0.58 ns0.45 ns1
SOC0.90 ns0.54 ns0.03 ns−0.93 ns−0.72 ns1
SOC stock0.97 *0.76 ns0.31 ns−0.77 ns−0.92 ns0.94 ns1
*: correlation is significant at P < 0.05; ns refers to correlation is not significant.

