Variation of Agronomic Traits of Ravenna Grass and Its Potential as a Biomass Crop

USDA-ARS, Southern Plains Range Research Station, Woodward, OK 73801, USA
Agronomy 2018, 8(5), 70; https://doi.org/10.3390/agronomy8050070
Submission received: 11 April 2018
/
Revised: 7 May 2018
/
Accepted: 9 May 2018
/
Published: 12 May 2018
(This article belongs to the Special Issue Forage and Bioenergy Crops)
Abstract
:Ravenna grass (Tripidium ravennae) is a tall robust bunchgrass with potential as an energy crop. The aim was to investigate the variation of agronomic traits of Ravenna grass. Univariate analyses of traits were conducted on 95 plants from 2013 to 2017. The traits were: biomass yield per plant; C, N, and ash concentrations; leaf and culm sap sucrose concentrations; percentage seed set, and the number of caryopses per panicle. In 2013, the biomass yield averaged 0.21 ± 0.09 kg per plant (mean ± the standard deviation). In 2014 to 2017, the yield averaged from 3.9 ± 0.8 kg per plant to 7.5 ± 1.8 kg per plant. Carbon concentration was generally higher than other energy crops, while N and ash concentrations were generally lower. Leaf sap sucrose ranged from 24.4 ± 4.6 g kg−1 in 2016 to 41.6 ± 7.6 g kg−1 in 2013. Culm sap sucrose varied from approximately 1.6 to 2.1 times that of leaf sap depending upon the harvest year. The percentage seed set varied between years ranging from 37.2 ± 12.4% to 56.6 ± 9.8%, and the mean number of caryopses per panicle varied from 4,770 ± 2,000 to 11,470 ± 3,075.
1. Introduction
Ravenna grass (Tripidium ravennae) is a tall robust bunchgrass indigenous to North Africa, temperate and tropical Asia, and southern Europe [1,2]. Taxonomic synonyms of Tripidium ravennae used in contemporary scientific literature are Saccharum ravennae and Erianthus ravennae [3]. The first known accession of Ravenna grass entered into the U.S. National Plant Germplasm System germplasm collection was Plant Introduction (PI 78779). It was entered on 4 February, 1929, from a collection made in the Democratic Republic of Georgia [2]. The primary uses of Ravenna grass have been for ornamental landscape plantings [4,5], livestock forage in its first year of growth [1], genetic investigations [6], gene sources for improving sugarcane (Saccharum officinarum) [7], and investigations into its agronomic and biomass potential [8,9,10,11]. Although seed production of Ravenna grass is relatively low, under favorable conditions it is capable of producing in excess of 10,000 viable seeds per panicle that are dispersed by wind (anemochory) and/or water (hydrochory) contributing to its ease of escaping cultivation [4,11].
Only a limited number of studies have investigated the potential of Ravenna grass as a livestock forage or biomass crop. Shimura et al. [11] found that the dry-matter (DM) yield of Ravenna grass decreased with increasing frequency of cutting and that palatability was low when it was cut only once a year. They also reported that supplemental nitrogen did not affect forage yield. Shedayi et al. [12] reported that Ravenna grass will grow in very harsh conditions on rocky slopes and gravel banks in the Karakoram mountain range of Pakistan, and that it is the primary forage of the Himalayan ibex (Capra ibex sibirica). However, others have reported that its use by domestic livestock is limited as it is only grazed when the plants are very young [1].
Palmer et al. [9] studied the biomass potential of Ravenna grass and five other perennial grasses in North Carolina. They found that these grasses showed considerable variation in regional adaptation trial for biomass yield where Ravenna grass biomass yield varied from 3.0 to 15.4 Mg ha−1 for a mountain site to 3.9 to 21.1 Mg ha−1 for a coastal plain site. They concluded that Ravenna grass had poor survival at both sites and that it had the potential to produce substantial biomass. Nozoye et al. [13] examined Ravenna grass grown in calcareous and non-calcareous soils in the greenhouse. They found that plant height, tiller number, and chlorophyll content were decreased when grown in a soil of pH 8.9 compared to that of a non-calcareous soil. They suggested that the impaired growth in calcareous soils might be related to a micronutrient deficiency. They reported that roots of Ravenna grass secreted mugineic acid and deoxymugineic acid under Fe-deficiency (a condition that often occurs in high pH soils). Their conclusion was that there was considerable potential to increase the biomass of Ravenna grass plants grown in calcareous soils.
The objective of this study was to investigate the variation of agronomic traits of Ravenna grass and its potential as a biomass crop in the Southern Great Plains of the United States. The traits studied were: plant biomass yield, sucrose concentration in leaf and culm sap, nitrogen concentration of biomass, carbon concentration of biomass, number of caryopses per panicle, and percentage seed set.
2. Materials and Methods
This experiment was conducted at the USDA Agricultural Research Service, Southern Plains Range Research Station, Woodward, OK (36°25′ N, 99°24′ W, and elevation 586 m), on a Carey silt loam soil (fine-silty, mixed, superactive, thermic Typic Argiustolls). The soil of the plot, sampled to a depth of 15 cm, had an average pH of 7.4 ± 0.3, NO3-N of 1.5 ± 0.4 kg ha−1, P of 11.5 ± 1.2 mg kg−1, K of 114 ± 8 mg kg−1, and SOC of 4.9 ± 0.1 mg g−1. The plant material used in this study was collected from a population of Ravenna grass located in an old field site at 36°25′ N latitude by 99°23′ W longitude at 590 m elevation adjacent to a seasonal waterway. Open–pollinated (OP) chaffy–seeds from a single plant (designated as Plant 365) were hand harvested in October 2012 and air dried in the laboratory. The term ‘chaffy–seed’ denotes seed units consisting of a caryopsis and its subtending appendages (lemma, palea, glumes, hairs, and awns). Plant 365 was selected because it had the greatest leaf sucrose concentration of the 196 plants sampled from the population. The sucrose concentration of Plant 365 averaged 70 ± 15 g kg−1 of leaf sap. The sucrose concentration of leaf sap for the sample population averaged 52 ± 9 g kg−1.
In February 2013, the caryopses from Plant 365 were extracted from the chaffy–seeds using a Woodward laboratory air–seed shucker (Ag–Renewal, Inc., Weatherford, Oklahoma, USA). The caryopses were sown onto a greenhouse flat containing a greenhouse soil mixture (Sun Gro Horticulture, Bellevue, WA, USA). When seedlings were large enough for transplanting, 96 individual seedlings were removed from the flat and each seedling was transplanted into an individual cell of cavity trays containing the same soil mixture mentioned above. Seedlings were maintained in a greenhouse at 25 ± 5 °C under natural light and day length conditions until field planting. In April 2013, plants were transplanted into three rows each containing 32 plants. The plants were spaced 1.1 m apart within the rows and 2.2 m apart between the rows (equivalent to 4300 plants per hectare). By the end of the growing season only one plant had died. No supplemental fertilizer or irrigation was applied during the establishment year (2013) or throughout the life of the experiment.
2.1. Sucrose Concentration of Leaf and Culm Sap
From 2013 to 2017, sucrose concentration was determined using a Pocket Refractometer (Model PAL-1, ATAGO Co., Ltd., Tokyo, Japan). In mid–September of each year, three basal leaves were harvested from each plant and cut into approximately 3.0 cm segments and placed into a hand–operated juice press. Enough pressure was applied to release the sap from the leaves. Approximately 0.5 mL of sap was collected using a disposable transfer pipet and placed onto the prism surface of the calibrated refractometer and a measurement was taken. The refractometer was cleaned and recalibrated using deionized water between samples. The culm sucrose concentration was similarly determined. A single reproductive culm was randomly harvested from each plant, and the third internode from the base of the culm was removed and cut into approximately 3.0 cm segments and placed into the hand–operated press. The third internode was chosen because it is directly above the height of biomass cut of 3.0 dm (see Section 2.3 below). Sap collection and measurements were as before. Data were collected over a four day period each year in early September between 13:00 DST and 15:00 DST.
2.2. Percentage Seed Set and Number of Caryopses Per Panicle
The percentage seed set and number of caryopses per panicle were determined for years 2015 and 2016. Each year in late October, three panicles were harvested from each plant. The panicles were dried and stored at room temperature until processing. Each panicle was stripped of chaffy-seeds and the chaffy-seeds were weighed. A sub–sample of the chaffy–seeds (approximately 5–g) was weighed, and was processed using the Woodward laboratory air–seed shucker to extract the caryopses. The extracted caryopses were weighed in grams, and then counted using an electronic seed counter (International Marketing and Design Corp., San Antonio, TX, USA). Percentage seed set was calculated by dividing the weight of caryopses by the sub–sample chaffy–seed weight and multiplied by a factor of 2.3 [10] and converted to a percentage. The number of caryopses per panicle was calculated by dividing the chaffy–seed weight of the panicle by the chaffy–seed weight of the sub–sample and the resulting quotient was multiplied by the caryopsis count of the sub–sample.
2.3. Biomass Harvest
Plants were harvested once each year from 2013 to 2017 during the dormant season. The 2013 growing season biomass was harvested using a hand sickle in mid–January 2014. The height of biomass cut was 3.0 dm. This height of cut was chosen to maximize the root and shoot reserves necessary for plant survival throughout the winter months. Each plant was harvested separately and placed into a paper bag and oven–dried at 60 °C for 7–d. The oven–dried material of each plant was weighed to the nearest gram. The dried plant material of each plant was ground to pass through a 1–mm sieve. A sample of the ground biomass material was used to determine the carbon and nitrogen concentration using an Elementar Vario MAX CN analyzer (Elementar Americas, Inc., Mt. Laurel, NJ, USA). Concentration of ash was determined by first determining the dry matter of ground plant materials from each individual plant. Dry matter was determined by placing crucibles in the oven overnight at 105 °C. Crucibles were then cooled in a desiccator and weighed. Next, an approximately 0.5 g sample of ground biomass from each plant was weighed into each crucible and the weight of the crucible plus sample recorded. The crucibles with samples were dried overnight at 105 °C, cooled in a desiccator, and re-weighed. Dry matter was determined by subtracting the crucible weight from the crucible plus biomass sample weight. After dry matter determination, samples were ashed in a muffle furnace for 6 h at 600 °C. Samples were then transferred back to the drying oven (105 °C) for at least 30 min and then cooled in a desiccator and ash weights were recorded. Total ash was calculated by subtracting the crucible weight from the crucible plus sample ashed weight and then dividing by the sample dry weight. All data are reported on a dry weight basis.
The 2014 to 2017 growing season biomass was harvested using a forage harvester outfitted with a silage chopper-header (Wintersteiger, Inc., Salt Lake City, UT, USA). The height of biomass cut was 3.0 dm. Harvests were completed between mid–December through mid–January each year. The harvested biomass was weighed in kilograms and a 500 g sub–sample of biomass was collected for dry–matter determination. The biomass sub–samples were oven–dried at 60 °C. The DM yield of each plant was calculated by multiplying the percentage DM of the oven–dried sub–sample by the harvested weight of the plant. The oven–dried sub–samples were ground to pass through a 1–mm sieve. The carbon, nitrogen, and ash concentrations of the biomass were determined using the methods presented in the previous paragraph.
2.4. Data Analysis
Data for plant biomass yield, sucrose concentration in leaf and culm sap, nitrogen concentration of biomass, carbon concentration of biomass, number of caryopses per panicle, and percentage seed set were analyzed by year using a univariate procedure [14]. Mean values in the text are reported as mean ± standard deviation unless otherwise stated.
3. Results
Woodward, Oklahoma, USA, typically has a continental climate characterized by hot summers, cold winters, and little rainfall. The length of the growing season at Woodward is approximately 200 d, and the long-term average (LTA) precipitation is 600 mm (LTA, 105 year record at the Southern Plains Range Research Station, USDA-ARS). The LTA growing-season (1 April through 30 September) and dormant-season (1 October through 31 March) precipitation is 434 mm and 188 mm, respectively. The dormant season precipitation was near normal for 2013 (176 mm) and 2017 (188 mm), below normal for 2014 (89 mm) and 2016 (76 mm), and above normal for 2015 (237 mm). The growing season precipitation was near normal for 2013 (423 mm), 2014 (412 mm), and 2016 (423 mm), and above normal for 2015 (573 mm) and 2017 (534 mm). The average high temperature for 1 April through 30 September is 30 °C, and the average low temperature for the same period is 15.5 °C. The average high temperature for 1 October through 31 March is 14.6 °C, and the average low temperature for the same period is −0.3 °C. In general, the average monthly high temperatures during the growing-season from 2013 through 2017 were near or below the average monthly high temperatures for those years. Over the same years, the average monthly low temperatures were near LTA temperatures.
For several years prior to initiating the research, the field plot produced an annual wheat (Triticum aestivum) hay crop, and the soil fertility was minimally maintained, fertilizing with 40 kg ha−1 of urea nitrogen every two or three years. The wheat crop was used mostly to reduce wind erosion of the soil and once the crop was harvested the stubble remained in the field until the next field planting.
3.1. Sucrose Concentration of Leaf and Culm Sap
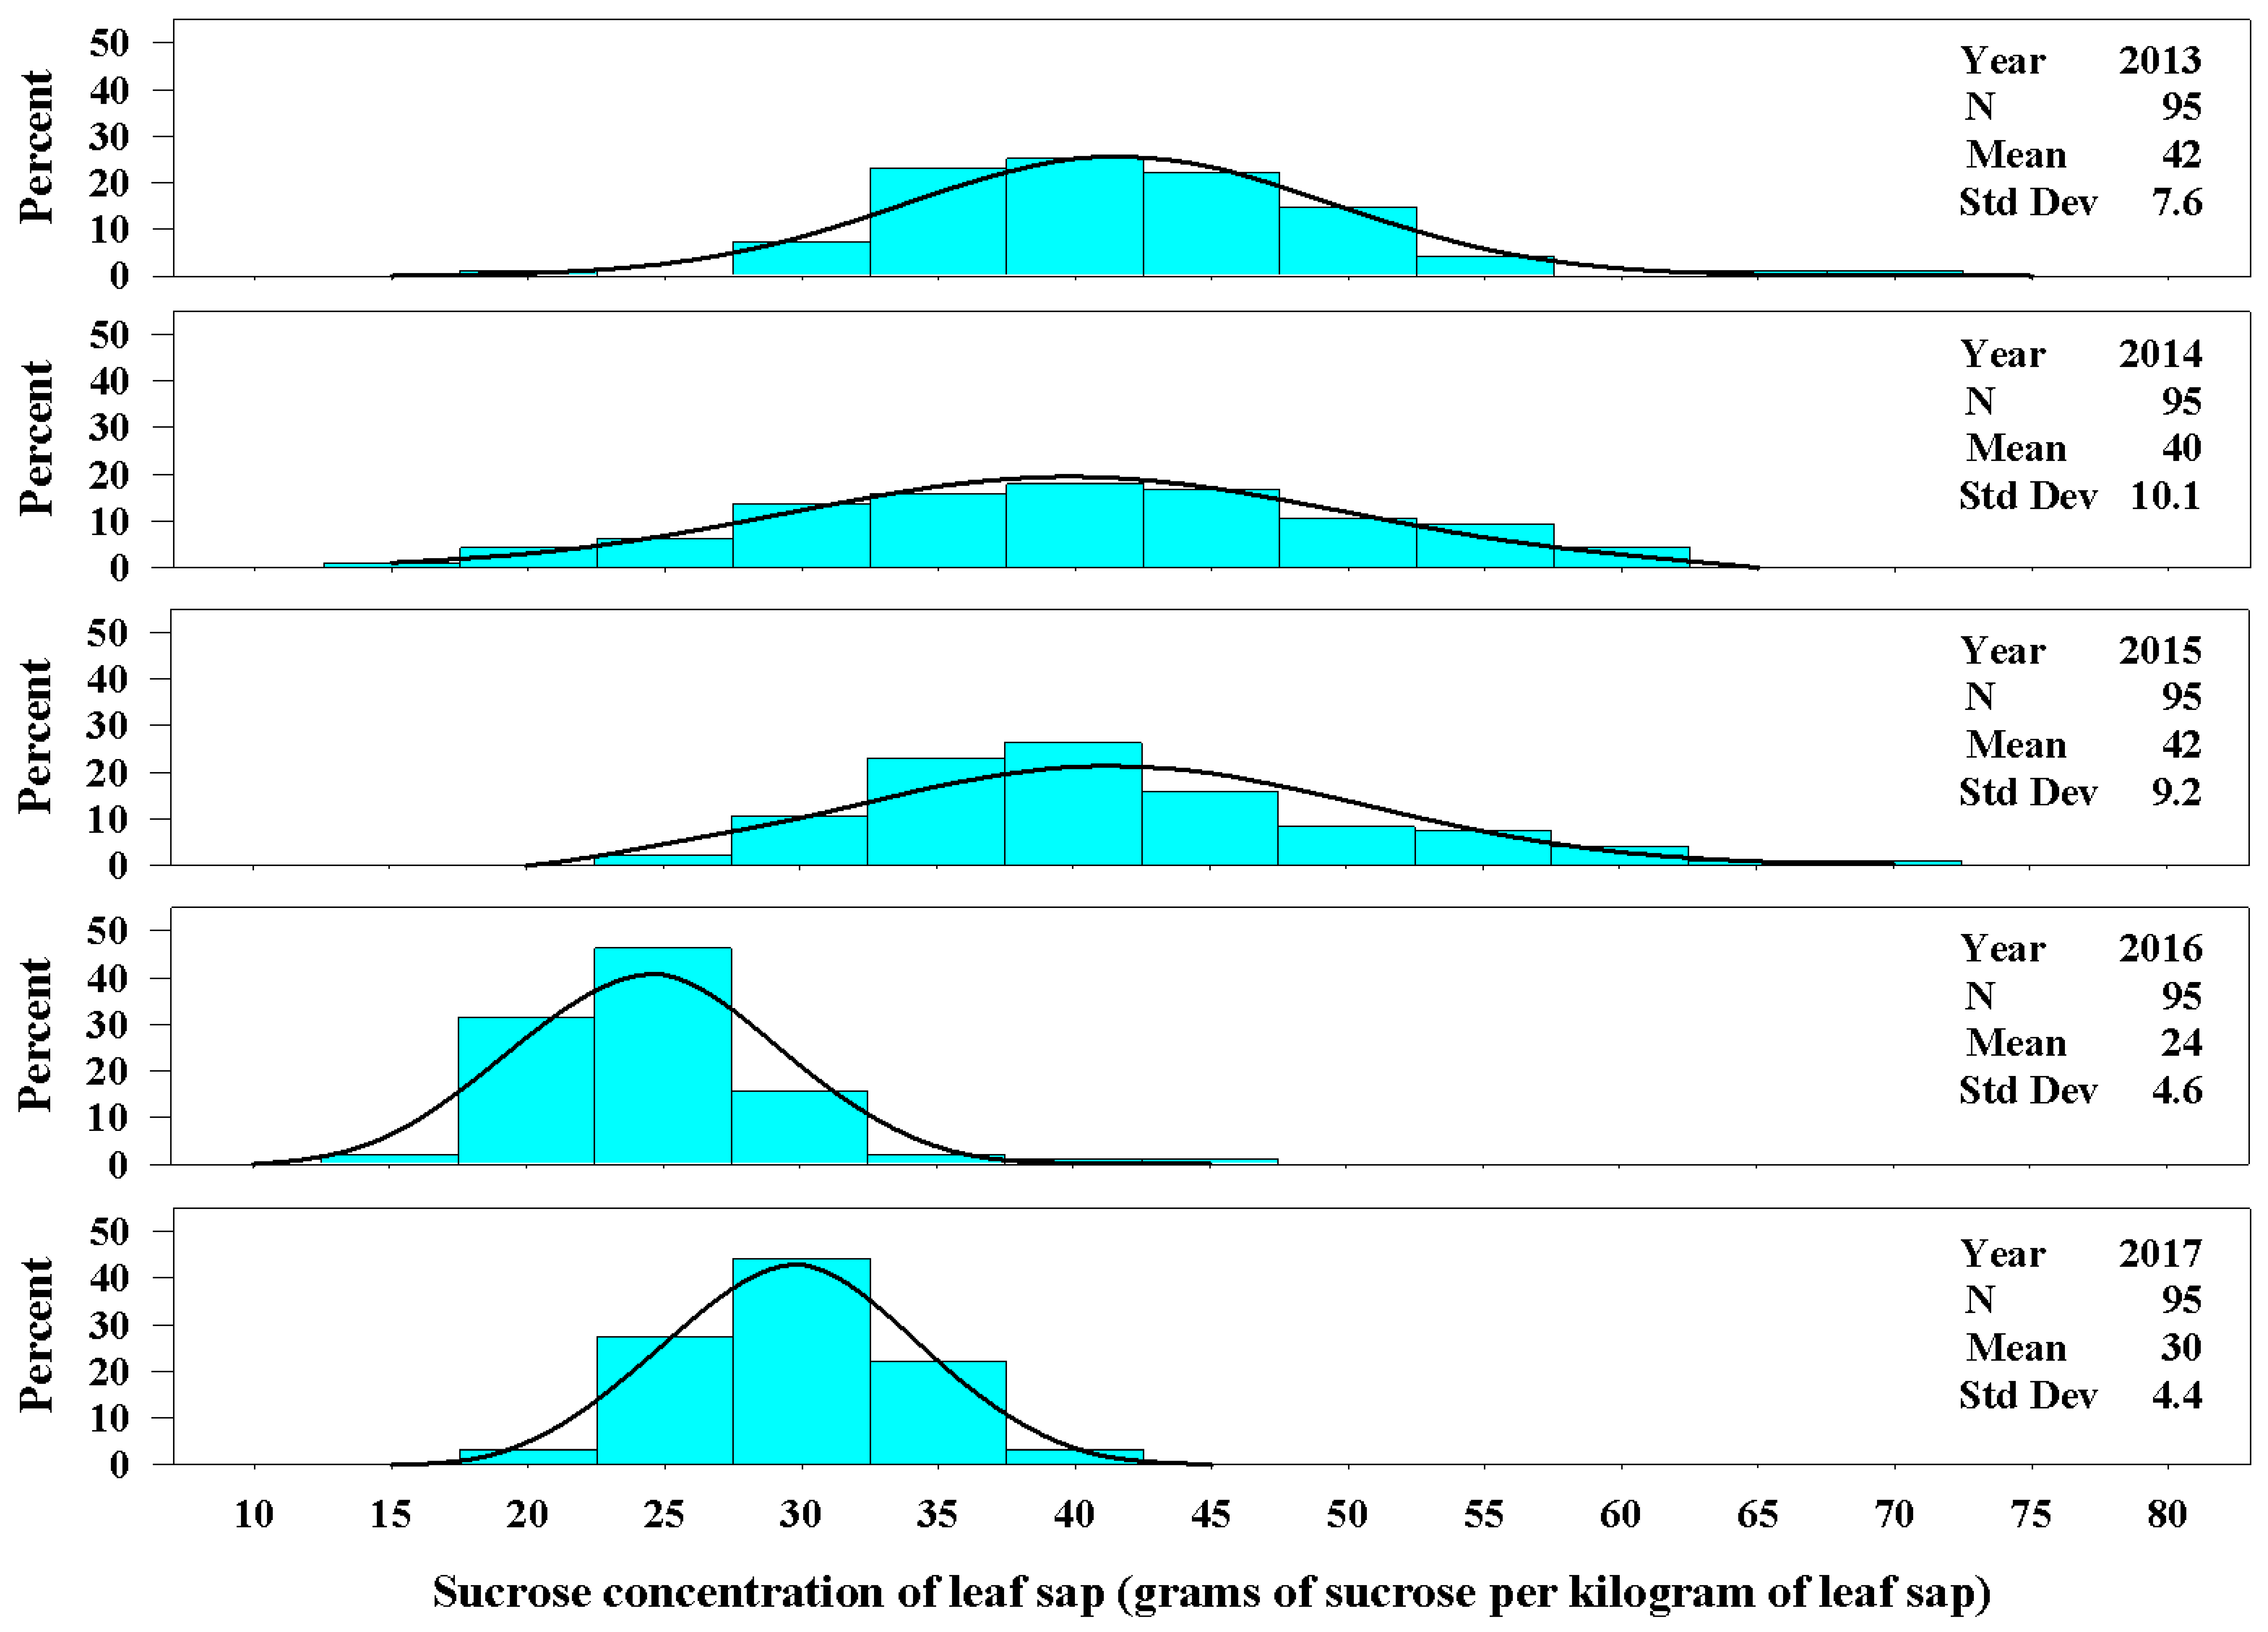
Leaf sucrose concentration varied among years, and the mean value ranged from 24 ± 4.6 g kg−1 of leaf sap in 2016 to 42 ± 7.6 g kg−1 in 2013 (Figure 1). The greatest range among individual plants for sucrose concentration in leaf sap was in 2013 varying from 19 to 71 g kg−1. Plants in 2013, 2014, and 2015 had similar distribution for concentration of sucrose in leaf sap. The distribution of plant sucrose concentration in leaf sap for 2016 and 2017 differed from each other, and also differed from the previous three years (2013 through 2015, Figure 1).
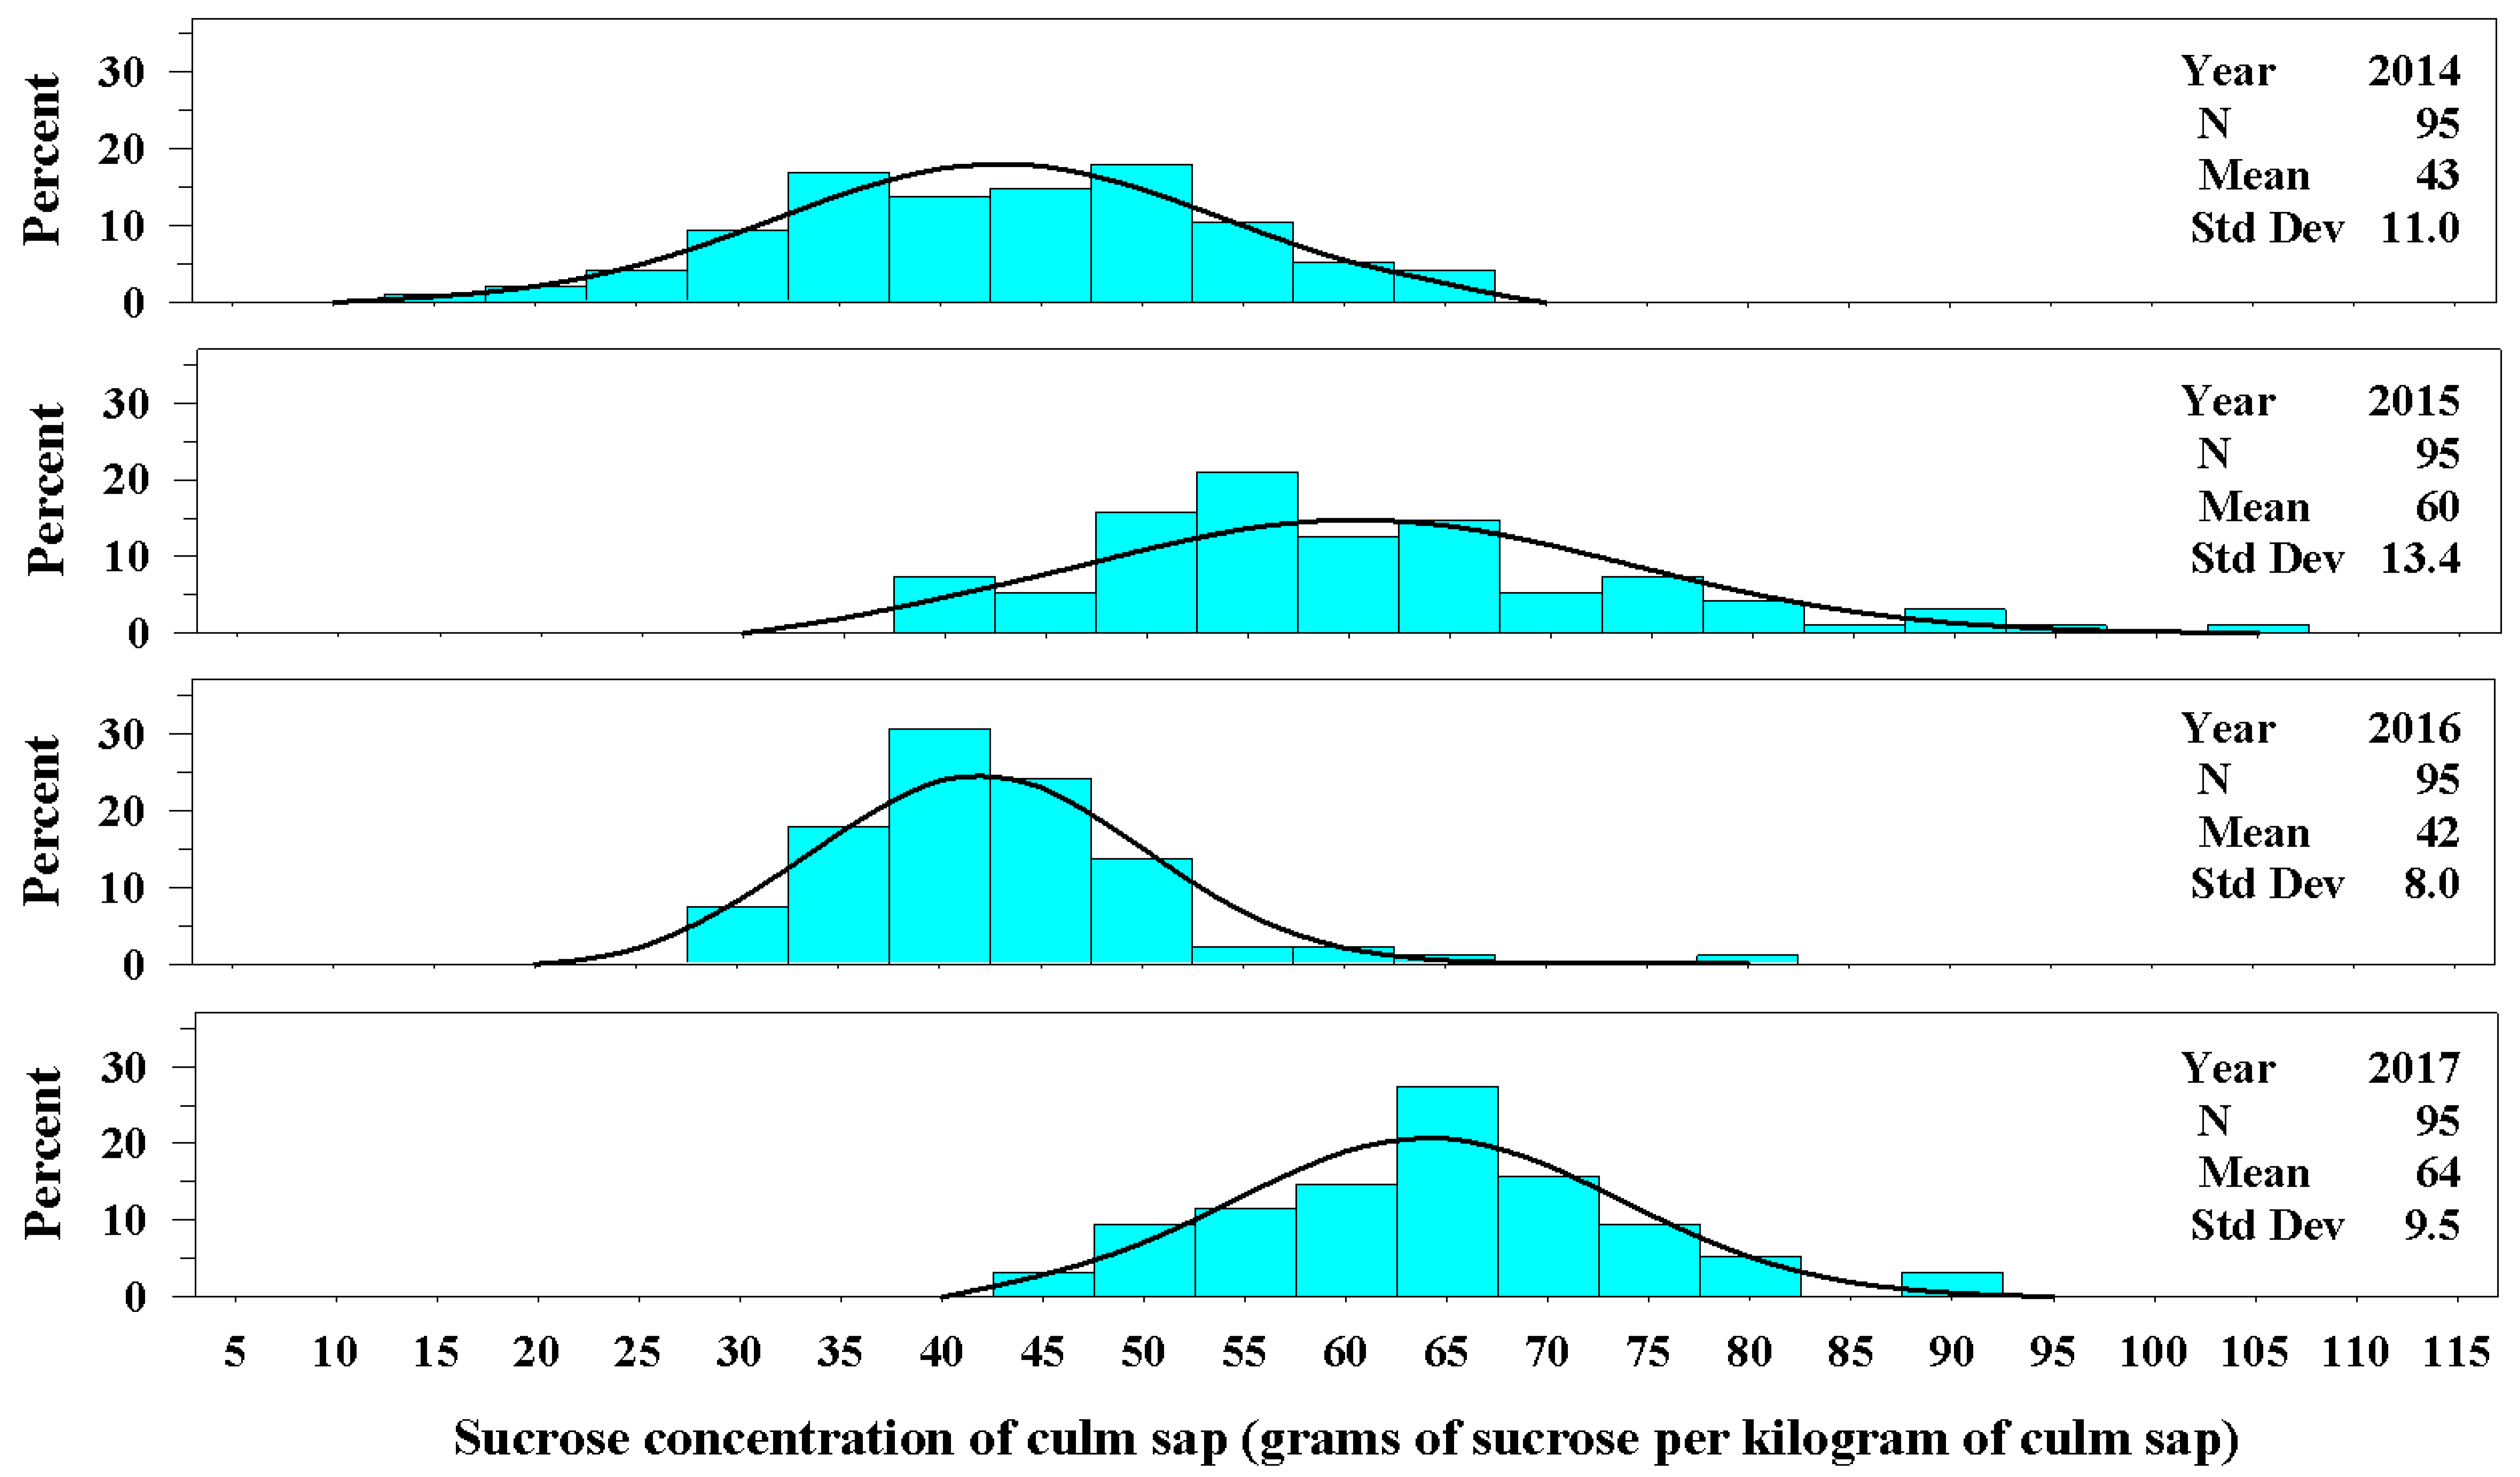
Very few plants produced a culm in 2013; therefore, the sucrose concentration of sap in culms is reported for years 2014 through 2017. The concentration of sucrose in the sap crushed from a culm varied among years and plants. In 2014, the mean sucrose concentration of leaves and culms was very similar (40 ± 10.1 g kg−1 for leaf sap compared with 43 ± 11.0 g kg−1 for culm sap, Figure 2). In 2015 and 2016, the concentration of sucrose in culm sap was approximately 1.6 times that of leaf sap, and in 2017 the concentration of sucrose in culm sap was approximately 2.1 times that of leaf sap.
3.2. Percentage Seed Set and Number of Caryopses Per Panicle
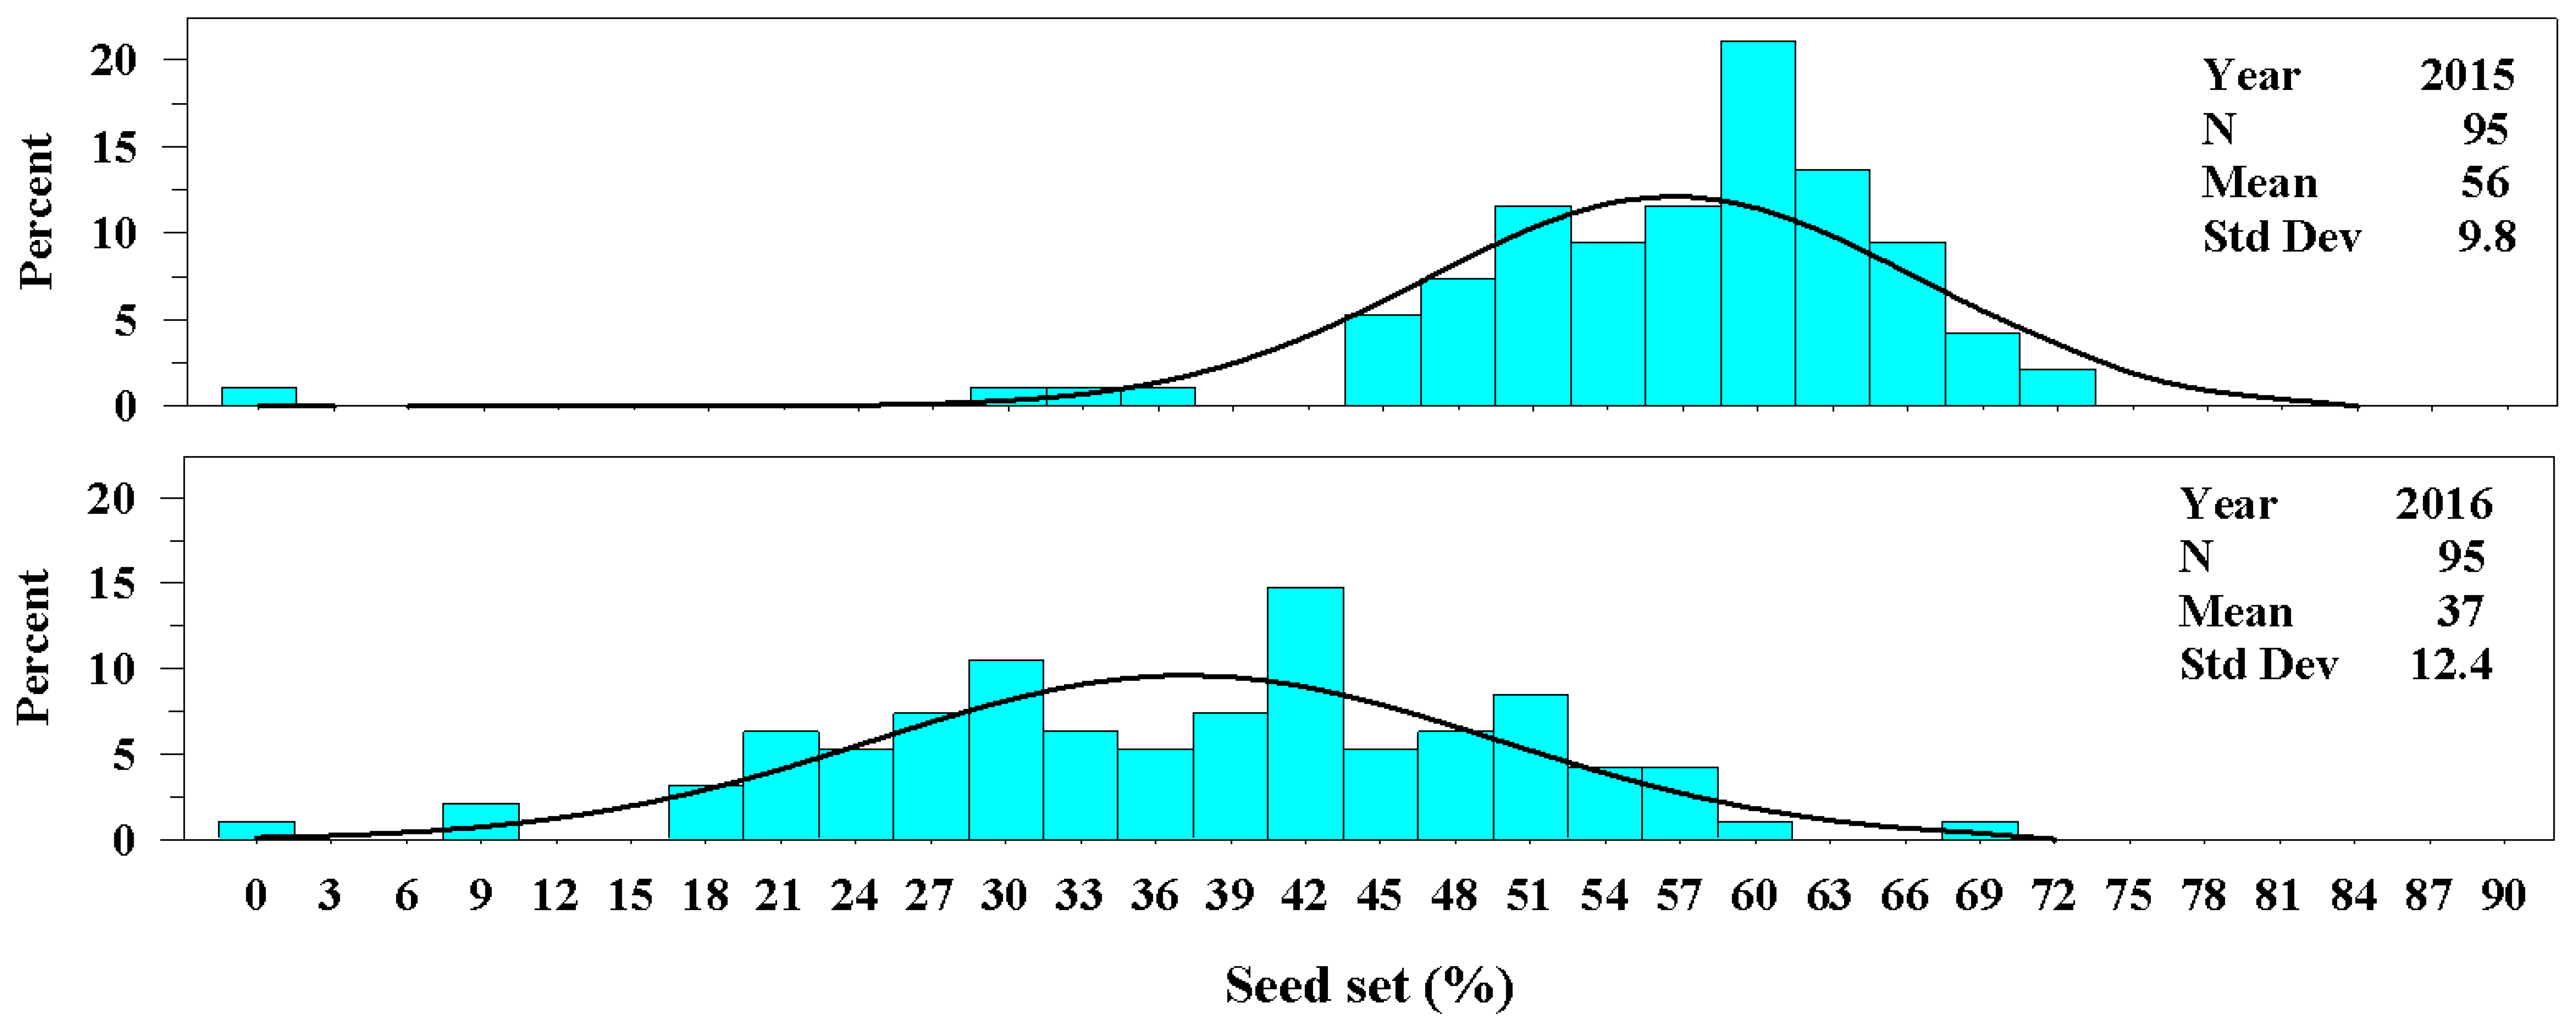
The percentage seed set varied between years. In 2015 seed set averaged 56 ± 9.8% and in 2016 seed set averaged 37 ± 12.4%. Although the univariate distributions were quite different between years, the range in percentage seed set was quite similar, varying from 0 to 72% (Figure 3).
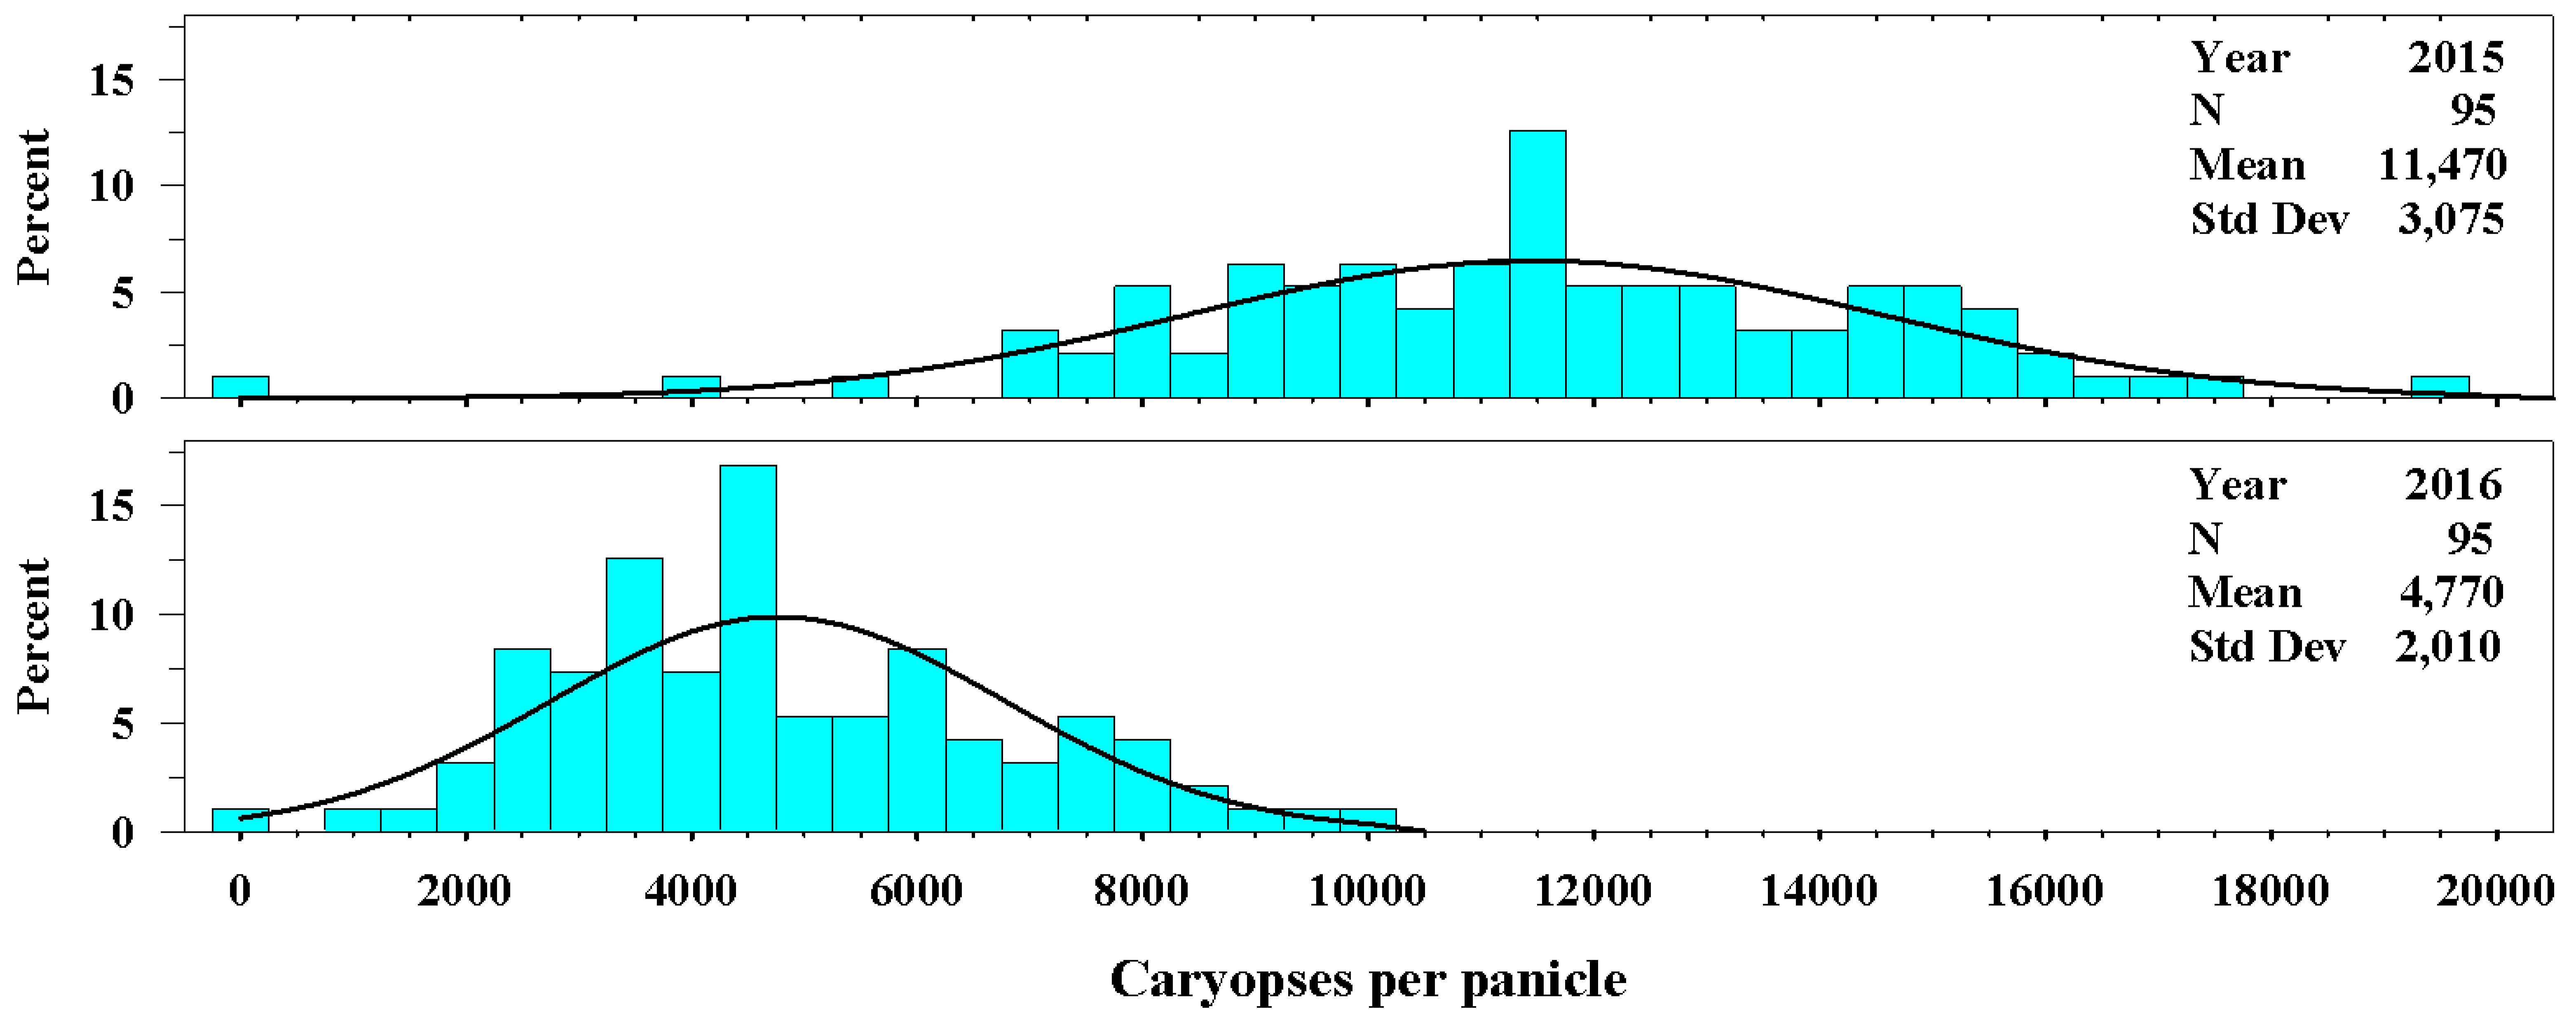
The number of caryopses per panicle also varied between years. In 2015, the number of caryopses per panicle averaged 11,470 ± 3075 and in 2016 averaged 4770 ± 2010 (Figure 4.). The range of the distribution for number of caryopses per panicle for 2016 was 0 to 19,500 caryopses compared with 0 to 10,000 for 2016.
3.3. Biomass Harvested Per Plant; and C, N, and Ash Concentration of Biomass
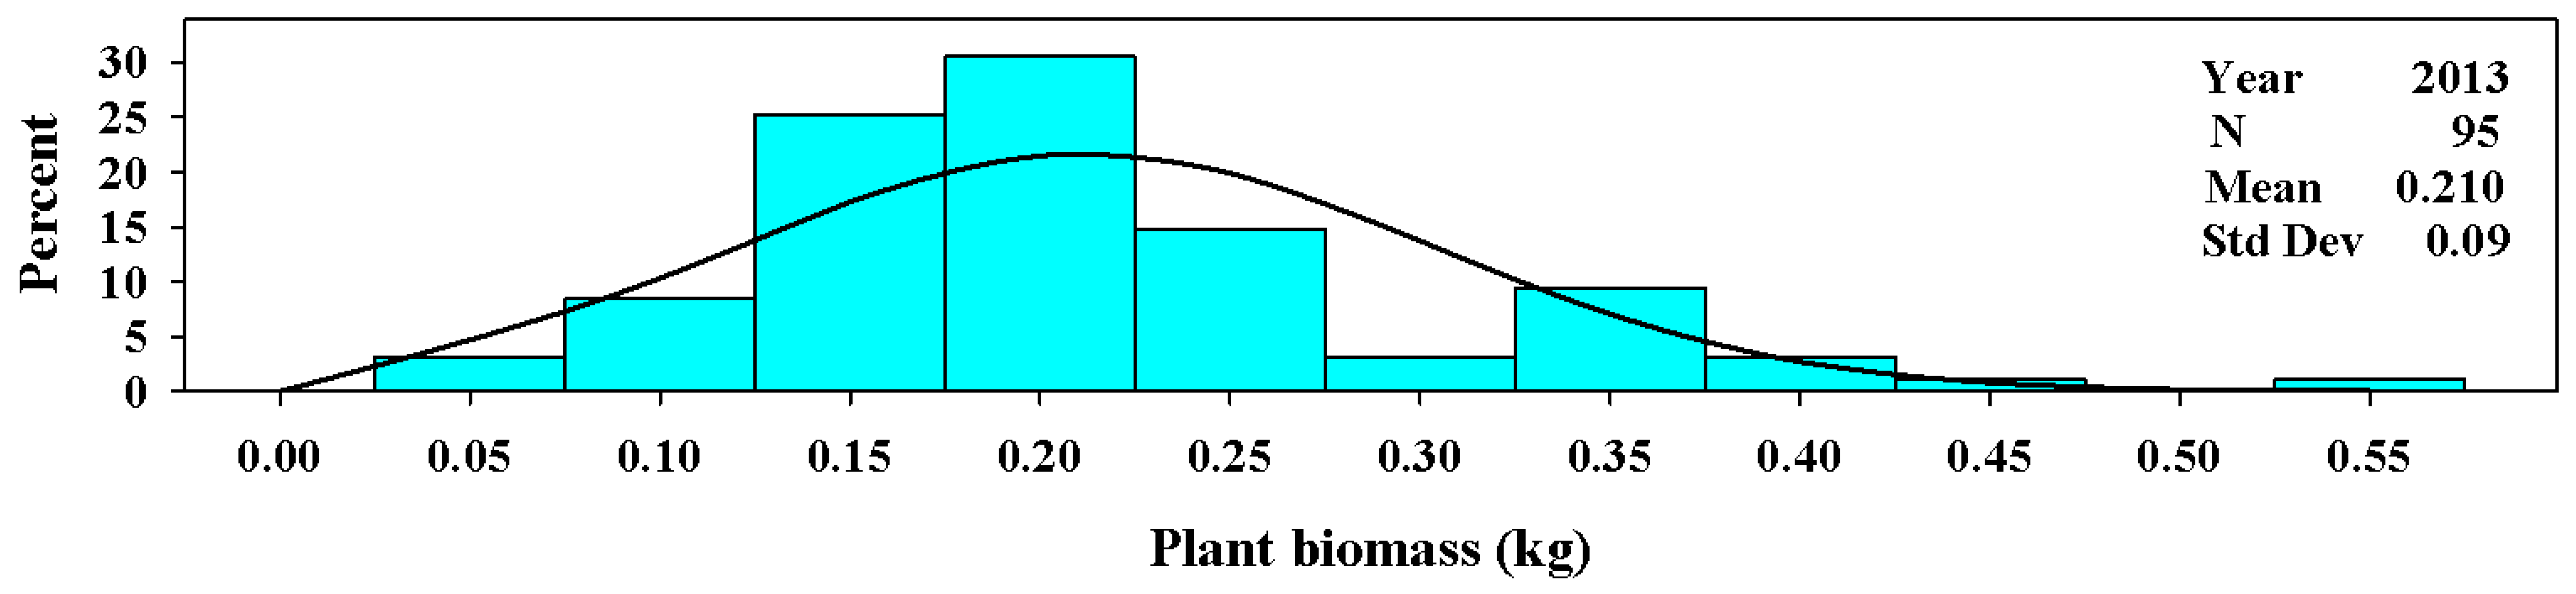
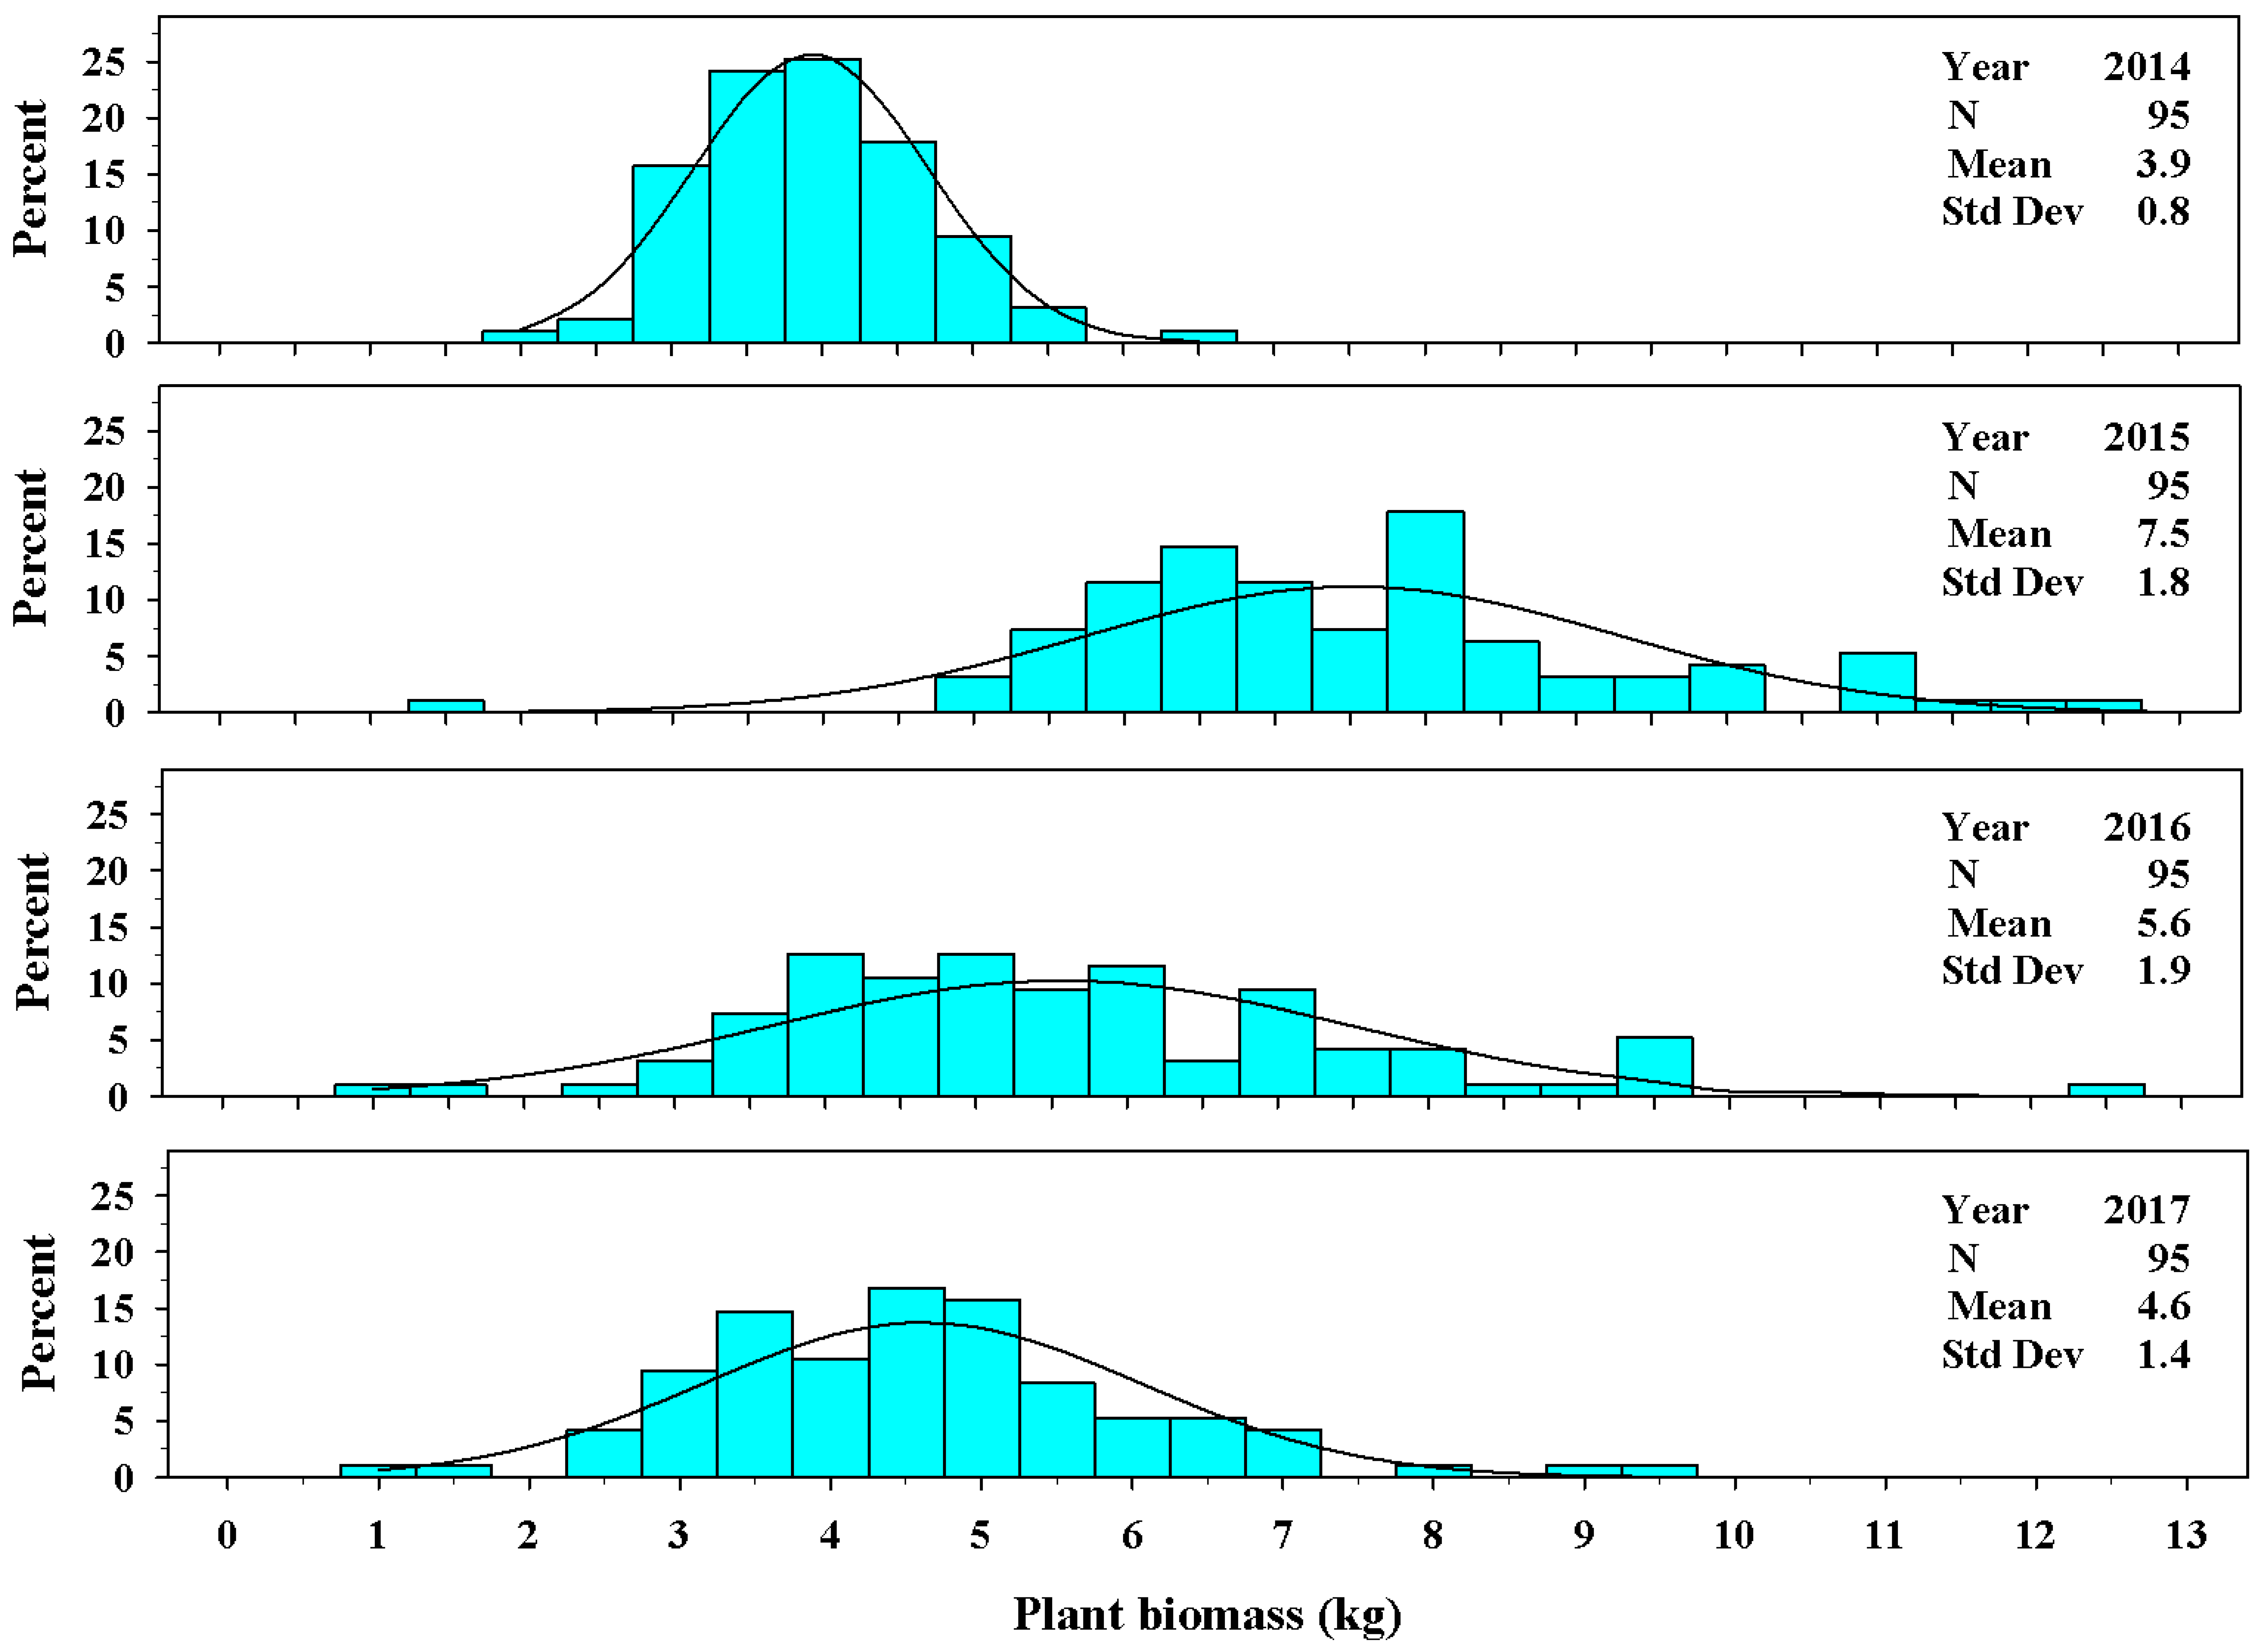
In the establishment year (2013), the distribution of plant biomass ranged from 0.03 to 0.55 kg per plant. The mean value in 2013 was 0.21 ± 0.09 kg per plant (Figure 5). In years 2014 through 2017, the mean values ranged from 3.9 ± 0.8 kg per plant to 7.5 ± 1.8 kg per plant (Figure 6). The range in individual plant biomass was greatest in 2015, ranging from 1.6 to 12.6 kg per plant.
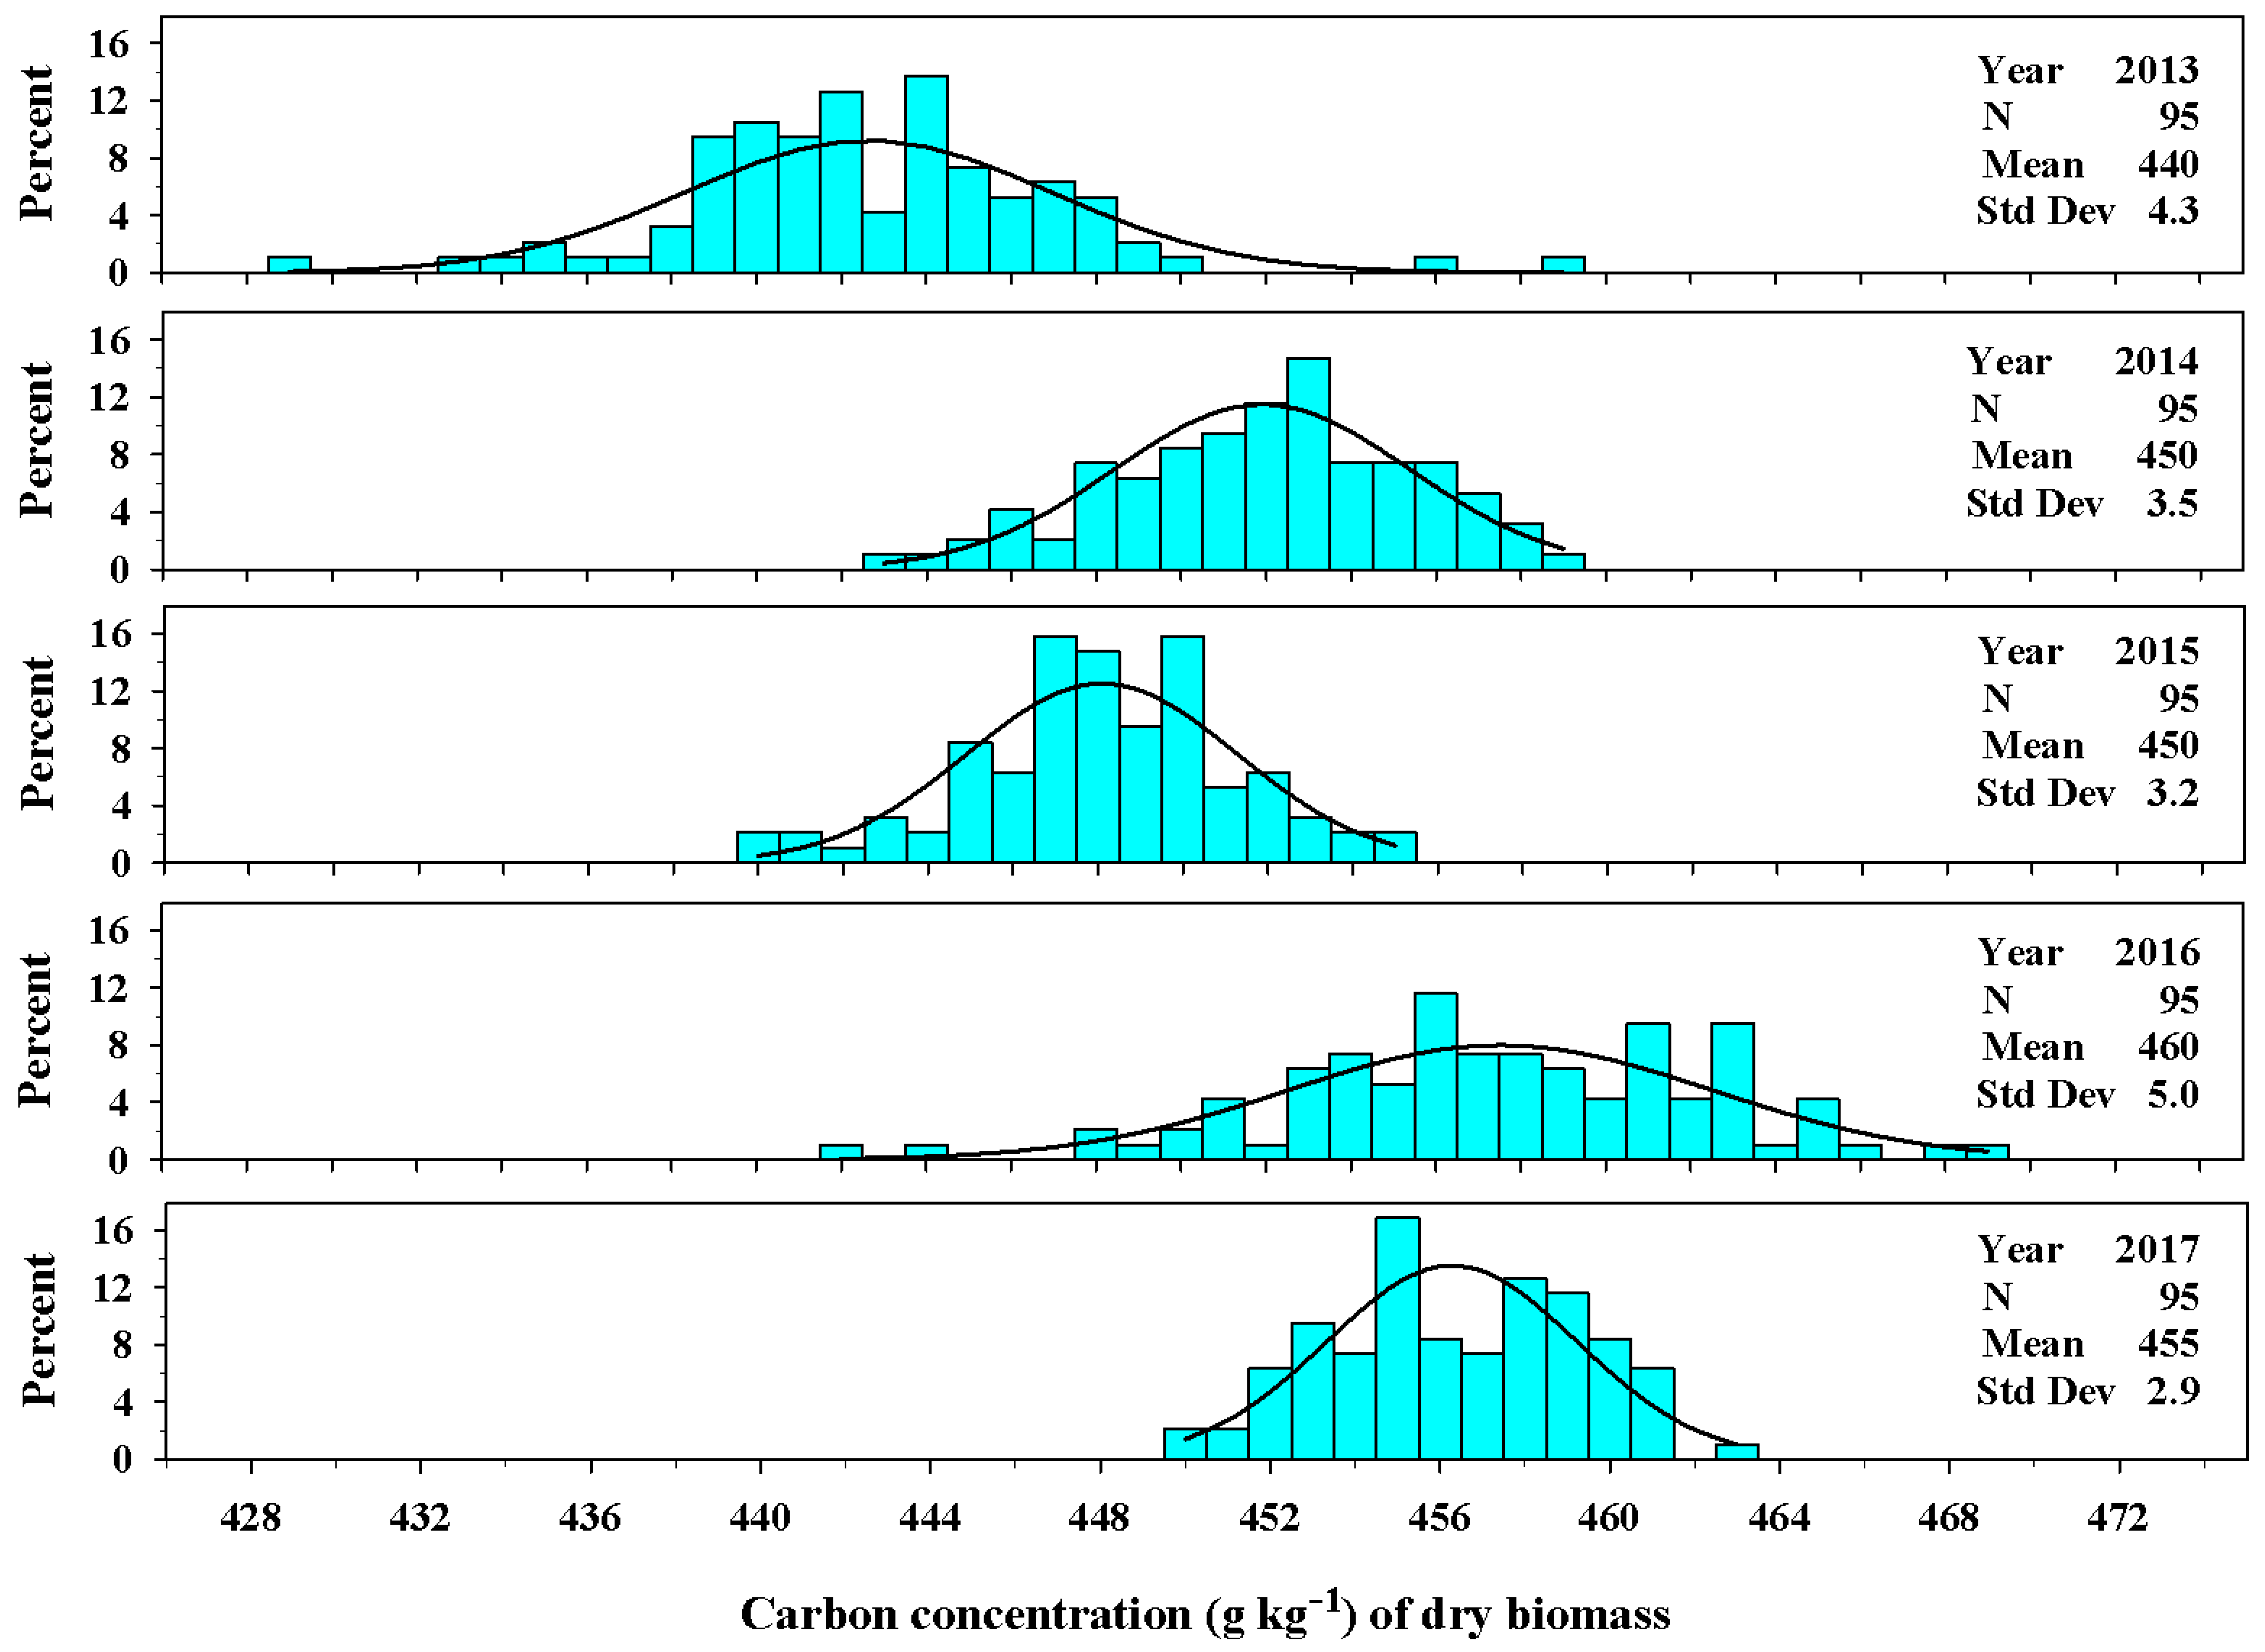
The concentration of carbon varied among years of production. The establishment year (2013) had the lowest carbon concentration averaging 440 ± 4.3 g kg−1 of dry biomass. The years 2014 and 2015 were similar in carbon concentrations averaging 450 ± 3.5 g kg−1 and 450 ± 3.2 g kg−1, respectively. The concentration of carbon ranged from 430 to 470 g kg−1 over the five year period (Figure 7).
The concentration of nitrogen, likewise, varied among the years (Figure 8). The establishment year (2013) had the greatest concentration of nitrogen in the biomass averaging 9.5 ± 0.7 g kg−1 of dry biomass. The 2013 harvest consisted primarily of leaf material. From 2014 to 2017, the nitrogen concentration of biomass was considerably less than the establishment year. Unlike the results for carbon concentration, the nitrogen concentration of biomass for years 2014 and 2015 were dissimilar and averaged 5.1 ± 0.8 g kg−1 of dry biomass and 3.4 ± 0.5 g kg−1 of dry biomass, respectively, as the plants aged. The nitrogen concentration of dry biomass in 2016 and 2017 were more similar and averaged 7.1 ± 0.6 g kg−1 and 6.5 ± 0.5 g kg−1, respectively. The range in values of the distributions decreased as the plants aged.
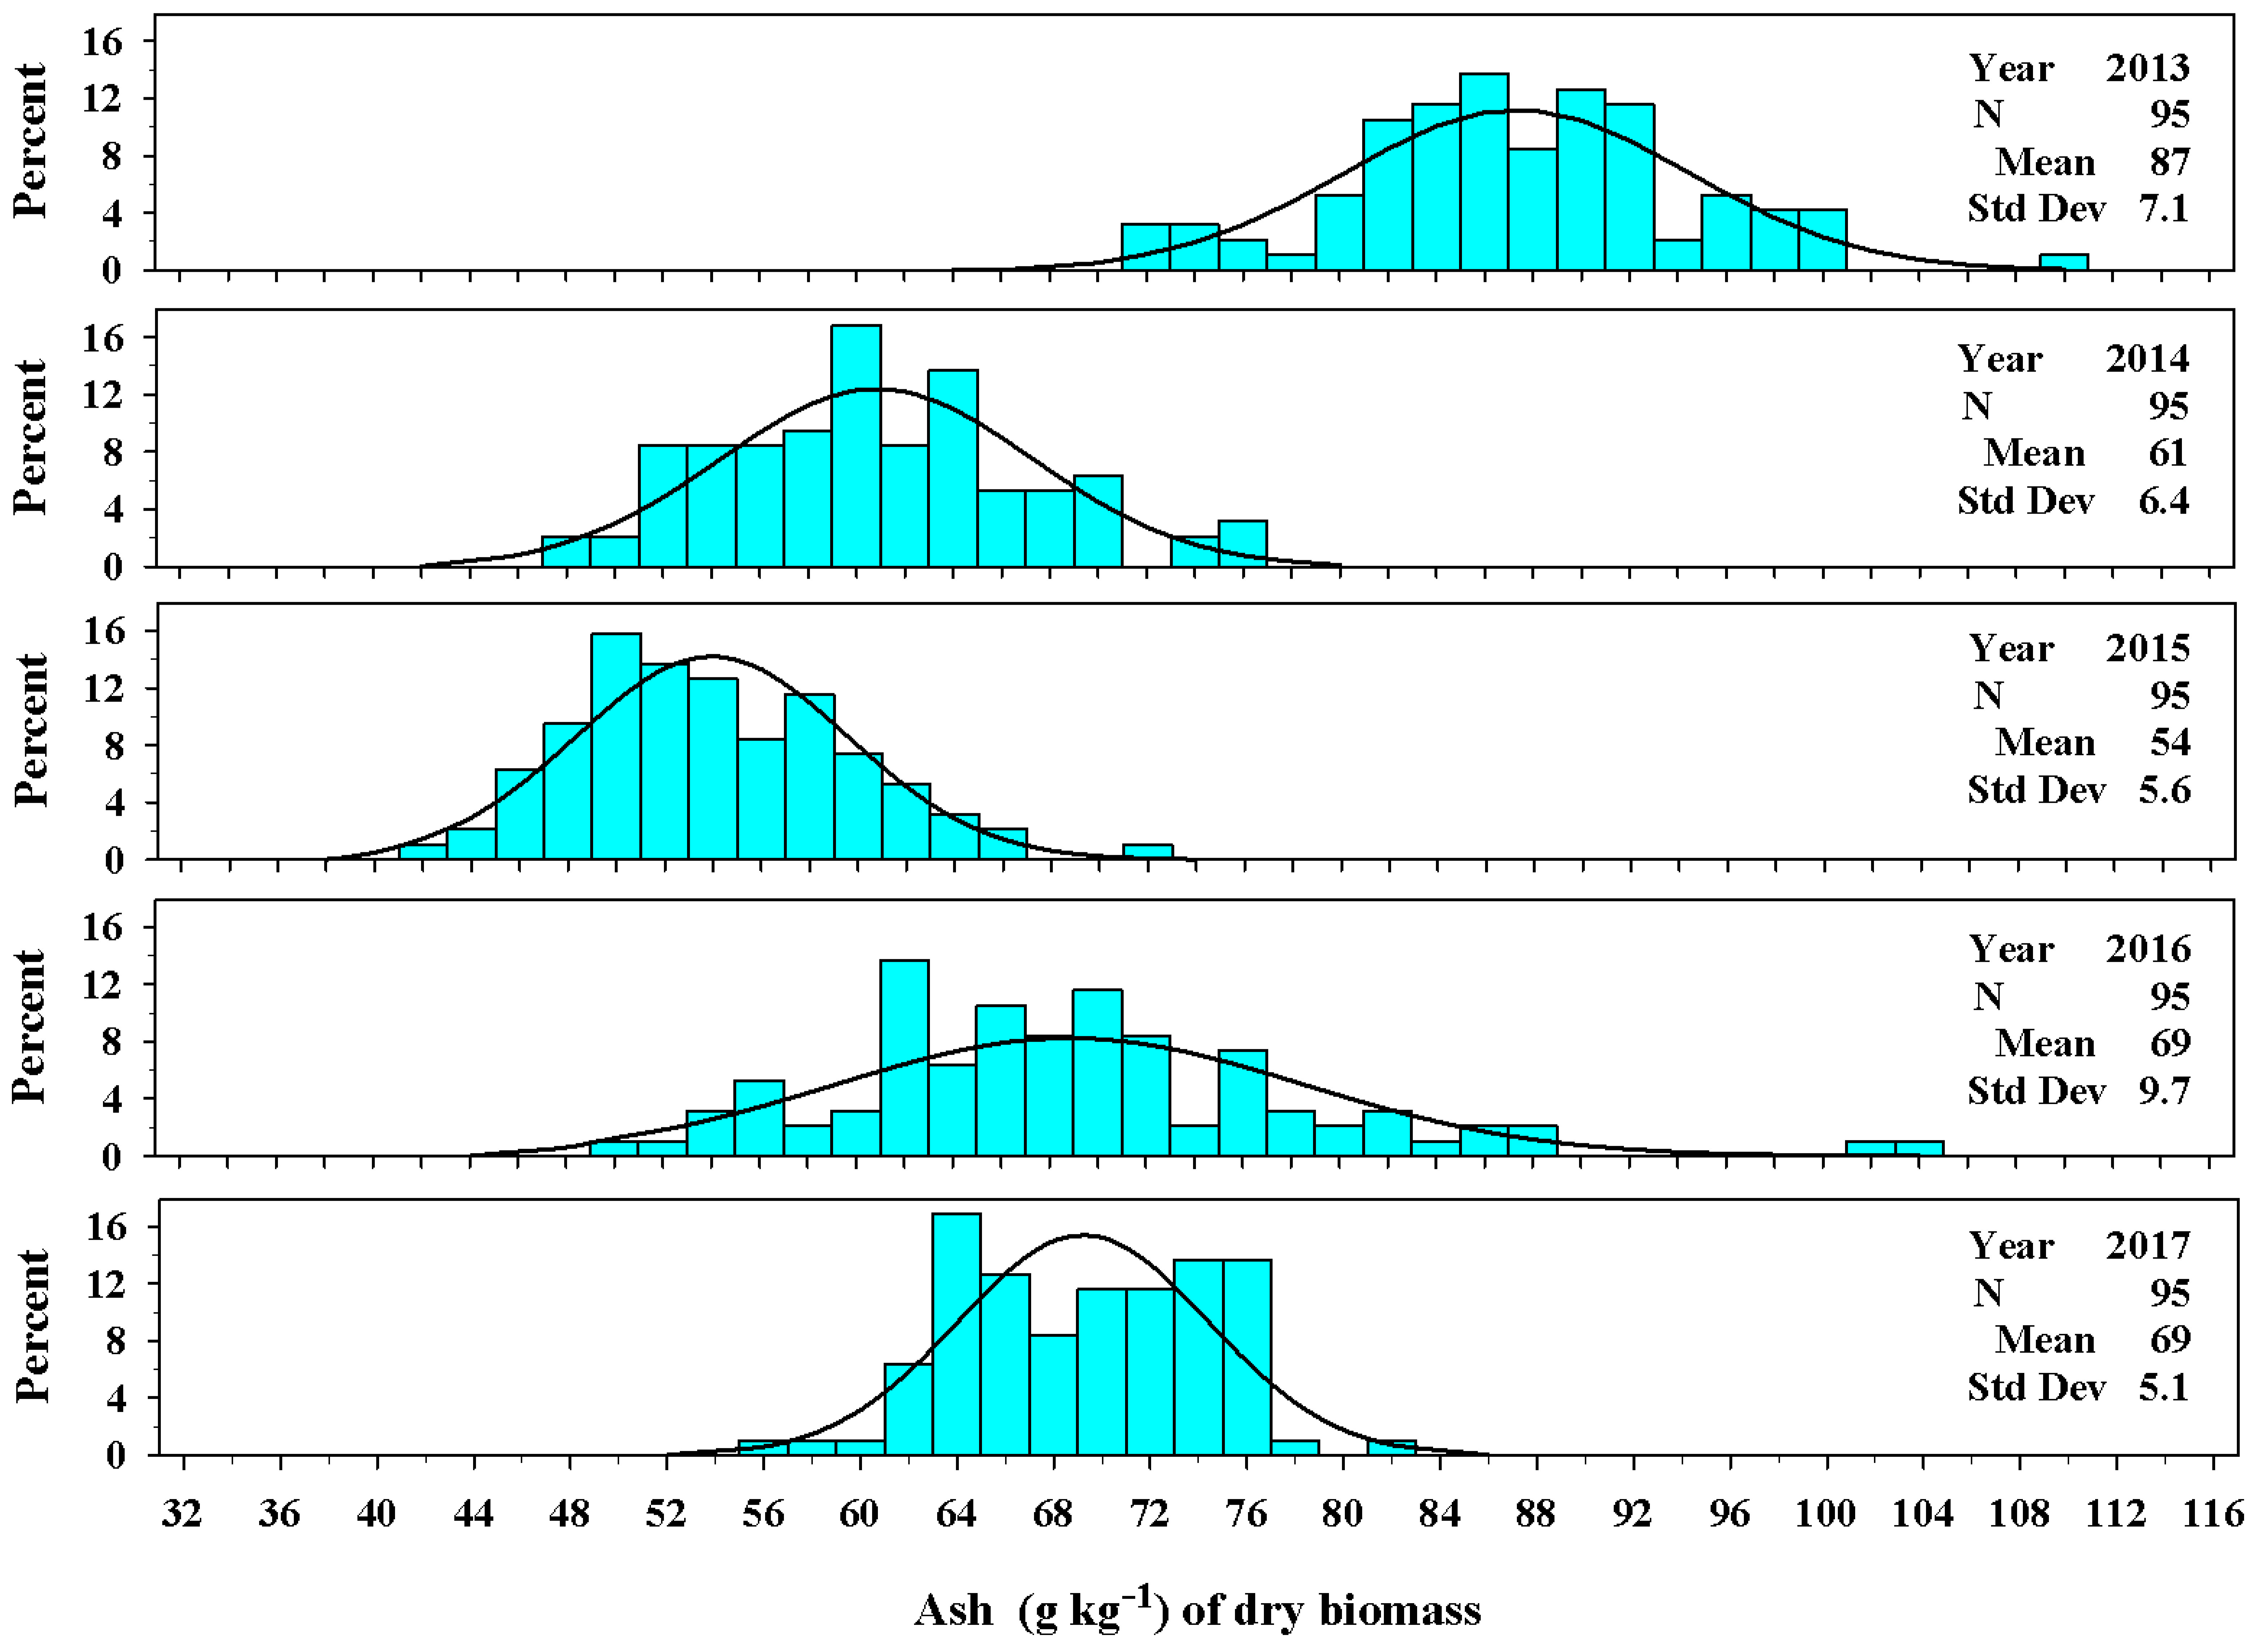
The concentration of ash varied among production years. In 2013 the concentration of ash averaged 87 ± 7.1 g kg−1 (Figure 9). The concentration of ash was lower in 2014 and 2015 averaging 61 ± 6.4 g kg−1 and 54 ± 5.6 g kg−1, respectively. By 2016 and 2017, the mean value for concentration of ash was 69 ± 9.7 g kg−1 and 69 ± 5.1 g kg−1, respectively.
4. Discussion
4.1. Sucrose Concentration of Leaf and Culm Sap
For sugarcane, a closely related species, sucrose is synthesized in the leaf and translocated through the leaf sheath into the culm for storage [15]. This is undoubtedly the same for Ravenna grass. The concentration of sucrose in leaf sap of Ravenna grass is less than that of culms, which is similar to sugarcane [15]. The sucrose concentration of Plant 365 averaged 70 ± 15 g kg−1 of leaf sap and the leaf sucrose concentration of OP progeny of Plant 365 varied from 15 to 70 g kg−1 for three of the five years. It appears that 70 g kg−1 may be the upper threshold for leaf sap sucrose concentration in this OP population. Furthermore, environmental extremes are known to affect the concentration of sucrose in sugarcane [16], which may account for the variation found for means and standard deviations among years of the OP population. Ravenna grass is a diploid with 2n = 20 chromosomes [7,17], given the variation found within the OP population for sucrose concentration in leaves and culms, it may be possible to select for higher concentrations of sucrose in Ravenna grass, provided that the trait is heritable. Breaux [18] reported that it is possible to enhance the sucrose content of sugarcane varieties using recurrent selection.
4.2. Percentage Seed Set and Number of Caryopses Per Panicle
The percentage seed set in Ravenna grass, like many chaffy-seed grasses, varies with harvest year. Springer and Goldman [10] determined that drought severely reduced the percentage seed set of Ravenna grass, while adequate rainfall increased seed set. They reported an average seed set of 13% when plants were exposed to drought compared with an average of 53% seed set when plants received average growing season precipitation. In this study, the 2015 growing season precipitation was 139 mm above the LTA growing season precipitation of 434 mm, and the seed set (56%) in 2015 was similar to that that was reported by Springer and Goldman [10] for 2013 (53%), which received 97% of the LTA growing season precipitation. Thus, precipitation is an important factor that affects seed production of Ravenna grass.
The range in the percentage seed set was similar each year varying from 0–72%. One plant of the OP population appears to be sterile (producing no seeds). Seed sterile ornamental grasses that could be propagated by cloning would benefit the horticultural industry as well as the environment [5]. Meyer [5] stated that, “Ornamental grasses may be invasive from self-seeding or aggressive rhizomes.” Ravenna grass is known to escape cultivation and has become an invasive grass, particularly on riparian zones [4].
Likewise, the number of caryopses per panicle varied with year. Springer and Goldman [10] reported that drought severely reduced the number of caryopses per panicle. They reported an average of 600 caryopses per panicle in 2012 during drought compared with 3700 in 2013 with average growing season rainfall. As previously stated, the 2015 growing season precipitation was above the LTA growing season precipitation. In 2015, the number of caryopses per panicle averaged 11,470 ± 3075 seeds. This is considerably higher than either 2013 or 2016 which received precipitation near the LTA. In 2016, the number of caryopses per panicle averaged 4770 ± 2010 seeds. This value is much closer to what Springer and Goldman reported for the average precipitation year 2013 [10].
4.3. Biomass Harvested Per Plant; and C, N, and Ash Concentration of Biomass
The dry matter biomass per plant varied among year of harvests and was lowest during the establishment year. Since few culms terminating in a panicle develop during the establishment year, the harvested biomass was made up primarily of basil leaves, and the biomass was generally less than or equal to 0.5 kg per plant. It has been reported that livestock will consume the forage in the first year of growth [1]. This is understandable since the nitrogen content of the forage is the greatest during the establishment year, averaging 9.5 ± 0.7 g kg−1 of dry biomass (equal to 60 ± 4.2 g kg−1 of crude protein by dry weight). The nitrogen concentrations averaged 5.5 ± 1.5 g kg−1 of dry matter from 2014 through 2017 (35 ± 9.6 g kg−1 of crude protein). It is possible that as the plant stand ages chemical compounds are produced in the foliage that repels livestock from eating the forage. Shedayi et al. [12] reported that Ravenna grass is eaten by the Himalayan ibex; however, the author has not seen any evidence that wildlife has eaten Ravenna grass or has used it as habitat at Woodward, Oklahoma, USA.
The biomass yield also varied among years after establishment. The variation observed from 2013 to 2015 is not uncommon during the growth phase of perennial forage grasses. The growth phase is characterized by root, shoot, and crown development, and the expansion of roots, shoots, and crowns into available space both above and belowground level [19]. For most perennial forage grasses, the second year after establishment has the greatest biomass yield. Once the growth phase is complete, the plants transition into an equilibrium phase where growth is limited by competition for light and nutrients. The transition phase is characterized by a reduction in biomass yield similar to that observed in 2016 and 2017. The dry matter biomass among individual plants varied from 1.0 to greater than 12.0 kg and averaged 5.1 kg per plant for years 2016 and 2017 at Woodward, Oklahoma, USA. On the basis of the data, at a density of 5000 plants per hectare, biomass yield would range from 5.0 to 60 Mg ha−1. The true mean, however, is realistically somewhere between these two numbers. Plot yield estimates of fertilized Ravenna grass harvested the third and fourth year after establishment was 10.1 Mg ha−1 at a mountain site and 15.0 Mg ha−1 at a coastal site in North Carolina [9]. Palmer et al. [9] stated that, “Ravenna grass survival decreased from 83 to 69% at the Mountain site and from 94 to 72% at the Central Plains site from 2008 to 2011.” The stand decrease was possibly due to the 10 cm (1 dm) height of biomass cut which could impact survival of plant materials. At Woodward, Oklahoma, unfertilized Ravenna grass plots produced 13.7 to 18.6 ± 0.9 Mg ha−1 of dry biomass when grown at a density of 5000 and 20,000 plants per hectare, respectively (Springer, unpublished data, 2018). Conversely, no plant stand loss has been observed at Woodward, Oklahoma with a harvest cut height of 30 cm (3 dm). The biomass yield values reported above for Ravenna grass are greater than or equal to the yield of fertilized switchgrass (Panicum virgatum) grown at Woodward (11.6 ± 0.4 Mg ha−1 at a 80 kg ha−1 nitrogen rate) [20] and fertilized switchgrass yields summarized over several locations in the USA (10.3 ± 0.7 Mg ha−1, mean ± standard error) [21]. The yield values are, however, less than Miscanthus x giganteus that were summarized over several locations in the USA (22.4 ± 4.1 Mg ha−1, mean ± standard error) [21]. Given the range in individual plant biomass yields, it may be possible to select and/or breed for increased biomass yield provided, provided that the trait is heritable.
The concentration of carbon in dry biomass was the lowest during the establishment year (440 ± 4.3 g kg−1) and was similar to the mean reported for major energy crops [22]; however, the concentration of carbon was higher than that reported for major energy crops in years 2014–2017 (455 ± 5.3 g kg−1). Jenkins [23] reported for every 1% increase in carbon concentration there is a 0.39 MJ kg−1 increase in the biomass heating values. The heating value of Ravenna grass biomass harvested at Woodward, Oklahoma is approximately 18.5 ± 0.2 MJ kg−1 (Springer, unpublished data, 2018). This heating value is slightly higher than that reported for switchgrass (18.1 MJ ha−1) [24].
The concentration of nitrogen averaged 6.8 ± 0.6 g kg−1 of dry matter after the stand had matured (2016 and 2017). This value is similar to that reported for Miscanthus x giganteus and less than that reported for other energy crops [22]. The soil available N was very low at the onset of this experiment, and no supplemental nitrogen was added over the five years of the experiment, yet biomass yield and concentration of nitrogen remained relatively stable in 2016 and 2017 (mature stand). It is possible that the plants are benefiting from some form of biological nitrogen fixation. Biological nitrogen fixation has been reported in sugar canes as well as other grass species [25].
The concentration of ash varied with harvest year, but became relatively stable for mature plants (harvests in 2016 and 2017). The heating value of biomass is partially correlated with ash concentration [24]. For every 1% increase in ash concentration there is a 0.2 MJ kg−1 of biomass decrease in the heating value, because ash does not contribute to the heat released by combustion [23]. Furthermore, ash values significantly higher than 100 g kg−1 are most likely the result of excess surface soil contamination [26]. Most forage grass breeding programs have been interested in increase forage yield rather than decreasing ash concentration [26]. Given the variation of ash concentration in Ravenna grass it might be possible to select and breed for reduced ash concentration provided that the trait is heritable.
5. Conclusions
The ideal biomass energy crop is high yielding, cost effective to produce; produce little contaminates, and has low nutrient requirements [27]. Ravenna grass meets several of these criteria. Ravenna grass biomass yield is moderately high, equaling or exceeding that of switchgrass [20,21]. The production costs should be similar to or lower than that of other energy crops because of little or no fertilization costs. A positive attribute of Ravenna grass is that it might be possible to develop cultivars with little or no seed production that could be used as horticultural landscape plants. High seed production in horticultural landscape can cause seedling recruitment of horticultural plants in unwanted places [5]. Due to low nitrogen and ash concentration very few contaminates are produced [27], and it has little or no nutrient requirements when harvested in the dormant season.
A negative attribute of Ravenna grass is that it has been listed as a noxious weed in several U.S. States due to its escaping from cultivation and populating riparian areas [4]. Although seed technology is available and seed production is high, the grass may be difficult to harvest seeds because of its height [10]. Lastly, although Ravenna grass produces copious amounts of forage, it is not consumed by livestock [1]. Many producers prefer biomass crops that have multi-purpose uses, for grazing, haying, or biomass.
Ravenna grass has the potential to be developed into a viable energy crop; however, research is needed to determine optimum seeding rates and plant densities to sustain long-term biomass production. Additional research is needed to test the theory of biological nitrogen fixation, methods to improve palatability for livestock, and breeding for improved energy use.
Acknowledgments
The research was funded by the USDA Agricultural Research Service. Thanks are given to William Cooper, Darby Baker, Emalee Friend, Jerry McLaughlin, Tonya Thelen, and Tyler VanCampen for their dedicated assistance throughout this investigation. Mention of a trademark or a proprietary product does not constitute a guarantee or warranty of the product by USDA and does not imply approval to the exclusion of other suitable products. All programs and services of the USDA are offered on a nondiscriminatory basis without regard to race, color, national origin, religion, sex, age, marital status, or handicap.
Conflicts of Interest
The author declares that the research was conducted in the absence of any commercial or financial relationships that could be construed as a potential conflict of interest.
References
- Chen, S.; Phillips, S.M. Saccharum ravennae (L.) L. Flora of China. 1994. Available online: http://www.efloras.org/florataxon.aspx?flora_id=2&taxon_id=242345942 (accessed on 10 January 2018).
- USDA National Plant Germplasm System. Taxon: Saccharum ravennae (L.) L. USDA Germplasm Resource Information Network. Available online: http://www.ars-grin.gov/cgi-bin/npgs/html/taxon.pl?103325 (accessed on 8 January 2018).
- Valdés, B.; Scholz, H. The Euro+Med treatment of Gramineae—A generic synopsis and some new names. Willdenowia 2006, 36, 657–669. [Google Scholar] [CrossRef]
- CABI Invasive Species Compendium. Saccharum ravennae (Ravenna grass). Available online: http//www.cabi.org/isc/datasheet/109359 (accessed on 10 January 2018).
- Meyer, M.H. Ornamental Grasses in the United States. Hort. Rev. 2011, 39, 121–152. [Google Scholar] [CrossRef]
- Besse, P.; McIntyre, C.L.; Berding, N. Characterization of Erianthus sect. Ripidium and Saccharum germplasm (Andropogoneae-Saccharinae) using RFLP markers. Euphytica 1997, 93, 283–292. [Google Scholar] [CrossRef]
- Janaki-Ammal, E.K. Intergeneric hybrids of Saccharum. J. Genet. 1941, 41, 217–253. [Google Scholar] [CrossRef]
- Hattori, T.; Shiotsu, F.; Doi, T.; Morita, S. Suppression of tillering in Erianthus ravennae (L.) Beauv. due to drought stress at establishment. Plant Prod. Sci. 2010, 13, 252–255. [Google Scholar] [CrossRef]
- Palmer, I.E.; Gehl, R.J.; Ranney, T.G.; Touchel, D.; George, N. Biomass yield, nitrogen response, and nutrient uptake of perennial bioenergy grasses in North Carolina. Biomass Bioenergy 2014, 63, 218–228. [Google Scholar] [CrossRef]
- Springer, T.L.; Goldman, J.J. Germination of Saccharum ravennae (L.) L. (Poaceae) Caryopses and Intact Spikelets. Crop Sci. 2016, 56, 682–688. [Google Scholar] [CrossRef]
- Shimura, K.; Kawatake, M.; Nishimura, G.; Okamoto, K. Studies on utilization of Ravenna grass (Erianthus ravennae) as a forage crop. Bull. Tokai-Kinki Natl. Agric. Exp. Stat. 1973, 26, 71–78. [Google Scholar]
- Shedayi, A.A.; Begum, S.; Sadia, S.; Xu, M.; Ilihi, I. Plant species consumed by Ibex and chemical analysis of Saccharum ravennae L. from three different locations of Gilgit, Pakistan. J. Environ. Agric. Sci. 2016, 9, 21–27. [Google Scholar]
- Nozoye, T.; Aung, S.A.; Masuda, H.; Nakanishi, H.; Nishizawa, N.K. Bioenergy grass [Erianthus ravennae (L.) Beauv.] secretes two members of mugineic acid family phytosidrophores which involved in their tolerance to Fe deficiency. Soil Sci. Plant Nutr. 2017, 63, 543–552. [Google Scholar] [CrossRef]
- SAS Institute, Inc. SAS/STAT® User’s Guide, version 9.4; SAS Institute, Inc.: Cary, NC, USA, 2010. [Google Scholar]
- Sacheva, M.; Mann, A.P.S.; Batta, S.K. Sucrose metabolism and expression of key enzyme activities in low and high sucrose storing sugarcane genotypes. Sugar Tech. 2003, 5, 265–271. [Google Scholar] [CrossRef]
- Glasziou, K.T.; Gayler, K.R. Storage of sugars in stalks of sugar cane. Bot. Rev. 1972, 38, 471–488. [Google Scholar] [CrossRef]
- Janaki-Ammal, E.K. Cytogentics analysis of Saccharum spontaneum chromosome studies in some Indian forms. Indian J. Agric. Sci. 1936, 6, 1–8. [Google Scholar]
- Breaux, R.D. Breeding to enhance sucrose content of sugarcane varieties in Louisiana. Field Crops Res. 1984, 9, 59–67. [Google Scholar] [CrossRef]
- Springer, T.L.; Dewald, C.L.; Sims, P.L.; Gillen, R.L. How does plant population density affect the forage yield of eastern gamagrass? Crop Sci. 2003, 43, 2206–2211. [Google Scholar] [CrossRef]
- Springer, T.L. Effect of nitrogen fertilization and residual nitrogen on biomass yield of switchgrass. Bioenergy Res. 2017, 10, 648–656. [Google Scholar] [CrossRef]
- Heaton, E.; Voight, T.; Long, S.P. A quantitative review comparing the yields of two candidate C4 perennial biomass crops in relation to nitrogen, temperature, and water. Biomass Bioenergy 2004, 27, 21–30. [Google Scholar] [CrossRef]
- Monti, A.; Virgilio, N.D.; Venturi, G. Mineral composition and ash content of six major energy crops. Biomass Bioenergy 2008, 32, 216–223. [Google Scholar] [CrossRef] [Green Version]
- Jenkins, B.M. Physical properties of biomass. In Biomass Handbook; Kitani, O., Hall, C.W., Eds.; Gordon & Breach: New York, NY, USA, 1989; pp. 860–891. [Google Scholar]
- Jenkins, B.M.; Baxter, L.L.; Miles, T.R., Jr.; Miles, T.R. Combustion properties of biomass. Fuel Process. Technol. 1998, 54, 17–46. [Google Scholar] [CrossRef]
- Urquiaga, S.; Cruz, K.H.S.; Boddy, R.M. Contribution of nitrogen fixation to sugar cane: Nitrogen-15 and nitrogen-balance estimates. Soil Sci. Soc. Am. J. 1992, 56, 105–114. [Google Scholar] [CrossRef]
- Cherney, J.H.; Baker, E.V. Ash Content of Grasses for Biofuel; Bioenergy Information Sheet #5; Cornell University Cooperative Extension: Ithaca, NY, USA, 2006. [Google Scholar]
- McKendry, P. Energy production from biomass (part 1): Overview of biomass. Bioresour. Technol. 2002, 83, 37–46. [Google Scholar] [CrossRef]
Figure 1.
The univariate distributions of sucrose concentration of leaf sap for Ravenna grass for years 2013–2017. The black curved line denotes the fitted normal distribution of the plant population for each year. The vertical cyan bars denote the percentage of the plant population that fell within a sucrose concentration class.

Figure 2.
The univariate distributions of sucrose concentration of culm sap of Ravenna grass for years 2014–2017. The black curved line denotes the fitted normal distribution of the plant population for each year. The vertical cyan bars denote the percentage of the plant population that fell within a sucrose concentration class.

Figure 3.
The univariate distributions of percentage seed set of Ravenna grass for years 2015 and 2016. The black curved line denotes the fitted normal distribution of the plant population for each year. The vertical cyan bars denote the percentage of the plant population that fell within a percentage seed set class.

Figure 4.
The univariate distributions of the number of caryopses per spike for Ravenna grass in 2015 and 2016. The black curved line denotes the fitted normal distribution of the plant population for each year. The vertical cyan bars denote the percentage of the plant population that fell within a number of caryopses per panicle class.

Figure 5.
The univariate distribution for Ravenna grass plant biomass (kg) harvested above 3.0 dm in 2013. The black curved line denotes the fitted normal distribution of the plant population for plant biomass in 2013. The vertical cyan bars denote the percentage of the plant population that fell within a biomass weight class.

Figure 6.
The univariate distribution of Ravenna grass plant biomass (kg) harvested above 3.0 dm for years 2014–2017. The black curved lines denote the fitted normal distribution of the plant population for plant biomass. The vertical cyan bars denote the percentage of the plant population that fell within a biomass weight class.

Figure 7.
The univariate distribution of carbon concentration (g kg−1) from Ravenna grass biomass harvested above 3.0 dm for 2013–2017. The black curved lines denote the fitted normal distribution of the plant population carbon concentration. The vertical cyan bars denote the percentage of the plant population that fell within a carbon concentration class.

Figure 8.
The univariate distribution of nitrogen concentration (g kg−1) from Ravenna grass biomass harvested above 3.0 dm for 2013–2017. The black curved lines denote the fitted normal distributions of the plant population carbon concentration. The vertical cyan bars denote the percentage of the plant population that fell within a nitrogen concentration class.
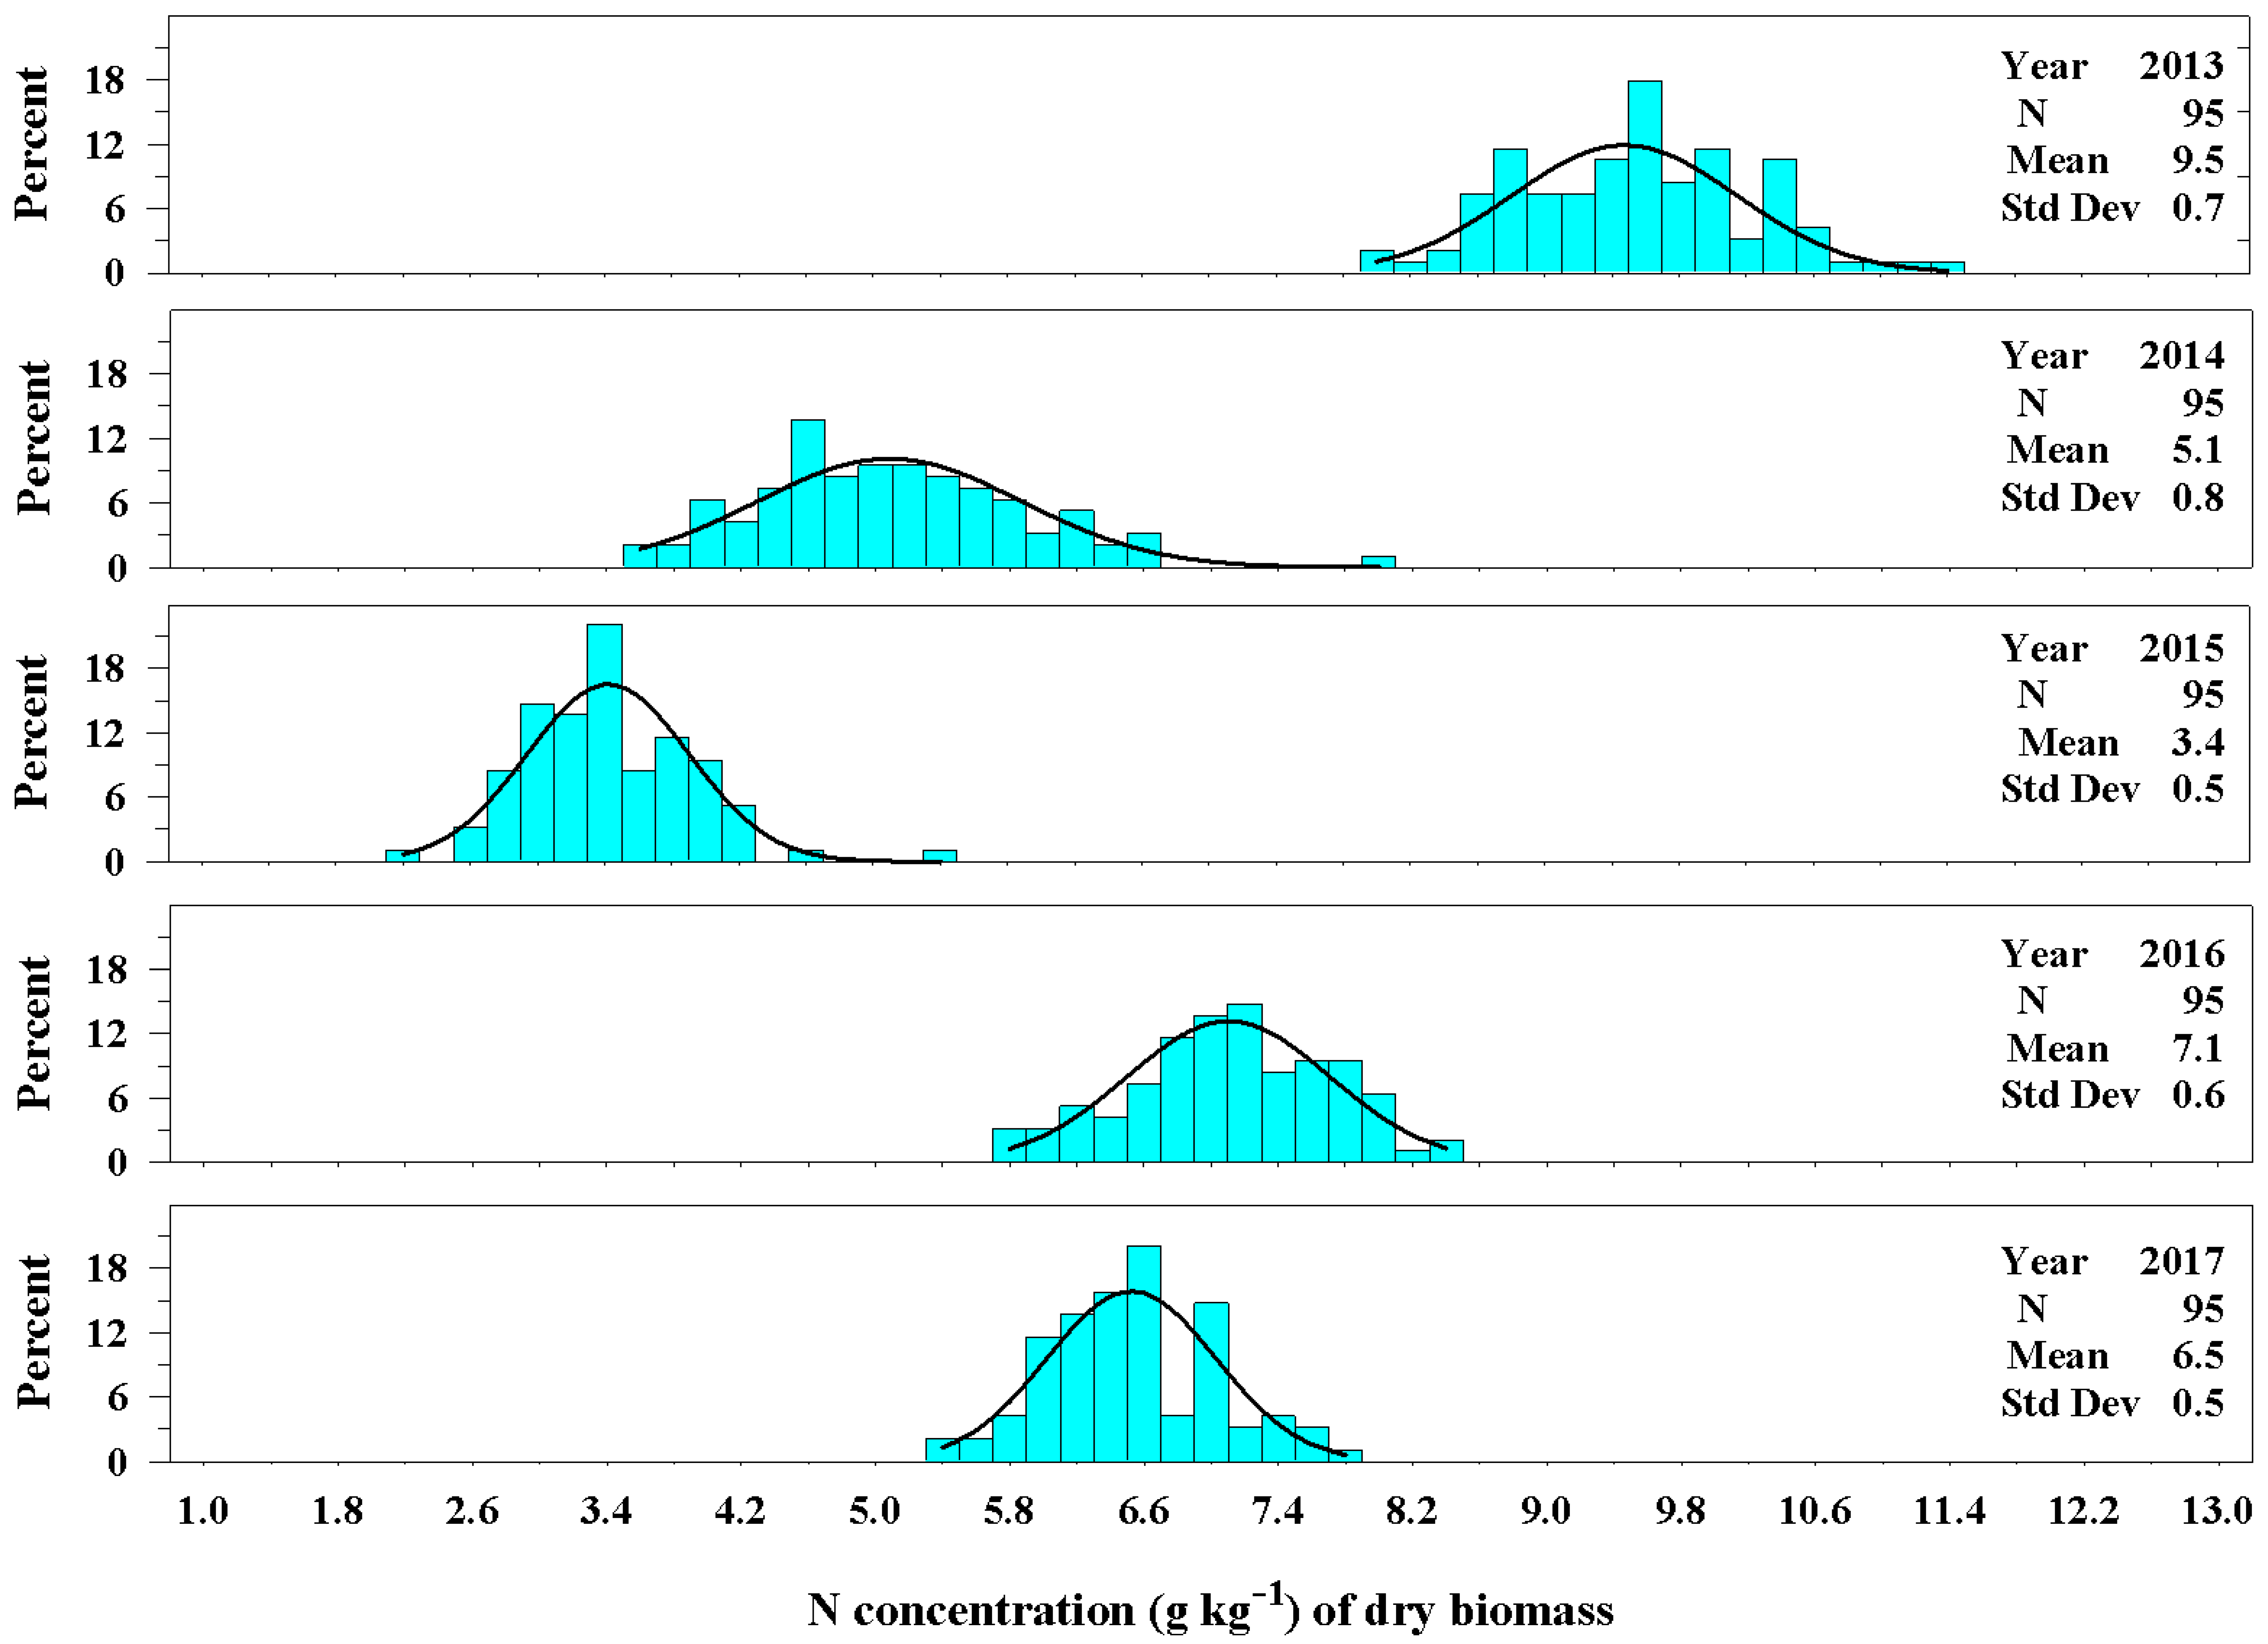
Figure 9.
The univariate distribution of ash concentration (g kg−1) from Ravenna grass biomass harvested above 3.0 dm for 2013–2017. The black curved lines denote the fitted normal distributions of the plant population ash concentration. The vertical cyan bars denote the percentage of the plant population that fell within an ash concentration class.

© 2018 by the author. Licensee MDPI, Basel, Switzerland. This article is an open access article distributed under the terms and conditions of the Creative Commons Attribution (CC BY) license (http://creativecommons.org/licenses/by/4.0/).
Share and Cite
MDPI and ACS Style
Springer, T.L. Variation of Agronomic Traits of Ravenna Grass and Its Potential as a Biomass Crop. Agronomy 2018, 8, 70. https://doi.org/10.3390/agronomy8050070
AMA Style
Springer TL. Variation of Agronomic Traits of Ravenna Grass and Its Potential as a Biomass Crop. Agronomy. 2018; 8(5):70. https://doi.org/10.3390/agronomy8050070
Chicago/Turabian StyleSpringer, Tim L. 2018. "Variation of Agronomic Traits of Ravenna Grass and Its Potential as a Biomass Crop" Agronomy 8, no. 5: 70. https://doi.org/10.3390/agronomy8050070
Note that from the first issue of 2016, this journal uses article numbers instead of page numbers. See further details here.