Dissecting Wheat Grain Yield Drivers in a Mapping Population in the UK
by
 , ,
, ,
João P. Pennacchi
1,2,* ,
,
Elizabete Carmo-Silva
1,2,
P. John Andralojc
2,
David Feuerhelm
3,
Stephen J. Powers
4 and
Martin A. J. Parry
1,2 1
Lancaster Environment Centre, Library Avenue, Lancaster University, Lancaster LA1 4YQ, UK
2
Plant Biology and Crop Science, Rothamsted Research, West Common, Harpenden AL5 2JQ, UK
3
Syngenta AG, Cambridge CB21 5XE, UK
4
Computational and Systems Biology, Rothamsted Research, Harpenden, West Common AL5 2JQ, UK
*
Author to whom correspondence should be addressed.
Agronomy 2018, 8(6), 94; https://doi.org/10.3390/agronomy8060094
Submission received: 31 March 2018
/
Revised: 1 June 2018
/
Accepted: 12 June 2018
/
Published: 14 June 2018
(This article belongs to the Special Issue Photosynthetic Carbon Metabolism to Enhance Crop Productivity)
Abstract
:Improving crop yields arises as a solution to ensure food security in the future scenarios of a growing world population, changes in food consumption patterns, climate change, and limitations on resources allocated to agriculture. Defining traits that can be reliable cornerstones to yield improvement and understanding of their interaction and influence on yield formation is an important part of ensuring the success of breeding programs for high yields. Traits that can drive yield increases, such as light interception and conversion efficiency, as well as carbon assimilation and allocation, were intensively phenotyped in a double-haploid wheat mapping population grown under field conditions in the UK. Traits were analysed for their correlation to yield, genetic variation, and broad-sense heritability. Canopy cover and reflectance, biomass production, and allocation to stems and leaves, as well as flag leaf photosynthesis at a range of light levels measured pre- and post-anthesis correlated with plant productivity and contributed to explaining different strategies of wheat lines to attain high grain yields. This research mapped multiple traits related to light conversion into biomass. The findings highlight the need to phenotype traits throughout the growing season and support the approach of targeting photosynthesis and its components as traits for breeding high yielding wheat.
1. Introduction
Global food security is defined as a situation where all people at all times have access to safe, nutritious, and affordable food that provides the foundation for active and healthy lives [1]. Ensuring food security in the near future is challenging, particularly when considering the predicted scenarios of a growing world population [2], changes in food consumption patterns [3], extreme climatic events [4], and the need for the sustainable use of resources in agricultural activities [5].
Increasing food production is one of the alternatives to ensure that food availability is kept ahead of the food demand. Food production can be increased by: the expansion of croplands, intensification of land use, and increase in yields. Increasing yields might be responsible for around 77% of food production increases by 2050 [6]. In opposition to the required yield increases, a trend of stagnating yields has been observed for the main crops around the world [7].
For rice, maize, wheat, and soybean, which represent two-thirds of the total caloric intake worldwide [8], yields have stagnated since around 2002, with increases in production being pushed by expanding the cultivated land area for these crops [7]. For wheat in the UK, yields have stagnated at around 8 t ha−1 since 1996 [9]. Understanding yield formation and dry matter accumulation is therefore crucial to revealing new target traits, from canopy to molecular levels, to be exploited in the process of breeding for high yields [10].
Yield formation is a process of energy conversion and accumulation. The radiative energy available in sunlight is intercepted by plants and converted during photosynthesis to molecules that can be stored in the form of dry matter and allocated to plant organs [11]. Therefore, crop yield potential (Yp) is a function of the incident sunlight radiation (RAD) and the efficiency of the plant to intercept (εi) and convert (εc) light into biomass, as well as the efficiency of partitioning of the biomass (εp) to the organ of economic interest (e.g., the grain): Yp = RAD · εi · εc · εp [12].
The Green Revolution was very successful in increasing wheat yields by using genes encoding for the dwarfing of plants [13]. This provided a higher efficiency in allocating plant biomass to the grain during grain filling, which led to an increase in the harvest index [14]. It was also related to an increase in the area covered by leaves and the speed of canopy closure, which improved interception efficiency. However, the potential increases in interception and partitioning efficiency are currently limited in wheat as εi and εp have reached values close to their theoretical limits [15]. Therefore, although solar radiation is not manageable, εc improvement is still a target for increasing yield potential.
εc is related to all the steps involved in the conversion of intercepted light to molecules that can be stored in the form of biomass, or the light use efficiency (LUE). LUE is the ratio of net primary productivity (NPP) to intercepted photosynthetically active radiation (PAR) [16] or simply the crop photosynthetic efficiency [17]. At current atmospheric conditions, C3 photosynthesis has a theoretical maximum efficiency of 4.6%. However, the practical efficiency is around 2% and the average, in field conditions, is less than 1%, showing potential for improvement [18]. Possible strategies to improve photosynthesis, and consequently light use efficiency, include overcoming the limitations imposed on the photosynthetic process, such as: CO2 diffusion and concentration, the regeneration of Calvin-Benson cycle intermediates, Rubisco efficiency, and light reactions [19].
There is a multitude of plant traits, at different plant structural levels, that may contribute to yield improvement. Selecting possible targets can be a challenging and confusing process, although there are some directions that can be taken to make the process more efficient. The selection of target traits for breeding for high yields needs to be based on: (a) the correlation between the trait and yield; (b) the variation of the trait for the species or within a population thereof; (c) the trait stability (heritability); and (d) the influence of the genetic x environment interaction on the trait [20]. Although the selection of traits to focus on is a crucial step for the breeding of high yielding genotypes, understanding interactions and trade-offs between traits, as well as their behaviour along the crop cycle, has an important role in defining yield improvement strategies.
This research aimed to identify the main yield drivers, and their interaction, for a double-haploid wheat mapping population grown in the UK. The phenotyping was based on the yield formation equation and the processes associated with the three efficiencies, εi, εc, and εp, with a focus on εc, due to its greater scope for improvement. The contribution of multiple traits assessed throughout the growing season to wheat productivity and their interaction to define different strategies to attain high grain yields are discussed.
2. Materials and Methods
2.1. Plant Material and Field Experiments
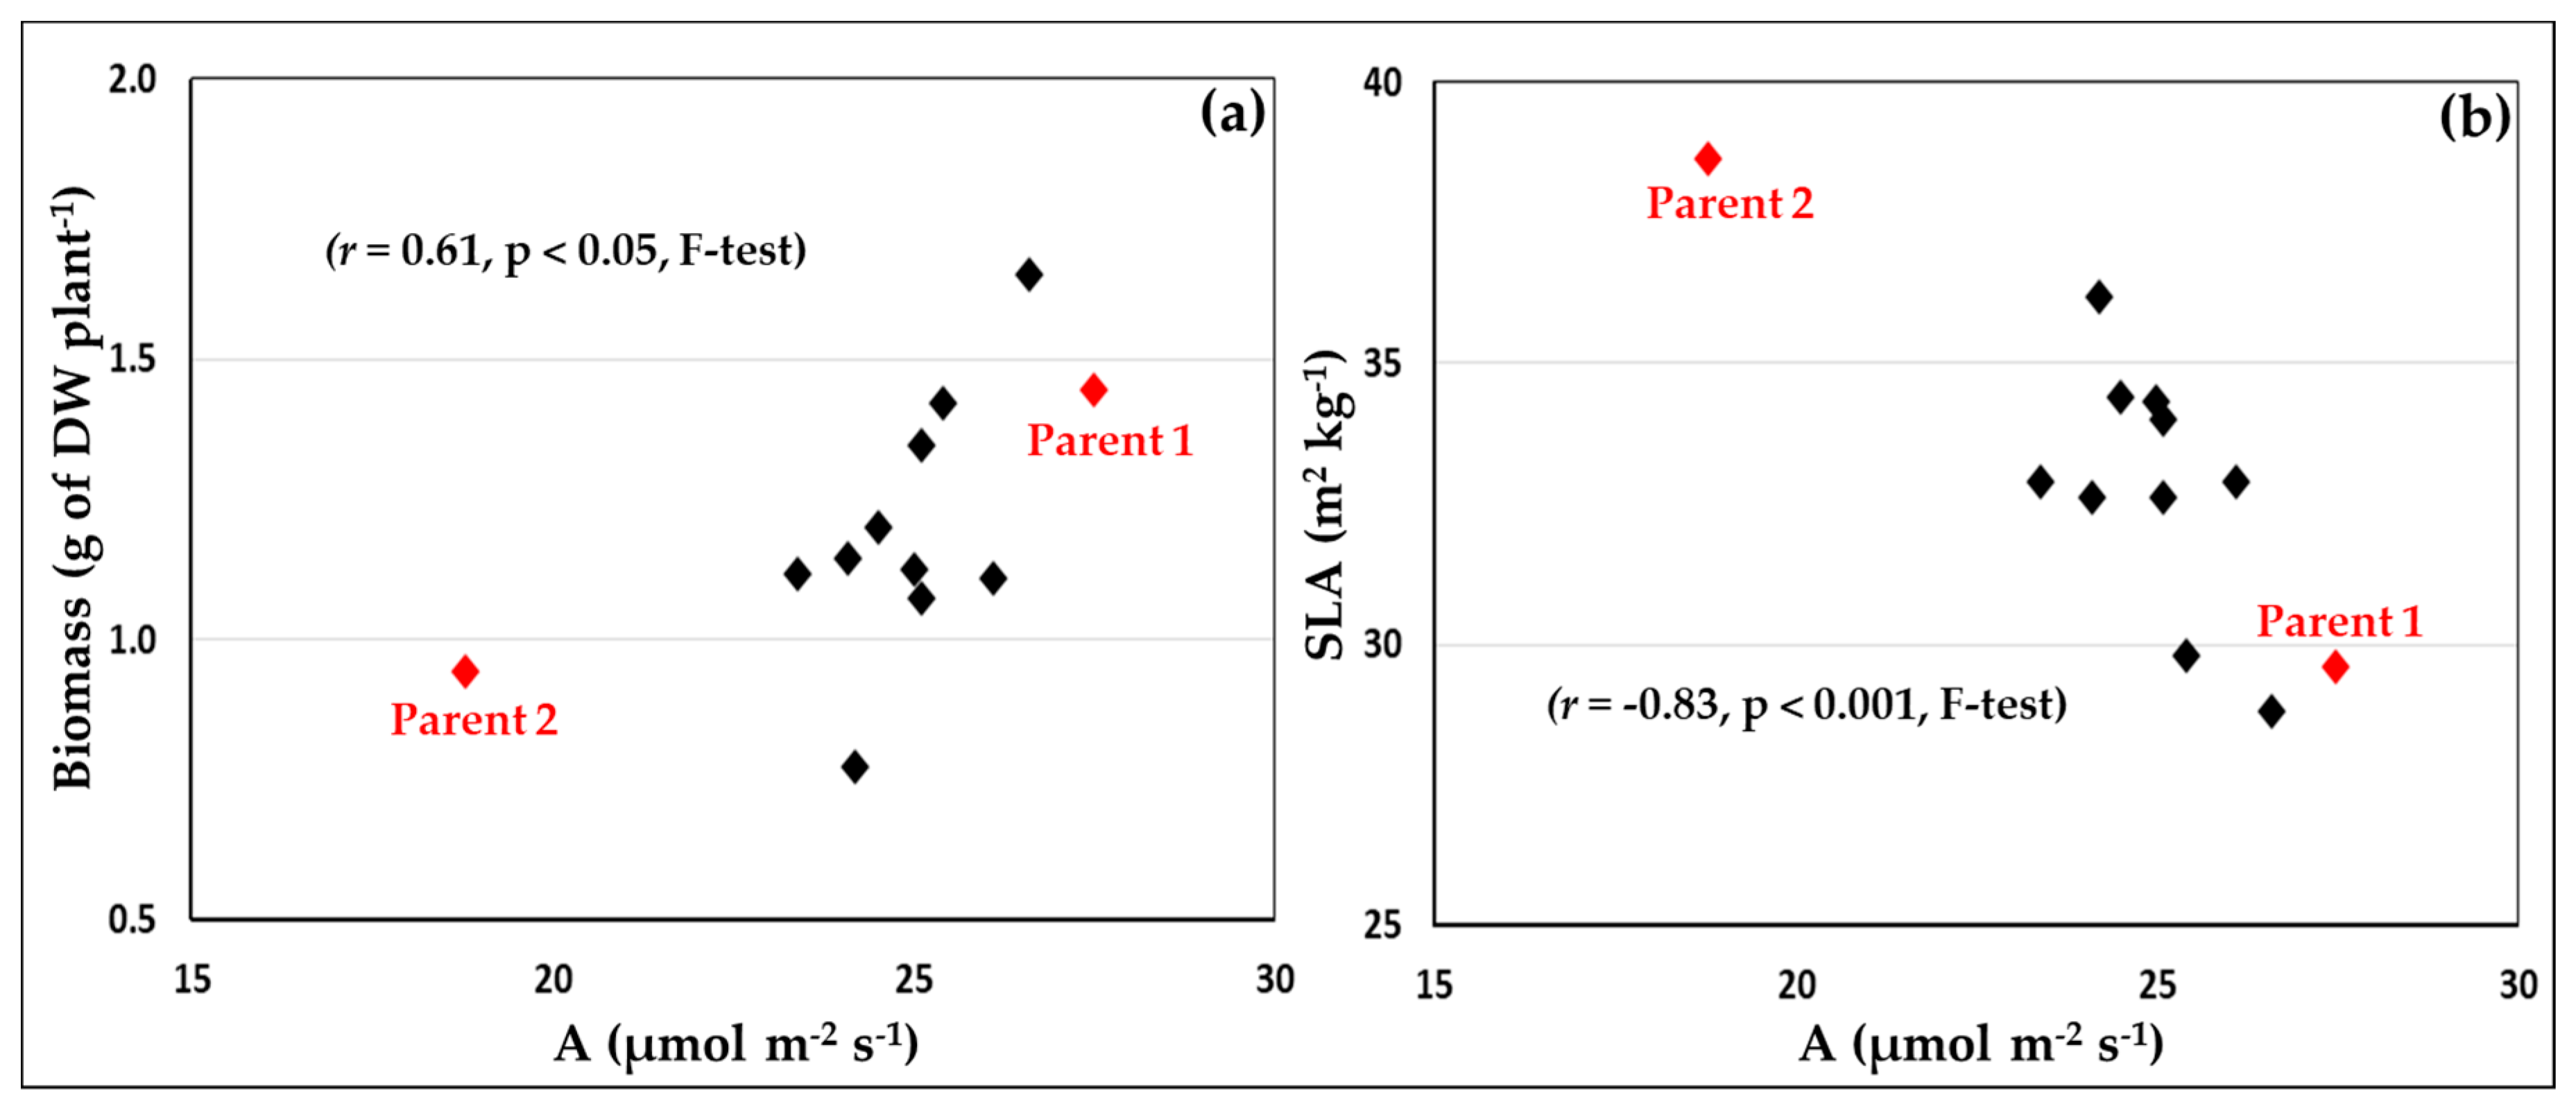
A mapping population comprised of double-haploid lines (DHL) generated by Syngenta (Cambridge, UK) was used. For the selection of the population, 12 wheat cultivars were used, including 11 parents of mapping populations available at Syngenta (Cassius, Gallant, Gatsby, Hereford, JB Diego, KWS Kielder, KWS Santiago, Panorama, Player, Revelation, Stigg and SY Epson), and Gatsby, used as an internal control, having been extensively characterised in previous studies. The 12 cultivars were grown in a randomized block design experiment with four replicate plants per cultivar distributed into four blocks. The experiment was conducted in August/September 2014 at Rothamsted Research, under glasshouse conditions (26/20 °C, day/night temperatures and no control of day length) with one plant per pot (biological replicate). Plants were screened for their photosynthetic traits, leaf characteristics, and biomass production at the end of the tillering growth stage. The youngest fully-expanded leaf in five-week old plants of the 12 cultivars was analysed with a portable infra-red gas analyser (IRGA) system (LI-6400XTR and leaf chamber 6400-40; LI-COR, Lincoln, NE, USA) for net CO2 assimilation at 25 °C, ambient CO2 concentration (400 μmol CO2 mol−1 air), and at a high light level of 1500 µmol photons m−2 s−1. Subsequently, the leaf area and dry weight of the leaf used for gas-exchange measurements were determined, as well as the total above ground plant biomass (dry weight, g). Rates of net CO2 assimilation at ambient CO2 and high light, specific leaf area, and aboveground biomass were used to select the two parents of the mapping population for this study (Figure 1). Parent 1 was characterised by high rates of net CO2 assimilation and aboveground biomass production, and a low specific leaf area, while parent 2 had low rates of net CO2 assimilation and aboveground biomass production, and a high specific leaf area. It was anticipated that a high level of genetic variation for the traits of interest would be present in a population having parents with contrasting phenotypes, which would enable the dissection of traits driving the grain yield.
The double-haploid mapping population, comprising the two parents and 119 lines, was grown at the Rothamsted Research farm, in Harpenden, UK, between 2014 and 2015 (sown 20 October 2014 and harvested 23 August 2015). The experiment was planted in the Pastures field, in a typical Batcombe soil [21], after an oilseed rape crop, in 2 × 1 m (2 m2) plots of six rows, with a sowing rate of 350 seeds m−2, and organized in three randomized blocks. To obtain powerful comparisons and to assess spatial variation over the whole experiment (32.5 × 73.75 m), the parents were replicated six times in each block. Commercial cultivars Avalon, Brompton, Cadenza, Gatsby, and Gladiator were also included (once per block) for comparison as controls. The application of fungicides, insecticides, and herbicides, as well as fertilizers, followed Rothamsted farm practices.
2.2. Crop Development
The date at which half of the plants in a plot reached a given growth stage [22] was monitored throughout the growing season. The frequency of crop development monitoring depended on the crop stage, being less frequent when crop development was slower (from tillering (Z2) to booting (Z4) stages) and more frequent when crop development was faster (from booting (Z4) to dough development (Z8) stages). Senescence was measured from anthesis to the end of the season using the wheat senescence scale [23].
2.3. Phenotyping
A full set of measurements was taken at three specific development stages: vegetative growth (Veg—Z3.2), pre-anthesis (Pre-A—Z4.5), and seven days post-anthesis (Post-A—Z6.5+7 days). Other measurements were taken more frequently throughout the growing season, as detailed below.
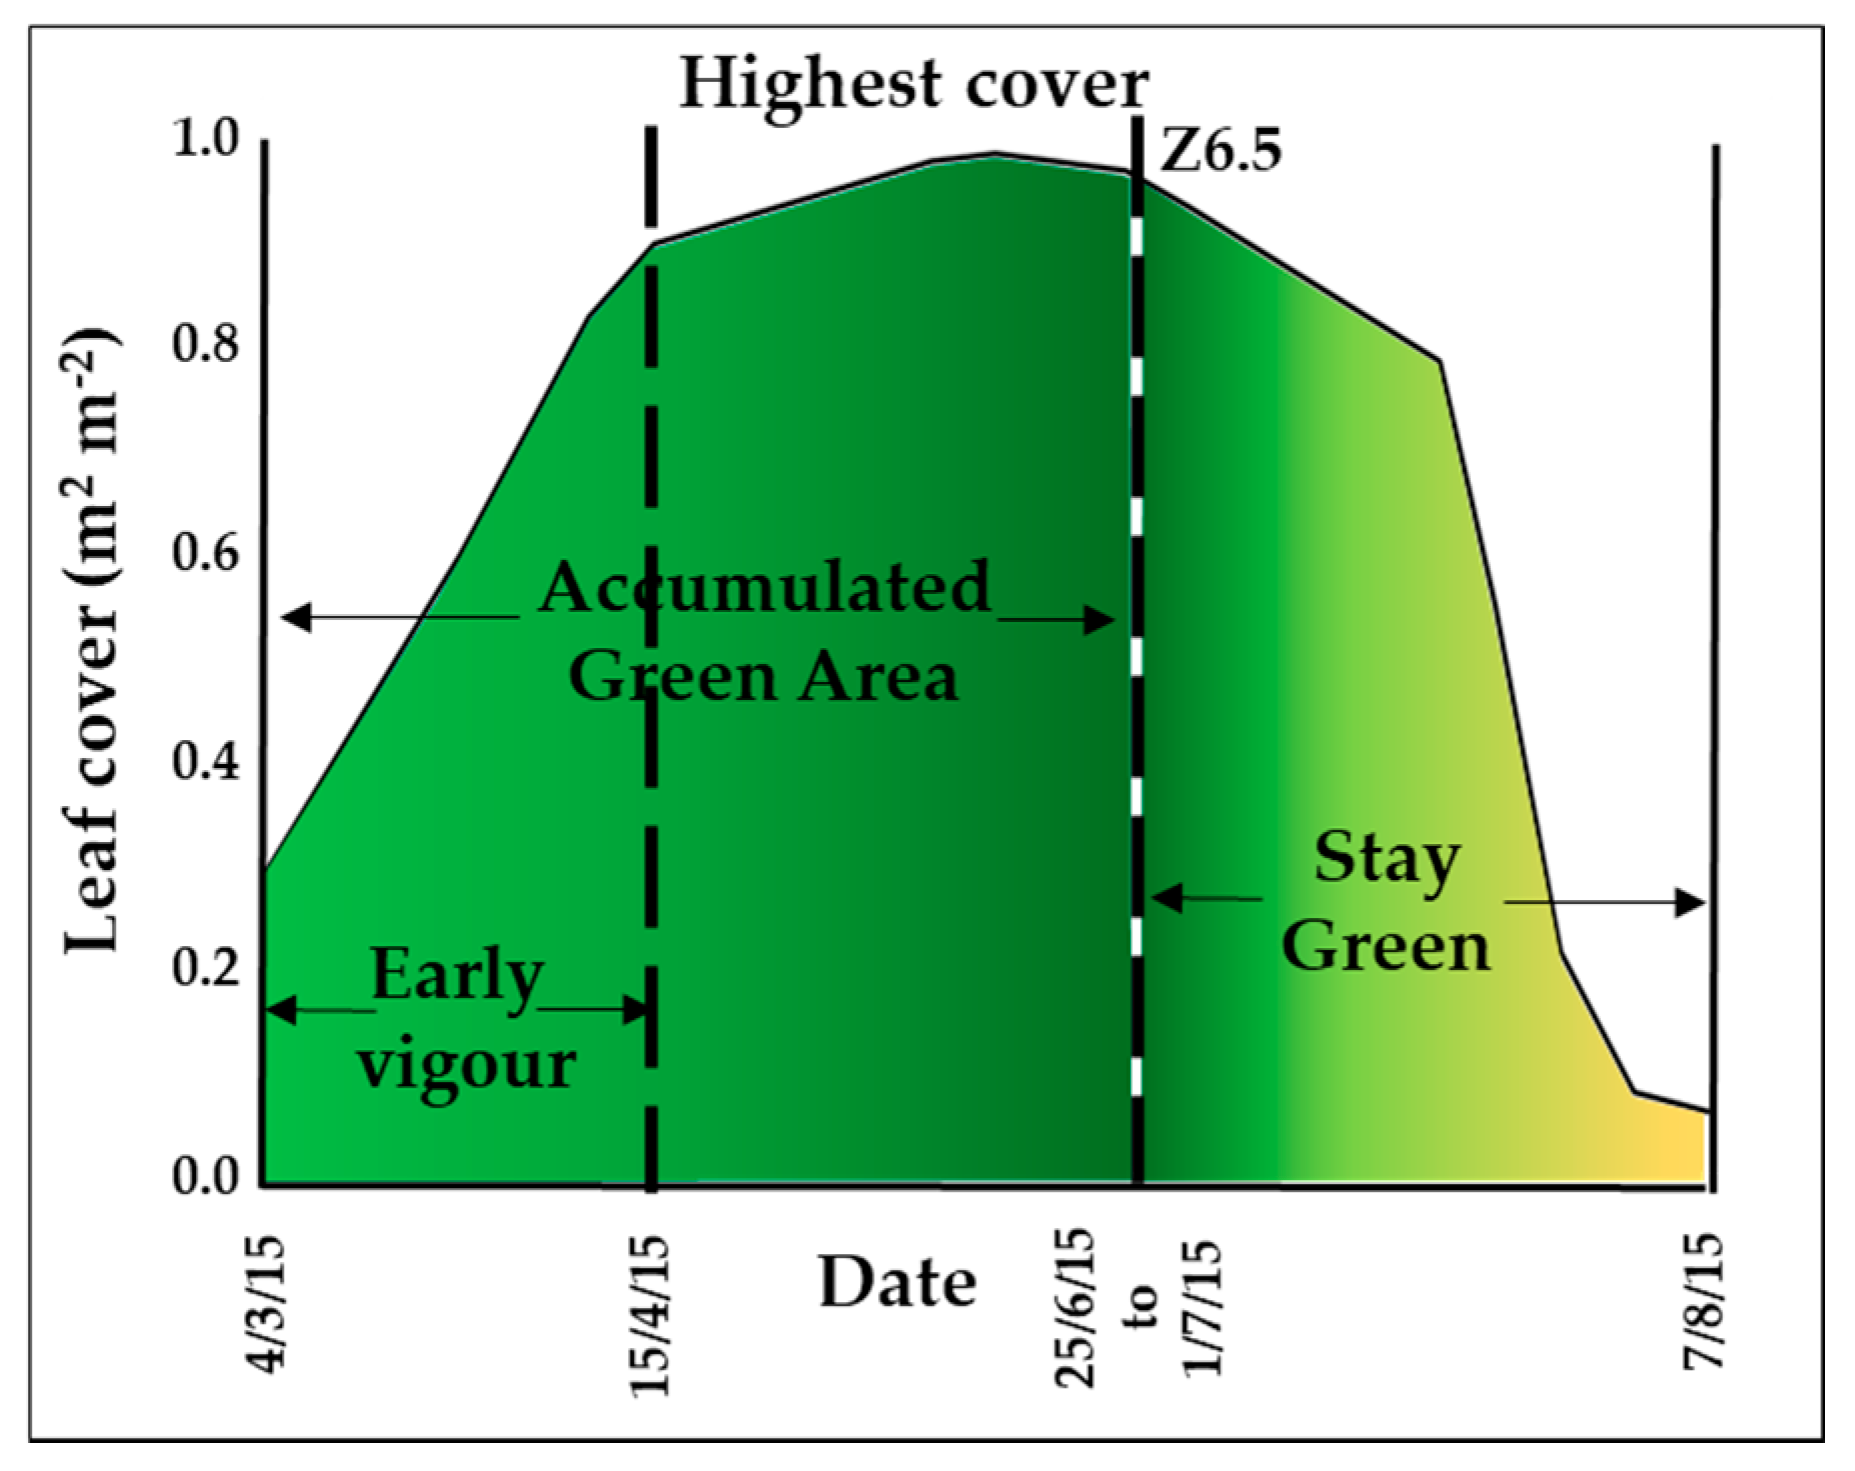
Leaf cover: horizontal photographs of the canopy from above, parallel to the soil surface of the plot, were taken weekly from March (Z2.4) to August (Senescence score 10) using a digital camera. The pictures were analysed using the BreedPix open access software that outputs the area covered by green tissue as a percentage of the total area [24]. From this data, the following indices were calculated (Figure 2): early vigour (calculated as the sum of the weekly single measurements of leaf cover from the first measurement date (4 March 2015) to the date when plots reached an average of 90% of area covered by leaves (15 April 2015), accumulated green area (calculated as the sum of the weekly single measurements of leaf cover from the first measurement date (4 March 2015) to the date when plants reached Z6.5 (between 26 June 2015 and 1 July 2015 according to plants’ development in each plot), maximum leaf cover (maximum value of leaf cover over the season), and stay green (calculated as the sum of the weekly single measurements of leaf cover from Z6.5 to the last measurement date (7 August 2015).
Leaf Area Index (LAI): measured at soil level at the three crop development stages analysed (Veg, Pre-A, and Post-A) using a LI-COR LAI-2200 plant canopy analyser (LI-COR, Lincoln, NE, US). Three measurements were taken between the second and third row of each plot at the 25, 50, and 75 percentiles of plot length and mean values per plot determined.
Height: crop height at the three crop development stages (Veg, Pre-A, and Post-A). Measurements were taken from the soil to the top most part of the crop, with a single measurement taken per plot.
Peduncle length: the distance between the flag leaf collar and the bottom of the spike was measured for three plants per plot at Post-A and mean values per plot calculated.
Reflectance: measured 75 cm above the canopy at the three crop development stages (Veg, Pre-A, and Post-A) using a HandySpec System (TEC5, Oberursel, Germany) reflectance meter. From the reflectance measurements, a set of traits was calculated, using the software accompanying the HandySpec System meter: NDVI (Normalized Difference Vegetation Index), Sra (Simple Ratio), RARSa (Ratio analysis of reflectance Chlorophyll a), RARSb (Ratio analysis of reflectance Chlorophyll b), RARSc (Ratio analysis of reflectance Carotenoid), NPQI (Normalized pheophytinization index), SIPI (Structural Independent Pigment Index), PRI (Photochemical Reflectance Index), and WI (Water Index), according to [25].
Gas-exchange analysis: measured at Pre-A and Post-A for the flag leaf in one plant per plot with a portable infra-red gas analyser (IRGA) system (LI-6400XTR and chamber 6400-40; LI-COR, Lincoln, NE, USA), using the multiphase flash method [26]. Plant harvest and flag leaf preparation was carried out according to the methodology described by [27]. Leaf gas exchange parameters were measured at an ambient CO2 concentration of 400 µmol CO2 µmol air−1; light levels (Photosynthetic Photon Flux Density, PPFD) of 1800, 1000, 500, 250, and 100 µmol photons m−2 s−1; a vapour pressure deficit of ~0.9 kPa; and a block temperature of 20 °C. Maximum net photosynthesis (Amax) was measured at 1200 µmol CO2 µmol air−1 and 1800 µmol photons m−2 s−1. Fluorescence measurements used the following settings for the multiphase flash method: Ramp 40%, Phase I 300, Phase II 200, Phase III 300, Target 7, Rate 20 kHz, and Filter 50 Hz.
Flag leaf and plant traits: the flag leaves analysed for gas-exchange measurements were also used for the following measurements: leaf thickness, length and width, chlorophyll content (SPAD 502, Minolta, Osaka, Japan), flag leaf area, and weight. The harvested plant shoot, used for flag leaf analysis, was also weighted. The measurements were done at Pre-A and Post-A. At Post-A only, plant shoot, stem thickness, and the number of green leaves were also determined, as well as the following spike characteristics: spike dry weight, length, width, presence of awns, and number of spikelets.
In-growing-season biomass analysis: at Post-A, the tillers in a 50 cm row (in the first quarter of the third row in each plot) were manually harvested, with the following measurements being taken: tiller count, leaves, stems, and spike dry weight, according to methodology described by [23].
End-of-growing-season biomass analysis: at physiological maturity (Z9.9), the tillers in a 50 cm row (in the third quarter of the third row in the plot) were manually harvested and tiller count, straw, spike and grain dry weight, grain moisture, and grain number were measured. The following traits were calculated: harvest index, grain weight per ear, grain number per ear, thousand-grain weight, estimated yield, and estimated biomass production [23].
Combine harvest: plants were harvested using a Haldrup-C65 (Haldrup, Le Mans, France) plot combine. Grain weight for each plot was determined by the combine. Grain moisture was measured using a sub-sample of grains from each plot, at harvest time, and grain weight was normalized to 15% moisture content. Grain weight per plot was corrected for the two sections harvested by hand and the grain yield was estimated in tons per hectare at 85% dry matter.
Phenotypic traits were grouped into four categories: leaf and canopy (leaf cover, leaf area index, height, peduncle length, flag leaf, and plant characteristics), biomass (in-growing-season and end-of-growing-season biomass traits and grain yield from the combine), reflectance (reflectance indices), and gas-exchange (measured and calculated from the IRGA analysis).
2.4. Statistical Analysis
The method of residual maximum likelihood (REML) was used to fit a linear mixed model to each measured trait to test for any statistically significant (p < 0.05, Chi-squared test) variation due to first-order auto-regressive spatial trends over the rows and columns in the field design. Predicted means from the model fitted to each trait were used in subsequent correlation analyses. These are the means expected in the absence of any spatial trends. Hence, of the traits reported here, some evidence (p < 0.05, Chi-squared test) of a minor trend over rows was found for net photosynthesis (A) and stomatal conductance (gs), but only at 1000 and 1800 µmol photons m−2 s−1. Pearson Product Moment (PPM) correlation coefficients (r) were calculated for all the pairs of traits measured to evaluate pairwise association (F-tests).
To compare different strategies of high yield formation, lines were ranked in terms of grain yield. Also, for each trait, values were ranked as high (upper quartile), intermediate (two intermediate quartiles), and low (lower quartile). The traits included in this analysis were chosen based on their correlation to yield, their heritability and variation in the population, and collinearity to other traits. For the lines in the higher quartile, an investigation of traits influencing the yield was performed.
All statistical analyses were performed using the GenStat 17th Edition software (VSN International Ltd., Hemel Hampstead, UK).
2.5. Heritability
Broad-sense heritability (H2) was calculated for all the traits measured in each season using the procedure described by [28], based on the ratio of the between line variance component, Var(L), to the sum of this plus the residual variance accounting for the three replicates per cultivar, i.e., Var(e)/3, as estimated by best linear unbiased predictors (BLUPs), using the results of the linear mixed model analyses.
2.6. Genetic Variation
The genetic variation of each measured trait was calculated by the ratio of the estimated standard deviation of the trait (σ) to the estimated trait average (μ), i.e., the coefficient of variation. This represents a normalized variation of each trait for the mapping population in the growing season.
3. Results
3.1. Traits within the Same Group of Measurements Presented High Collinearity
The total number of measured/calculated traits was over 150 and multiple correlation trends between traits were observed. The Pearson coefficient (r) indicates the level of correlation between a pair of traits. It varies from a strong negative correlation (−1) to a strong positive correlation (+1). A positive correlation between a pair of traits means that increases in one trait are related to increases in the other. Negative correlations have the opposite meaning, with increases in one trait being related to decreases in the other or vice versa. As some traits were measured using the same instrument, at the same time, or were calculated from a single measurement, a common trend of collinearity was observed within groups of traits. Strong positive and negative correlations were observed between pairs of traits mainly inside the groups comprising reflectance indices and gas-exchange measurements (Figure S1). Considering the high number of traits measured in the current study, when collinearity was high inside a group of traits, the selection of a few or a single trait that significantly correlated to the trait of interest (grain yield) and to the other group traits was selected for subsequent analysis to simplify the interpretation of the results.
3.2. Correlation to Grain Yield Varied at Different Developmental Stages
The correlation between grain yield and specific measured traits changed throughout the growing season depending on the crop developmental stage. This suggests that some traits might be more, or less, important to the final yield definition in different stages of crop development. A significant correlation to yield is one of the important characteristics for a trait to be chosen as a potential target for yield improvement in a breeding programme, as well as high heritability and high genetic variation. Several traits correlated significantly (p < 0.05, F-test) to yield, but also correlated to other traits in the same group to which they pertained. For instance, reflectance indices at the Veg stage (NDVI, SRA, RASRc, and SIPI) correlated positively to yield, but also correlated strongly to each other. The set of traits presented in Table 1 was selected for their correlation to yield, their high genetic variation, and high heritability. Traits within the same group that correlated strongly to the selected trait and had a weaker correlation to yield are not shown.
3.2.1. Leaf and Canopy
Canopy cover and longevity traits correlated positively to grain yield, including: accumulated green area until Z6.5 (r = 0.43, p < 0.001), highest cover (r = 0.42, p < 0.001, F-test), early vigour (r = 0.27, p < 0.01, F-test), and stay green (r = 0.26, p < 0.01, F-test) (Table 1). Although accumulated green area and highest cover showed a similar correlation to yield and heritability (H2 = 0.77 for both), accumulated green area presented greater genetic variation (σ/μ = 0.03) than highest cover (σ/μ = 0.01) in the population (Table 1). This can be explained by the fact that although every genotype covered nearly 100% of the soil area in the plots at their highest cover, there were different rates of accumulation of green area to reach the highest cover.
3.2.2. Biomass
Plant biomass accumulated at Post-A also correlated positively to grain yield. Biomass accumulation in stems (r = 0.23, p < 0.05, F-test) and leaves (r = 0.25, p <0.01, F-test), as well as total plant biomass (r = 0.24, p < 0.05, F-test), correlated to grain yield (Table 1). The positive correlation between biomass accumulated in stems at Post-A and grain yield may be explained by grain filling being the period of the greatest availability of dry matter to be re-allocated from the stem to the grain. Post-A leaf biomass also correlated to Post-A specific leaf area (r = 0.39, p < 0.001, F-test) and leaf area index (r = 0.42, p < 0.001, F-test), and to stay green (r = 0.54, p < 0.001, F-test). These multiple correlations reflect a greater capacity to intercept and convert energy Post-A, generating photoassimilates that sustain grain filling and thus contribute to the grain yield.
3.2.3. Reflectance Indices
NDVI, as a measurement of green biomass, correlated positively to the leaf cover traits, as well as to the grain yield, at Veg (r = 0.49, p < 0.001, F-test) and Pre-A (r = 0.28, p < 0.01, F-test) (Table 1). The NDVI correlation to yield decreased during the season (at Post-A, r = 0.17, p = 0.06, F-test). PRI, an indirect measurement of canopy light use efficiency, correlated to photosynthesis and other gas-exchange traits, as well as to grain yield at Veg (r = 0.48, p < 0.001, F-test), Pre-A (r = 0.44, p < 0.001, F-test), and Post-A (r = 0.35, p < 0.001, F-test) (Table 1). WI is a measurement of canopy water stress, inverse to the canopy water content. This explains its negative correlation to yield, as higher values of WI are related to a lower canopy water content. WI correlated negatively to yield at Veg (r = −0.36, p < 0.001, F-test), Pre-A (r = −0.21, p < 0.05, F-test), and Post-A (r = −0.42, p < 0.001, F-test) (Table 1), suggesting that water could be limiting to the grain yield, especially Post-A.
3.2.4. Gas-Exchange
Pre-A flag leaf photosynthesis (A) measured at all light levels and ambient CO2, as well as high light and a high CO2 concentration (Amax), correlated positively to grain yield (Table 1). Post-A, the correlations were less strong and only significant for A measured at light levels higher than 1000 µmol photons m−2 s−1. Pre-A, both A and stomatal conductance (gs) correlated to yield at all light levels, while Post-A, at light levels equal or above 1000 μmol photons m−2 s−1, A correlated to yield but gs was not correlated to yield (Table 2). Both Pre-A and Post-A, the correlation between A and gs was very strong at the high light levels, suggesting a diffusion limitation to CO2 assimilation. This correlation decreased at lower light intensities, especially at 100 µmol photons m−2 s−1, suggesting that photosynthesis was limited not just by diffusion, but also by the biochemical pathways involved in carbon fixation and the light reactions (Table 2).
3.3. High Yielding Lines Presented Different Strategies to Build Grain Yield
Lines in the high yielding group (higher quartile for grain yield within the population) presented different strategies to achieve higher productivity (Table 3), based on the traits with a stronger correlation to yield (Table 1). Lines relied on increased early vigour and green mass accumulation with lower photosynthetic rates (e.g., line 223), on the re-allocation of pre-stored biomass to the grain (e.g., line 223 and 315), and/or on the maintenance of carbon uptake levels in the flag leaf during grain filling (e.g., line 140).
The highest yielding line in the population (223) presented high canopy cover and longevity, and high biomass accumulation Post-A, despite having low photosynthesis per leaf area Pre-A and Post-A (Table 3). Line 246, on the other hand, had low canopy cover and longevity and intermediate values of accumulated biomass Post-A, but high values for photosynthesis per leaf area both Pre-A and Post-A. Line 399 presented intermediate values for canopy cover and longevity, biomass accumulated Post-A, and photosynthesis Pre-A and Post-A. Although the difference between Pre-A and Post-A photosynthesis did not correlate with grain yield (p < 0.05, F-test; data not shown), line 140, which maintained similar levels of photosynthesis for Pre-A and Post-A, reached the second highest yield in the population, supporting the importance of sustained flag leaf photosynthesis throughout grain filling.
The two parents of the mapping population presented intermediate yields and different patterns for the analysed traits (Table 3). The photosynthesis patterns in the experiment were consistent with those observed during the preliminary glasshouse experiments that led to selection of the mapping population, with Parent 1 presenting higher photosynthesis values than Parent 2 (Figure 1 and Table 3). The correlations between yield and multiple traits and their variation over the growing season, as well as the diverse strategies of achieving high yields observed, demonstrate the complexity of the interaction of many components to determine grain yield and the need for an integrated approach for its understanding and prediction.
4. Discussion
A double-haploid wheat mapping population was grown in the field in the UK to identify phenotypic drivers of the grain yield. Grain yield correlated with multiple traits at different scales, from leaf to canopy, depending on the crop development stage. The results demonstrate the existence of different strategies to reach high yields and the need to phenotype field grown plants across the growing season. The results are discussed in terms of the multiple correlations between traits and their influence on yield.
4.1. Main Drivers of Yield
At the leaf and canopy level, early vigour, accumulated green area, and stay green correlated positively with yield. These traits determine the length of the period over which plants will intercept light and be able to convert it into biomass, thus, indirectly, these traits contribute to both εi [29] and to εc [14] by extending the period over which plants are photosynthetically active. Consequently, these traits contribute to increasing plant biomass and crop yields. The positive correlation of NDVI with grain yield is also related to εi and εc as it represents green area cover.
For the biomass allocation patterns, the weight of leaves, stems, and the whole plant Post-A correlated positively with yield. Biomass traits result from the combined εi and εc, and represent a source of biomass to be reallocated to the spike (sink) during the grain filling process, thereby affecting εp. This is in agreement with the fact that the reallocation of carbohydrates stored in plant organs, together with flag leaf photosynthesis, are important drivers of grain yield formation in wheat [30], mainly Post-A, when the grain development starts. Additionally, the weight of leaves is also correlated to εc as it is linked to the photosynthetic apparatus capacity.
Collectively, the statistically significant (p < 0.05, F-test) correlations between the various phenotypic traits and yield were not remarkably high, with r being generally lower than 0.50. This confirms the underlying intuition that many drivers contribute to the formation of yield, rather than one individual component being a sole, strongly associated candidate. This is also reinforced by the multiple strategies found to reach a high yield. Mapping these strategies is crucial to understanding possible combinations of traits to reach high yields and how those strategies can be chosen to reach or maintain yields in different environments and under different climatic scenarios and environmental pressures.
4.2. Photosynthesis and Yield
The selection of a population generated from parents with contrasting photosynthetic characteristics enabled variation in this trait to be exploited to understand its influence on yield. The average variation (σ/μ) of photosynthesis in the population was around 5.2% at Pre-A and Post-A. Other gas-exchange traits presented larger or smaller variation than photosynthesis, such as the stomatal conductance (12%) and maximum quantum efficiency of PSII in light adapted leaves (Fv’/Fm’) (1.7%).
Free-air CO2 enrichment (FACE) experiments showed that increased photosynthetic rates result in yield increases, when other conditions are not limiting [31]. In the present study, Pre-A and Post-A photosynthesis correlated with yield, with stronger correlations being observed for photosynthetic traits measured Pre-A than Post-A; these traits are representative of εc. Correlations between photosynthesis and yield have been previously reported in wheat [32,33,34,35,36]. The correlations of PRI and WI to grain yields are also related to εc as they are linked to LUE, stomatal conductance, and leaf water status.
In wheat, flag leaf photosynthesis Pre-A was generally higher than it was Post-A, as also reported by [36]. The decrease from Pre-A to Post-A was around 12% at light levels of 1800, 1000, and 500; 8% at 250; and 3% at 100 µmol photons m−2 s−1. There was an interaction between lines and development stages for photosynthesis, suggesting different patterns for the reduction in photosynthesis from Pre-A to Post-A between the lines, although the difference in photosynthetic rates between the two growth stages was not significantly correlated to yield (p < 0.05, F-test).
The reduction in photosynthesis resulting from reduced light levels was very similar over the lines and there was no correlation between the reduction pattern and yield. Rates of photosynthesis were highly correlated to stomatal conductance at light levels above 250 µmol photons m−2 s−1, but the correlation was weaker at the lower light level of 100 µmol photons m−2 s−1 (Table 2). These results agree with the notion that stomatal conductance limits photosynthesis at a range of light levels and that biochemical limitations are relatively more prominent as the light reaches low levels [37].
Broad-sense heritability estimated for photosynthesis measured at the various light levels was on average 0.51. A similar value has been reported by [38] and this value is also within the range reported by [36]. The heritability estimate for photosynthesis decreased with light level (Table 1), suggesting a smaller effect of the genetic background in defining the phenotype at the lower light level (100 µmol photons m−2 s−1). This might explain the lower correlation between photosynthesis and yield at lower light levels, as grain yield was strongly linked to the genetic background with a broad-sense heritability of 0.73.
4.3. Canopy vs. Leaf Photosynthesis
Considering its correlation to yield and natural variation, photosynthesis is currently a major target trait in breeding for higher yields [39]. However, phenotyping leaf gas-exchange traits in detail for large populations under field-grown conditions can be challenging, given the length of time taken to perform the measurements and the plant responses to climatic conditions and circadian rhythms. In the current work, the methodology proposed by [27] contributed to standardizing measuring conditions and allowed a reliable method to assess gas-exchange traits in field grown plants. Despite the improved methodology, measuring gas-exchange at the leaf level, using infra-red gas analysers (IRGAs), is still a time-consuming process. Reflectance indices have been proposed as high-throughput estimators of photosynthetic traits at the top of the canopy. For the double-haploid population, flag leaf photosynthesis and PRI presented a reasonable positive correlation Pre-A (r = 0.46, p < 0.001) and Post-A (r = 0.20, p < 0.01) and gs and WI were negatively correlated Post-A (r = −0.19, p < 0.05). Correlations between PRI and yield were higher than the correlations between flag leaf photosynthesis and yield (Table 1). As reviewed by [14], measurements of canopy, rather than leaf photosynthesis, tend to correlate more strongly to yield.
PRI estimates reflect a response from the top layers of the canopy, which varies with varying light intensities. Flag leaf photosynthesis represents a small portion of the total plant photosynthesis, and in very specific conditions of light, which explains the relatively low correlation values between PRI and flag leaf photosynthesis and the difficulties in modelling one based on the other, as also observed by [40,41]. Flag leaf photosynthetic characteristics cannot be extended to the entire canopy as PRI cannot be used to understand specific changes in the carbon assimilation behaviour at the leaf level. We conclude that both gas-exchange and reflectance traits are valuable to the understanding of plant behaviour and yield formation, at different levels, and should be used together to assist breeding programs.
5. Conclusions
Grain yield was strongly correlated to multiple traits related to sunlight interception and conversion, and to biomass allocation, with different traits contributing most at key stages along the crop growth cycle. The great majority of the mapped traits were related to conversion efficiency, εc, a current target in crop breeding. The results presented here support the use of photosynthesis, at the leaf and canopy scale, as a target trait for the breeding of high yielding wheat cultivars. High yielding lines had different strategies to achieve higher productivity, which highlights the complexity of grain yield formation. This manuscript provides evidence for the need to phenotype photosynthetic traits at multiple scales, leaf to canopy, and multiple development stages, vegetative, pre-, and post-anthesis.
Supplementary Materials
The following are available online at https://www.mdpi.com/2073-4395/8/6/94/s1, Figure S1: Matrix of Pearson correlation coefficients (r) for pairs of traits measured in a double-haploid wheat mapping population grown in UK.
Author Contributions
J.P.P., E.C.-S., P.J.A., D.F., S.J.P., and M.A.J.P. designed the research. J.P.P., E.C.-S., and P.J.A. performed the research. J.P.P. and S.J.P. analysed the data. J.P.P., E.C.-S., P.J.A., D.F., S.J.P., and M.A.J.P. wrote the paper.
Acknowledgments
This research was partly supported by the Rothamsted Research Institute Strategic Programs 20:20 Wheat® (BBSRC BB/J/00426X/1 20:20 Wheat®) and Designing Future Wheat (BBSRC BB/P016855/1). JPP was funded by the Brazilian CNPq through the Science without Borders Program for the PhD degree (246221/2012-7). E.C.-S. and M.A.J.P. also acknowledge financial support from the Lancaster Environment Centre. The authors are thankful to the many Rothamsted colleagues and visitors who helped with data collection during field campaign days and sample processing post-harvest. In particular, we would like to thank Florian Bos for technical help and Chris Hall for sharing his expertise in sample handling post-harvest.
Conflicts of Interest
The authors declare no conflict of interest. The funding sponsors had no role in the design of the study; in the collection, analyses, or interpretation of data; in the writing of the manuscript, and in the decision to publish the results.
References
- FAO. The State of Food Insecurity in the World; ESA Working Paper; FAO: Rome, Italy, 2002. [Google Scholar]
- Godfray, H.C.J.; Beddington, J.R.; Crute, I.R.; Haddad, L.; Lawrence, D.; Muir, J.F.; Pretty, J.; Robinson, S.; Thomas, S.M.; Toulmin, C. Food Security: The challenge of feeding 9 billion people. Science 2010, 327, 812–818. [Google Scholar] [CrossRef] [PubMed]
- Pingali, P.L. Westernization of Asian diets and the transformation of food systems: Implications for research and policy. Food Policy 2006, 32, 281–298. [Google Scholar] [CrossRef]
- Tilman, D.; Clark, M. Food, agriculture & the environment: Can we feed the world & save the earth? Am. Acad. Arts Sci. 2015, 144, 1–23. [Google Scholar]
- Berry, E.M.; Dernini, S.; Burlingame, B.; Meybeck, A.; Conforti, P. Food security and sustainability: Can one exist without the other? Public Health Nutr. 2015, 18, 2293–2302. [Google Scholar] [CrossRef] [PubMed]
- Alexandratos, N.; Bruinsma, J. World Agriculture towards 2030/2050: The 2012 Revision; ESA Working Paper No. 12-03; Agricultural Development Economics Division, Food and Agriculture Organization of the United Nations: Rome, Italy, 2012. [Google Scholar]
- Grassini, P.; Eskridge, K.M.; Cassman, K.G. Distinguishing between yield advances and yield plateaus in historical crop production trends. Nat. Commun. 2013, 4, 1–21. [Google Scholar] [CrossRef] [PubMed]
- FAOSTAT Food and Agriculture Organization of the United Nations Database. Available online: http://www.fao.org/faostat/en/#home (accessed on 23 December 2016).
- Knight, S.; Kightley, S.; Bingham, I.; Hoad, S.; Lang, B.; Philpott, H.; Stobart, R.; Thomas, J.; Barnes, A.; Ball, B. Desk Study to Evaluate Contributory Causes of the Current ‘Yield Plateau’ in Wheat and Oilseed Rape; HGCA Project Report No. 502; AHDB: Kenilworth, UK, 2012. [Google Scholar]
- Reynolds, M.; Langridge, P. Physiological breeding. Curr. Opin. Plant Biol. 2016, 31, 162–171. [Google Scholar] [CrossRef] [PubMed]
- Monteith, J.L.; Moss, C.J. Climate and the efficiency of crop production in Britain. Philos. Trans. R. Soc. Lond. B 1977, 281, 277–294. [Google Scholar] [CrossRef]
- Long, S.P.; Marshall-Colon, A.; Zhu, X.G. Meeting the global food demand of the future by engineering crop photosynthesis and yield potential. Cell 2015, 161, 56–66. [Google Scholar] [CrossRef] [PubMed]
- Araus, J.L.; Slafer, G.A.; Royo, C.; Serret, M.D. Breeding for yield potential and stress adaptation in cereals. Crit. Rev. Plant Sci. 2008, 27, 377–412. [Google Scholar] [CrossRef]
- Richards, R.A. Selectable traits to increase crop photosynthesis and yield of grain crops. J. Exp. Bot. 2000, 51, 447–458. [Google Scholar] [CrossRef] [PubMed] [Green Version]
- Foulkes, M.J.; Slafer, G.A.; Davies, W.J.; Berry, P.M.; Sylvester-Bradley, R.; Martre, P.; Calderini, D.F.; Griffiths, S.; Reynolds, M.P. Raising yield potential of wheat. III. Optimizing partitioning to grain while maintaining lodging resistance. J. Exp. Bot. 2011, 62, 469–486. [Google Scholar] [CrossRef] [PubMed]
- Medlyn, B.E. Physiological basis of the light use efficiency model. Tree Physiol. 1998, 18, 167–176. [Google Scholar] [CrossRef] [PubMed] [Green Version]
- Araus, J.L.; Slafer, G.A.; Reynolds, M.P.; Royo, C. Plant breeding and drought in C3 cereals: What should we breed for? Ann. Bot. 2002, 89, 925–940. [Google Scholar] [CrossRef] [PubMed]
- Zhu, X.G.; Long, S.P.; Ort, D.R. What is the maximum efficiency with which photosynthesis can convert solar energy into biomass? Curr. Opin. Biotechnol. 2008, 19, 153–159. [Google Scholar] [CrossRef] [PubMed]
- Raines, C.A. Increasing photosynthetic carbon assimilation in C3 plants to improve crop yield: Current and future strategies. Plant Physiol. 2011, 155, 36–42. [Google Scholar] [CrossRef] [PubMed]
- Mir, R.R.; Zaman-Allah, M.; Sreenivasulu, N.; Trethowan, R.; Varshney, R.K. Integrated genomics, physiology and breeding approaches for improving drought tolerance in crops. Theor. Appl. Genet. 2012, 125, 625–645. [Google Scholar] [CrossRef] [PubMed] [Green Version]
- Avery, B.W.; Catt, J.A. The Soil at Rothamsted; Map prepared by E M Thompson and the Soil Survey and Land Research Centre; Cranfield University, Lawes Agricultural Trust: Harpenden, UK, 1995. [Google Scholar]
- Zadoks, I.C.; Chang, T.T.; Konzak, C.F. A decimal code for the growth stages of cereals. Weed Res. 1974, 14, 415–421. [Google Scholar] [CrossRef]
- Pask, A.; Pietragalla, J. Leaf area, green crop area and senescence. In Physiological Breeding II: A Field Guide to Wheat Phenotyping; CIMMYT: Mexico City, Mexico, 2012. [Google Scholar]
- Casadesus, J.; Kaya, Y.; Bort, J.; Nachit, M.M.; Araus, J.L.; Amor, S.; Ferrazzano, G.; Maalouf, F.; Maccaferri, M.; Martos, V.; et al. Using vegetation indices derived from conventional digital cameras as selection criteria for wheat breeding in water-limited environments. Ann. Appl. Biol. 2007, 150, 227–236. [Google Scholar] [CrossRef]
- Pietragalla, J.; Mullan, D.; Mendoza, R.S. Spectral reflectance. In Physiological Breeding II: A Field Guide to Wheat Phenotyping; CIMMYT: Mexico City, Mexico, 2012. [Google Scholar]
- Loriaux, S.D.; Avenson, T.J.; Welles, J.M.; McDermitt, D.K.; Eckles, R.D.; Riensche, B.; Genty, B. Closing in on maximum yield of chlorophyll fluorescence using a single multiphase flash of sub-saturating intensity. Plant Cell Environ. 2013, 36, 1755–1770. [Google Scholar] [CrossRef] [PubMed] [Green Version]
- Driever, S.M.; Lawson, T.; Andralojc, P.J.; Raines, C.A.; Parry, M.A.J. Natural variation in photosynthetic capacity, growth, and yield in 64 field-grown wheat genotypes. J. Exp. Bot. 2014, 65, 4959–4973. [Google Scholar] [CrossRef] [PubMed] [Green Version]
- Cullis, B.R.; Smith, A.B.; Coombes, N.E. On the design of early generation variety trials with correlated data. J. Agric. Biol. Environ. Stat. 2006, 11, 381–393. [Google Scholar] [CrossRef]
- Thomas, H.; Howarth, C.J. Five ways to stay green. J. Exp. Bot. 2000, 51, 329–337. [Google Scholar] [CrossRef] [PubMed] [Green Version]
- Blum, A.; Sinmena, B.; Mayer, J.; Golan, G.; Shpiler, L. Stem reserve mobilisation supports wheat grain filling under heat stress. Aust. J. Plant Physiol. 1994, 21, 771–781. [Google Scholar] [CrossRef]
- Ainsworth, E.A.; Long, S.P. What have we learned from 15 years of free-air CO2 enrichment (FACE)? A meta-analytic review of the responses of photosynthesis, canopy properties and plant production to rising CO2. New Phytol. 2005, 165, 351–372. [Google Scholar] [CrossRef] [PubMed]
- Sayre, K.D.; Rajaram, S.; Fischer, R.A. Yield potential progress in short bread wheats in northwest Mexico. Crop Sci. 1997, 37, 36–42. [Google Scholar] [CrossRef]
- Gutierrez-Rodriguez, M.; Reynolds, M.P.; Larque-Saavedra, A. Photosynthesis of wheat in a warm, irrigated environment II. Traits associated with genetic gains in yield. Field Crops Res. 2000, 66, 51–62. [Google Scholar] [CrossRef]
- Condon, A.G.; Reynolds, M.P.; Brennan, J.; van Ginkel, M.; Trethowan, R.; Rebetzke, G.J.; Bonnett, D.G.; Richards, R.A.; Farquhar, G.D. Stomatal aperture related traits and yield potential in bread wheat. In International Symposium on Wheat Yield Potential: Challenges to International Wheat Breeding; CIMMYT: Mexico City, Mexico, 2008. [Google Scholar]
- Gaju, O.; DeSilva, J.; Carvalho, P.; Hawkesford, M.J.; Griffiths, S.; Greenland, A.; Foulkes, M.J. Leaf photosynthesis and associations with grain yield, biomass and nitrogen-use efficiency in landraces, synthetic-derived lines and cultivars in wheat. Field Crops Res. 2016, 193, 1–15. [Google Scholar] [CrossRef] [Green Version]
- Carmo-Silva, E.; Andralojc, P.J.; Scales, J.C.; Driever, S.M.; Mead, A.; Lawson, T.; Raines, C.A.; Parry, M.A.J. Phenotyping of field-grown wheat in the UK highlights contribution of light response of photosynthesis and flag leaf longevity to grain yield. J. Exp. Bot. 2017, 68, 3473–3486. [Google Scholar] [CrossRef] [PubMed] [Green Version]
- Lawson, T.; Kramer, D.M.; Raines, C.A. Improving yield by exploiting mechanisms underlying natural variation of photosynthesis. Curr. Opin. Biotechnol. 2012, 23, 215–220. [Google Scholar] [CrossRef] [PubMed]
- Ratajczak, D.; Górny, A.G. Water- and nitrogen-dependent alterations in the inheritance mode of transpiration efficiency in winter wheat at the leaf and whole-plant level. J. Appl. Genet. 2012, 53, 377–388. [Google Scholar] [CrossRef] [PubMed] [Green Version]
- Parry, M.A.J.; Hawkesford, M.J. An integrated approach to crop genetic improvement. J. Integr. Plant Biol. 2012, 54, 250–259. [Google Scholar] [CrossRef] [PubMed]
- Peñuelas, J.; Garbulsky, M.F.; Filella, I. Photochemical reflectance index (PRI) and remote sensing of plant CO2 uptake. New Phytol. 2011, 191, 596–599. [Google Scholar] [CrossRef] [PubMed]
- Wu, C.; Huang, W.; Yang, Q.; Xie, Q. Improved estimation of light use efficiency by removal of canopy structural effect from the photochemical reflectance index (PRI). Agric. Ecosyst. Environ. 2015, 199, 333–338. [Google Scholar] [CrossRef]
Figure 1.
Relationship between the net CO2 assimilation at high light and ambient CO2 (A) and (a) total aboveground plant biomass (dry weight, DW) or (b) specific leaf area (SLA) of the leaf used for photosynthesis measurements. Conditions for infra-red gas analysis were: reference CO2 = 400 μmol mol−1, PPFD = 1500 μmol m−2 s−1, and block temperature = 25 °C. Values are means of four replicate plants.

Figure 2.
Graphic representation of leaf cover indices. Early vigour, as accumulated leaf area until 90% of plot area cover by leaves was reached; accumulated green area, as accumulated leaf area until flowering; highest cover; and stay green, as accumulated leaf area from flowering to harvest.
Figure 2.
Graphic representation of leaf cover indices. Early vigour, as accumulated leaf area until 90% of plot area cover by leaves was reached; accumulated green area, as accumulated leaf area until flowering; highest cover; and stay green, as accumulated leaf area from flowering to harvest.


Table 1.
Pearson correlation coefficients (r) for correlation with grain yield, genetic variation (σ/μ), and heritability (H2) of physiological traits measured in a double-haploid wheat mapping population grown in the UK.
Table 1.
Pearson correlation coefficients (r) for correlation with grain yield, genetic variation (σ/μ), and heritability (H2) of physiological traits measured in a double-haploid wheat mapping population grown in the UK.
| Leaf and Canopy | Biomass | |||||||
| Early Vigour | Acc. Green Area | Highest Cover | Stay Green | Leaves Weight (Post-A) | Stem Weight (Post-A) | Total Biomass (Post-A) | ||
| Correlation (r) | 0.27 ** | 0.43 *** | 0.42 *** | 0.26 ** | 0.25 ** | 0.23 * | 0.24 * | |
| Variation (σ/) | 0.09 | 0.03 | 0.01 | 0.09 | 0.10 | 0.09 | 0.08 | |
| Heritability (H2) | 0.50 | 0.77 | 0.77 | 0.78 | 0.42 | 0.42 | 0.24 | |
| Reflectance Indices | ||||||||
| NDVI (Veg) | PRI (Veg) | WI (Veg) | NDVI (Pre-A) | PRI (Pre-A) | WI (Pre-A) | PRI (Post-A) | WI (Post-A) | |
| Correlation (r) | 0.49 *** | 0.48 *** | −0.36 *** | 0.28 ** | 0.44 *** | −0.21 * | 0.35 *** | −0.42 *** |
| Variation (σ/) | 0.02 | 0.70 | 0.01 | 0.01 | 1.98 | 0.02 | 0.33 | 0.01 |
| Heritability (H2) | 0.71 | 0.89 | 0.57 | 0.79 | 0.87 | 0.70 | 0.93 | 0.79 |
| Gas-Exchange | ||||||||
| AQ1800 (Pre-A) | AQ1000 (Pre-A) | AQ500 (Pre-A) | AQ250 (Pre-A) | AQ100 (Pre-A) | Amax (Pre-A) | AQ1800 (Post-A) | AQ1000 (Post-A) | |
| Correlation (r) | 0.28 ** | 0.29 ** | 0.28 ** | 0.28 ** | 0.23 * | 0.21 * | 0.18 * | 0.19 * |
| Variation (σ/) | 0.07 | 0.06 | 0.05 | 0.04 | 0.05 | 0.05 | 0.07 | 0.06 |
| Heritability (H2) | 0.59 | 0.61 | 0.61 | 0.47 | 0.28 | 0.54 | 0.59 | 0.61 |
Traits are grouped according to Leaf and canopy, Biomass, Reflectance indices, and Gas-exchange. Significance levels for correlations are given by an F-test on 1 and 119 degrees of freedom: * p < 0.05; ** p < 0.01, *** p < 0.001. Genetic variation is calculated as the ratio of the standard deviation (σ) and the average of each trait (μ) and provides a normalized dispersion index. Heritability (H2) is calculated according to [28] and represents the ratio of the genotypic variance component, Var(L), to the total of this plus the residual variance accounting for the three biological replicates per genotype, i.e., Var(e)/3. Veg, vegetative growth (Z3.2); Pre-A, pre-anthesis (Z4.5); Post-A, seven days post-anthesis (Z6.5+7 days). NDVI, Normalized Difference Vegetation Index; PRI, Photochemical Reflectance Index; WI, Water Index. AQ, flag leaf net photosynthesis (A) at ambient CO2 and a light level Q; Amax, net photosynthesis at 1200 µmol CO2 µmol air−1 and a light level of 1800 µmol photons m−2 s−1.
Table 2.
Pearson correlation coefficients (r) between pre-anthesis (Pre-A; Z4.5) or post-anthesis (Post-A; Z6.5+7 days) net photosynthesis (A), stomatal conductance (gs), and grain yield in a double-haploid wheat mapping population grown in the UK.
Table 2.
Pearson correlation coefficients (r) between pre-anthesis (Pre-A; Z4.5) or post-anthesis (Post-A; Z6.5+7 days) net photosynthesis (A), stomatal conductance (gs), and grain yield in a double-haploid wheat mapping population grown in the UK.
| Light Levels (µmol Photons m−2 s−1) | |||||
|---|---|---|---|---|---|
| 1800 | 1000 | 500 | 250 | 100 | |
| Pre-A | |||||
| A-gs | 0.92 ** | 0.88 ** | 0.82 ** | 0.76 ** | 0.55 ** |
| A-Yield | 0.28 ** | 0.29 ** | 0.28 ** | 0.28 ** | 0.23 * |
| gs-Yield | 0.22 * | 0.21 * | 0.21 * | 0.21 * | 0.21 * |
| Post-A | |||||
| A-gs | 0.80 ** | 0.85 ** | 0.77 ** | 0.73 ** | 0.49 ** |
| A-Yield | 0.18 * | 0.19 * | 0.17 | 0.12 | 0.08 |
| gs-Yield | 0.16 | 0.17 | 0.18 | 0.16 | 0.16 |
Significance levels for correlations are given by an F test on 1 and 119 degrees of freedom: * p < 0.05; ** p < 0.01.
Table 3.
Strategies for yield formation in the 31 highest yielding lines of a double-haploid wheat mapping population grown in the UK.
Table 3.
Strategies for yield formation in the 31 highest yielding lines of a double-haploid wheat mapping population grown in the UK.

Traits are grouped according to Leaf and canopy, Biomass, Reflectance indices, and Gas-exchange, measured at vegetative growth (Veg; Z3.2), pre-anthesis (Pre-A; Z4.5), and post-anthesis (Post-A; Z6.5+7 days). NDVI, Normalized Difference Vegetation Index; PRI, Photochemical Reflectance Index; WI, Water Index; A, flag leaf net photosynthesis average for all light levels at Pre-A and Post-A (µmol CO2 m−2 s−1). Leaf and canopy and reflectance traits are dimensionless, Biomass (g per 50 cm row), and Yield (t ha−1). For each trait, the lines were ranked according to the quartiles of the trait values: green arrow upwards (upper quartile), yellow arrow to the right (two intermediate quartiles), and red arrow downwards (lower quartile). Mean pop, trait mean value for the whole population; STD pop, trait standard deviation for the whole population (n = 121).
© 2018 by the authors. Licensee MDPI, Basel, Switzerland. This article is an open access article distributed under the terms and conditions of the Creative Commons Attribution (CC BY) license (http://creativecommons.org/licenses/by/4.0/).
Share and Cite
MDPI and ACS Style
Pennacchi, J.P.; Carmo-Silva, E.; Andralojc, P.J.; Feuerhelm, D.; Powers, S.J.; Parry, M.A.J. Dissecting Wheat Grain Yield Drivers in a Mapping Population in the UK. Agronomy 2018, 8, 94. https://doi.org/10.3390/agronomy8060094
AMA Style
Pennacchi JP, Carmo-Silva E, Andralojc PJ, Feuerhelm D, Powers SJ, Parry MAJ. Dissecting Wheat Grain Yield Drivers in a Mapping Population in the UK. Agronomy. 2018; 8(6):94. https://doi.org/10.3390/agronomy8060094
Chicago/Turabian StylePennacchi, João P., Elizabete Carmo-Silva, P. John Andralojc, David Feuerhelm, Stephen J. Powers, and Martin A. J. Parry. 2018. "Dissecting Wheat Grain Yield Drivers in a Mapping Population in the UK" Agronomy 8, no. 6: 94. https://doi.org/10.3390/agronomy8060094
Note that from the first issue of 2016, this journal uses article numbers instead of page numbers. See further details here.