Nitrate Assimilation Limits Nitrogen Use Efficiency (NUE) in Maize (Zea mays L.)


DuPont Pioneer, 7250 NW 62nd Ave, Johnston, IA 50113, USA
*
Author to whom correspondence should be addressed.
Agronomy 2018, 8(7), 110; https://doi.org/10.3390/agronomy8070110
Submission received: 31 May 2018
/
Revised: 19 June 2018
/
Accepted: 27 June 2018
/
Published: 1 July 2018
(This article belongs to the Special Issue Fertilizer Application on Crop Yield)
Abstract
:Grain yield in maize responds to N fertility in a linear-plateau fashion with nitrogen use efficiency (NUE) higher under lower N fertilities and less as grain yield plateaus. Field experiments were used to identify plant parameters relative for improved NUE in maize and then experiments were performed under controlled conditions to elucidate metabolism controlling these parameters. Field experiments showed reproductive parameters, including R1 ear-weight, predictive of N response under both high and low NUE conditions. R1 ear-weight could be changed by varying nitrate concentrations early during reproductive development but from V12 onward R1 ear-weight could be changed little by increasing or decreasing nitrate fertility. Ammonia, on the other hand, could rescue R1 ear-weight as late as V15 suggesting nitrate assimilation (NA) limits ear development response to N fertility since bypassing NA can rescue R1 ear-weight. Nitrate reductase activity (NRA (in vitro)) increases linearly with nitrate fertility but in vivo nitrate reductase activity (NRA (in vivo)) follows organic N accumulation, peaking at sufficient levels of nitrate fertility. The bulk of the increase in total plant N at high levels of nitrate fertility is due to increased plant nitrate concentration. Increasing NADH levels by selective co-suppression of ubiquinone oxidoreductase 51 kDa subunit (Complex I) was associated with improved grain yield by increasing ear size, as judged by increased kernel number plant−1 (KNP), and increased NRA (in vivo) without a change in NRA (in vitro). These results support NUE is limited in maize by NA but not by nitrate uptake or NRA (in vitro).
1. Introduction
NUE in maize is defined as an incremental increase in grain yield with incremental increases in N fertilizer [1,2]. Grain yield responds to N fertility in a linear-plateau fashion [3]. NUE is greater at lower inputs of N [1,4,5] where grain yield responses approach linearity, and NUE is very low past the inflexion point where little grain yield increases result from increased N fertility. NUE in maize ranges from 50–10% [6,7,8] but field sources of N are not limited to fertilizer input. Field environments may provide up to 185 kg ha−1 of non-fertilizer N [9] with N mineralization and N carryover as sources of non-fertilizer N input. These additional sources of N vary from season to season based on soil temperature and moisture, organic matter, and performance of the previous crop. Precise control of N input in a field environment is difficult and only 50–65% of applied fertilizer is taken up by the plant the same year it is applied [9,10]. Applied N fertilizer can be incorporated into soil organic matter, lost due to ammonia volatility, leached, and lost due to denitrification [11,12,13,14]. Precise control of N in field environments required to develop transgenic improvements in NUE is very difficult and requires controlled environments to complement field experimentation to bridge the gap between what is known biochemically, required to make transgenic modifications, and field performance. Nitrate uptake and assimilation have been studied in controlled environments using the model system, Arabidopsis thaliana (L.) Heynh. [8,15,16], but A. thaliana is a rather poor model for maize both genetically [17] and physiologically. Not only is photosynthetic carbon metabolism different between maize (C4) and A. thaliana (C3) but nitrogen metabolism is dissimilar [18,19].
Recently, Fan et al. [20] showed transgenic expression of a high affinity nitrate transporter significantly improves NUE in rice. It is difficult to conceive that increasing nitrate uptake would have a significant effect on maize, especially under high N fertility, since maize accumulates significant amounts of nitrate under these conditions. As much as 70% of stalk N is nitrate [21]. Cliquet et al. [22] showed that 47% of the N applied after pollination accumulated in the stalk as nitrate. Currently, the main interest in stalk nitrate is in predicting N carryover and overall plant health when soil nitrate is limited by poor fertilization or nitrate leaching [4,23,24] but stalk nitrate is also associated with reduced NUE. Brouder et al. [25] showed that stalk nitrate and agronomic efficiency, defined identically as NUE, were inversely related. Binford et al. [4] showed, using 900 crop years of data, that stalk nitrate is linearly related to grain yield up to the linear regression plateau (LRP) inflection point. This would suggest that accumulation of stalk nitrate is symptomatic of reduced NUE as demonstrated by Varvel et al. [26] and Brouder et al. [25]. Varvel et al. [26] showed stalk nitrate linearly increased with increased N fertility past the LRP inflection point while grain yields were unchanged. With no additional grain yield with increased N fertility, NUE dropped as stalk nitrate dramatically increased. Under normal or high N fertility, maize will concentrate nitrate in the stalk 20–100 times the soil nitrate concentration [24] which would argue that N uptake is not limiting under high N fertility (low NUE).
Linking physiological/biochemical information to relevant field performance is critical in developing transgenic improvements in maize NUE. Though nitrate transporter research is more recent than NA research, NA is likely more relevant in improving NUE in maize. Beevers and Hageman [27] proposed that NRA (in vitro) is the limiting step in N metabolism in plants. Though grain yields in maize can be significantly improved by N fertility, a direct correlation between NRA (in vitro) and grain yield has never been established. Blackmer et al. [28] showed >80% of grain yield was related to spring soil nitrate concentrations. Klepper et al. [29] showed in vivo nitrate reductase activity, NRA (in vivo), or the ability of leaf tissue to generate nitrite from nitrate in the dark, was enhanced by respiratory metabolites. Klepper et al. [29] also demonstrated that NRA (in vitro) could be supported by the addition of glyceraldehyde-3-phosphate and NAD+ to cell free plant extracts suggesting glyceraldehyde-3-phosphate dehydrogenase (GA3PDH—EC 1.2.1.12) the source of NADH for nitrate reduction. Later, Gowri and Campbell [30] showed that NRA (in vitro) and GA3PDH are coincidentally induced by nitrate in etiolated maize. Though extractable levels of GA3PDH are high enough to provide sufficient NADH to support NRA (in vitro) and NRA (in vitro) and GA3PDH are co-induced by nitrate, this is not a proof of in vivo metabolism. Klepper et al. [29] also noted that NRA (in vitro) was 2.5–20 times higher than the rate of NRA (in vivo) which would suggest that extractable NRA (in vitro), per se, is far in excess of what is required to support NA. Also, since extractable levels of GA3PDH are high enough to support NRA (in vitro) it would follow that GA3PDH is in excess of that required to support NA. Later, Neyra and Hageman [31] suggested malate could be a substrate for generating NADH to support NA. Neither Klepper et al. [29] nor Neyra and Hageman [31] were able to demonstrate enhanced NRA (in vivo), by the addition of malate to the NRA (in vivo) assay medium. Rathnam [32] showed NA, measured by the disappearance of nitrate, in spinach protoplast could be supported by the addition of phospho-3-glyceric acid and oxaloacetic acid (OAA) in the light and/or by glyceraldehyde-3-phosphate and malate in either light or dark showing GA3PDH and/or malate dehydrogenase (MDH—EC 1.1.1.37) capable of supporting NA. Similar to the observation made by Klepper et al. [29], Kaiser et al. [33] also observed higher extractable levels of NRA (in vitro) than NRA (in vivo) and concluded that NADH levels, and not NRA (in vitro), limits NA. Later, increased leaf NADH levels were also reported [33] to be associated with NA.
In order to complete the nitrogen assimilation pathway from nitrate to the formation of glutamate, NADH, ATP, reduced ferredoxin, and α-ketoglutarate (αKG) are required. Mitochondrial or cytoplasmic isocitrate dehydrogenase (ICDH—EC 1.1.1.41, EC 1.1.1.42) produce αKG. Reducing the expression of mitochondrial citrate synthase (CS—EC 2.3.3.1) [34] or ICDH [35] in tomato resulted in elevated levels of lamina nitrate. This suggests a direct link between αKG and nitrate reduction. When isocitrate or αKG moves out of the mitochondria, NADH levels drop in the mitochondria and since NADH does not pass through the mitochondrial membrane it cannot be replenished directly. Reestablishing the mitochondrial NADH concentration may be done by importing malate from the cytoplasm. Assuming malate provides significant reduction power for NA the loss of malate from the cytoplasm results in NA becoming limited by low cytoplasmic NADH. Thus, the pathway becomes self-regulated. Cytoplasmic male sterile (CMS) tobacco [36] and CMS cucumber [37] have improved NUE under lower N fertility. These CMS mutants with defective Complex I (NADH dehydrogenase—EC 1.6.5.3) have reduced capacity to oxidize mitochondrial NADH which results in increased mitochondrial NADH concentrations, reducing the need to import malate to balance the mitochondrial NADH levels due to the transport of αKG out of the mitochondria. Based on these observations, Foyer et al. [38] predicted over-expression of ICDH or co-suppression of Complex I would improve NUE. CMS tobacco [36] and CMS cucumber [37] might be examples of improved NUE through diminished Complex I activity but these have associated deleterious attributes (slow growth, male sterility) which makes these agronomically unsuitable. The mutant NCS2 in maize also has defective Complex I and expresses undesirable traits [39] but has not, specifically, been shown to have improved NUE.
In this report, multi-year field experiments of maize grown at different levels of NUE showed reproductive plant parameters are associated with improved NUE under both low and high NUE conditions. The response of these parameters to different forms of N applied at different times of development were used, under controlled environments, to elucidate key physiological factors related to improved NUE. The accumulation of nitrate in lower internodes was investigated between plants grown under high and low NUE conditions and shown to be inversely related to improved NUE. Finally, increasing cytoplasmic NADH using a transgenic co-suppression of Complex I under the control of a tissue preferred promoter increased kernel number plant−1 (KNP) and grain yield under low NUE (high N fertility) conditions. In all, these results suggest that NA limits NUE in maize via reduced availability of cytoplasmic NADH.
2. Materials and Methods
2.1. Field NUE Analyses under Normal and Depleted N Conditions
Field plots depleted of N for a minimum of two years were used in NUE experiments over a period of three years in Johnston, Iowa. Non-depleted plots were plots in previous cropping seasons fertilized with N to obtain maximum economic grain yield of maize. In the depleted plots N treatments consisted of 0, 22, 45, 67 kg ha−1 N applied as urea and in the non-depleted plots N treatments were 0, 34, 67, 101, 135, and 168 kg ha−1 N applied as urea. All N applications were made at V3. The three DuPont-Pioneer hybrids (33K42, 33W84, and 33T56) used in these studies were selected based on a range of yield responses to N fertility when grown under depleted N conditions in multi-environment trials. The experiments were arranged in a split, split plot experimental design with season as the main plot, N fertility as the subplot and cultivar as the sub, subplot. Sampling dates, R1 and maturity (black layer), were blocked as separate experiments to avoid contamination of the maturity sampling by the R1 sampling. Planting density was 75,000 plants ha−1, each plot consisted of two 5.1 m rows spaced 0.75 m apart. There were five replicates of all treatments. Soluble leaf amino acids at V9 was the first parameter measured. At R1 chlorophyll measurements (Minolta SPAD, Minolta Camera Co., Ramsey, NJ, USA) were made by averaging five samplings taken down the ear leaf of 10 plants in each plot. Chlorophyll measurements were made in a similar manner at R2 and R3. At R1 10 plants were sampled from each plot and the ears removed and dried (70 °C, 72 h). Ear shoots of plants sampled for R1 ear measurements were bagged prior to silk emergence to avoid pollination. Ear length, ear width and ear dry weight were determined. Total fresh weight of the remaining chopped plants was measured and vegetative biomass was determined by weighing and drying (70 °C, 72 h) a subsample. Samples were ground and total N determined. At maturity, 10 plants were sampled, the ears removed and dried (70 °C, 72 h). Ear weight, grain weight, and kernel density were determined of the dried ears. Vegetative biomass and total N were determined similarly as at R1. Statistical analysis was performed as previously described [40].
2.2. Field Stalk Nitrate Experiments
The DuPont-Pioneer cultivar 33W84 was grown in field plots in Johnston, IA either fertilized for optimum grain yield (224 kg N ha−1) or in plots depleted for N for at least two years and fertilized with 77 kg N ha−1 immediately after planting. Plants were sampled for stalk nitrate at V11, VT, R1, R2 and R3. Leaves associated with each internode were punched (10, 5 mm diameter) and used for metabolic analysis. Leaves, including leaf sheath, were removed and stalk internodes were numbered and cut at the top of each node, dried (70 °C, 72 h), then ground to a fine powder. When physiological measurements were made, plants were cut at ground level and transported to the laboratory in buckets filled with water.
2.3. Controlled Environment Experiments
A Conviron PGR15 growth chamber set at 30 °C, 60% RH, 16 h light/25 °C, 50% RH, 8 h dark was used to grow the maize model system plant, Gaspe Flint-3 (GF3) (manufacturer, city, state, country) [41] under controlled environmental conditions. A semi-hydroponics irrigation system [41], similar to that described [42], was used in growth chamber and field hydroponics to attain a high level of control of N input. When ammonia was used as an N source 1 mM NH4Cl was substituted for KNO3 but KCl was maintained at 4 mM. GF3 was grown in 1.74 L pots and field hydroponics plants were grown in 15.14 L pots.
2.4. Controlled Environment Plant Samplings
When plants were sampled, the Turface™ (Turface/Profile Products, LLC, Buffalo Grove, IL, USA) was washed off the roots and the plant separated into shoot, roots, leaves, midribs, tassel, tillers, husk, and ear. Plant parts were dried (70 °C, 72 h) but when metabolic profiling was performed, plant parts were frozen in dry ice and lyophilized. Individual plant parts were weighed, ground to a fine powder, and a sample (30–60 mg) weighed for extraction. Fresh tissue was also extracted as leaf punches (10, 5 mm diameter). In either case, duplicate samples were extracted by Genogrinder (SPEX SamplePrep, Metuchen, NJ, USAin 500 µL acid and 500 µL base as described by Queval and Noctor [43]. When NAD+/NADH was quantified a small aliquot of the acid extract was heat-treated for the quantification of NADH and the remaining acid extract was quenched and used for metabolic analysis.
2.5. NAD+/NADH Measurements
The method of Queval and Noctor [43] was used.
2.6. Total Amino Acids
An aliquot of each tissue extract was suspended in a total volume of 100 μL water and 50 μL of a solution containing 350 mM Borate buffer pH 9.5, 1% SDS, 0.5% β-mercaptoethanol (ME), and 200 μg o-phthadialdehyde was added to each well. Blank samples were treated similarly but without o-phthadialdehyde. Fluorescence (Excitation (Ex) 360 nm Emission (Em) 520 nm) was determined immediately and each complete sample was corrected with the respective blank sample. Alanine from 0 to 5 nmole in 0.5 nmole increments, were used as standards.
2.7. Total N
N of ground plant samples was converted to (NO)n equivalents by oxidation using a FlashEA 1112 series combustion analyzer (Thermo Fisher Scientific, Waltham, MA, USA) applying Association of Official Analytical Chemists (AOCS) method Ba 4e-93
2.8. Nitrate Quantification
The method of Miranda et al. [44] was used with slight modification to correct for background anthocyanins that absorb at 540 nm in acid, and for nitrite. An equal volume of 1% sulfanilamide, 0.01% naphthalene ethylene diamine in 2 M H3PO4 was added and optical density at 540 nm (OD540) was determined followed by the addition of a sample volume of saturated VCl2 in 1 M HCl then incubated at 37 °C for 1 h. The OD540 was again measured and the previous absorption readings used to correct for anthocyanin and nitrite after correction for differences in path lengths.
2.9. Malate Quantification
An aliquot was suspended in a total volume of 100 μL with water. 10 μL of 10 mM NADP, 5 mM MgCl2, 1 M Tris-HCl pH 7.5 was added to each well followed by 10 μL containing 0.05 units of malic enzyme (EC 1.1.1.40). Blank plates were prepared in the same fashion but 10 μL of water was added instead of malic enzyme. These were incubated for 1 h at room temperature and fluorescence (Ex 345, Em 460) was measured subtracting the blank from the sample plate. Malate standards from 0 to 5 nmoles, in 0.5 nmole increments, were used.
2.10. In Vivo Nitrate Reductase Activity—NRA (In Vivo)
In vivo nitrate reductase activity was measured similar to the method of Reed and Hageman [45]. Leaf punches (10, 5 mm diameter) were submerged in 400 µL 50 mM KH2PO4-KHPO4 pH 6.0, 300 mM sorbitol, 0.04% Trition X-100 then vacuum infiltrated. A 100 µL aliquot of a 100 mM KNO3, 50 mM KHCO3, 300 mM sorbitol, 50 mM KH2PO4-KHPO4 pH 6.0, 0.04% Trition X-100 solution was added to each tube so the final assay concentration was 300 mM sorbitol, 50 mM KH2PO4-KHPO4 pH 6.0, 0.04% Trition X-100, 20 mM KNO3, and 10 mM KHCO3. Tubes were incubated in the dark at 30 °C and 50 µL aliquots were remove every 30 min for 2 h. The production of nitrite was determined by adding 100 µL of 1% sulfanilamide, 2 M H3PO4, 0.02% naphthalene ethylene diamine, and 50 µL acetonitrile and measuring OD540. The assay was linear for at least 3 h.
2.11. In Vivo Nitrite Reductase Activity—NiRA (In Vivo)
In vivo nitrite reductase activity was measure by the loss of nitrite from the medium. Leaf punches (5, 5 mm diameter) were submerged in 200 µL 50 mM KH2PO4-KHPO4 pH 6.0, 300 mM sorbitol, 0.04% Trition X-100 then vacuum infiltrated. A 50 µL aliquot of a 1 mM KNO2, 50 mM KHCO3, 300 mM sorbitol, 50 mM KH2PO4-KHPO4 pH 6.0, 0.04% Trition X-100 solution was added to each tube so the final assay concentration was 300 mM sorbitol, 50 mM KH2PO4-KHPO4 pH 6.0, 0.04% Trition X-100, 200 µM KNO2, and 10 mM KHCO3. Tubes were incubated at 30 °C under a bank of light emitting diodes of photosynthetic quality (Quantum Devices, Model # SL1515-470-670, manufacturer, Barneveld, WI, USA). Duplicate 10 µL aliquots were removed every 30 min for 2 h and treated with 150 µL of 1% sulfanilamide, 2 M H3PO4, 0.02% naphthalene ethylene diamine, and 50 µL acetonitrile and OD540 determined. The assay was linear for at least 3 h.
2.12. Enzyme (In Vitro) Extraction
Extraction tubes (1.2) mL were filled with 500 µL of a 1% slurry of insoluble polyvinyl polypyrrolidone (PVPP), reduced to dryness by Speedvac (SPD131DDA-115 Thermo Fisher Scientific, Waltham, MA, USA), then stored at room temperature until use. Extraction tubes were filled with 500 µL extraction medium (100 mM Tris-HCl pH 8, 10 mM cysteine, 10 µM leupeptin, 4 °C) and leaf punches (10, 5 mm diameter) were delivered to the tubes. The tubes were arranged in a 96-well plate such that surrounding tubes contained ice and were vacuum infiltrated. Tubes were ground by Genogrinder for 2, 1 min intervals. Plates were centrifuged 4000× g for 20 min at 4 °C and a 200 µL aliquot removed and place on a 2 mL bed of Sephadex G-25 previously equilibrated with 50 mM Tris-HCl pH 7.5 with the void volume removed by a 1 min 500× g centrifugation. Small molecular weight metabolites were removed from the plant extract without dilution by a second low speed centrifugation with the receiving wells containing concentrated cysteine and leupeptin to maintain 10 mM and 10 µM concentrations, respectively.
2.13. Nitrate Reductase Activity (NRA (In Vitro)) EC 1.6.6.1
Cyclic renewal of NADH was used to avoid excess NADH from interfering with color development. The assay was performed in a 20 µL volume in 384-well plates with the following component concentrations: enzyme extract; 100 mM Tris-HCl pH 7.5; 10 mM cysteine; 10 mM KNO3; 20 µM NAD+; 1 mM glucose-6-phosphate; and, 1 unit glucose-6-phosphate dehydrogenase-NAD+ (EC 1.1.1.388). The reaction was started by the addition of enzyme extract and stopped at 30 min intervals by adding two volumes of 1% sulfanilamide, 2 M H3PO4, 0.02% naphthalene ethylene diamine. Activation state of NRA (in vitro) was estimated by including either 5 mM EDTA or 10 mM MgCl2 in the assay. The ratio of MgCl2 to EDTA enzyme activities was used as estimate of the activation state of NRA (in vitro) [46].
Since the concentration of NADH was maintained at 20 µM, inhibition of color development was not statistically (p ≤ 0.05) significant, relative to the inherent variability of the experiments. If there was interference of color development it would be constant across all samples since the concentration of NADH was maintained constant. In an assay development experiment where the concentration of NAD+ was varied 0, 20, 50, 100, and 200 µM in the assay media across a range of nitrite concentrations from 0 to 100 µM, in 10 µM increments, NAD+ (NADH) significantly (p ≤ 0.05) inhibited color development starting at 50 µM NAD+ but the absorption of varying NAD+ concentrations across nitrite concentrations were parallel (equal slopes (p ≤ 0.05)), demonstrating equal levels of inhibition of color development across nitrite concentrations. This would negate the effect of variable leftover concentrations NADH on the assay since color reduction would be equal at the end of the assay irrespective of the intensity of NRA (in vitro). Also, since NAD(P)H inhibits color development by reducing the diazonium salt formed between sulfanilamide and nitrite to a hydrazone such that the azo-compound is not formed, combining sulfanilamide and naphthalene ethylene diamine increases the chance the diazonium salt reacts with the diamine rather than with NAD(P)H. Finally, the assay was further improved by removing small molecular weight molecules including oxaloacetic acid (OAA) which reduces the level of detectable nitrite over time (not shown), presumably by forming an oxime.
2.14. Nitrite Reductase Activity (NiRA (In Vitro)) EC 1.7.7.1
NiRA (in vitro) was assayed in a 200 µL volume containing enzyme extract, 100 mM KH2PO4-KHPO4 pH 6.9, 400 µM KNO2, 10 mM methyl viologen, 30 mM Na2S2O4 and 30 mM KHCO3. The assay was started by addition of Na2S2O4 + KHCO3 and incubated at 30 °C. Aliquots (50 µL) were removed after 0, 10 and 20 min and methyl viologen oxidized by shaking. The loss of nitrite was determined after methyl viologen oxidation by adding 150 µL of 1% sulfanilamide, 2 M H3PO4, 0.02% naphthalene ethylene diamine and 50 µL acetonitrile and determining OD540.
2.15. Phosphoenolpyruvate Carboxylase (PEP Carboxylase) EC 4.1.1.31
PEP carboxylase activity was measured by the loss of NADH coupled to the conversion of OAA, formed, to malate via malate dehydrogenase (EC 1.1.1.37). The extract was diluted 10× with water and 10 µL was used in a 200 µL assay volume which was 25 mM HEPES pH 7.5, 20% ethylene glycol, 5 mM MgCl2, 10 mM KHCO3, 2 mM phosphoenolpyruvate (PEP), 40 μM NADH, and 1 unit malate dehydrogenase (EC 1.1.1.37). Blanks contained water instead of PEP. The reaction was started by the addition of PEP and fluorescence (Ex 345, Em 440) was measure every minute for 10 min. The linear portion of the reduction in fluorescence was used to determine enzyme activity. Removal of OAA from the enzyme extract was crucial to maintain a constant baseline for this assay.
2.16. Malate Enzyme (ME) EC 1.1.1.40
Malate enzyme activity was determined by measuring NADPH formed as a result of malate conversion to pyruvate and HCO3−. The extract was diluted 10× with water and 10 µL was used in a 200 µL assay volume which was 50 mM HEPES pH 7.0, 1 mM NADP+, 5 mM MgCl2 and 2 mM malate. The reaction was started by adding malate; the blanks had water instead of malate. Fluorescence (Ex 345, Em 440) was measured every minute for 10 min. The linear portion of the increase in fluorescence was used to determine enzyme activity.
2.17. Protein
The method of Bradford [47] was used.
2.18. Ear Growth Response to Switching Nitrate Concentrations at Different Stages of Development
The DuPont-Pioneer hybrid, 33W84, was grown in a field semi-hydroponics system previously described. Plants were grown in either 1 or 3 mM KNO3 as the N source and at V0 (control), V3, V6, V9, V12, V15, and V18 (tassel emergence) plants growing in 1 mM KNO3 were switched to 3 mM KNO3 and plants growing in 3 mM KNO3 switched to 1 mM KNO3. Ear shoots were bagged as the shoots emerged to avoid seed set. Plants were sampled at R1 and separated into ear and remaining vegetative plant then dried (70 °C, 72 h). There were 10 replicates of each treatment combination. The experiment was repeated a second season but the concentrations of KNO3 used were 1 and 4 mM KNO3.
2.19. Response to Nitrate and Ammonia Nutrition during Later Stages of Ear Development
The DuPont-Pioneer hybrid, 33W84, was grown in a field semi-hydroponics system and ear dry weight response to ammonia tested for two consecutive growing seasons. In the first season plants were grown in nutrient medium containing 1 and 3 mM KNO3 and converted to 1 mM NH4Cl at V12 and V15 or maintained at 1 and 3 mM KNO3. The plants were treated similarly in the subsequent year, except the 3 mM KNO3 treatments were replaced by 4 mM KNO3 treatments. Ear shoots were bagged as the shoots emerged to avoid seed set. Plants were harvested at R1 and separated into ear and remaining vegetative plant then dried (70 °C, 72 h). There were 10 replicates of each treatment combination.
GF3 was grown semi-hydroponically in either 1 or 2 mM KNO3 as the sole N source. At 23 days after emergence (DAE), plants growing in 1 mM KNO3 fertility were switched to 2 mM KNO3, to 1 mM NH4Cl, or maintained at 1 mM KNO3. Plants growing in 2 mM KNO3 were switched to 1 mM KNO3, to 1 mM NH4Cl, or maintained at 2 mM KNO3. At 30 DAE (R1) plants were separated into ears and remaining plant biomass then dried by lyophilization. Ear weight, remaining plant biomass, and total N were determined.
GF3 was grown semi-hydroponically under controlled environment in 1 mM KNO3 up to 22 DAE and the plants were switched to 1 mM NH4Cl, 10 mM KNO3, or maintained at 1 mM KNO3. Ear and plant biomass was determined of all treatments at 23, 25, and 27 DAE along with total N.
2.20. Vector Construction, Plant Transformation and Transgene Expression Analysis
A 230-base pair (bp) fragment of maize NADH ubiquinone oxidoreductase (GRMZM2G024484) including the 5’-untranslated region (UTR) and part of the coding sequence was PCR-cloned to make an RNAi construct. An intron from ST-LS1 was added between the two inverted repeats of NADH ubiquinone oxidoreductase. Maize PEP carboxylase gene promoter and sorghum actin gene terminator were used to silence NADH ubiquinone oxidoreductase in mesophyll cells. This cassette was linked to LTP2:DS-RED2:PIN II TERM as a seed marker for transgenic seed as described [48]. The vector construction and maize transformation were carried out as described previously [48,49]. Multiple lines were generated. Single-copy T-DNA integration lines that expressed the transgene were selected for advancement to greenhouse or field test.
2.21. NADH-Ubiquinone Oxidoreductase 51 kDa Subunit (Complex I) Expression
RNA was isolated using a Qiagen RNeasy kit followed by Invitrogen Turbo DNA free kit to remove contaminating DNA. Transcript quantification was performed using Biorad’s iTaq™ Universal One-Step RT-qPCR (Bio-Rad, Hercules, CA. USA) on a Biorad CFX96 Touch Real-Time PCR Detection System (Bio-Rad, Hercules, CA. USA). NADH-ubiquinone oxidoreductase 51 kDa subunit (Complex I) was quantified using the forward primer CAACTCTGGAACCAAGCTCTAT and the reverse primer GAGCAACTCCTTCAGAGGTATG. Transcriptional corepressor LEUNIG was used as a reference using CATCGACACCTTCCACTCATAC as the forward and TCCGTCAGAGCCAAACATTAC as the reverse primer.
2.22. Multi-Location Field Yield Trails
Transgenic Complex I RNAi events and the corresponding null were tested in 5 locations managed for optimal grain yields with four replicates at Johnston IA, Woodland CA, Plainview TX, and Corning AR, and three replicates in Garden City, KS. The field trial and statistical analysis were conducted as described previously [48]. Grain yield was calculated and adjusted to a standard moisture of 155 g kg−1. Yield was predicted using Best Linear Unbiased Predictor (BLUP).
3. Results
3.1. Field NUE Analyses under Normal and Depleted N Conditions
During the 2009–2010 growing seasons, experiments were conducted to identify yield parameters responsive to N input and those that were also related to grain yield under conditions of high and low N fertility. These experiments were conducted in fields with corn on corn cropping systems with normal N inputs and in fields depleted of N for at least two years at the start of the experiment. There were significant (F ≤ 0.1) effects of experimental year and significant (F ≤ 0.05) effects of N fertility on grain yield but there were no significant (F ≤ 0.1) effects of cultivar and no significant interactions of experimental year × cultivar, experimental year × N fertility, or cultivar × N fertility, so means were pooled across experimental years and cultivars. Grain yields were linearly related to N fertility in both years under both low N fertility (depleted N) and high N fertility (non-depleted N) ranges. Since grain yields were linearly related to N fertility, NUE was constant in both environments but NUE was 52% efficient (15.132 kg ha−1 kg N−1) in the low N fertility range and 23% efficient (4.764 kg ha−1 kg N−1) in the high N fertility range. Response parameters measured are shown in Table 1. Leaf total amino acid-V9 was very responsive to N fertility under both low and high ranges of N fertility. However, the relationship to grain yield was much greater under low N range than under high N range (Table 1). R1 biomass was not responsive to N fertility in either low or high N ranges, but R1 biomass was highly related to grain yield in the high N range. Total vegetative N at R1 was responsive to N fertility in the high N range and moderately related to grain yield. Ear length and ear-weight at R1, but not ear-width, were responsive to N and were highly correlated to grain yield in both high and low N ranges. SPAD chlorophyll measured at R1, R2, and R3 all responded to N fertility under both high and low N ranges, but the relationship to grain yield in the high N range was poor. Mature biomass was very responsive to N fertility in the low N range and poorly responsive in the high N range. Plant total N at maturity was non-responsive to N fertility and poorly correlated to grain yield. Ear-weight, KNP, and grain total N were all highly responsive to N fertility and closely related to grain yield under both N fertility ranges. Kernel weight was moderately responsive to N fertility in the high N range but slightly negatively responsive to N fertility in the low N range. Kernel weight was highly correlated to grain yield in the high N fertility range but poorly related to grain yield in the lower N fertility range.
3.2. Stalk Nitrate
Nitrate accumulates in maize lower stalk internodes as early as V11 (11th fully expanded leaf) in high N fertilized plots but little detectable nitrate was found in stalks of plants grown under low N fertility (Figure 1). V11 was the earliest all of the stalk internodes could be sampled and stalk nitrate was maximum at R3 but not significantly different (p ≤ 0.1) between sampling dates.
Though generally low, lamina nitrate levels were not different irrespective of N fertility (Table 2). Lower leaves accumulated malate (Table 2) in both high and low N fertility grown plants at all sampling dates from V11 to R3. Lower leaves had less capacity to assimilate nitrate (NRA (in vivo)), (Figure 2) but nitrite assimilation (NiRA (in vivo)) was not significantly different in any leaf. Plants grown in lower N fertility also showed this response in lower leaves but the overall NRA (in vivo) and NiRA (in vivo) capacities were reduced by 70% (not shown) diminishing the ability to make statistically significant (p ≤ 0.1) inferences. The extractable levels of enzymes followed the same pattern from lower to upper leaves with extractable nitrate reductase activity (NRA (in vitro)—EC 1.6.6.1) significantly less in the lower leaves whereas nitrite reductase activity (NiRA (in vitro)—EC 1.7.7.1) was not different (Figure 3). The ratio of NRA (in vitro) (MgCl2) to NRA (in vitro) (EDTA) showed no signs of change in NRA (in vitro) activation [46]. The data presented is the NRA (in vitro) with EDTA in the assay medium, or maximum in vitro activity. Interestingly, the extractable PEP-carboxylase (EC 4.1.1.31) activity showed the same pattern as NRA (in vitro) with lower activity in lower leaves whereas malic enzyme (EC 1.1.1.40) activity was not different in lower verses upper leaves similarly as NiRA (in vitro) (Figure 3).
3.3. Ear Dry Weight Response to Switching Nitrate Concentrations
In these experiments what effect reducing or increasing nitrate concentration has on R1 ear-weight was investigated. These experiments were conducted during two sequential growing seasons. The first season plants were grown in either 1 mM KNO3 as insufficient levels of N fertility and at specific developmental stages switched to 3 mM KNO3, considered a luxurious level of N fertility, for the remaining time. Concurrently, plants grown in 3 mM KNO3 were switched to 1 mM KNO3 and the effect of reducing nitrate for the remaining time had on R1 ear-weight was determined. In the second year the higher KNO3 concentration was switched from 3 mM to 4 mM KNO3. The results were similar for both years so means were summed across years. In Figure 4 plants switched at V0 (planting) would be considered controls; maintained at either 1 or 3–4 mM KNO3 the entire time. Predictably, reducing nitrate levels at V3 (switching from 3–4 mM KNO3 to 1 mM KNO3) resulted in significant loss in R1 ear-weight. Likewise, increasing nitrate levels at V3 (switching from 1 mM KNO3 to 3–4 mM KNO3) improved R1 ear-weight but R1 ear-weight could not be completely restored when switched at V3. Recovery of R1 ear-weight was much less when nitrate levels were increased at V6 (switching from 1 mM KNO3 to 3–4 mM KNO3) and reducing nitrate at V6 (switching from 3–4 mM KNO3 to 1 mM KNO3) was much less effective on reducing R1 ear-weight. Switching at V12, or later, had very little effect on R1 ear-weight, neither increasing (switching from 1 mM KNO3 to 3–4 mM KNO3) nor decreasing (switching from 3–4 mM KNO3 to 1 mM KNO3) nitrate levels.
3.4. The Effect of Ammonia on Ear Development
Though R1 ear-weight could not be changed by increasing or decreasing nitrate levels after V12, ammonia (1 mM) could significantly change R1 ear-weight as late as V15. These experiments were conducted during sequential growing years. In the first year, plants were grown in either 1 or 3 mM KNO3 as the insufficient and sufficient N levels, respectively, and in the second year, the 3 mM KNO3 treatment was replaced with 4 mM KNO3. There was no significant effect of year so the years were combined in analysis. Switching to 1 mM NH4Cl significantly increased the ear number at both starting nitrate concentrations (Table 3). There was a significant effect of ammonia on R1 ear-weight when 3–4 mM KNO3 grown plants were switched to 1 mM NH4Cl (Table 3) at V12–V15, stages when nitrate was ineffective in influencing R1 ear-weight. There was no significant effect of NH4Cl on vegetative biomass.
Subsequent experiments were performed with Gaspe Flint-3 (GF3) under controlled environmental conditions. In these experiments, switching from insufficient levels of nitrate to sufficient levels of nitrate, and vice-versa, showed a similar R1 ear-weight response (data not shown) as the full season hybrids. GF3 R1 ear-weight was not responsive to changes in nitrate levels 20 days after emergence (DAE), or later. R1 in GF3 occurs from 29–31 DAE so, as in the case of a full season hybrids, GF3 R1 ear-weight was unresponsive to changes in nitrate for a significant amount of time prior to R1, or approximately for the last third of the time required to reach R1. Switching GF3 plants grown on either 1 or 2 mM KNO3 to 2 or 1 mM KNO3, respectively, had no significant effect on ear dry weight, vegetative biomass or total vegetative biomass (Table 4) compared to plants maintained at 1 or 2 mM KNO3 the entire time. Switching to 1 mM NH4Cl from both nitrate sources significantly increased ear dry weight and ear total N. There were some non-significant (F ≤ 0.1) reductions in biomass in plants switched to 1 mM NH4Cl but there were no significant effects of NH4Cl on vegetative N.
In companion experiments, GF3 was grown in 1 mM KNO3 and at 22 DAE were either maintained in 1 mM KNO3, switched to 1 mM NH4Cl, or switched to 10 mM KNO3. Switching to ammonia (1 mM) doubled the rate of ear growth within 24 h. Nitrate concentration of 10 mM nitrate was much less affective (Table 5).
3.5. Total-N, Nitrate-N, and Organic-N Accumulation
Nitrogen balance experiments, both quantitatively and qualitatively, in response to nitrate fertility were conducted using GF3 under controlled environment. These experiments would be very difficult to conduct under field conditions, especially, since root:shoot ratios drop with increased N fertility [50] and access to the entire plant is required to quantify whole plant N levels. As in full season maize cultivars, N fertility of 2 mM KNO3 is sufficient to support R1 ear-weight in GF3 [43]. Above 2 mM KNO3 no further increase in R1 ear-weight can be observed so N fertilities of 3 and 4 mM KNO3 would be considered more than sufficient. This range of N fertility was shown to accumulate nitrate in lower leaf midribs and stalk internodes especially when KNO3 was provided in excess. NRA (in vitro) increases linearly with increased nitrate fertility (Figure 5), whereas NRA (in vivo) does not change above 2 mM KNO3 fertility (Figure 5). When the accumulation of total plant N is compared to increasing N fertility, organic-N accumulation is not significantly (F ≤ 0.1) increased from 2 mM KNO3 or above, similarly as NRA (in vivo). With increased N fertility, the proportion of the total plant N that is nitrate increases (Figure 6). Though there is a numeric difference in organic-N between 2 and 3 mM KNO3 grown plants, organic-N levels were not significantly changed with increased N fertility.
3.6. Transgenic Co-Suppression of NADH-Ubiquinone Oxidoreductase 51 kDa Subunit (Complex I)
Eight events of NADH-ubiquinone oxidoreductase 51 kDa subunit co-suppression driven by PEP-carboxylase promoter were generated and yield tested in multi-location environments managed for maximum yields (high N fertility). Only one event had a statistically significant (p < 0.1) grain yield increase of 230.37 kg ha−1 across all locations (Table 6), relative to the null hybrid. The positive event was selected for a second-year grain yield test along with physiological/biochemical evaluation. In the second-year field evaluation the positive event showed significant improvements in grain yield that was primarily associated with increased KNP (Table 7). The positive event had significantly lower levels of leaf NADH-ubiquinone oxidoreductase 51 kDa subunit (Complex I) expression, greater extractable NADH, higher NRA (in vivo) but no difference in extractable NRA (in vitro) (Table 7). Complex I expression in root, a non-targeted tissue, was not different between transgene and non-transgene. Though the statistic cannot be used to determine a null effect, since non-significance may be due to higher variability, the numeric difference between transgenic and non-transgenic root expression was small suggesting selective co-suppression of Complex I.
4. Discussion
4.1. Field NUE Analyses under Normal and Depleted N Conditions
Improving NUE under low N fertility is very difficult due to the inherently high NUE under these conditions and the unwillingness of farmers to accept lower grain yields in order to attain higher NUE. Identification of parameters associated with N input, especially under conditions of low NUE (high N fertility), is highly desirable for identifying plant parameters that might lead to increased NUE and higher grain yields. Useful parameters for study are those parameters that respond to N input that are also highly correlated to changes in grain yield. R1-biomass was closely related to grain yield but poorly responsive to N fertility (Table 1) which might suggest R1-biomass and grain yield are related but R1-biomass may not necessarily be vectored by N input. Pearson and Jacobs [51] found no relationship between plant biomass at anthesis and KNP. Andrade et al. [52] and Paponov et al. [53] proposed increase in KNP was associated with plant growth rate around anthesis. Ciampitti et al. [54] observed a similar relationship between biomass and grain yield, though no direct correlation with N fertility was made. Loussaert et al. [41] showed the developing ear competes for N with the developing tassel, with the tassel having priority; increased R1 ear-weight in male sterile plants was independent of R1-biomass but associated with reduced tassel biomass. Ear length and ear-weight at R1, but not ear-width, were responsive to N and were highly correlated to grain yield in both high and low N ranges. Lemcoff and Loomis [55] showed the effect of N deprivation, verses population stress, was on KNP and not on kernel abortion suggesting the effect of N fertility is primarily on ear development. Poor SPAD chlorophyll relationship to grain yield in high N fertility make these measurements less useful since improvements in NUE are more desirable in high N fertilities. These are similar to results obtained by Blackmer and Schepers [56], in that SPAD measurements were not related to grain yield at higher N fertilities. Grain total N and ear weight would be expected to be highly related to grain yield since ear weight is nearly identical to grain yield and, since there were no significant differences in grain %N, grain total N would also be nearly identical to grain yield. KNP has been routinely associated with improved grain yield in maize [3,51,52,53] and these data (Table 1) show KNP is highly responsive to N fertility. Somewhat surprising was the effect of N fertility on kernel weight. In the low N range, KNP was reduced such that kernel weight compensated for poor seed set by making larger kernels under conditions which also produced lower grain yields resulting in a negative relationship between kernel weight and grain yield at lower N fertility. Though kernel weight was only moderately responsive to N fertility in the high N range, kernel weight was highly correlated to grain yield in the high N range but not in the lower N range. N fertility, especially in the high N range where NUE is lower, affects ear development that can have a lasting effect on increased KNP. Pearson and Jacobs [51] showed that N fertility manipulations during ear development had a lasting effect on KNP. Kernel weight seems only to be a factor in the higher N fertility when KNP has been optimized and added N may have an effect on increasing kernel weight. Biomass, measured at R1 or maturity, especially in the higher N range, was poorly responsive to N input.
These data would suggest that the prime effect of N under higher N fertility (low NUE) is on reproductive development since under higher N fertility, biomass was not affected by N fertility and SPAD was poorly associated with grain yield. N fertility increases KNP under higher N fertility and this is manifested at R1 by longer, more massive ears. R1 ear-weight, R1 ear-length, KNP, and kernel density are parameters responsive to N fertility and related to grain yield, especially under higher N fertility (low NUE). Ear-weight at R1 is particularly useful since it is a reproductive trait that can be determined early during plant development.
4.2. Stalk Nitrate Accumulation
Another important difference between plants grown under N deficient and N sufficient conditions is the accumulation of nitrate in the lower stalk internodes (Figure 1). Warner and Huffaker [57] and later Espen et al. [58] showed nitrate uptake is not dependent upon NA, so reduction in NRA (in vivo) would have little effect on the uptake of nitrate, but with NRA (in vivo) reduced in the lower leaves (Figure 2), nitrate would accumulate in the lower stalk internodes. Reduced NRA (in vivo) in the lower leaves could be explained by reduced NRA (in vitro) (Figure 3). Maize, being a C4 plant, generates OAA via PEP-carboxylase which is reduced to malate and transported to bundle sheath cells where CO2 is concentrated. Reduced OAA production and thus reduced malate would be expected with reduced PEP-carboxylase activity in lower leaves (Figure 3). No change in malic enzyme activity between leaves coupled to reduced PEP-carboxylate activity in the lower leaves should result in lower malate levels in the lower leaves unless some other mechanism is responsible for increased malate in lower leaves. If malate is a main source of cytoplasmic NADH supporting NA [31,32], reduced NA capacity might be partially responsible for malate accumulation in lower leaves (Table 2). Thus, accumulation of malate in the lower leaves may be due to reduced NA resulting in the accumulation of reductant, malate.
4.3. Ear Dry Weight Response to Nitrate and Ammonia
Soil nitrate concentration sampled when plants are 20–30 cm tall has been shown to be related to maize grain yield [28] and the pre-sidedress nitrate test (PSNT—[59]) is a soil test used to determine whether supplemental N fertilizer is required. According to the PSNT, soil nitrate concentrations greater than 25 mg N L−1 (1.78 mM) require no supplemental N fertility, suggesting this level of soil nitrate is sufficient for optimum economic maize yield. R1 ear-weight response to nitrate concentrations from 1 to 4 mM KNO3 is consistent with the PSNT with 1 mM KNO3 being insufficient to support R1 ear-weight whereas 2 mM KNO3 is sufficient and 3 mM KNO3, and above, being luxurious levels of fertilizer N [41]. In the results shown in Figure 4, R1 ear-weight was established by V12 and increasing or decreasing KNO3 levels from V12, on, had little effect on R1 ear-weight. This is consistent with Binder et al. [60] who showed delaying side dressing N till V6 resulted in 12% yield decreases. da Silva et al. [61] showed that grain yields could be increased by N side dressing at silking only when sufficient N was applied during vegetative development. In the studies of da Silval et al. [61] NUE of vegetative N application was twice that of N applied at silking and the main yield component improved by N applied at silking was kernel weight not KNP. R1 ear-weight is largely established by V12 and only moderate changes in R1 ear-weight can be obtained by changes in nitrate fertility after V12.
Unlike nitrate applications, moderate levels of ammonia improve ear development applied at a time (V12–V15) when much higher levels of nitrate are ineffective (Table 3). Ammonia improves ear development of plants grown in insufficient (1 mM) levels of nitrate but is even more efficacious in improving R1 ear-weight of plants grown in sufficient (3–4 mM) levels of nitrate (Table 3). R1 ear-weight improvements induced by ammonia were not due to biomass increases since no change in biomass was observed (Table 3). In controlled experiments with GF3, switching N fertility from nitrate to 1 mM NH4Cl at a time when higher concentrations of nitrate are ineffective (23DAE) increases R1 ear-weight and ear total N without significantly changing vegetative biomass (Table 4). Changes in R1 ear-weight appear to be due to an increase in ear growth rate in response to ammonia (Table 5) with a doubling of the ear dry weight within 24 h of ammonia application. Ten times the concentration of nitrate is not as effective as ammonia at this developmental stage. These results suggest that NA, the conversion of nitrate to ammonia, limits R1 ear-weight and NUE in maize. These data show that bypassing NA by supplying ammonia rescues ear development when nitrate is ineffective. If R1 ear-weight is predictive of improved NUE then improvements in R1 ear-weight by by-passing NA would suggest NA limits NUE in maize.
Few studies have shown differential effects of ammonia, versus nitrate, on ear development. Jung et al. [62] showed that supplemental application of urea or NH4NO3 was much more efficacious than KNO3 when applied 5 to 8 weeks after emergence. KNO3 applications after 8 weeks were ineffective. Though the developmental stage was not specified in these experiments, a 5–8 week after emergence time frame would be roughly from V8–V15. Pan et al. [63] showed that urea fertilization fortified with a nitrification inhibitor produced more ears than comparable nitrate fertilities. Below and Gentry [64] showed that maize produced more kernels ear−1 and more grain yield when supplied with a mixture of nitrate and ammonium than when supplied nitrate alone. Smiciklas and Below [65] showed improved grain yield and increased kernels ear−1 were associated with a mixture of ammonia and nitrate verses nitrate alone but related the effect to cytokinin balance. Yasir et al. [66] showed foliar feeding of urea was most effective in improving grain yield, KNP and stover biomass when applied at V12. All of these observations are in agreement with ammonia induced increase in ear growth rate shown in these experiments (Table 3, Table 4 and Table 5). These results, combined with the observations that maize accumulates nitrate in the stalk under higher N fertilities, Figure 1, [4,23,24], would suggest NA limits ear development since stalk nitrate accumulation at high N fertility would suggest nitrate uptake is not limiting and by-passing NA by providing ammonia stimulates R1 ear-weight, raising NUE. This inference is different from those of Chen et al. [67] and Fan et al. [20] who showed transgenic expression of high affinity nitrate transporters in rice significantly improved grain yield and NUE in rice, implying the results are due to improved nitrate uptake. It is not surprising that maize and rice have different mechanisms limiting NUE since maize is a C4 plant and rice is a C3 plant; rice can grow submerged in water and maize cannot. In the field experiments of Fan et al. [20] rice was grown submerged in water, as is the custom for rice, and fertilized with urea [20]. Under these conditions, the main source of N would be ammonia [68]. Fan et al. [20] showed that when 15N was supplied as Ca(15NO3)2 transgenic rice expressing OsNrt2.1 had significantly higher rates of 15N uptake but when 15N was supplied as NH415NO3 there was a significant reduction in 15N uptake in transgenic plants compared to controls. When 15NH4NO3 was used as a substrate not only was the background 15N uptake rate 10–20× higher than when NH415NO3 was supplied but there was significantly more 15N taken up by the transgenic plants. The rate of 15N uptake when 15NH415NO3 was used as a substrate was not significantly different from 15N uptake from the 15NH4NO3 treatment suggesting the effect of the transgene was on the uptake of ammonia, not nitrate. This would make our current inference of NA limiting NUE in congruence with those of Chen et al. [67] and Fan et al. [20] since improved ammonia uptake would bypass NA, the limiting step, resulting in improved NUE.
4.4. Total N, Organic-N, Nitrate-N, and NA
When GF3 was provided a range of fertilities that spans the range of insufficient to greater than sufficient levels of nitrate, NRA (in vitro) increased linearly with increased nitrate fertility, whereas NRA (in vivo) leveled off at the point in which nitrate fertility reached sufficiency to support R1 ear-weight (Figure 5). Organic-N accumulation mirrored NRA (in vivo) reaching maximum organic-N at 2 mm nitrate fertility (Figure 6). These results show that uptake of nitrate, the predominant form of N in aerobic soils, nor the extractable level of NRA (in vitro) do not limit NUE but the conversion of nitrate-N to organic-N (ammonia) limits NUE, especially, under conditions of high N fertility. Ciampitti et al. [54] concluded NUE in maize is limited by N uptake. The methodology used by Ciampitti et al. [54] was not capable of distinguishing between nitrate-N and organic-N which could significantly bias any inference made. Uncoupling of NRA (in vitro) with NRA (in vivo) (Figure 5) has been previously shown by Klepper et al. [29] and again by Kaiser et al. [33]. NRA (in vitro) does not reflect NA and is in excess of that required for NA which might suggest some other factor other than NRA (in vitro) limits NA. The increase in total N was primarily due to an increase in nitrate-N at higher N fertilities with 30% of the total plant N of plants grown in 4 M KNO3 being nitrate (Figure 6). With both nitrate and NRA (in vitro) in excess under high nitrate fertility and NiR (in vivo) not limiting (Figure 2), the only other factor affecting NA would be the availability of reductant, NADH, to drive NA. The availability of cytoplasmic NADH as the limiting step in NA as proposed [33,36,38] would be a logical alternative.
4.5. Transgenic NADH-Ubiquinone Oxidoreductase 51 kDa Subunit (Complex I) Co-Suppression
NA is a complex biochemical process both supported and inhibited by respiratory metabolism [38]. The tricarboxylic acid cycle contributes αKG for NA but in the process robs the tricarboxylic acid cycle’s ability to generate NADH within the mitochondria, resulting in lower mitochondrial NADH concentrations. NA may become self-regulated when mitochondrial NADH levels are restored by absorbing cytoplasmic malate which lowers the level of reductant available to generate NADH for nitrate reduction. Tobacco [36] and cucumber [37] have cytoplasmic mutants deficient in mitochondrial NADH dehydrogenase (Complex I) which inhibits the oxidation of NADH, artificially increasing the concentration of NADH inside the mitochondria. These mutants have improved capacity to utilize nitrate, but because the trait is constitutively expressed, also have undesirable traits associated with reduced capacity to generate reduction power in non-photosynthetic tissues. NCS2, a Complex I mutant in maize, has striped leaves, reduced growth rate and other deleterious traits [39]. A constitutive co-suppression of Complex I would likely be similarly compromised. Since NA occurs exclusively in the mesophyll cells in maize leaves, selective Complex I co-suppression in the mesophyll cells might minimize deleterious effects not related to NA. Also, since mitochondrial respiration shifts toward providing carbon skeletons for NA in the light when nitrate is the N source [69], generation of leaf mitochondrial energy might not be important in the light. The promoter of PEP-carboxylase, preferentially expressed in the mesophyll cells [70], was selected to drive Complex I co-suppression with the aim to maximize the expression of Complex I co-suppression in mesophyll cells while minimizing non-targeted effects.
One transgenic event showed positive grain yield responses when maintained in high N fertility (low NUE) in two years, one year in a multi-environment experiment (Table 6 and Table 7). In the second-year field evaluation, the positive event showed significant improvements in grain yield that was primarily associated with increased KNP (Table 7). The positive event had significantly lower levels of leaf NADH-ubiquinone oxidoreductase 51 kDa subunit (Complex I) expression, greater extractable NADH, higher NRA (in vivo) but no difference in extractable NRA (in vitro) (Table 7). NADH-ubiquinone oxidoreductase 51 kDa subunit (Complex I) expression in root, a non-targeted tissue, was not different between transgene and non-transgene. These results are expected if NA is limited by NADH rather than by NRA (in vitro). Since the transgenic hybrid showed higher NADH levels associated with improved NRA (in vivo) without increase in NRA (in vitro) it would follow that increases in KNP associated with increased grain yields under high N fertility could have been brokered by improved NA during ear development. It may be suggested that increased reductant (NADH) limits NA, which limits NUE. A disturbing issue is the low frequency of positive events. The difference in transgene and non-transgene expression of NADH-ubiquinone oxidoreductase 51 kDa subunit (Complex I) was greater with plant maturity, with the greatest difference in leaf expression at R2. This is similar to PEP-carboxylase expression shown by Cho et al. [70], increasing with plant maturity with maximum expression at R3. The PEP-carboxylase promoter may be sufficiently tissue specific but not have sufficient strength to drive gene co-suppression during the critical time of ear development between V9–V15. If maximum expression of the promoter gene (PEP-carboxylase) is R2-R3 [70] not all of the transgene events may have had sufficient expression levels from V9–V15 when ear development would require maximum NADH to support NA. These data demonstrate the potential of increasing leaf NADH levels to improve maize NUE.
5. Conclusions
R1 ear-weight is a good estimate of maize NUE under both high N fertility (low NUE) and low N fertility (high NUE) conditions. The assimilation of nitrate to ammonia limits ear development and NUE in maize. This is concluded by observation that nitrate cannot rescue ear development at later stages of reproductive growth but ammonia can. Nitrate uptake is not limiting under high N fertility and accumulates in the stalk to much higher concentrations than soil nitrate concentrations. Stalk nitrate accumulation is associated with reduced leaf NRA (in vivo) and increased leaf malate concentrations. At higher nitrate fertilities, NRA (in vitro) increases linearly but NRA (in vivo) levels off at higher nitrate fertilities. Organic-N follows NRA (in vivo), not NRA (in vitro) with increasing nitrate fertility, with the bulk of increased total-N due to nitrate accumulation at higher nitrate fertilities. Improved NUE in maize is associated with improved NA which may be brokered by increased NADH levels available for nitrate reduction.
Author Contributions
Conceptualization, D.L., N.M.; Methodology, D.L.; Validation, B.S.; Investigation, N.M., J.C., D.P.O.; Writing-Original Draft Preparation, D.L.; Writing-Review & Editing, D.L.; Funding Acquisition, B.S.
Funding
This research received no external funding.
Acknowledgments
David Sevenich for total N analyses. Renee Lafitte for supervising the multi-environment field yield trial.
Conflicts of Interest
The authors declare no conflict of interest.
References
- Uriberlarrea, M.; Moose, S.P.; Below, F.E. Divergent selection for grain protein affects nitrogen use in maize hybrids. Field Crops Res. 2007, 100, 82–90. [Google Scholar] [CrossRef]
- Ciampitti, I.A.; Vyn, T.J. A comprehensive study of plant density consequences on nitrogen uptake dynamics of maize plants from vegetative to reproductive stages. Field Crops Res. 2011, 12, 2–18. [Google Scholar] [CrossRef]
- Uhart, S.A.; Andrade, F.H. Nitrogen Deficiency in Maize: II. Carbon-Nitrogen Interaction Effects on Kernel Number and Grain Yield. Crop Sci. 1995, 35, 1384–1389. [Google Scholar] [CrossRef]
- Binford, G.D.; Blackmer, A.M.; El-Hout, N.M. Tissue Test for Excess Nitrogen during Corn Production. Agron. J. 1990, 82, 124–129. [Google Scholar] [CrossRef]
- Rutto, E.; Bossenkemper, J.P.; Kelly, J.; Chim, B.K.; Raun, W.R. Maize grain yield response to the distance nitrogen is placed away from the row. Exp. Agric. 2013, 49, 3–18. [Google Scholar] [CrossRef]
- Raun, W.R.; Johnson, G.V. Improving nitrogen use efficiency for cereal production. Agron. J. 1999, 91, 357–363. [Google Scholar] [CrossRef]
- Xu, G.; Fan, X.; Miller, A.J. Plant nitrogen assimilation and use efficiency. Annu. Rev. Plant Biol. 2012, 63, 153–182. [Google Scholar] [CrossRef] [PubMed]
- McAllister, C.H.; Beatty, P.H.; Good, A.G. Engineering nitrogen use efficiency crop plants: The current status. Plant Biotechnol. J. 2012, 10, 1011–1025. [Google Scholar] [CrossRef] [PubMed]
- Sawyer, J.; Nafziger, E.; Randall, G.; Bundy, L.; Rehm, G.; Joern, B. Concepts and Rational for Regional Nitrogen Rate Guidelines for Corn. Iowa State University Extension: Ames, IA, USA, 2006. Available online: http://publications.iowa.gov/id/eprint/3847 (accessed on 2 June 2010).
- Kohl, D.H.; Shearer, G.B.; Commoner, B. Variation of 15N in Corn and Soil Following Application of Fertilizer Nitrogen. Soil Sci. Soc. Am. J. 1973, 37, 888–892. [Google Scholar] [CrossRef]
- Sogbedji, J.M.; van Es, H.M.; Yang, C.L.; Geohring, L.D.; Magdoff, F.R. Nitrate Leaching and Nitrogen Budget as Affected by Maize Nitrogen Rate and Soil Type. J. Environ. Qual. 2000, 29, 1813–1820. [Google Scholar] [CrossRef]
- Nelson, K.A.; Scharf, P.C.; Stevens, W.E.; Burdick, B.A. Rescue Nitrogen Applications for Corn. Soil Sci. Soc. Am. J. 2010, 75, 143–151. [Google Scholar] [CrossRef]
- Wang, Z.-H.; Liu, X.-J.; Ju, X.-T.; Zhang, F.-S.; Malhi, S.S. Ammonia Volatilization Loss from Surface-Broadcast Urea: Comparison of Vented- and Closed-Chamber Methods and Loss in Winter Wheat–Summer Maize Rotation in North China Plain. Commun. Soil Sci. Plant Anal. 2011, 35, 2917–2939. [Google Scholar] [CrossRef]
- Pelstera, D.E.; Larouche, F.; Rochette, P. Nitrogen fertilization but not soil tillage affects nitrous oxide emissions from a clay loam soil under a maize–soybean rotation. Soil Tillage Res. 2011, 115–116, 16–26. [Google Scholar] [CrossRef]
- Good, A.G.; Shrawat, A.K.; Muench, D.G. Can less yield more? Is reducing nutrient input into the environment compatible with maintaining crop production? Trends Plant Sci. 2004, 9, 597–605. [Google Scholar] [CrossRef] [PubMed]
- Kant, S.; Bi, Y.-M.; Rothstein, S.J. Understanding plant response to nitrogen limitation for the improvement of crop nitrogen use efficiency. J Exp. Bot. 2011, 62, 1499–1509. [Google Scholar] [CrossRef] [PubMed]
- Brendel, V.; Kurtz, S.; Walbot, V. Comparative genomics of Arabidopsis and maize: Prospects and limitations. Genome Biol. 2002, 3. [Google Scholar] [CrossRef]
- Basra, A.S.; Dhawan, A.K.; Goyal, S.S. DCMU inhibits in vivo nitrate reduction in illuminated barley (C3) leaves but not in maize (C4): A new mechanism for the role of light? Planta 2002, 215, 855–861. [Google Scholar] [CrossRef] [PubMed]
- Bloom, A.J.; Burger, M.; Asensio, J.S.R.; Cousins, A.B. Carbon Dioxide Enrichment Inhibits Nitrate Assimilation in Wheat and Arabidopsis. Science 2010, 328, 899–903. [Google Scholar] [CrossRef] [PubMed]
- Fan, X.; Tang, Z.; Tan, Y.; Zhang, Y.; Luo, B.; Yang, M.; Lian, X.; Shen, Q.; Miller, A.J.; Xu, G. Overexpression of a pH-sensitive nitrate transporter in rice increases crop yields. Proc. Natl. Acad. Sci. USA 2017, 113, 7118–7123. [Google Scholar] [CrossRef] [PubMed]
- Rizzi, E.; Balconi, B.C.; Manusardi, C.; Gentinetta, E.; Motto, M. Genetic variation for traits relating to nitrogen content of maize stalks. Euphytica 1991, 52, 91–98. [Google Scholar]
- Cliquet, J.-B.; Deléens, E.; Bousser, A.; Martin, M.; Lescure, J.-C.; Prioul, J.-L.; Mariotti, A.; Morot-Gaudry, J.-F. Estimation of Carbon and Nitrogen Allocation during Stalk Elongation by 13C and 15N Tracing in Zea mays L. Plant Physiol. 1990, 92, 79–87. [Google Scholar] [CrossRef] [PubMed]
- Binford, G.D.; Blackmer, A.M.; Meese, E.G. Optimal Concentrations of Nitrate in Cornstalks at Maturity. Agron. J. 1992, 84, 881–887. [Google Scholar] [CrossRef]
- Sawyer, J. Corn Stalk Nitrate Interpretation. 2010. Available online: http://www.extension.iastate.edu/CropNews/2010/0914sawyer.htm (accessed on 5 September 2012).
- Brouder, S.M.; Mengel, D.B.; Hofmann, B.S. Diagnostic Efficiency of the Blacklayer Stalk Nitrate and Grain Nitrogen Tests for Corn. Agron. J. 2000, 92, 1236–1247. [Google Scholar] [CrossRef]
- Varvel, G.E.; Schepers, J.S.; Francis, D.D. Chlorophyll Meter and Stalk Nitrate Techniques as Complementary Indices for Residual Nitrogen. J. Prod. Agric. 1997, 10, 147–151. [Google Scholar] [CrossRef]
- Beevers, L.; Hageman, R.H. Nitrate Reduction in Higher Plants. Annu. Rev. Plant Physiol. 1969, 20, 495–522. [Google Scholar] [CrossRef]
- Blackmer, A.M.; Pottker, D.; Cerrato, M.E.; Webb, J. Correlations between Soil Nitrate Concentrations in Late Spring and Corn Yields in Iowa. J. Prod. Agric. 1988, 2, 103–109. [Google Scholar] [CrossRef]
- Klepper, L.; Flesher, D.; Hageman, R.H. Generation of Reduced Nicotinamide Adenine Dinucleotide for Nitrate Reduction in Green Leaves. Plant Physiol. 1971, 48, 580–590. [Google Scholar] [CrossRef] [PubMed] [Green Version]
- Gowri, G.; Campbell, W.H. Communication cDNA Clones for Corn Leaf NADH:Nitrate Reductase and Chloroplast NAD(P)+:GlyceraIdehyde-3-Phosphate Dehydrogenase; Characterization of the Clones and Analysis of the Expression of the Genes in Leaves as Influenced by Nitrate in the Light and Dark. Plant Physiol. 1989, 90, 792–798. [Google Scholar] [PubMed]
- Neyra, C.A.; Hageman, R.H. Relationships between Carbon Dioxide, Malate, and Nitrate Accumulation and Reduction in Corn (Zea mays L.) Seedlings. Plant Physiol. 1976, 58, 726–730. [Google Scholar] [CrossRef] [PubMed]
- Rathnam, C.K.M. Malate and Dihydroxacetone Phosphate-dependent Nitrate Reduction in Spinach Leaf Protoplasts. Plant Physiol. 1978, 62, 220–223. [Google Scholar] [CrossRef] [PubMed]
- Kaiser, W.M.; Kandlbinder, A.; Stoimenova, M.; Glaab, J. Discrepancy between nitrate reduction rates in intact leaves and nitrate reductase activity in leaf extracts: What limits nitrate reduction in situ? Planta 2000, 210, 801–807. [Google Scholar] [CrossRef] [PubMed]
- Sienkiewicz-Porzucek, A.; Nunes-Nesi, A.; Sulpice, R.; Lisec, J.; Centeno, D.C.; Carillo, P.; Leissea, A.; Urbanczyk-Wochniak, E.; Fernie, A.R. Mild Reductions in Mitochondrial Citrate Synthase Activity Result in a Compromised Nitrate Assimilation and Reduced Leaf Pigmentation But Have No Effect on Photosynthetic Performance or Growth. Plant Physiol. 2008, 147, 115–127. [Google Scholar] [CrossRef] [PubMed] [Green Version]
- Sienkiewicz-Porzuceka, A.; Sulpicea, R.; Osorioa, S.; Krahnerta, I.; Leissea, A.; Urbanczyk-Wochniaka, E.; Hodges, M.; Ferniea, A.R.; Nunes-Nesia, A. Mild Reductions in Mitochondrial NAD Dependent Isocitrate Dehydrogenase Activity Result in Altered Nitrate Assimilation and Pigmentation But Do Not Impact Growth. Mol. Plant 2010, 3, 156–173. [Google Scholar] [CrossRef] [PubMed]
- Hager, J.; Pellny, T.K.; Mauve, C.; Lelarge-Troverie, C.; DePaepe, R.; Foyer, C.H.; Noctor, G. Conditional modulation of NAD levels and metabolite profiles in Nicotiana sylvestris by mitochondrial electron transport and carbon/nitrogen supply. Planta 2010, 231, 1145–1157. [Google Scholar] [CrossRef] [PubMed]
- Szal, B.; Jastrzebska, A.; Kulka, M.; Lesniak, K.; Podgórska, A.; Pärnik, T.; Ivanova, H.; Keerberg, O.; Gardeström, P.; Rychter, A.M. Influence of mitochondrial genome rearrangement on cucumber leaf carbon and nitrogen metabolism. Planta 2010, 232, 1371–1382. [Google Scholar] [CrossRef] [PubMed] [Green Version]
- Foyer, C.H.; Noctor, G.; Hodges, M. Respiration and nitrogen assimilation: Targeting mitochondria-associated metabolism as a means to enhance nitrogen use efficiency. J. Exp. Bot. 2011, 62, 1467–1482. [Google Scholar] [CrossRef] [PubMed]
- Marienfeld, J.R.; Newton, K.J. The maize NCS2 abnormal growth mutant has a chimeric nad4-nad7 mitochondrial gene and is associated with reduced complex I function. Genetics 1994, 138, 855–863. [Google Scholar] [PubMed]
- Loussaert, D. Microcomputer-based experiment management system: II. Data analysis. Agron. J. 1992, 84, 256–259. [Google Scholar] [CrossRef]
- Loussaert, D.; DeBruin, J.; San Martin, J.P.; Schussler, J.; Pape, R.; Clapp, J.; Mongar, N.; Fox, T.; Albertsen, M.; Trimnell, M.; et al. Genetic Male Sterility (Ms44) Increases Maize Grain Yield. Crop Sci. 2017, 57, 2718–2728. [Google Scholar] [CrossRef]
- Tollenaar, M.; Migus, W. Dry matter accumulation of maize grown hydroponically under controlled-environment and field conditions. Can. J. Plant Sci. 1984, 64, 475–485. [Google Scholar] [CrossRef]
- Queval, G.; Noctor, G. A plate reader method for the measurement of NAD, NADP, glutathione, and ascorbate in tissue extracts: Application to redox profiling during Arabidopsis rosette development. Anal. Biochem. 2007, 363, 58–69. [Google Scholar] [CrossRef] [PubMed]
- Miranda, K.M.; Espey, M.G.; Wink, D.A. A rapid, simple spectrophotometric method for simultaneous detection of nitrate and nitrite. Nitric Oxide 2001, 5, 62–71. [Google Scholar] [CrossRef] [PubMed]
- Reed, A.J.; Hageman, R.H. The relationship between nitrate uptake, nitrate flux and nitrate reductase in four maize (Zea mays L.) genotypes. I. Genotypic variation. Plant Physiol. 1980, 66, 1179–1183. [Google Scholar] [CrossRef] [PubMed]
- Kaiser, W.M.; Huber, S.C. Correlation between apparent activation state of nitrate reductase (NR), NR hysteresis and degradation of NR protein. J. Exp. Bot. 1997, 48, 1367–1374. [Google Scholar] [CrossRef] [Green Version]
- Bradford, M.M. A rapid and sensitive method for the quantitation of microgram quantities of protein utilizing the principle of protein-dye binding. Anal. Biochem. 1976, 72, 248–254. [Google Scholar] [CrossRef]
- Fox, T.; DeBruin, J.; Haug-Collet, K.; Trimnell, M.; Clapp, J.; Leonard, A.; Li, B.; Scolaro, E.; Collinson, S.; Glassman, K.; et al. A single point mutation in Ms44 results in dominant male sterility and improves nitrogen use efficiency in maize. Plant Biotechnol. J. 2017, 15, 942–952. [Google Scholar] [CrossRef] [PubMed] [Green Version]
- Unger, E.; Betz, S.; Xu, R.; Cigan, A.M. Selection and orientation of adjacent genes influences DAM-mediated male sterility in transformed maize. Transgenic Res. 2001, 10, 409–422. [Google Scholar] [CrossRef] [PubMed]
- Bonifas, K.D.; Walters, D.T.; Cassman, K.G.; Lindquist, J.L. Nitrogen supply affects root:shoot ratio in corn and velvetleaf (Abutilon theophrasti). Weed Sci. 2005, 53, 670–675. [Google Scholar] [CrossRef]
- Pearson, C.J.; Jacobs, B.C. Yield components and nitrogen partitioning of maize in response to nitrogen before and after anthesis. Aust. J. Agric. Res. 1987, 38, 1001–1009. [Google Scholar] [CrossRef]
- Andrade, F.H.; Echarte, L.; Rizzalli, R.; Della Maggiora, A.; Casanovas, M. Kernel Number Prediction in Maize under Nitrogen or Water Stress. Crop Sci. 2002, 42, 1173–1179. [Google Scholar] [CrossRef]
- Paponov, J.A.; Sambo, P.; Presterl, T.; Geiger, H.H.; Engels, C. Kernel set in maize genotype differing in nitrogen use efficiency in response to resource availability around flowering. Plant Soil 2005, 272, 101–110. [Google Scholar] [CrossRef]
- Ciampitti, I.A.; Zhang, H.; Friedemannc, P.; Vyn, T.J. Potential Physiological Frameworks for Mid-Season Field Phenotyping of Final Plant Nitrogen Uptake, Nitrogen Use Efficiency, and Grain Yield in Maize. Crop Sci. 2012, 52, 2728–2742. [Google Scholar] [CrossRef]
- Lemcoff, J.H.; Loomis, R.S. Nitrogen and density influences on silk emergence, endosperm development, and grain yield in maize (Zea mays L.). Field Crop Res. 1994, 38, 63–72. [Google Scholar] [CrossRef]
- Blackmer, T.M.; Schepers, J.S. Aerial Photography to Detect Nitrogen Stress in Corn. J. Plant Physiol. 1996, 148, 440–444. [Google Scholar] [CrossRef]
- Warner, R.L.; Huffaker, R.C. Nitrate Transport Is Independent of NADH and NAD(P)H Nitrate Reductases in Barley Seedlings. Plant Physiol. 1989, 91, 947–953. [Google Scholar] [CrossRef] [PubMed] [Green Version]
- Espen, L.; Nocito, F.F.; Cocucci, M. Effect of NO3− transport and reduction on intracellular pH: An in vivo NMR study in maize roots. J. Exp. Bot. 2004, 55, 2053–2061. [Google Scholar] [CrossRef] [PubMed]
- Magdoff, F.R. Understanding the Magdoff pre-sidedress nitrate test for corn. J. Prod. Agric. 1991, 4, 297–305. [Google Scholar] [CrossRef]
- Binder, D.L.; Sander, D.H.; Walters, D.T. Maize Response to Time of Nitrogen Application as Affected by Level of Nitrogen Deficiency. Agron. J. 2000, 92, 1228–1236. [Google Scholar] [CrossRef]
- Da Silval, F.P.R.; Striederl, M.L.; da Silva Coserl, R.P.; Rambol, L.; Sangoill, L.; Argentalll, G.; Forsthoferlll, E.L.; da Silval, A.A. Grain yield and kernel crude protein content increases of maize hybrids with late nitrogen side-dressing. Sci. Agric. 2005, 62, 487–492. [Google Scholar] [CrossRef]
- Jung, P.E., Jr.; Peterson, L.A.; Schader, L.E. Response of Irrigated Corn to Time, Rate and Source of Applied N on Sandy Soils. Agron. J. 1972, 64, 668–670. [Google Scholar] [CrossRef]
- Pan, W.L.; Kamprath, E.J.; Moll, R.H.; Jackson, W.A. Prolificacy in Corn: Its Effects on Nitrate and Ammonium Uptake and Utilization. Soil Sci. Soc. Am. J. 1984, 48, 1101–1106. [Google Scholar] [CrossRef]
- Below, F.E.; Gentry, L.E. Maize Productivity as Influenced by Mixed Nitrogen Supplied before or after Anthesis. Crop Sci. 1992, 32, 163–168. [Google Scholar] [CrossRef]
- Smiciklas, K.D.; Below, F.E. Role of cytokinin in enhanced productivity of maize supplied with NH4+ and NO3−. Plant Soil 1992, 142, 307–313. [Google Scholar] [CrossRef]
- Yasir, A.M.; Khlil, S.K.; Jan, M.T.; Khan, A.Z. Phenology, growth, and grain yield of maize as influenced by foliar applied urea at different growth stages. J. Plant Nutr. 2010, 33, 71–79. [Google Scholar]
- Chen, J.; Fan, X.; Qian, K.; Zhang, Y.; Song, M.; Liu, Y.; Xu, G.; Fan, X. pOsNAR2.1:OsNAR2.1 expression enhances nitrogen uptake efficiency and grain yield in transgenic rice plants. Plant Biotechnol. J. 2017, 15, 1273–1283. [Google Scholar] [CrossRef] [PubMed] [Green Version]
- Yu, T.-R. Soil and plants. In Physical Chemistry of Paddy Soils; Yu, T.-R., Ed.; Science Press: Beijing, China, 1985; pp. 197–217. [Google Scholar]
- Gardeström, P.; Igamberdiev, A.U.; Raghavendra, A.S. Mitochondrial Functions in the Light and Significance to Carbon-Nitrogen Interactions. In Photosynthetic Nitrogen Assimilation and Associated Carbon and Respiratory Metabolism; Foyer, C.H., Noctor, G., Eds.; Springer: Dordrecht, The Netherlands, 2002; Chapter 12; pp. 151–172. [Google Scholar]
- Cho, Y.; Fernandes, J.; Kim, S.-H.; Walbot, V. Gene-expression profile comparisons distinguish seven organs of maize. Genome Biol. 2002, 3. [Google Scholar] [CrossRef]
Figure 1.
Stalk nitrate, by internode, of plants grown under high N and low N fertility. The DuPont-Pioneer hybrid 33W84 was grown in field plots depleted in N then fertilized with 77 kg ha−1 N (Low N), or in plots not N depleted and fertilized with 224 kg ha−1 N (High N). At V11, R1, R2, and R3 plants were sampled, leaves and leaf sheaths removed and the stalks separated into segments by internode. Samples were dried, ground to a fine powder and nitrate quantified.

Figure 2.
In vivo nitrate assimilation-NRA (in vivo) and in vivo nitrite assimilation-NiR (in vivo) by leaf position. The DuPont-Pioneer hybrid 33W84 was grown in non-depleted field plots and fertilized with 224 Kg N ha−1. At R1 each leaf was sampled for nitrate assimilation (NRA (in vivo)) and nitrite assimilation (NiRA (in vivo)).

Figure 3.
Extractable enzyme activities by internode. The DuPont-Pioneer hybrid 33W84 was grown in non-depleted field plots and fertilized with 224 Kg N ha−1. Cell free extracts were produced from leaf punches (10, 5 mm) of each leaf, small molecular weight molecules removed, and enzymes assayed. Nitrate reductase activity (NRA (in vitro)) had a quadradic fit with leaf position whereas nitrite reductase activity (NiRA (in vitro)) and malic enzyme (ME) did not change with leaf position (slopes not different from 0). PEP-carboxylase activity follows a similar trend as NRA (in vitro) with lower activity in lower leaves.

Figure 4.
The DuPont-Pioneer 33W84 was grown in field hydroponics during two successive growing seasons. The first season plants were grown in nutrient media containing 1 and 3 mM KNO3 as the sole N source and the second season grown in nutrient media containing 1 and 4 mM KNO3 as the sole N source. Starting at emergence (V0), plants growing in 1 mM KNO3 were switched to either 3 or 4 mM KNO3 and plants growing in 3 or 4 mM KNO3 switched to 1 mM KNO3 every third developmental stage.

Figure 5.
Change in nitrate reductase activity (NRA (in vitro)) and nitrate reductase activity, in vivo, (NRA (in vivo)) with increased nitrate fertility. GF3 was grown under controlled conditions with nitrate fertility varied from 1 to 4 mM KNO3. The penultimate leaf was sampled 28-DAE for both Nitrate Assimilation (NRA (in vivo) and Nitrate Reductase Activity (NRA (in vitro)).

Figure 6.
Plant N with increasing nitrate fertility. GF3 was grown under controlled conditions with nitrate fertility varied from 1 to 4 mM KNO3. At 26-DAE the entire plant was removed from the potting media, dried, and ground to a fine power. Total-N and nitrate-N were determined. Organic-N was determined by subtracting nitrate-N from total-N. Means with similar letters are not different by protected LSD (0.05).


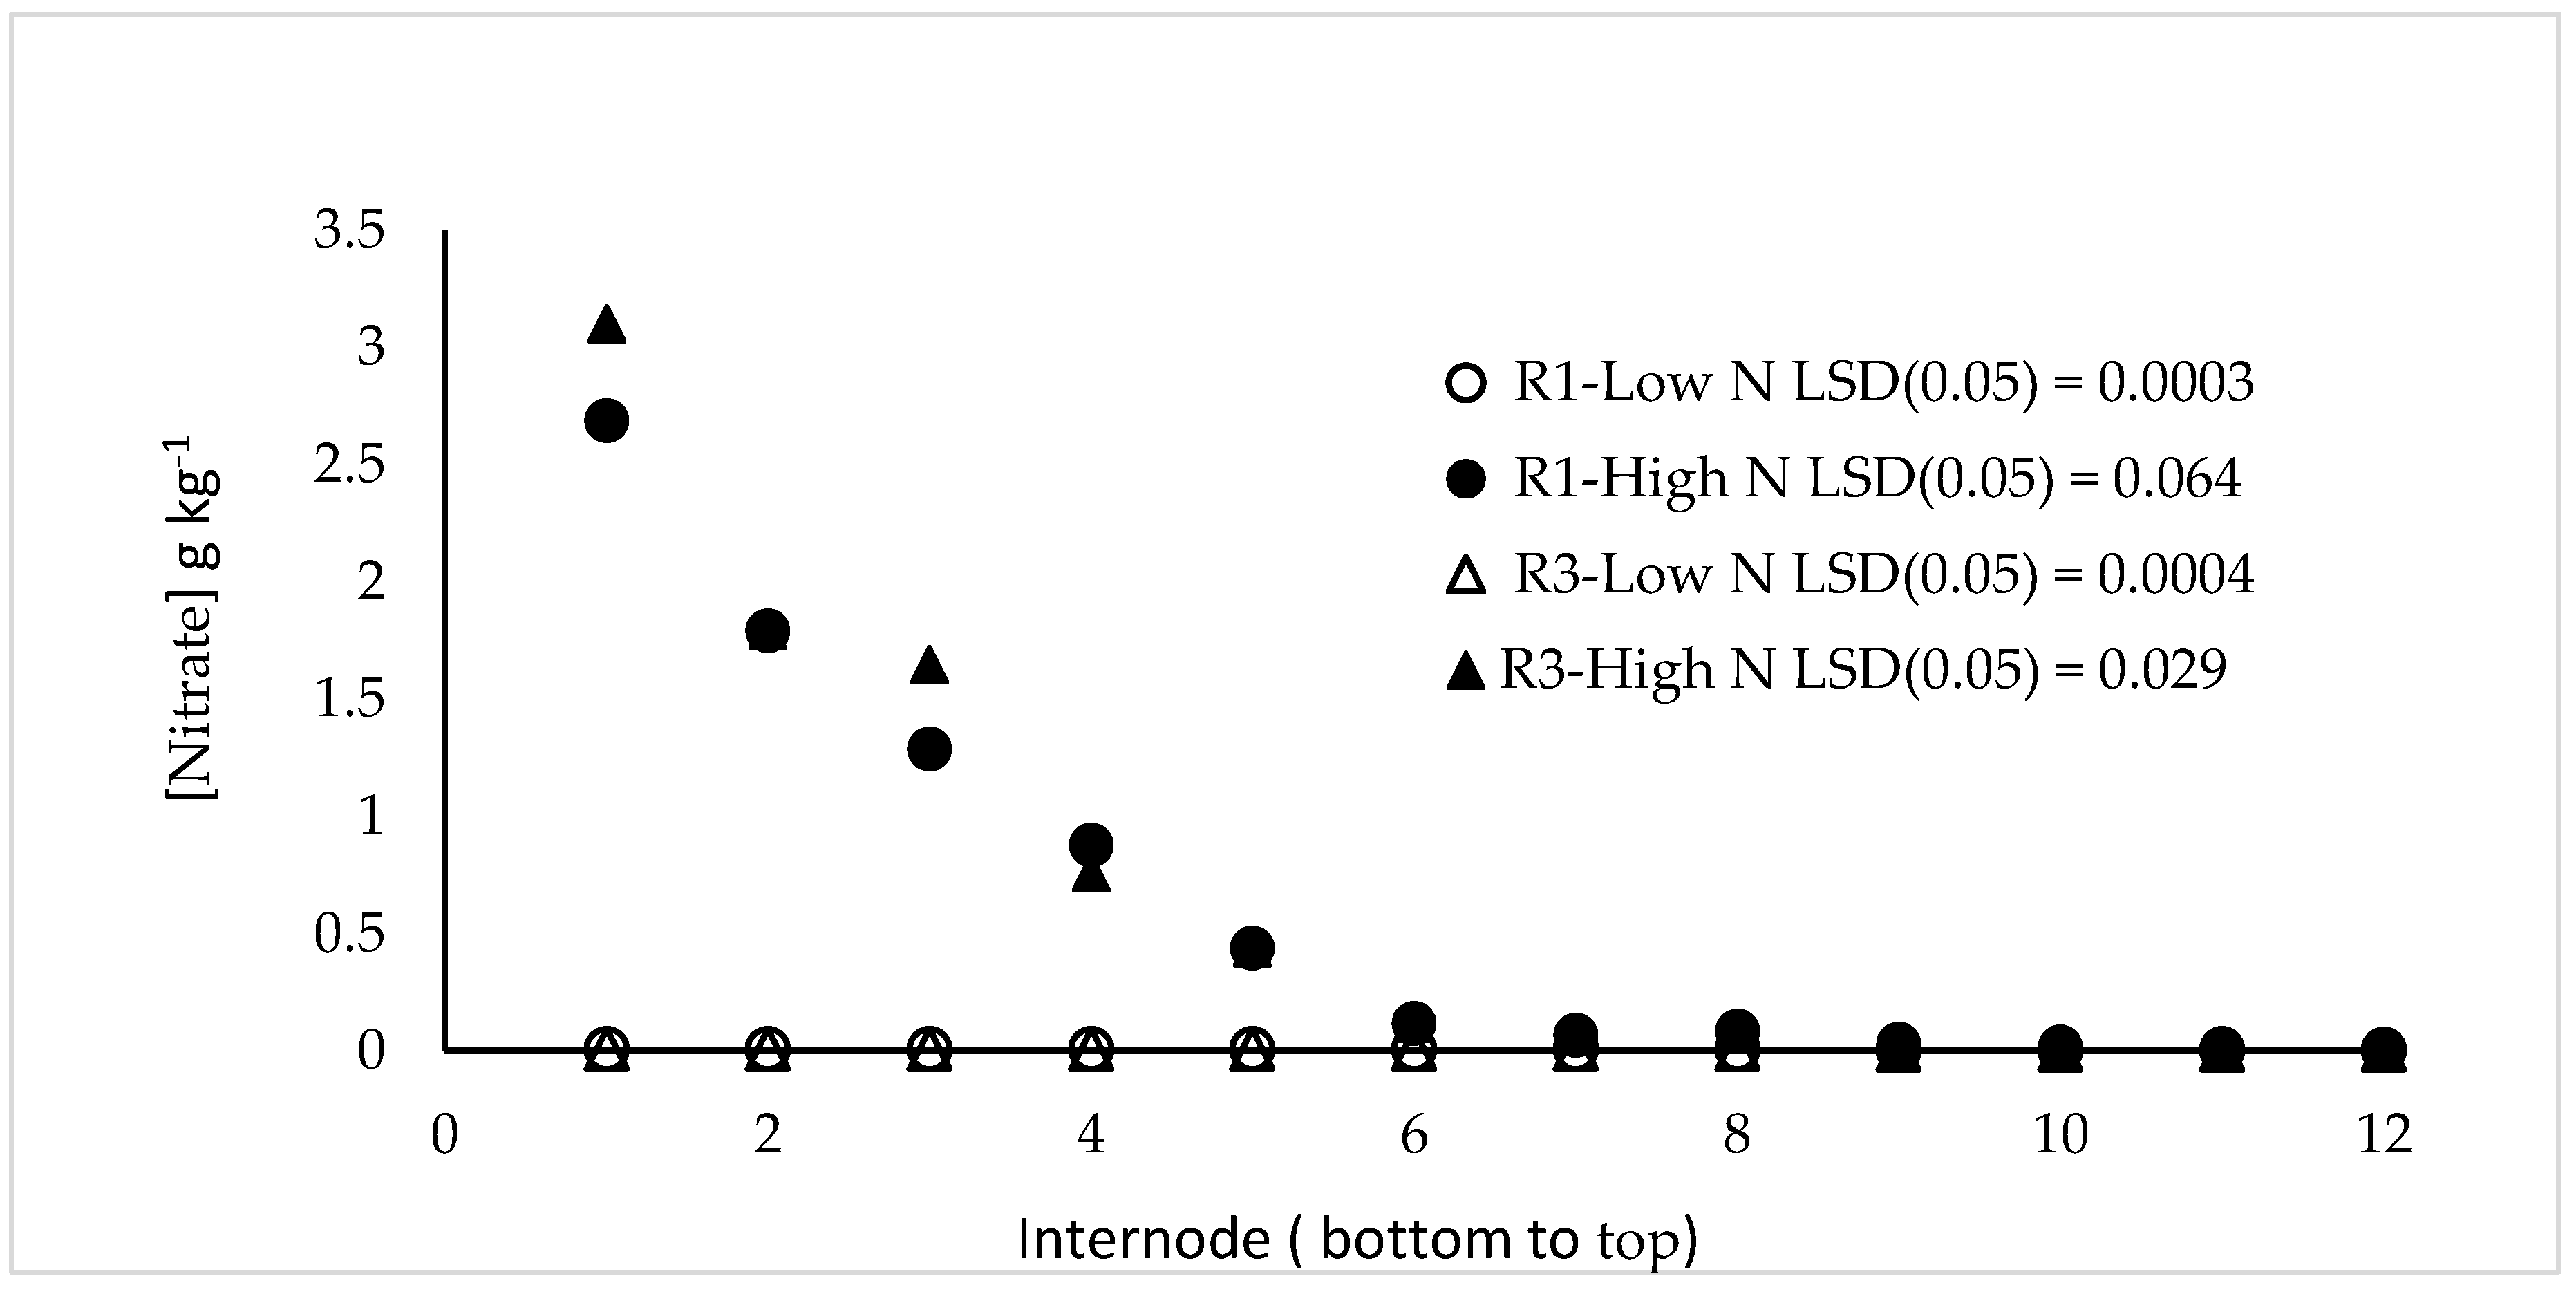
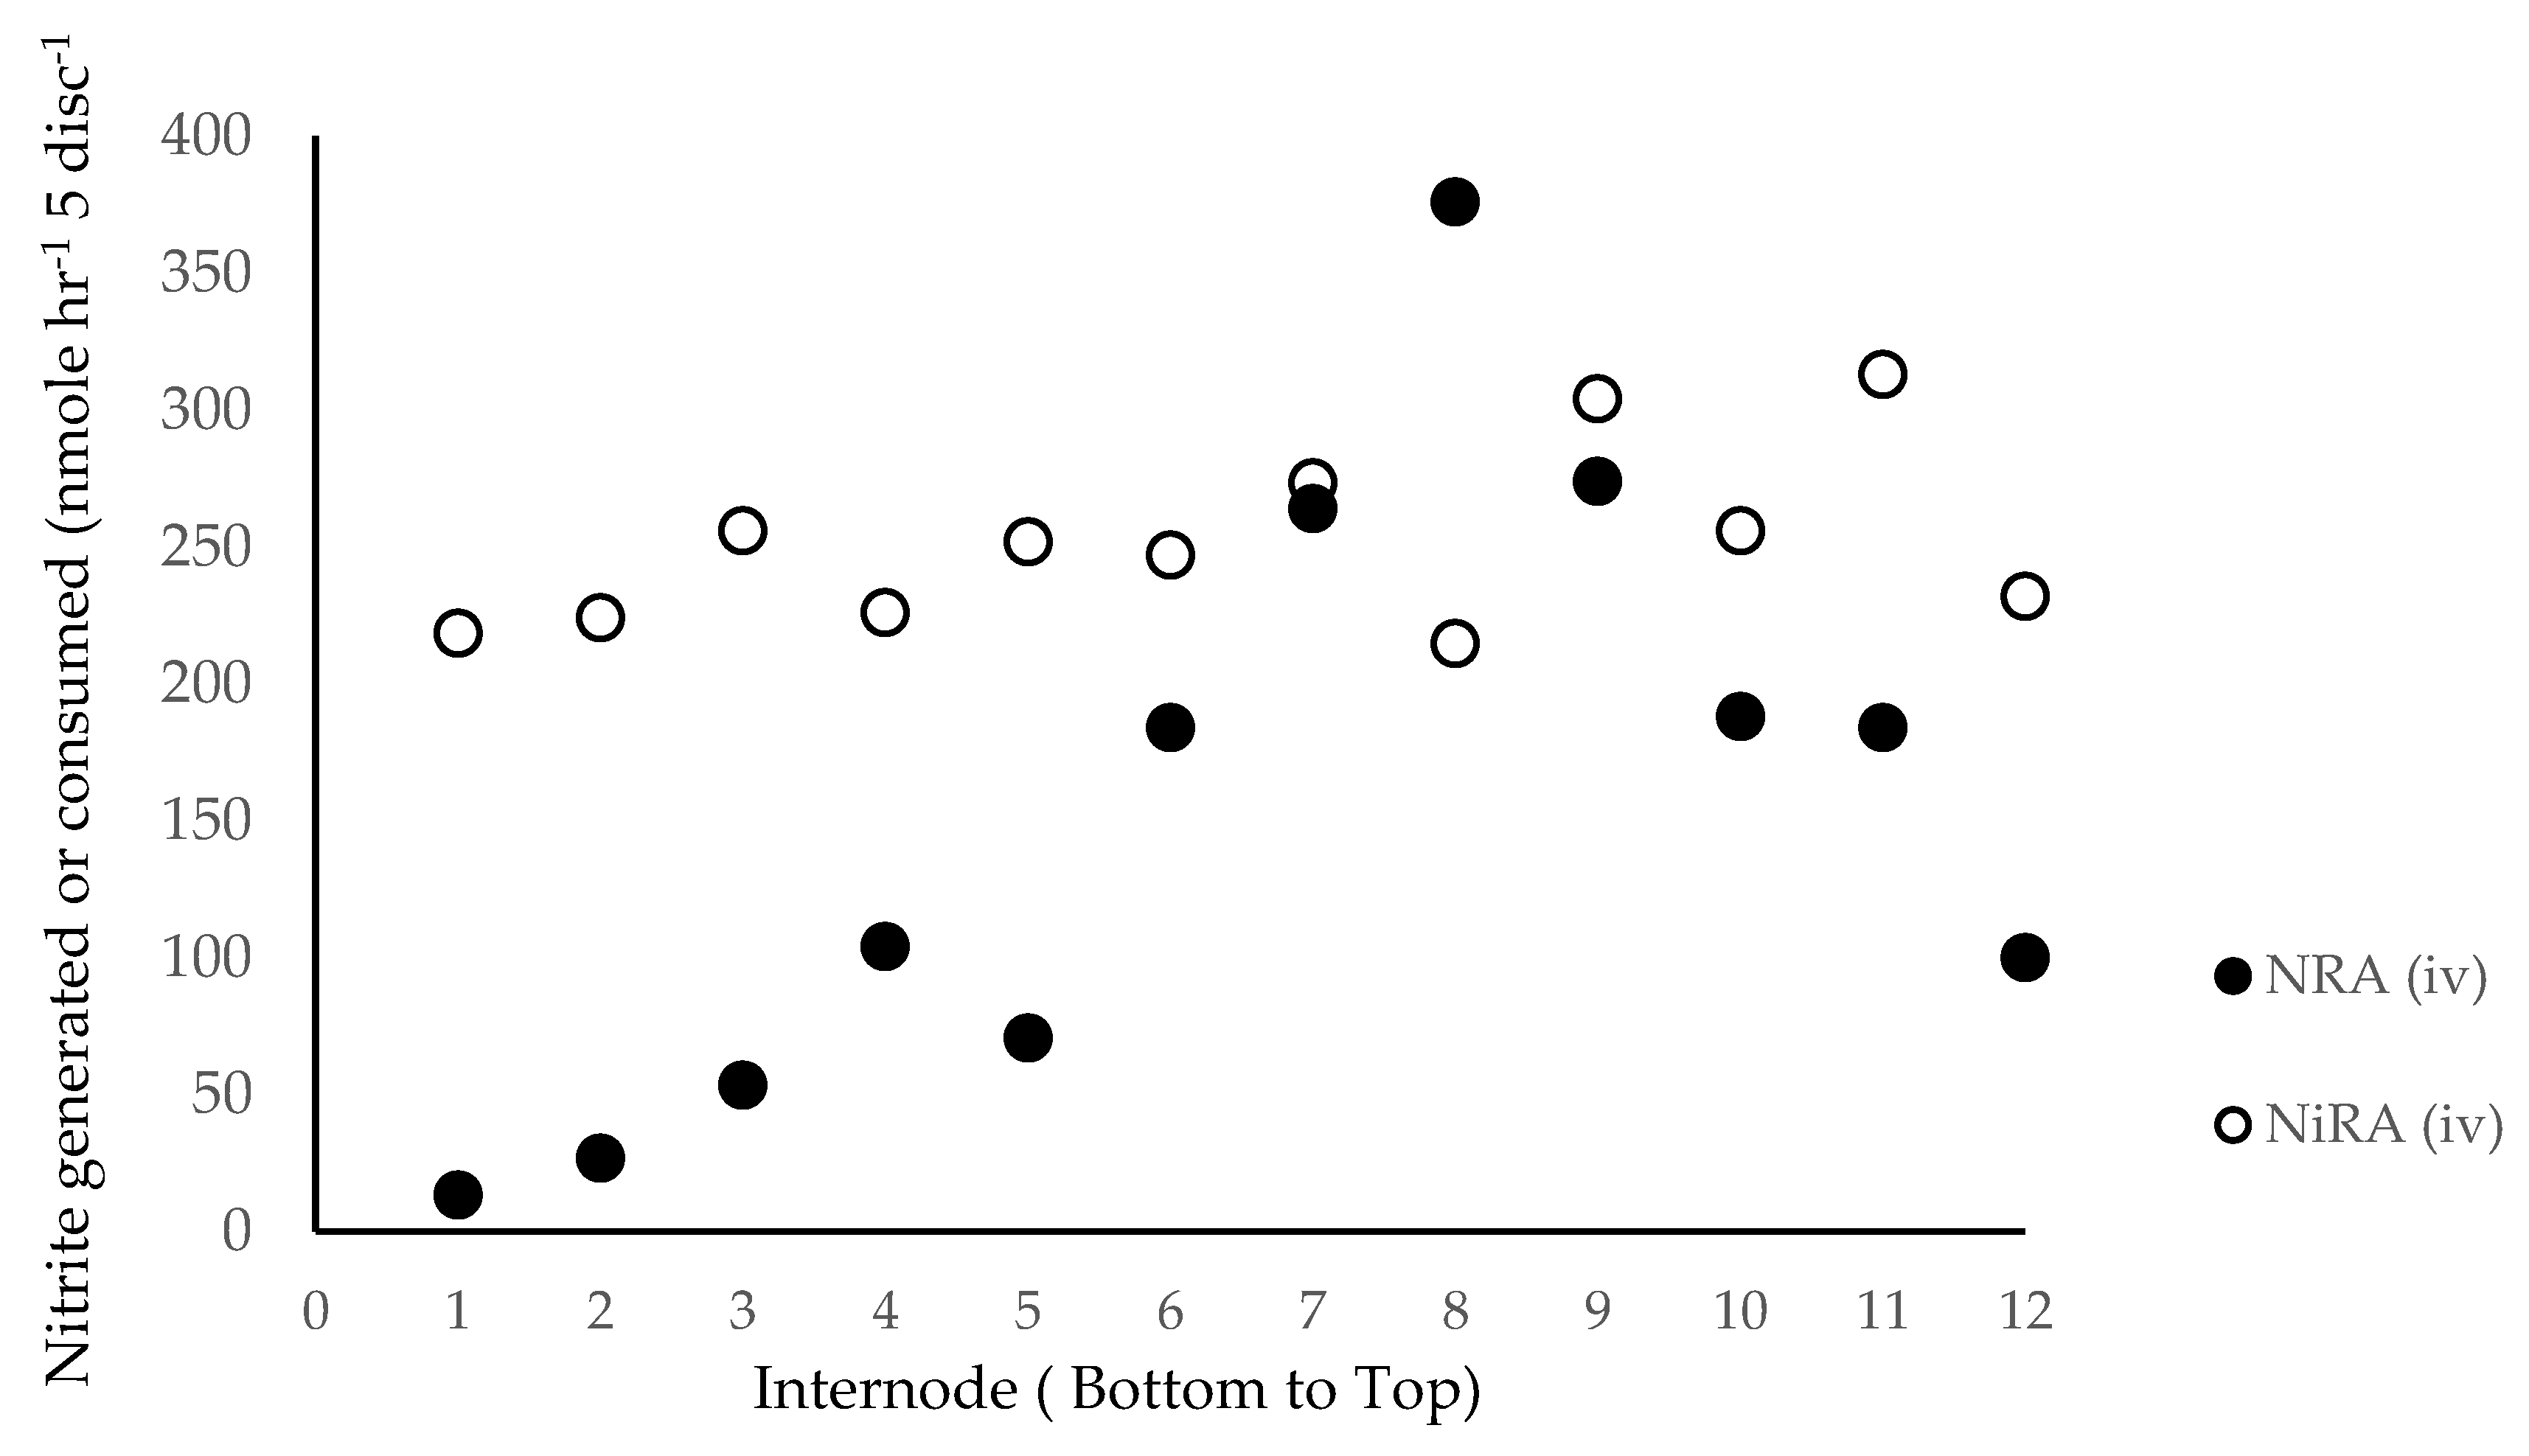
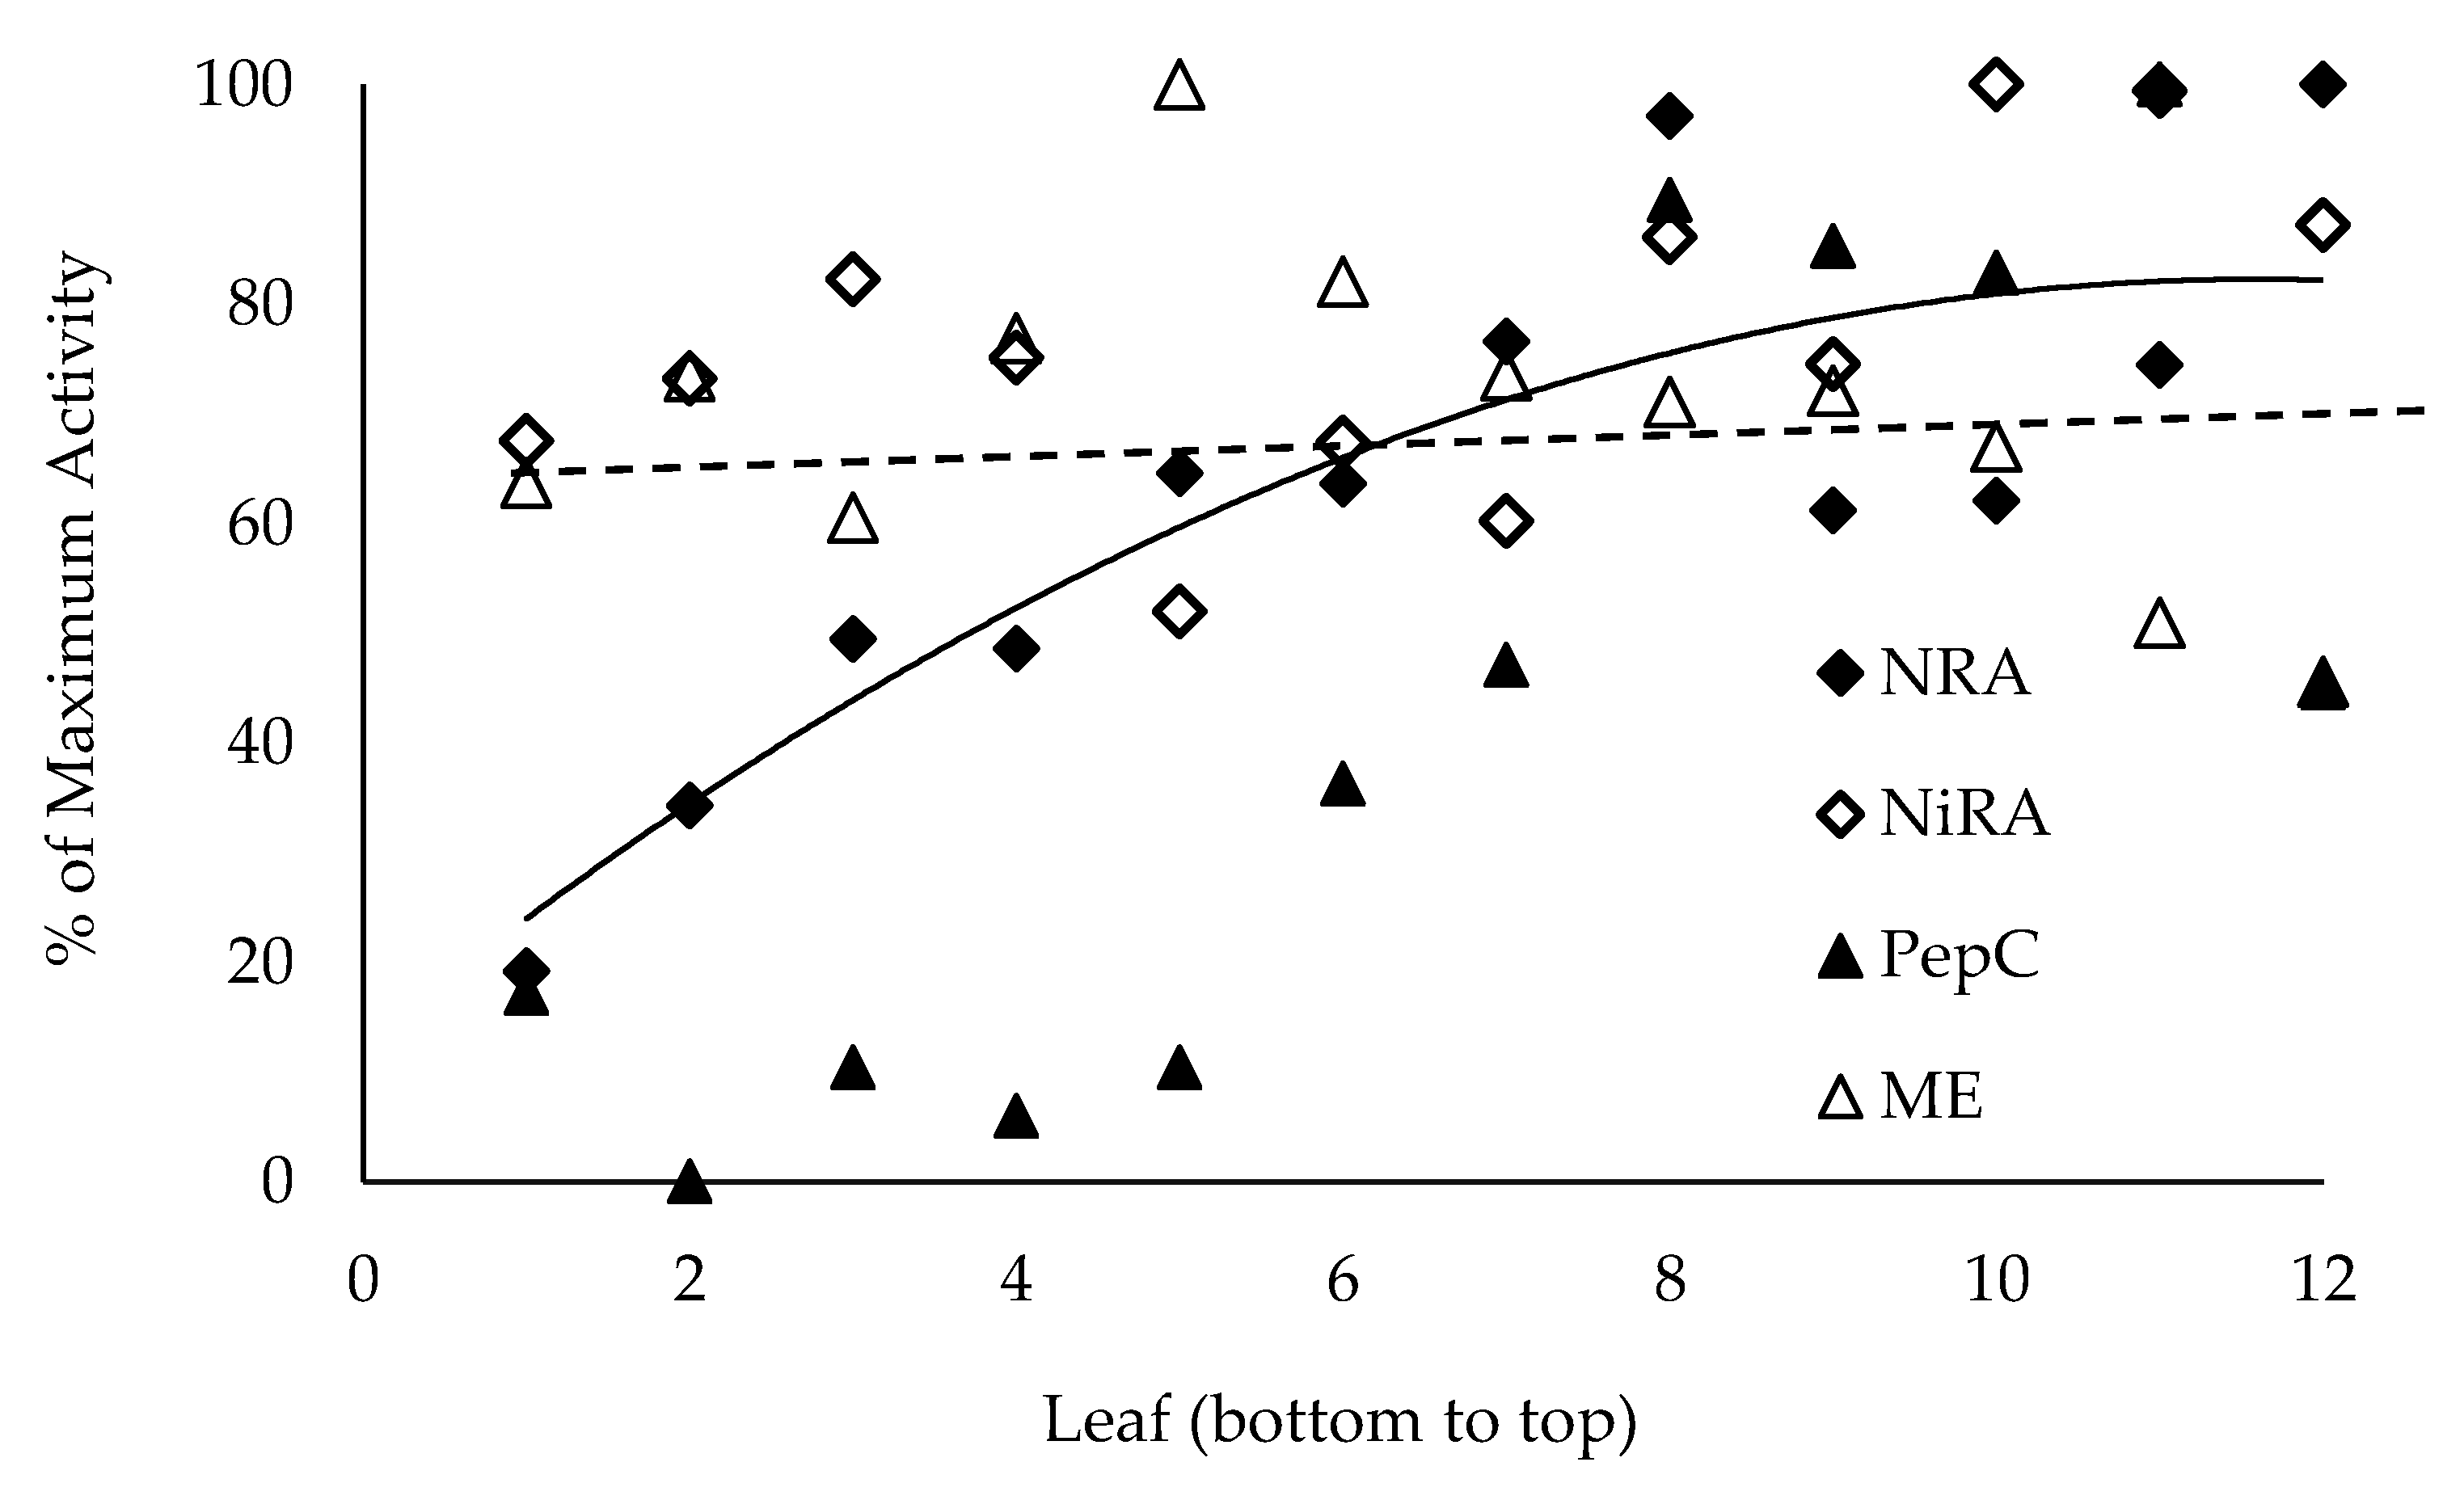
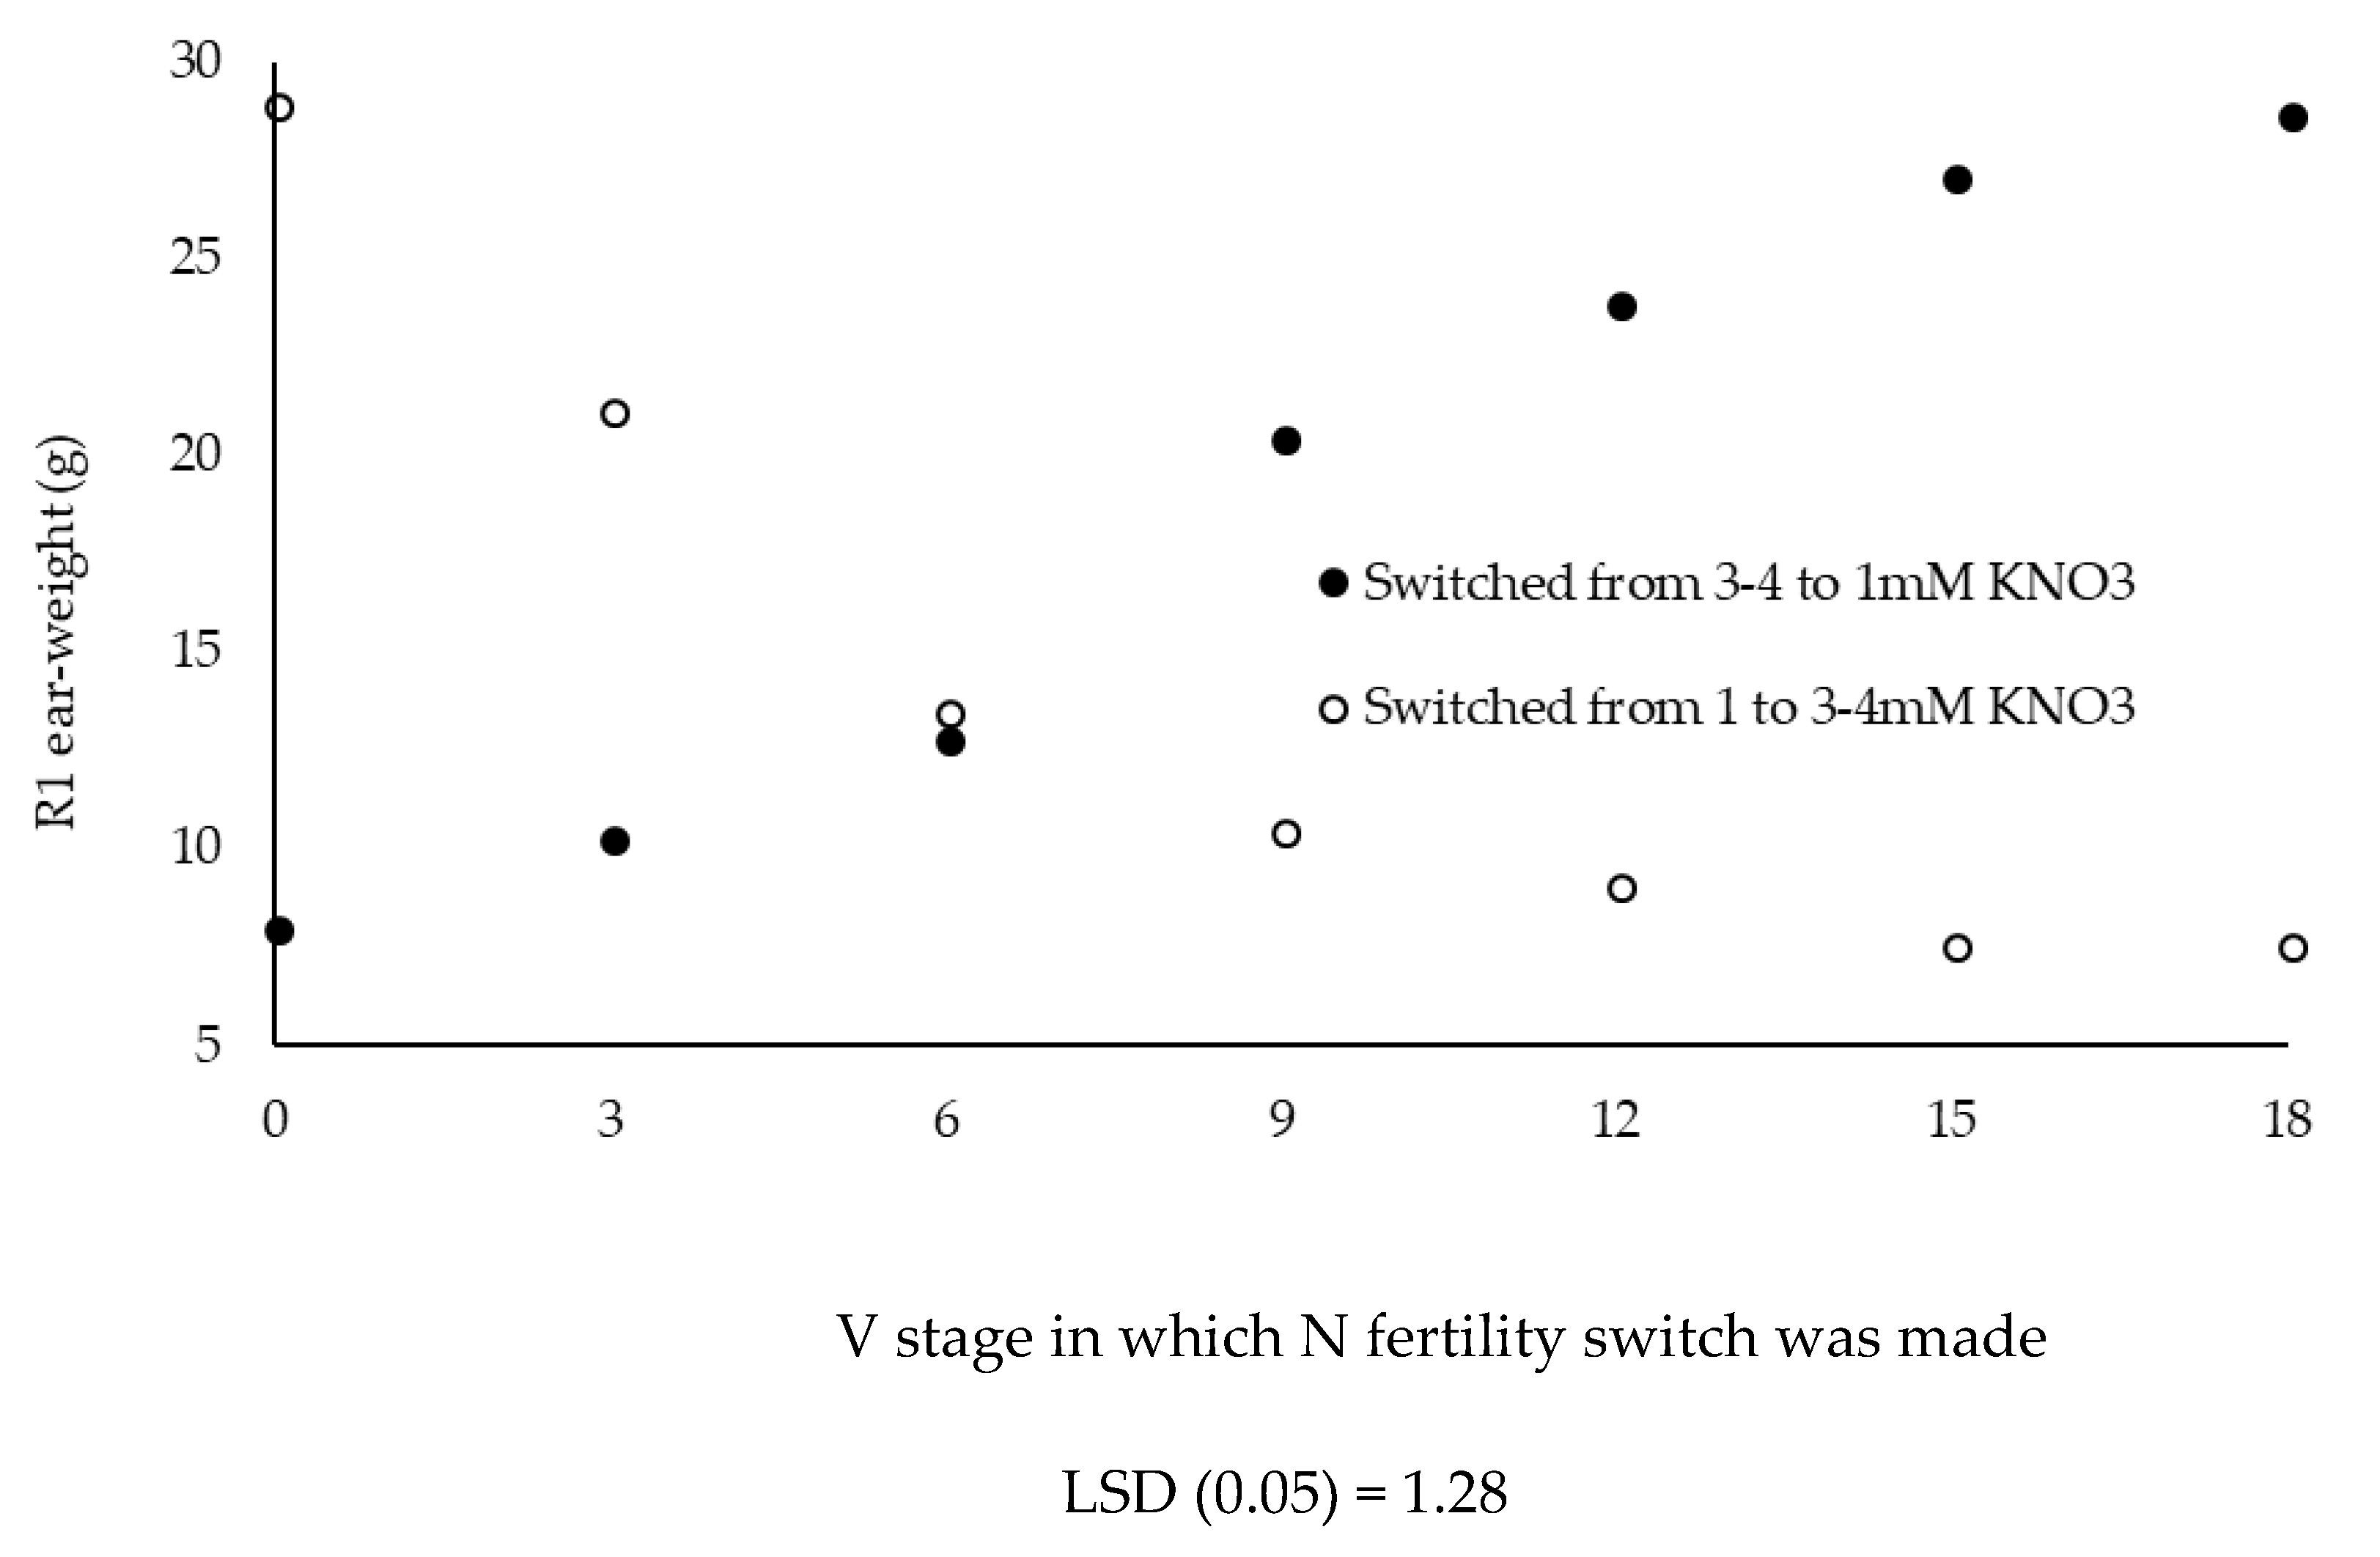
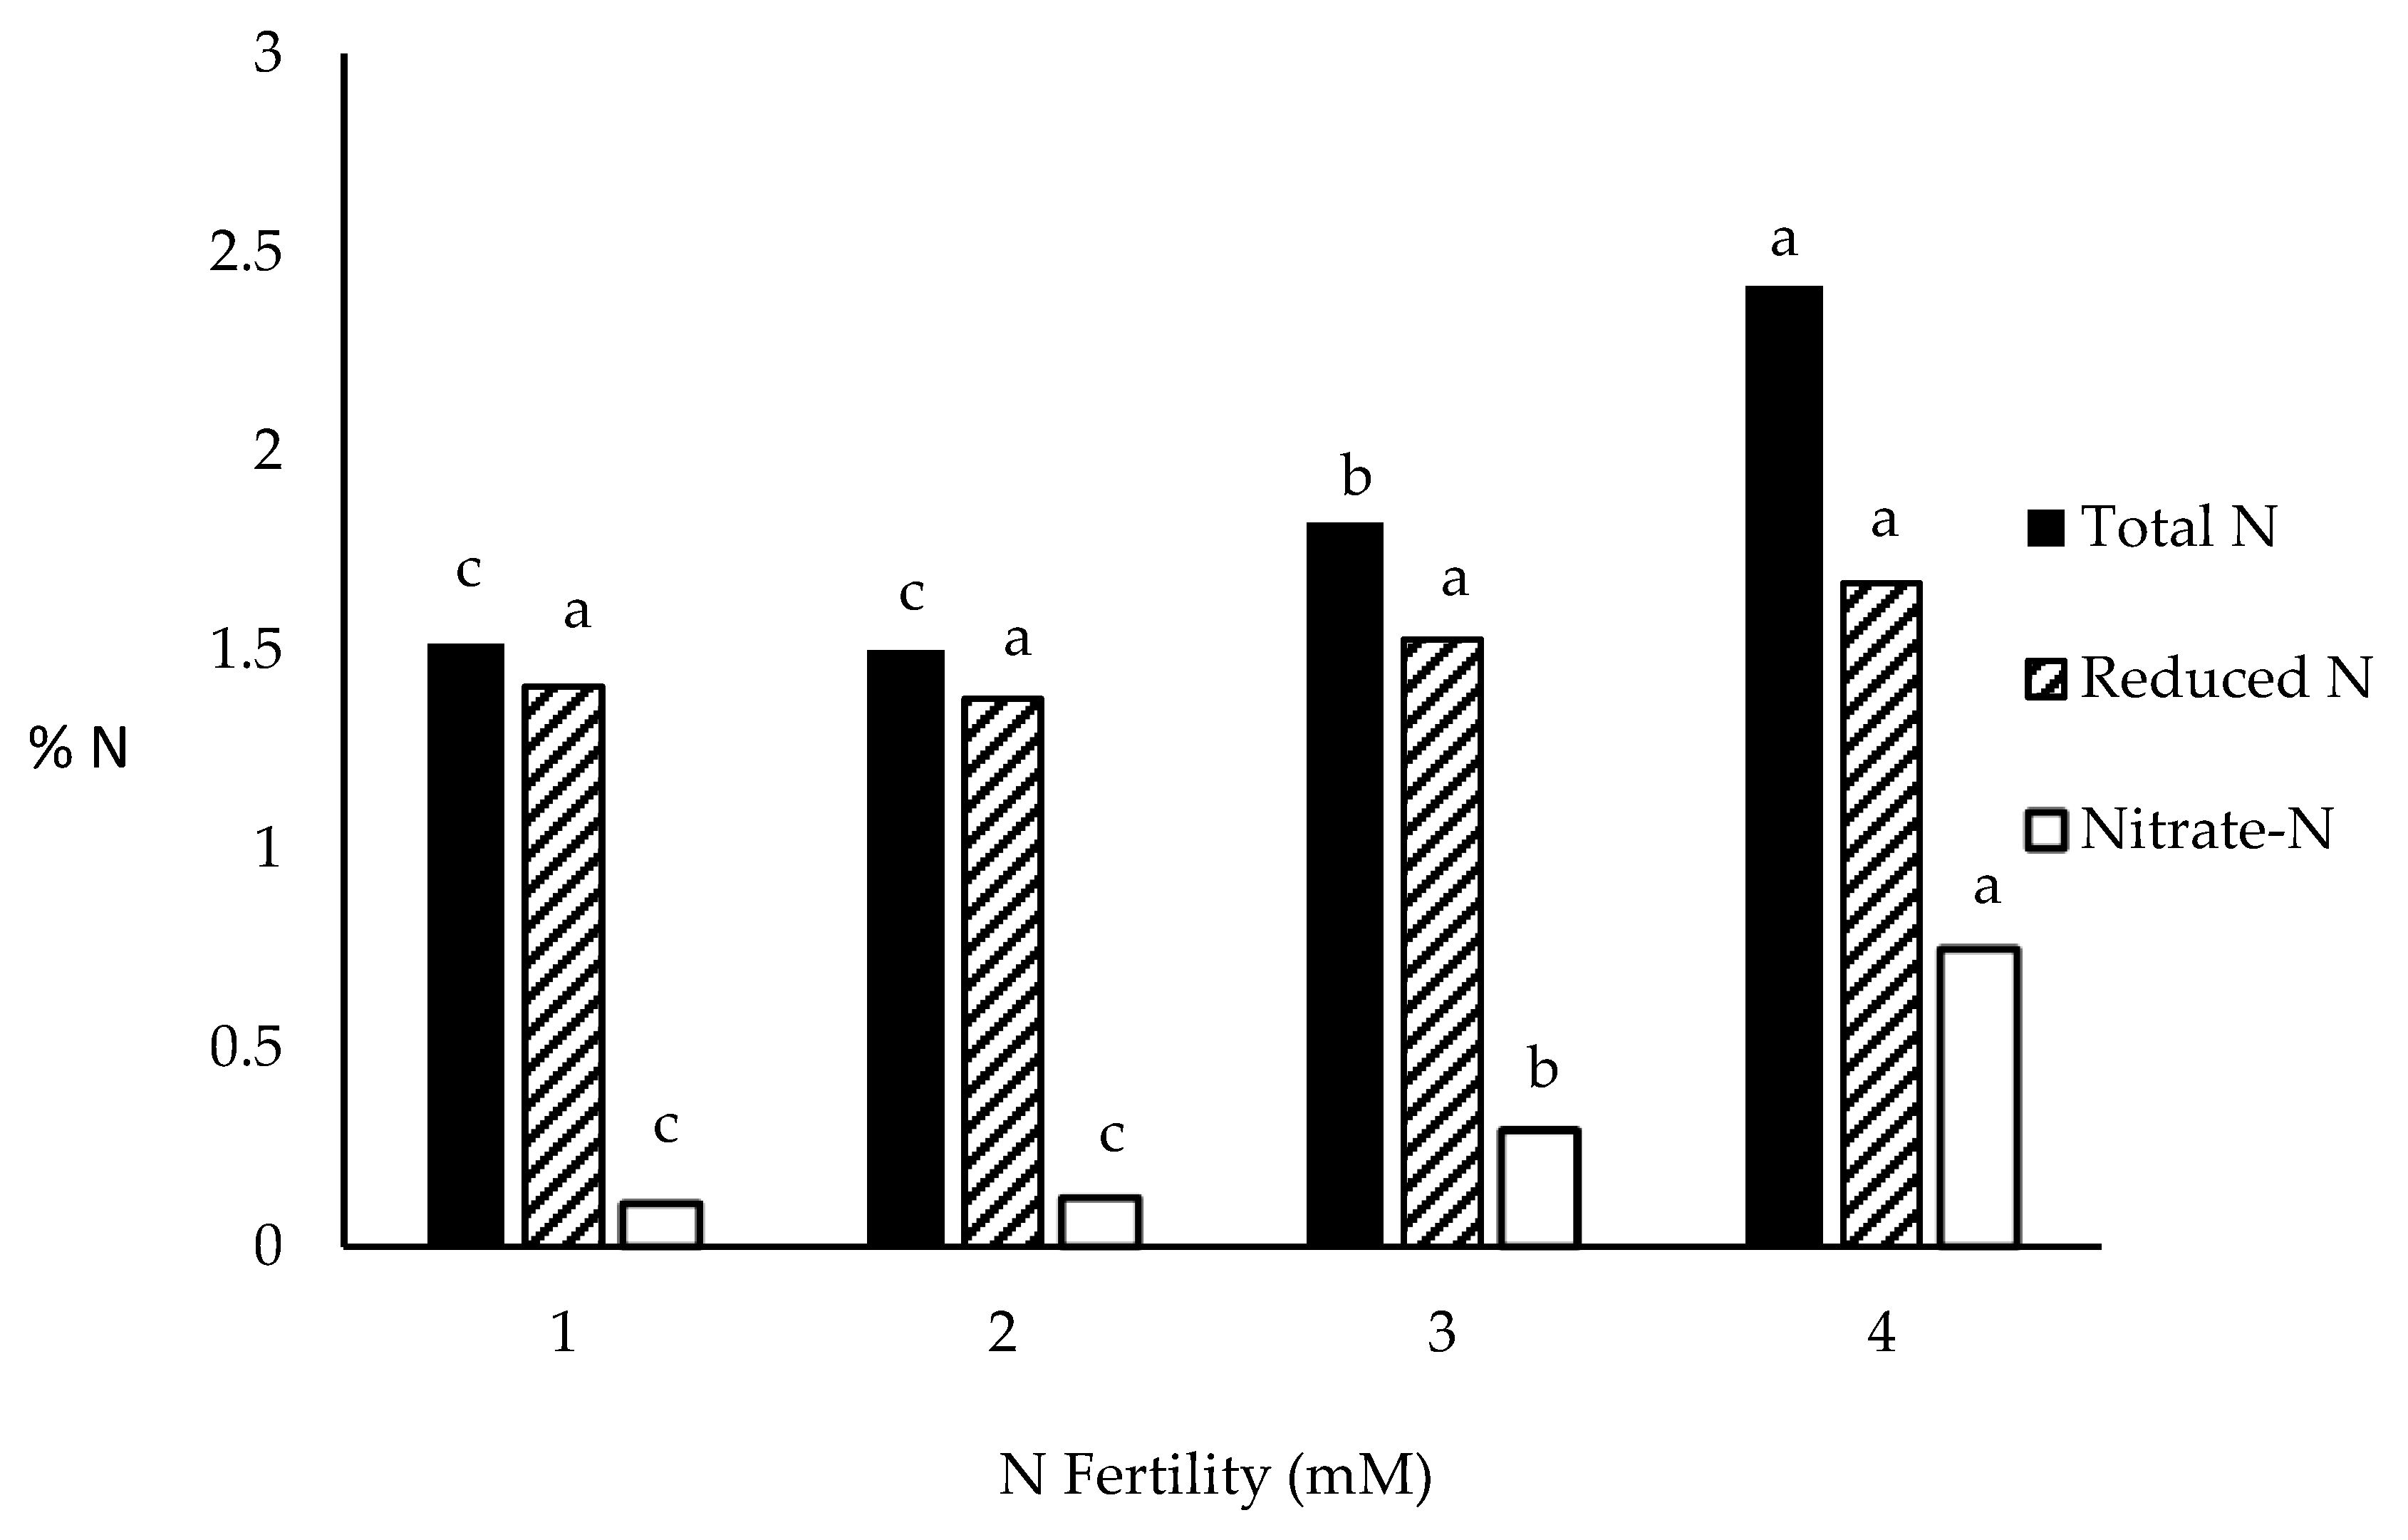
Table 1.
Maize parameters responsive to N input and correlated to grain yield.
| Parameter | Response to N | Relation to Grain Yield | ||
|---|---|---|---|---|
| p > F | r2 | |||
| High N | Low N | High N | Low N | |
| Total Amino Acids (V9) | <0.01 | <0.01 | 0.77 | 0.99 |
| Biomass, R1 | 0.638 | 0.828 | 0.96 | 0.85 |
| Total N, R1 | 0.018 | 0.119 | 0.88 | 0.91 |
| Ear Length, R1 | 0.028 | <0.01 | 0.99 | 0.97 |
| Ear Weight, R1 | 0.072 | <0.01 | 0.95 | 0.93 |
| Ear Width, R1 | 0.476 | 0.134 | 0.12 | 0.78 |
| SPAD, R1 | <0.01 | <0.01 | 0.87 | 0.96 |
| SPAD, R2 | <0.01 | <0.01 | 0.62 | 0.91 |
| SPAD, R3 | 0.012 | 0.017 | 0.77 | 0.91 |
| Biomass—Maturity | 0.302 | 0.038 | 0.68 | 0.84 |
| Plant Total N—Maturity | 0.15 | 0.84 | 0.23 | 0.31 |
| Ear Weight—Maturity | 0.027 | 0.01 | 0.99 | 0.99 |
| Kernel Weight | 0.1 | 0.048(−) | 0.98 | 0.56(−) |
| Kernel Number | 0.038 | 0.013 | 0.99 | 0.99 |
| Grain Total N | <0.01 | 0.061 | 0.97 | 0.95 |
During the 2009 and 2010 growing seasons, three DuPont-Pioneer hybrids (33K42, 33W84, 33T56) were grown in fields not depleted for N (High N) and were treated with six N fertilities (0, 34, 67, 101, 134, and 167 kg ha−1). In a similar fashion, 33W84 was planted in an N depleted field (Low N) and treated with four N fertilities (0, 22, 45, and 67 kg ha−1). Various parameters were measured and their response to N-fertility determined along with their relationship to grain yield.
Table 2.
Leaf metabolites by internode of plants grown under non-depleted N (High N) and depleted N (Low N) conditions of N fertility.
Table 2.
Leaf metabolites by internode of plants grown under non-depleted N (High N) and depleted N (Low N) conditions of N fertility.
| Internode | Leaf Nitrate | Leaf Malate | ||
|---|---|---|---|---|
| (µg g−1) | (µmole g−1) | |||
| Low N | High N | Low N | High N | |
| 1 | 0.96 | 1.18 | 16.28 | 38.89 |
| 2 | 1.01 | 1.16 | 22.43 | 28.83 |
| 3 | 1.23 | 1.28 | 14.73 | 16.98 |
| 4 | 1.26 | 1.36 | 10.91 | 17.64 |
| 5 | 1.06 | 1.14 | 11.67 | 11.93 |
| 6 | 1.47 | 1.56 | 8.89 | 11.87 |
| 7 | 1.19 | 1.11 | 10.27 | 9.31 |
| 8 | 1.44 | 1.14 | 9.49 | 9.76 |
| 9 | 1.14 | 1.12 | 8.41 | 8.80 |
| 10 | 0.97 | 1.27 | 9.68 | 9.17 |
| 11 | 0.91 | 1.05 | 9.68 | 9.72 |
| 12 | 1.48 | 1.26 | 10.07 | 9.94 |
| LSD (0.05) | 1.177 | 1.336 | ||
DuPont-Pioneer hybrid 33W84 was planted in Johnston, IA under high N fertility (224 kg N ha−1) and in a field depleted of N for at least 2 years (Low N) and fertilized with 77 kg N ha−1. Sampling occurred at V11 and R1. Subtending leaves of each internode were sampled by leaf punching. Samples were dried and metabolites quantified at each sampling date but analyzed together with sampling time included in the replicate term. Leaf 1 is at the base of the plant and leaf 12 is at the top.
Table 3.
The effect of V12–15 nutrient replacement with NH4Cl on R1 ear-weight.
| Treatment | Ear Dwt | Plant Biomass | Ear Number |
|---|---|---|---|
| (g) | (g) | (%) | |
| 1 mM KNO3 (No Change) | 7.3 c | 97.9 b | 86 b |
| Switched from 1 mM KNO3 to 1 mM NH4Cl | 8.3 c | 97.9 b | 97 a |
| 3–4 mM KNO3 (No Change) | 28.2 b | 152.6 a | 93 a |
| Switched from 3–4 mM KNO3 to 1 mM NH4Cl | 36.0 a | 154.8 a | 100 a |
DuPont-Pioneer hybrid 33W84 was grown in nutrient media containing 1 or 3 mM KNO3 as the sole nitrogen source up to V12 and V15 and then switched to media containing 1 mM NH4Cl. Controls were unchanged. At R1, plants were harvested and ear and plant dry weights were determined along with the proportion of the plants that had a visible ear with emerging silks. The experiment was repeated in the following growing season except the upper KNO3 concentration was 4 mM. Data were summed across treatment stages (V12 and V15) and experimental seasons. Means with different letters were significantly different by protected LSD (0.05).
Table 4.
R1 ear-weight, ear N, R1 vegetative biomass, and vegetative N of GF3 switch from 1 mM nitrate N nutrition 23DAE.
Table 4.
R1 ear-weight, ear N, R1 vegetative biomass, and vegetative N of GF3 switch from 1 mM nitrate N nutrition 23DAE.
| Treatment | Veg Dwt | Veg N | Ear Dwt | Ear N |
|---|---|---|---|---|
| (g) | (mg) | (mg) | (mg) | |
| 1 mM KNO3 (No Change) | 4.11 | 175.5 | 193 b | 14.4 b |
| Switched from 1 mM KNO3 to 2 mM KNO3 | 4.02 | 160.6 | 212 b | 14.7 b |
| Switched from 1 mM KNO3 to 1 mM NH4Cl | 3.83 | 190.7 | 265 a | 22.4 a |
| Significance level | NS | NS | 0.05 | 0.05 |
| 2 mM KNO3 (No Change) | 4.32 | 197.0 | 208 b | 13.5 b |
| Switched from 2 mM KNO3 to 1 mM KNO3 | 4.21 | 187.9 | 193 b | 12.1 b |
| Switched from 2 mM KNO3 to 1 mM NH4Cl | 3.79 | 229.9 | 297 a | 24.7 a |
| Significance level | NS | NS | 0.05 | 0.05 |
GF3 was grown in nutrient media containing 1 or 2 mM KNO3 as the sole nitrogen source up to 23-DAE. Plants grown in 1 mM KNO3 were switched to 2 mM KNO3, switched 1 mM NH4Cl or maintained in 1 mM KNO3. Likewise, plants grown in 2 mM KNO3 were switched to 1 mM KNO3, switched to 1 mM NH4Cl or maintained in 2 mM KNO3. Plants were harvested 29-DAE and ear and plant dry weights along with total-N were determined. Means with different letters were significantly different by protected LSD (0.05).
Table 5.
The effect of ammonia fertility on ear growth rate of GF3 when applied 22DAE.
| Treatment | Ear Dry Weight (mg) | |||
|---|---|---|---|---|
| 22 DAE | 23 DAE | 25 DAE | 27 DAE | |
| 1 mM KNO3 (No Change) | 34 | 51 f | 110 d | 195 c |
| Switched from 1 mM KNO3 to 10 mM KNO3 | 34 | 47 f | 101 d | 284 b |
| Switched from 1 mM KNO3 to 1 mM NH4Cl | 34 | 87 e | 244 b | 420 a |
GF3 was grown in medium containing 1 mM KNO3 as the sole N source. At 22-DAE plants were either maintained in 1 mM KNO3 medium, switched to 10 mM KNO3 or switched to 1 mM NH4Cl. Ear dry weight was determined at every sampling date. Each mean represents 9 replicates and means with a similar letter are not different by protected LSD (0.05).
Table 6.
NADH-ubiquinone oxidoreductase 51 kDa subunit (Complex I) co-suppression multi-location yield trial (2013).
Table 6.
NADH-ubiquinone oxidoreductase 51 kDa subunit (Complex I) co-suppression multi-location yield trial (2013).
| Event | Grain Yield Increase over Transgenic Null (kg ha−1) |
|---|---|
| 1.2 | 72.18 |
| 1.4 | 162.57 |
| 1.5 | −23.22 |
| 1.8 | 87.25 |
| 1.12 | 91.64 |
| 1.14 | 6.28 |
| 1.18 | 80.97 |
| 1.19 | 230.37 * |
NADH-ubiquinone oxidoreductase 51 kDa subunit (Complex I) inverted repeat co-suppression gene driven by PEP-carboxylase promoter was transformed into an elite inbred. Eight transgenic progenies were produced and crossed pollinated to form a commercial hybrid. Transgenic hybrid seed was separated from null hybrid seed using the color marker associated with the transgene. The hybrid was tested for grain yield in multiple locations managed for maximum yield and a multi-location yield analysis performed. Transgenic null hybrid grain yield across locations—12,384 kg ha−1. *—Best Linear Unbiased Predictor (BLUP) (p ≤ 0.1).
Table 7.
The effect of selective NADH-ubiquinone oxidoreductase 51 kDa subunit (Complex I) co-suppression on maize N metabolism and grain yield.
Table 7.
The effect of selective NADH-ubiquinone oxidoreductase 51 kDa subunit (Complex I) co-suppression on maize N metabolism and grain yield.
| Complex I Expression | NADH | Nitrate Metabolism | Yield Parameters | |||||
|---|---|---|---|---|---|---|---|---|
| Leaf (V9) | Root (V2) | nmole 10 Punches−1 | NRA (in vitro) nmole h−1 5 disc−1 | NRA (in vivo) nmole h−1 5 disc−1 | Kernel Wt (mg) | Kernel Number Plant−1 | Grain Yield kg ha−1 | |
| Transgene | 0.63 b | 2.09 | 1.27 a | 578.6 | 677 a | 250.9 | 559 a | 4886.0 a |
| Null | 1.04 a | 2.06 | 1.01 b | 603.2 | 552 b | 248.9 | 526 b | 4581.5 b |
| P > F | <0.01 | NS | <0.01 | NS | <0.01 | NS | <0.01 | <0.01 |
Hybrid containing NADH-ubiquinone oxidoreductase 51 kDa subunit (Complex I) co-suppression transgene event, 1.19, was compared to the null (non-transgenic) hybrid. Means with a different letter are significantly (LSD < 0.01) different.
© 2018 by the authors. Licensee MDPI, Basel, Switzerland. This article is an open access article distributed under the terms and conditions of the Creative Commons Attribution (CC BY) license (http://creativecommons.org/licenses/by/4.0/).
Share and Cite
MDPI and ACS Style
Loussaert, D.; Clapp, J.; Mongar, N.; O’Neill, D.P.; Shen, B. Nitrate Assimilation Limits Nitrogen Use Efficiency (NUE) in Maize (Zea mays L.). Agronomy 2018, 8, 110. https://doi.org/10.3390/agronomy8070110
AMA Style
Loussaert D, Clapp J, Mongar N, O’Neill DP, Shen B. Nitrate Assimilation Limits Nitrogen Use Efficiency (NUE) in Maize (Zea mays L.). Agronomy. 2018; 8(7):110. https://doi.org/10.3390/agronomy8070110
Chicago/Turabian StyleLoussaert, Dale, Josh Clapp, Nick Mongar, Dennis P. O’Neill, and Bo Shen. 2018. "Nitrate Assimilation Limits Nitrogen Use Efficiency (NUE) in Maize (Zea mays L.)" Agronomy 8, no. 7: 110. https://doi.org/10.3390/agronomy8070110
Note that from the first issue of 2016, this journal uses article numbers instead of page numbers. See further details here.