Mapping Quantitative Trait Loci for Agronomic Traits in Winter Wheat under Different Soil Moisture Levels


1
Faculty of Agriculture, Alexandria University, 23714 Alexandria, Egypt
2
Department of Soil & Crop Sciences, CD 1170, Colorado State University, Fort Collins, CO 80523, USA
*
Author to whom correspondence should be addressed.
Agronomy 2018, 8(8), 133; https://doi.org/10.3390/agronomy8080133
Submission received: 1 July 2018
/
Revised: 23 July 2018
/
Accepted: 29 July 2018
/
Published: 31 July 2018
(This article belongs to the Special Issue Quantitative Trait Locus Mapping for Crop Plants)
Abstract
:Due to variable moisture conditions in the U.S. Great Plains, it is important to understand genetic control of crop traits under a range of soil moisture levels. Our objective was to identify quantitative trait loci (QTL) for yield, phenology, and morphological traits in wheat (Triticum aestivum L.) under different soil moisture conditions. Field evaluation of a winter wheat doubled haploid population (n = 185) derived from a cross between CO940610 and ‘Platte’ was carried out in Fort Collins and Greeley, Colorado, USA in 2007–2008 and 2008–2009, respectively. At each location, trials were grown under moderate drought stress and fully irrigated conditions. A total of 33 QTL for 11 traits was detected in two or more environments. A cluster of QTL for nine traits was found on chromosome 2B in the vicinity of the photoperiod response gene Ppd-B1. Other stable QTL clusters were detected on chromosome 6A and near the vernalization response gene Vrn-D3 on chromosome 7D. A QTL for grain yield on chromosome 5A was detected in three environments. With minor exceptions, the large-effect QTL were detected in both the water limited and fully irrigated environments, rather than being detected only under specific moisture levels.
1. Introduction
Wheat (Triticum aestivum L.) is among the world’s most important food crops, accounting for about one-fifth of the calories in the human food supply [1]. Because it is grown in many arid and semi-arid regions, including the U.S. Great Plains, wheat productivity is often limited by drought stress (insufficient soil moisture resulting in growth reduction and injury) [2,3]. Improvement of yield and yield components, especially under water deficit, is challenging, as they are complex traits influenced by many genes and environmental factors.
Wheat is a hexaploid species (2n = 6x = 42, genome AABBDD) with a large genome size (15.960 Mb) [4], placing it among the most difficult crops for genetic analysis. However, DNA molecular markers have facilitated the dissection of complex traits in wheat using quantitative trait locus (QTL) analysis [5]. Microsatellites, also known as simple sequence repeats (SSR), have several advantages as markers for QTL detection in wheat. They detect a high level of polymorphism because they target highly variable regions of the genome. High-density genetic maps based on SSR have been published for wheat [6,7], and SSR have been widely used in wheat for QTL detection [8]. Another marker technology, Diversity Array Technology (DArT), detects and genotypes large numbers of DNA variants [9], and has been used in previous QTL studies in wheat [10,11,12]. Doubled haploid (DH) technology facilitates the accelerated production of homozygous lines that can be planted in replicated trials in multiple environments. DH populations have been used in several wheat mapping studies (e.g., [12,13,14]).
Flowering time in wheat is known to be affected by a number of genes, and depending on environmental conditions, these genes may be important in determining yield. The genes include vernalization response genes (Vrn), photoperiod response genes (Ppd), and ‘earliness per se’ (Eps) developmental rate genes [15]. The Vrn loci and their chromosome locations are as follows: Vrn-A1, 5AL [16]; Vrn-B1, 5BL [17]; Vrn-D1, 5DL [18]; Vrn-B3, 7BS [19]; and Vrn-D3, 7DS [20]. The genes known to affect photoperiod response are Ppd-A1, Ppd-B1, and Ppd-D1, which are located at homoeologous positions of group 2 chromosome short arms [21]. Eps genes have been reported on chromosomes 2BL, 3A, 4B, 4D, and 6B [22]. The detection of QTL clusters for yield and yield component traits on various chromosomes has been reported by many authors [23,24,25,26,27,28,29,30,31,32]. For example, Quarrie et al. [29] identified 17 yield QTL under a wide range of water stress conditions. Their yield QTL clusters coincided with major genes regulating plant height (Rht-B1 on chromosome 4BS), vernalization (Vrn-A1 and Vrn-D1), and photoperiod sensitivity (Ppd-B1 and Ppd-D1). It is not known which combination of alleles at these loci is most favorable for winter wheat in Colorado.
Our objectives in this study were (1) to evaluate a DH mapping population for phenology, agronomic and drought tolerance traits in environments differing in soil moisture, and (2) to conduct QTL analysis to locate and estimate the size of genes controlling those traits and their stability across environments, using a previously published molecular marker linkage map.
2. Materials and Methods
2.1. Plant Material
A mapping population of 185 DH lines was derived by crossing CO940610 (as the female parent) and ‘Platte’ (PI 596297). A detailed description of population development is included in [33]. Briefly, CO940610 is a hard white winter wheat experimental line developed by the Wheat Breeding Program at Colorado State University (CSU). It has yielded well in dryland environments and has superior pre-harvest sprouting tolerance, but inferior bread making quality. Platte is a hard white winter wheat developed by HybriTech Seed International (formerly a division of Monsanto, St. Louis, MO, USA, and now out of business). It is well adapted to production under irrigation and has excellent bread making quality, but poor pre-harvest sprouting tolerance. QTL detected for bread making quality traits in this same population were reported in [34].
2.2. Field Trials
The DH lines along with each parent and two check cultivars (Ripper, PI 644222 [35] and Lakin, PI 617032) were included in the field evaluations. Trials were evaluated at two sites in Colorado: CSU’s Agricultural Research, Development, and Education Center (40.652 N, 104.996 W, elevation 1558 m) in Fort Collins in 2007–2008 and the USDA-ARS Limited Irrigation Research Farm (40.449 N, 104.638 W, elevation 1427 m) in Greeley in 2008–2009. Entries were randomized in two replications of an incomplete block Latinized row-column design generated with CycDesign 3.0 (CycSoftware Ltd., 2006, Naseby, New Zealand). Two side-by-side trials were grown in each location. One trial (designated the “wet” trial) was grown with regular irrigation to avoid drought stress. The adjoining trial (designated the “dry” trial) was grown under moderate water limitation with less supplemental irrigation during stem elongation and no irrigation post-anthesis. Thus, there were a total of four environments for the two years of field evaluations. In Fort Collins, a linear overhead sprinkler system was used to irrigate the trials; the wet treatment received a total of 243 mm of irrigation plus rainfall from March 1, when growth began after winter dormancy, and the dry treatment received 135 mm. In Greeley, a drip irrigation system plus rainfall provided 259 mm of water to the wet treatment, whereas the dry treatment received 195 mm. Seeds were sown at a density of 1,700,000 seeds ha−1 in 2-row plots 3.88 m long, with 23 cm spacing between rows and 28 cm between plots.
Data for days to heading (Dth), days to physiological maturity (Dpm), plant height (Plht), leaf length (Ll), leaf width (Lw), spike length (Sl), and grain yield (Gy) were recorded from whole plots. Dth was the number of days from 1 January to the date on which 50% of the spikes had emerged above the flag leaf collar. Dpm was the number of days from 1 January until 50% of the peduncles had turned yellow. Grain filling duration (Gfd) was calculated by subtracting Dth from Dpm.
Plht, Ll, Lw, and Sl were the means of five measurements per plot. Plht was measured as the distance from the ground to the tip of the spike excluding awns. Ll and Lw were measured on flag leaves; Ll was the length from leaf collar to leaf tip, and Lw was measured at the widest point. To determine the above ground biomass (Agb), harvest index (Hi), 1-m grain weight (1 Mg), and 200-kernel weight (200 Kwt), a 1-m strip of one row was sickled at ground level for each plot, dried at 40 °C for at least 3 days, and threshed with a stationary thresher. Agb was the dry weight of the 1-m strip, 1 Mg was the grain obtained from that biomass, and Hi was calculated as 1 Mg/Agb. 200 Kwt was the weight of 200 kernels from the 1 Mg sample. Grain filling rate (Gfr) was determined by dividing 1 Mg by Gfd.
To calculate grain yield (Gy), we divided grain weight obtained from a plot combine by plot area, then converted that value to kg ha−1. The method of [36] was used to calculate a drought susceptibility index (Dsi) from mean grain yield values. According to those authors, Dsi is defined as (1 − (Yd/Yw))/D where: Yd = mean yield of a given entry under drought stress; Yw = mean yield of that entry under well-watered conditions; and, D = environmental stress intensity = 1 − (mean yield of all entries under drought stress/mean yield of all entries under well-watered conditions).
Evaluation of pre-harvest sprouting (Phs), which can reduce the value of a farmer’s crop under wet conditions near harvest, was conducted following the method of [37]. Five heads per plot were harvested just as they reached physiological maturity. For each plot, 50 well-filled, defect-free seeds were placed on uniformly moist filter paper in petri dishes, then incubated in a growth chamber at 20 °C with a 12 h light/12 h dark photoperiod. Germinated seeds were counted each day for 7 days and expressed as a weighted germination index. The maximum index value is 1.0 if all seeds have germinated by day 1, while lower values imply increasing degrees of grain dormancy or reduced germinability.
Normalized difference vegetation index (NDVI) was measured only in 2008–2009 in Greeley during early grain filling to evaluate vegetation cover and biomass production using a GreenSeeker (RT200, NTech industries, Ukiah, CA, USA) [38]. The instrument sensor had an angle of 19 degrees on the walking direction, so that only the two rows of a plot were in the field of view of the sensor. The NDVI was calculated as (R900 − R680)/(R900 + R680) according to [39], where Rn is the reflectance at the indicated wavelength in nm.
2.3. Phenotypic Data Analysis
Analysis of variance was conducted with PROC MIXED of SAS 9.1 (SAS Institute, Cary, NC, USA) to determine the significance of sources of variation and to calculate best linear unbiased predictions (BLUPs) for each entry. To adjust for spatial variation, row, row-column, and anisotropic adjustments were evaluated to determine the best method based on the lowest value of the Akaike’s information criterion, as described by [40]. Entries, replications, and spatial adjustment factors were considered random factors. Pearson correlation coefficients among BLUPs for all traits were obtained with the CORR procedure of SAS. PROC GLM was used to estimate the broad-sense heritability from the analysis of variance [41]. The method of [42] was used to determine exact 90% confidence intervals for heritability.
2.4. Molecular Marker Genotyping
DNA was extracted and purified from the DH lines and the two parents using a wheat extraction protocol [43] with slight modifications. The USDA-ARS Regional Small Grains Genotyping Laboratory (Fargo, ND, USA) screened parental DNA for SSR polymorphisms. Polymorphic markers, along with several sequence-tagged site (STS) markers (PPO33 [44], Sr24 [45], and Vrn-D3 [20]) were then evaluated in the whole population. To obtain DArT marker genotypes, DNA of the population and parents was sent to the Diversity Array Company Ltd. in Yarralumla, ACT, Australia [46]. DArT markers with ambiguous parental scores or low polymorphic information content values were deleted from the data set. The complete data set consisted of 462 markers, which included 149 SSR, 305 DArT, 3 STS, and 5 protein markers (Glu-A1, Glu-B1, Glu-D1, Glu-B3, and Glu-D3).
2.5. Map Construction and QTL Mapping
Construction of linkage maps based on the Haldane mapping function was described in [34], and the maps were drawn using the software MapChart 2.2 [47]. QTL detection was performed with Windows QTL Cartographer version 2.5_001 (North Carolina State University, Raleigh, NC, USA) [48] Composite interval mapping (CIM) analysis was conducted using forward and backward step-wise regression and the parameter setup of “model 6 standard analysis”, with 5 control markers, and a window size of 10 cM. To determine the appropriate logarithm of odds (LOD) significance threshold for the presence of a QTL, permutation analysis (n = 1000) was conducted for each trait in each environment to obtain a 0.1 genome-wise probability level of a Type I error in this data set. The QTL were designated as QX.cob-Y, where X is the phenotypic trait abbreviation, cob indicates Colorado, Byrne lab, and Y is the chromosome on which the QTL was detected. For each QTL, a 1-LOD support interval, based on a decrease of 1 LOD unit from the peak LOD score, was determined and the markers bracketing that interval are reported.
3. Results
3.1. Trait Means, Heritability Estimates, and Correlation Analysis
Observation of BLUP frequency distributions indicated that most traits were normally or approximately normally distributed. Transgressive segregation was common for all traits. For example, for 200 Kwt in Fort Collins wet, CO940610 and Platte had mean values of 7.98 and 6.89 g, respectively, whereas the DH lines ranged from 5.31 to 10.53 g (Table 1 and Table S1). In general, mean values for the wet treatment were higher (p < 0.05) than for the dry treatment. Exceptions were Sl and 200 Kwt in 2007–2008 and Sl, 200 Kwt, and NDVI in 2008–2009 (Table 1). DH lines grown under the fully irrigated treatment had higher Gy than those grown under limited irrigation: 3719.7 kg ha−1 vs. 2923.9 kg ha−1 in 2008, and 3760.9 vs. 3056.9 kg ha−1 in 2009. The percent reduction in Gy between the two treatments was 21.4% and 18.7% in 2008 and 2009, respectively. Therefore, the degree of water stress in the limited irrigation treatment was moderate rather than severe. Phs was only measured under full irrigation, with an overall mean index for the population of 0.65 in 2008 and 0.46 in 2009, with higher values indicating more sprouting.
Within environments, there was significant variation among DH lines for most traits. The DH lines varied for Gy over ranges of 2261.3 to 3839.5 kg ha−1, and for Plht over ranges of 16 to 29 cm, even though neither of the common semi-dwarfing genes, Rht-B1 and Rht-D1, were polymorphic between the two parents [49]. CO940610 yielded more and had taller plants in all environments compared to Platte. On the other hand, Platte had greater values for Ll, Lw, and Sl in all environments (Supplementary Table S1).
Heritability estimates of agronomic traits ranged from 0.115 for Agb in Greeley wet to 0.938 for Dth in Greeley dry [50]. Dth had the highest heritability estimate of all traits in the four environments (0.87 to 0.94), with an overall estimate of 0.96 (Table 1). The estimate for Gy was moderate (0.63). For traits measured in all four environments, Agb had the lowest heritability estimate (0.43). Phs and NDVI, evaluated in just two environments, had very low estimates of 0.29.
Significant correlations among many characteristics were observed (Supplementary Tables S2 and S3). Generally, phenological parameters, including Dth, Dpm, Gfd, and Gfr, were highly correlated with each other (p < 0.05) under different moisture levels at the two locations. Dth was positively correlated with Dpm (r = 0.62 to 0.73, p < 0.01), and was negatively correlated with Gfd (r = −0.92 to −0.52, p < 0.01) in all environments. Gy was negatively correlated with Dth (r = −0.37 to −0.18, p < 0.05), and positively correlated with Plht (r = 0.19 to 0.35, p < 0.05) and 200 Kwt (r = 0.19 to 0.35, p < 0.05). Plht and Agb were positively correlated in all environments (r = 0.27 to 0.45, p < 0.01). Hi was positively correlated with Gy (r = 0.21 to 0.48, p < 0.01) in all four environments, but was negatively correlated with Plht in three environments (r = −0.19 to −0.11, p < 0.05). Dsi in Fort Collins and Greeley was negatively correlated with Gy under limited irrigation (r = −0.63 to −0.51, p < 0.01, data not shown), indicating that under drought stress lower yielding lines lost a proportionally lower amount of grain than higher yielding lines. In well-watered conditions Dsi correlated positively with Gy only in Fort Collins (r = 0.37, p < 0.01), showing the opposite relationship as was seen under the dry conditions. NDVI was significantly (p < 0.01) correlated with Gy in both wet and dry conditions in Greeley (r = 0.29 to 0.48, p < 0.01).
3.2. Marker Analysis and Map Construction
The total marker data set included 149 SSR, 305 DArT, three STS, and five glutenin protein markers [34]. After removing markers <1 cM apart, the linkage map included 250 markers: 128 SSR, 114 DArT, three STS, and five protein markers. The map spanned a distance of 2121 cM, covering 82.6% of the wheat genome relative to the SSR consensus map of [7], with 34 linkage groups representing the 21 chromosomes. The complete map showing all linkage groups was presented in [34]. The densest map was for chromosome 5B with 23 markers, whereas only four were mapped on chromosome 4B. The average map length was 101 cM/chromosome with an average distance between markers of 8.48 cM. The A genome covered a total of 623.4 cM with 32.8% of the markers mapped, whereas, 44.8% of the markers covered a distance of 978.5 cM on the B genome. The D genome had the lowest map distance and number of markers (518.6 cM and 22.4%, respectively).
3.3. QTL Analysis
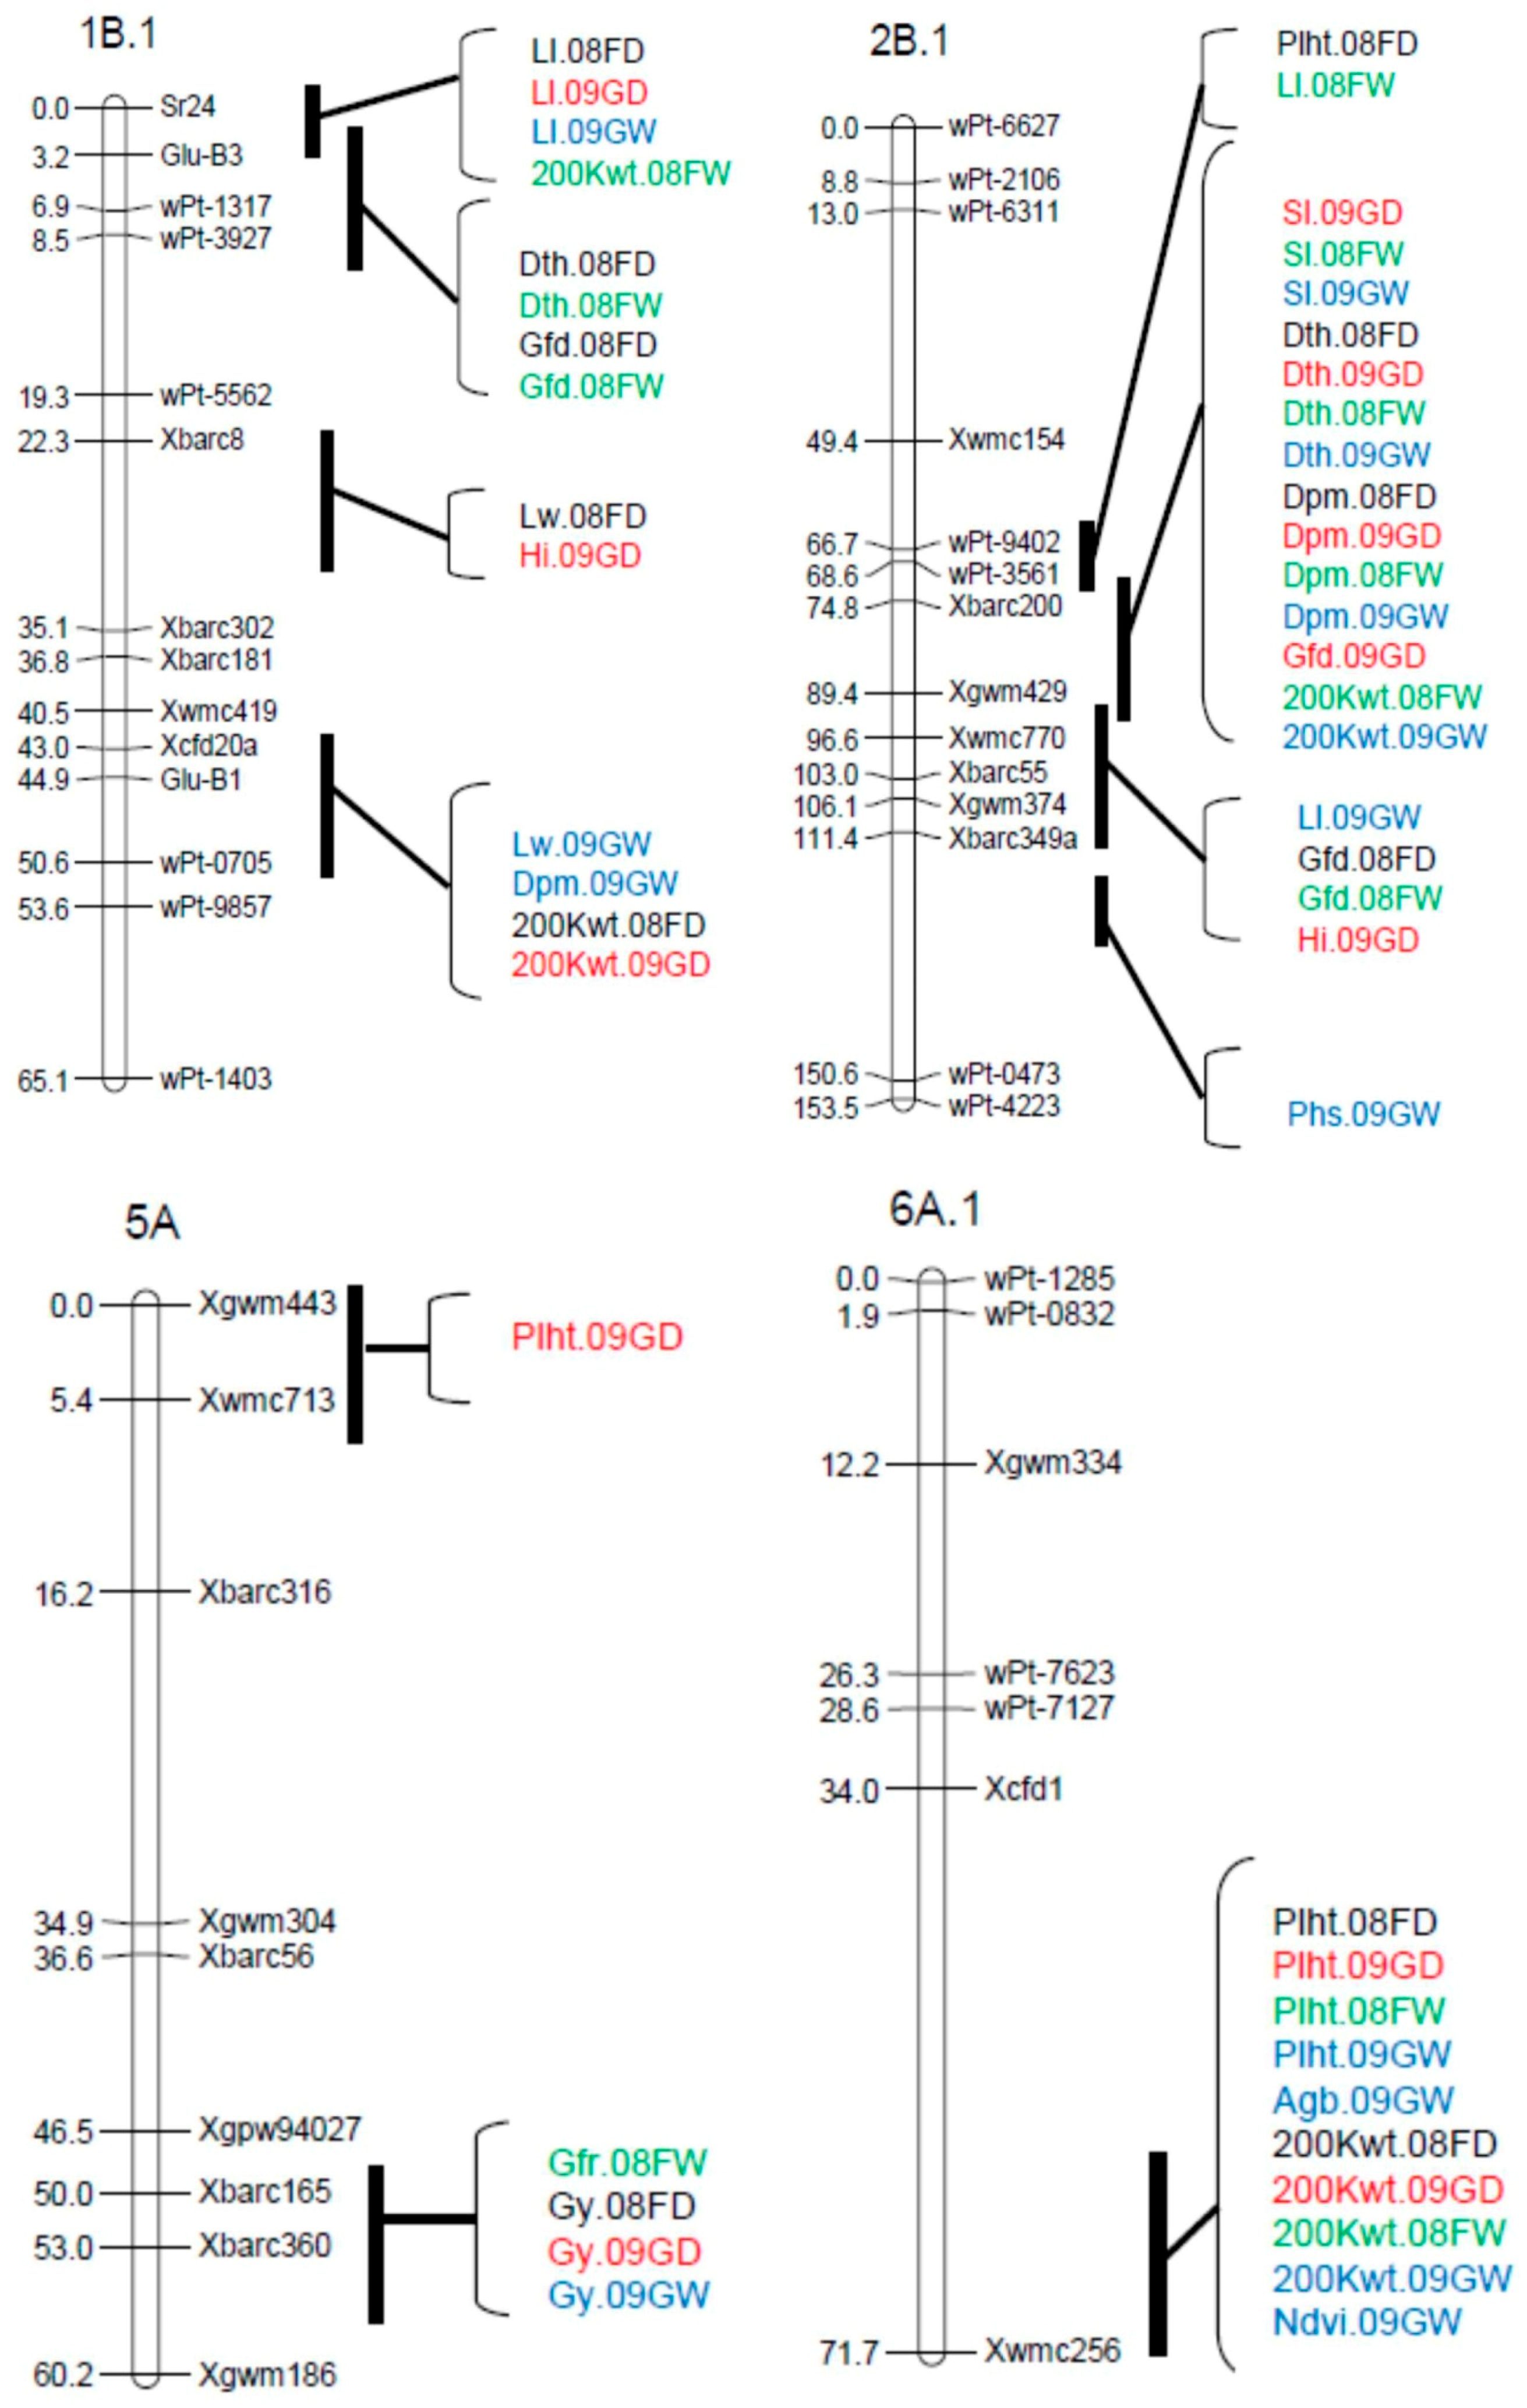
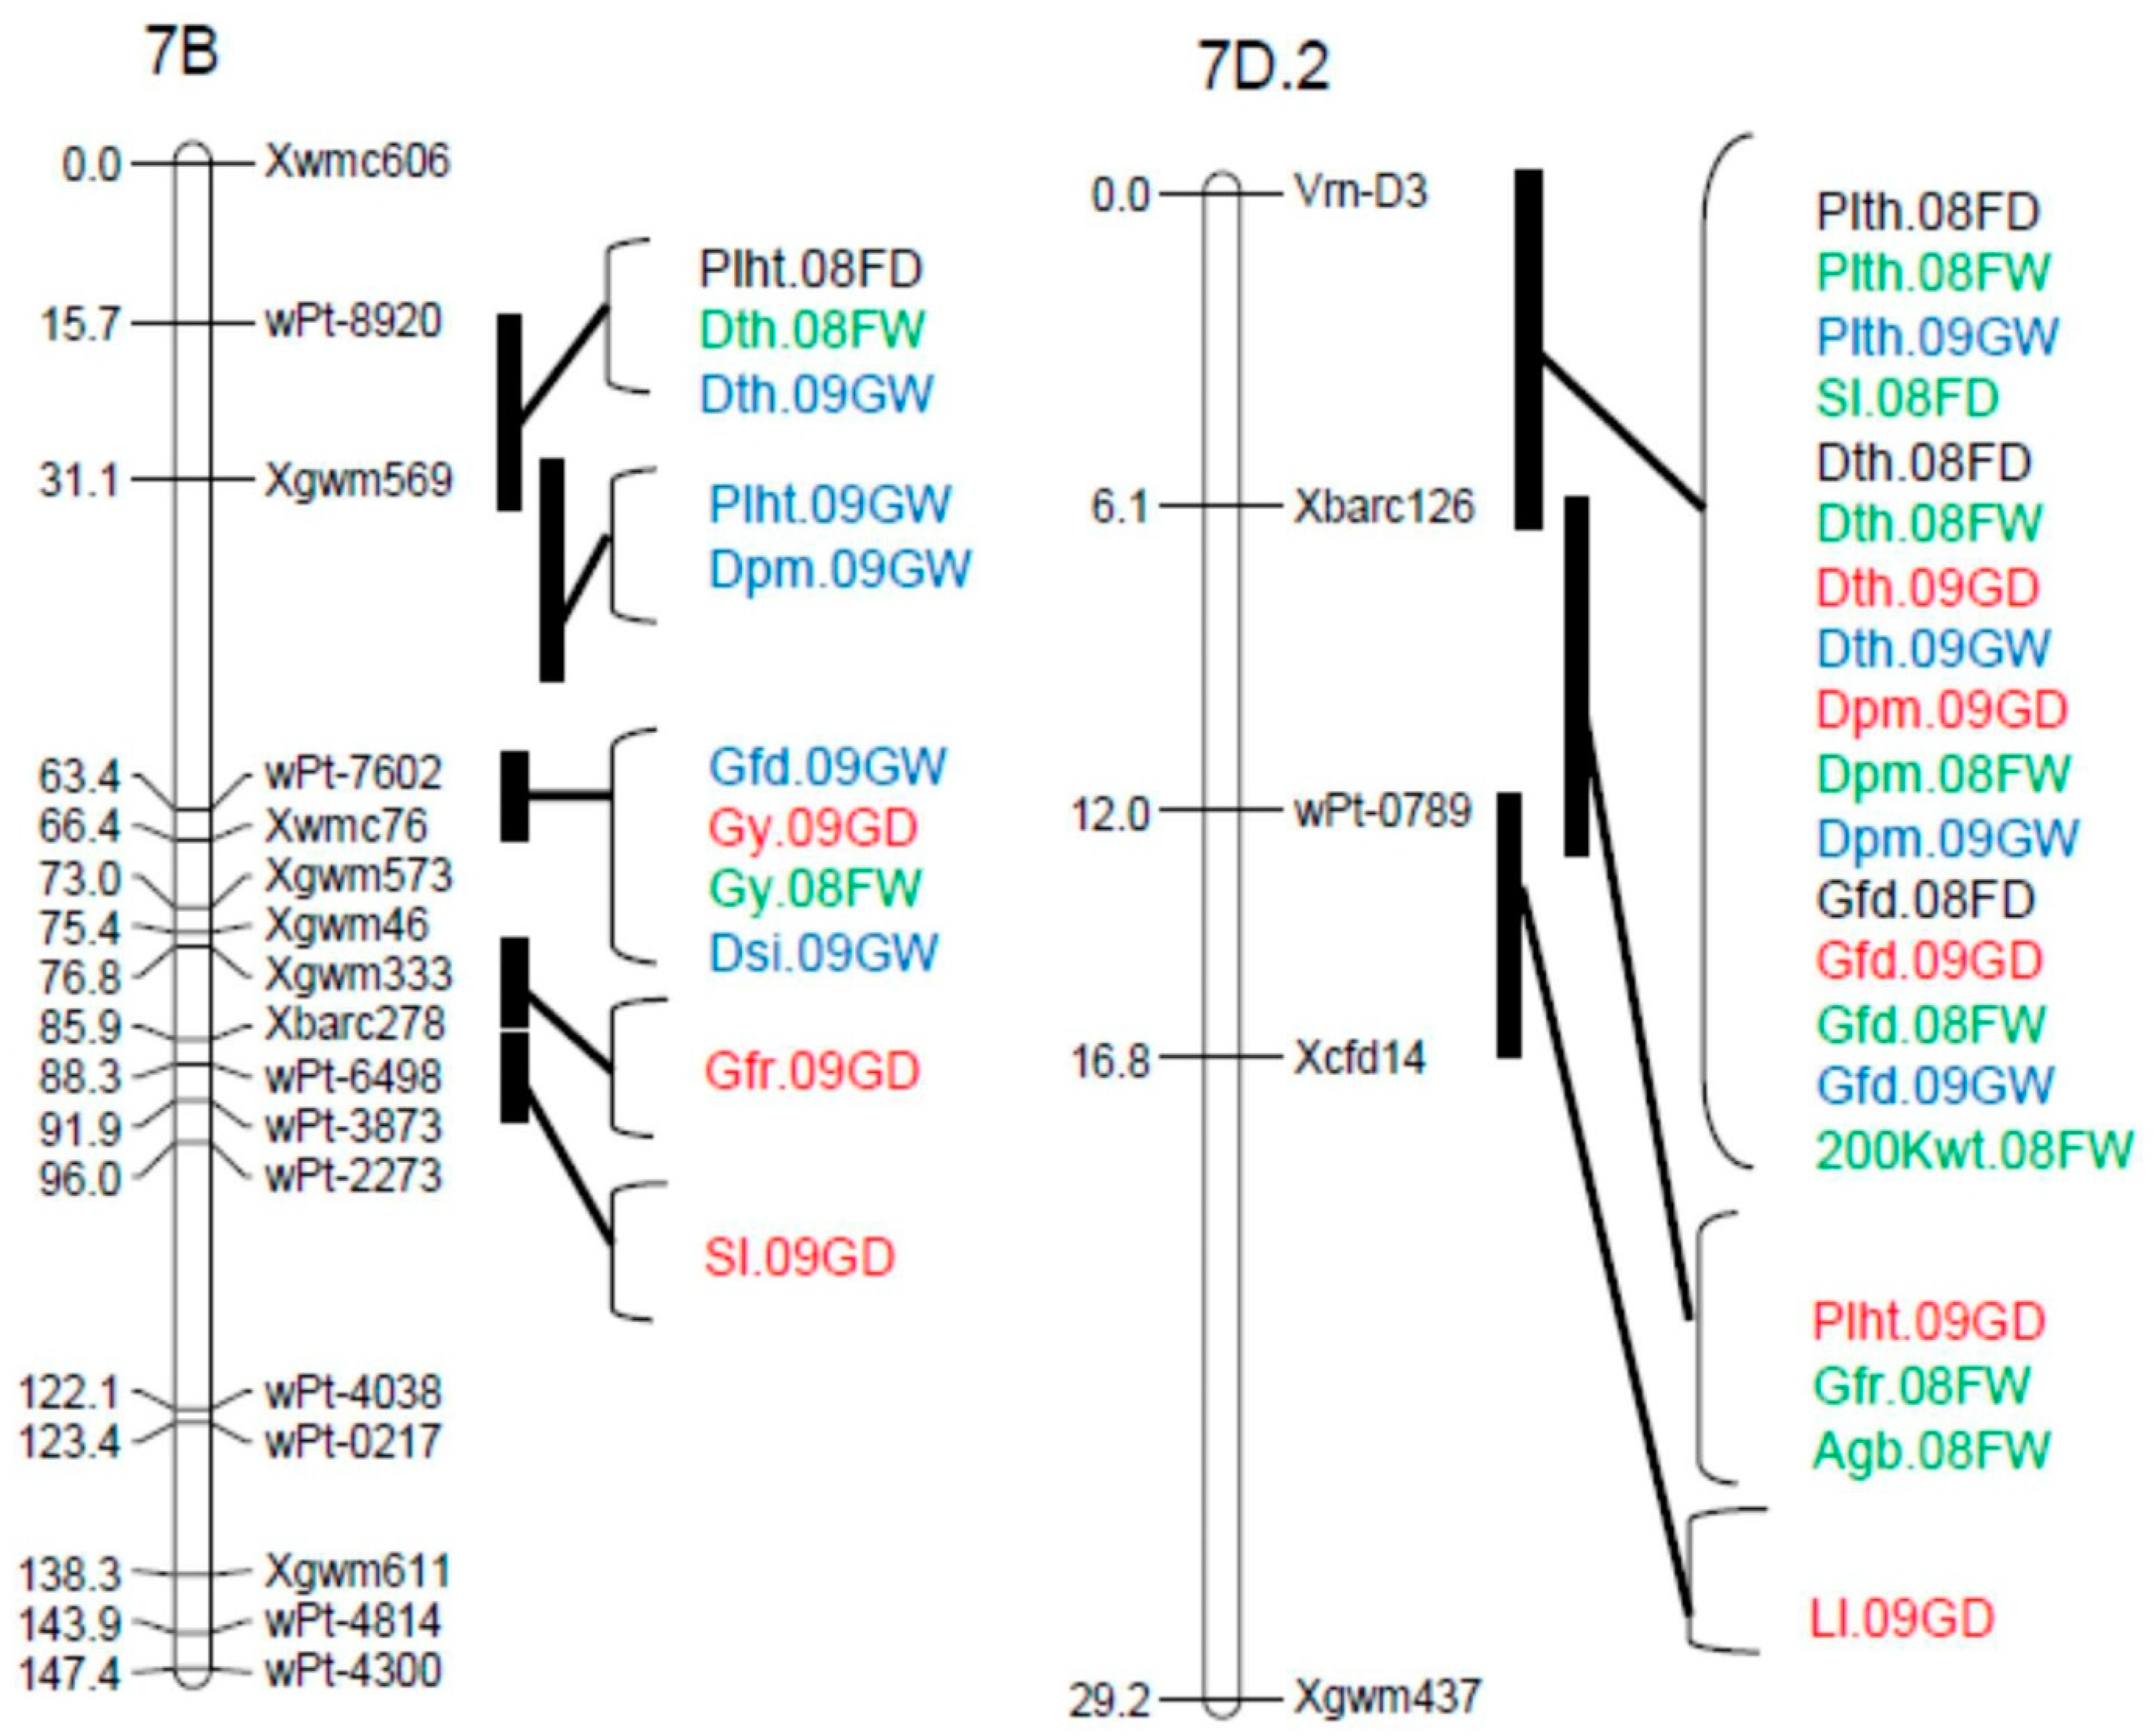
A total of 80 QTL were detected across the four environments for the 15 traits analyzed, with QTL detected on 21 of the 34 linkage groups (Table 2). The chromosomal locations of the most prominent QTL clusters are shown in Figure 1. For all categories of traits, QTL frequency was highest in the B genome with 38 QTL (47.5%). Another 20 (25.0%) of the QTL were detected in the A genome and 22 (27.5%) in the D genomes. QTL distribution was balanced between the full and limited irrigation treatments. There were 25 QTL detected in one or both dry treatments; 21 QTL detected in one or both wet treatments; 28 QTL detected in both wet and dry conditions; 4 QTL identified for Phs, which was only evaluated in wet environments; and 2 QTL detected for Dsi, which used data from both treatments. The greatest number of QTL (10) was identified for Sl, while the lowest number (2) was detected for NDVI and Dsi.
Four morphological traits were measured in this population: Plht, Ll, Lw, and Sl. Twenty-eight QTL were detected for these traits in the four environments (Table 2; Figure 1). Plht was influenced by nine QTL distributed over eight chromosomes. The Plht QTL detected on chromosomes 3A, 6A.1, and 7D.2 were consistent over environments and explained up to 20.4% of the phenotypic variation. A QTL for Ll, designated QLl.cob-1B.1, was detected in three environments and explained up to 11.5% of the phenotypic variation. Another QTL, QLl.cob-6B.1, was detected in two environments, accounting for an average of 8.2% of the variation. Lw had the lowest number of QTL among the morphological traits (3), located on chromosomes 1B.1, 2D.2, and 4A.1. The 1B.1 QTL was detected in two environments. Ten QTL influencing Sl were detected under different soil moisture levels, individually accounting for 4.2% to 15.2% of the phenotypic variation. The QTL on chromosomes 1A.1 and 2B.1 were consistently identified in four and three environments, respectively, but six other QTL were only detected in a single environment.
Four phenological parameters were evaluated in this population: Dth, Dpm, Gfd, and Gfr. With the high level of correlation seen between most of these traits, it was predicted that many QTL would be co-located, and this did occur, notably on chromosomes 1B, 2B, and 7D (Table 2). Two QTL for Dth (QDth.cob-2B.1 and QDth.cob-7D.2) were detected in all environments, with the allele for later maturity coming from CO940610 for the 2B QTL and from Platte for the 7D QTL. The QTL on 7D near Vrn-D3 had the largest effect on Dth, explaining up to 38.8% of the phenotypic variation. QDth.cob-2B.1 in the vicinity of Ppd-B1 also had a major effect, explaining from 20% to 23% of the phenotypic variation in the four environments. These same two genomic regions also contained the most important QTL for Dpm and Gfd (Table 2). The QTL for Gfr were less consistent, being detected only in single environments and accounting for less of the variation (maximum of 10.3%).
Four yield-related traits were measured in this population (Gy, Agb, Hi, and 200 Kwt), for which a total of 21 QTL were identified across all environments (Table 2). Most of the detected QTL for these traits had negative additive effects, indicating the association of Platte alleles with lower trait values and the CO940610 allele with higher values. Four QTL were detected for Gy, accounting for 6.2% to 13.7% of the phenotypic variation. One of these (QGy.cob-5A) was identified in three environments, with the positive effect allele coming from Platte. The highest number of QTL among yield-related traits was for 200 Kwt, for which nine QTL were detected under different soil moisture levels and individually explaining 4.3% to 14.5% of the phenotypic variation. Q200Kwt.cob-6A.1 was consistent across the four environments and showed positive additive effects for the CO940610 allele in all cases.
Two QTL for Dsi were detected in Greeley on chromosomes 5B and 7B, and explained 11.5% to 11.9% of the phenotypic variation, respectively (Table 2). CO940610 contributed the favorable allele at both QTL (i.e., the allele that decreased the value of Dsi).
Phs was only evaluated under the full irrigation treatment at both locations. A total of four QTL were detected in 08FW and 09GW and explained 5.8% to 10.4% of the phenotypic variation (Table 2). CO940610 contributed the favorable allele, reducing the Phs index at each of these loci.
NDVI was only measured in both treatments of the 2009 growing season. One QTL was detected in each treatment, each on a different chromosome, and explained 5.9% to 7.6% of the phenotypic variation (Table 2).
4. Discussion
4.1. Trait Means, Heritability Estimates, and Correlation Analysis
The effect of drought stress in our study was evaluated by two side-by-side trials (full and limited irrigation) at two Colorado locations, for a total of four environments. Mean Gy under drought stress was reduced by 21.4% at Fort Collins and 18.7% at Greeley (Table 1). Agb also declined, by 19.0% at Fort Collins and 13.4% at Greeley. However, 200 Kwt increased at Fort Collins (7.24 g dry vs. 7.13 g wet, p < 0.05) and did not differ significantly at Greeley (7.30 g wet vs. 7.22 g dry, p > 0.05), indicating that the yield reduction was due to fewer kernels rather than smaller kernels. Most of the phenological parameters were negatively correlated with Gy under both moisture treatments, in agreement with results of [51]. Later flowering lines entered the grain filling period during a drier, warmer time of the season, and suffered yield reductions as a result.
Heritability estimates varied considerably from trait to trait. In general, the heritability estimates were moderate to low, with the exception of Dth, Dpm, Plht, and 200 Kwt. Agb had the lowest heritability estimate, most likely due to the high variability in sample collection. Dth had the highest heritability values, because it can be evaluated relatively precisely, and it depends largely on a small number of major genes controlling sensitivity to photoperiod and vernalization requirements [11]. Low heritability estimates for some of the agronomic traits in our study indicate that a major part of their expression is controlled by the environment, thus making it difficult to make progress through selection in a breeding program. Gy typically has a low heritability, especially under drought stress, and is significantly influenced by the environment [13,52,53,54,55]. However, in our study heritability estimates for Gy had moderately high values of 0.57 to 0.68 in the four environments. High estimates of heritability provide evidence for a relatively smaller effect of the environment and predictable genotype-by-environment interaction [49]. Our results are similar to those of [32], who reported high heritability (>0.70) for Dth, Plht, and test weight, and moderately high estimates (0.40–0.70) for Gy and Hi in a wheat QTL study under different moisture levels.
4.2. QTL Mapping
4.2.1. QTL Distribution
Distribution of QTL was balanced between the full and limited irrigation treatments. For traits measured in both moisture conditions, 21 QTL were detected only under full irrigation, 25 only under limited irrigation, and 28 under both conditions. Of the total number of 80 QTL, 47 (58.8%) occurred in only a single environment and 33 (41.2%) were found in multiple environments. Of those with more than one occurrence, only five were identified only under wet or only under dry conditions. For some traits (Dth, Dpm, Gfd, Plht, Sl, and Gy), many QTL, especially those with large effects, were detected in both wet and dry conditions and the parental source of the positive allele was consistent in both moisture treatments Table 2). Thus, it was difficult to associate a QTL consistently with a specific moisture treatment, perhaps because the level of water stress in our study (average of 20% yield reduction) was moderate rather than severe.
4.2.2. Phenological Parameters
Heading date is an important trait for wheat breeders, especially where occurrence of drought is a concern. Optimum Dth allows the plant to escape drought and warmer temperatures later in the season, late frost, and other abiotic and biotic stresses to attain the desired yield level [56].
Thirty-four QTL were detected for phenological parameters with major and minor effects (Table 2 and Figure 1). QTL for Dth have been reported in several wheat populations [26,30,57,58,59]. Two major QTL detected for Dth in our study were consistent across environments. They were designated QDth.cob-2B.1 and QDth.cob-7D.2, and explained from 20.0% to 38.8% of the phenotypic variation. The major QTL on 2B.1 was observed within the wPt-3561–Xgwm429 interval (Figure 1). This QTL seems likely to coincide with the well characterized photoperiod response gene Ppd-B1, which is polymorphic between this population’s parents. Platte possesses the photoperiod insensitive allele Ppd-B1a, whereas CO940610 has the sensitive allele Ppd-B1b [49]. The important effect of this locus on heading date has been reported by several researchers [15,31,58,59,60,61,62,63,64]. Reference [49] found that the major determinants of heading date in Great Plains wheat were Ppd-B1, Ppd-D1, and their interaction. In our environments, the insensitive Ppd-B1a allele was generally favorable, resulting in greater 200 Kwt and reduced Dth. Earlier heading is often an advantage in Colorado (barring late spring frosts) because it moves anthesis and early grain-filling to cooler points of the growing season. In all environments, the QTL QDth.cob-7D.2 was detected on chromosome arm 7DS (Figure 1). This location is consistent with the vernalization response gene Vrn-D3 described by [20], and is supported by the presence of different alleles at this locus (Vrn-D3a in CO940610 and Vrn-D3b in Platte; this study). The Platte allele was associated with later heading, greater Plht, and longer Sl, but reduced 200 Kwt, indicating that the CO940610 allele is generally favorable at this locus. A minor QTL, designated QDth.cob-2A, was detected in three environments, with a map position that roughly coincides with the position of Ppd-A1, which is homoeologous with Ppd-B1 and Ppd-D1 [58,59,62]. However, [49] reported the same allele at Ppd-A1 for Platte and CO940610.
Earliness per se genes have been reported to map to chromosome groups 2 and 4, as well as to chromosomes 3A, 6B, and 7B [23]. QTL for Dth in our study mapped to the same chromosomes and coincided with QTL for other phenological parameters. Several QTL for phenological parameters in this study were detected on chromosome 7BS (Figure 1). Reference [15] reported a major early flowering QTL on chromosome 7BS. In the same region, a photoperiod QTL associated with heading date under short days was mapped by [62].
4.2.3. Morphological Traits
Forty-four QTL were detected for morphological traits with major and minor effects in the four environments (Table 2, Figure 1). Previous studies have reported QTL for Plht on most wheat chromosomes [26]. Apparently, all QTL for Plht identified in our population have been reported previously (Table 2). Dwarfing genes reduce plant height, increase the lodging resistance, and often increase yield in wheat [40,65]. Several Rht genes have been identified, of which the most commonly used are the semi-dwarfing genes Rht-B1b and Rht-D1b on chromosomes 4B and 4D, respectively. CO940610 and Platte carry the same alleles at those loci (Rht-B1b and Rht-D1a; [49]), and therefore, QTL were not detected in those regions. Two major QTL, designated QPlht.cob-6A and QPlht.cob-7D.2, explained 7.2% to 26.1% of the phenotypic variation, were consistent in all environments, and appear to be coincident with QTL reported in previous studies [20,30,53,56]. Furthermore, QPlht.cob-7D.2 seems likely to be co-localized with vernalization locus Vrn-D3 [20].
A QTL for Sl, designated QSl.cob-1A.1, was detected in all environments, explaining 5.6 to 15.5% of the phenotypic variation. It mapped near the high molecular weight glutenin subunit locus Glu-A1, a region that has been associated with Sl in several populations [14,26,30,57,66]. Another QTL, designated QSl.cob-5B, had a moderate effect and was identified only in 08FW. A QTL for Sl on chromosome 5B was previously reported [30,66], but we could not determine whether it corresponded with QSl.cob-5B.
4.2.4. Yield and Yield Components
Forty-two QTL were detected for yield and yield components with major and minor effects in the four environments (Table 2, Figure 1). In previous studies, QTL for these traits were reported in different population types and multiple environments, and were distributed across most of the wheat genome [8,28,29,30,32,67,68]. QTL affecting several traits are common and may be due to pleiotropy or close linkage. Such QTL clusters for yield-related components were observed in our study on linkage groups 1B.1, 2B.1, 2D.1, 5A, and 6A. On chromosome 2D.1, QTL for Gy, Agb, and 200 Kwt were clustered in the interval wPt-0298–wPt-4413. Among these, the QTL for 200 Kwt and Agb were consistent in more than one environment.
There were two QTL for 200 Kwt, on chromosome 1B.1 and 3B.1, that were detected only in the dry treatment of both years and that explained 9.9% to 12.3% of the phenotypic variation for the trait. Both parents contributed the higher value allele at these loci, CO949610 on chromosome 1B.1 and Platte on chromosome 3B.1. QTL for Dth were not detected in these regions, suggesting that these effects on grain size are independent of heading date.
The most significant QTL identified for Gy in this study, QGy.cob-5A, was located on chromosome 5AL in the Xbarc165–Xbarc360 marker interval. It was consistent across three environments, was coincident with QTL for at least one yield component, and was detected in the vicinity of the vernalization gene Vrn-A1 on 5AL [25]. However, Vrn-A1 is not polymorphic in this population’s parents [49]. Chromosome 5A is known to carry a number of major QTL affecting yield and yield components and some of these occur in positions similar to ours [20,29,52]. The presence of the Platte allele at QGy.cob-5A increased Gy by 84 to 160 kg ha−1 (Table 2). However, for all the other Gy QTL, on chromosomes 2D, 5B, and 7B, the CO940610 allele was associated with higher yield.
4.2.5. Pre-Harvest Sprouting
A QTL for Phs, designated QPhs.cob-4A.1, was detected in marker interval Xwmc420-Xgwm165 in one environment and explained 10.4% of the phenotypic variation. CO940610 contributed the favorable allele for reducing Phs. Previous QTL studies have identified a highly significant QTL for Phs on chromosome 4A [37,69,70,71,72,73,74,75]. Our 4A QTL was detected near Xwmc40, as was reported by [72,73,74,75]. To our knowledge, the QTL detected on linkage group 4D.1 in one environment of our study, explaining 10.3% of the phenotypic variation, has not been reported previously.
4.2.6. Normalized Difference Vegetation Index
Based on our 2009 evaluation, we identified two QTL for NDVI, on chromosomes 2B and 6A, each in just one environment. These QTL had minor effects, consistent with the trait’s low heritability. A search for previously published QTL for NDVI revealed significant regions on eight chromosomes, but none were on chromosomes 2B or 6A [76,77,78,79]. Although the NDVI method may have potential for measurement of canopy biomass, leaf area index, light-absorption, and photosynthetic capacity [80], it will need to be evaluated with greater precision to be useful in breeding and genetic studies.
4.2.7. Drought Susceptibility Index
Only a limited number of studies have investigated Dsi via QTL analysis, especially in wheat. Reference [81] identified QTL for Dsi on chromosome 4A in a recombinant inbred line (RIL) wheat population, explaining from 13% to 48% of the phenotypic variation. In our study we identified QTL, designated QDsi.cob-5B and QDsi.cob-7B, in 2008–2009 with R2 values from 9.8% to 11.0%. CO940610 contributed the alleles that had the favorable effects on Dsi (i.e., reduced yield difference between the wet and dry treatments).
A QTL for Gy per se in the Greeley dry treatment was co-localized with the Dsi QTL on 5B (Figure 1). The CO940610 alleles increased Gy under limited irrigation and decreased susceptibility to drought, indicating that those alleles confer a relative yield advantage in drier but not wetter conditions. Another observation in that same region of chromosome 5B is that a QTL for Plht was detected in three of four environments (Figure 1). The CO940610 allele at that QTL increased Plht, suggesting that taller plants in this population had a relative yield advantage in drier conditions. However, none of the other Plht QTL co-localized with Gy QTL.
The Dsi QTL on chromosome 7B also coincided with a Gy QTL detected in the Greeley dry treatment, and again CO940610 provided the favorable alleles for both traits. QTL for Dpm and Gfd are located in the same chromosome region, but were only detected in the Greeley wet treatment, so are unlikely to account for the improved performance in drier conditions. A cluster of QTL for quality traits in the same population [34] was also detected in the same region. These traits included grain protein concentration, mixograph peak time, mixograph right slope, mixograph right width, flour color b, and grain ash concentration.
Considering (1) the detection of QTL for Dsi in Greeley, (2) their co-location with Gy QTL in one of the dry environments, and (3) the consistent direction of CO940610 allele effects at these loci, the two regions on chromosomes 5B and 7B may be the best candidates for location of drought tolerance genes. Validation of the 7B region, which is also of interest for a cluster of end-use quality QTL [34], has proceeded through evaluation of an independent RIL population developed from the same parents. The population was grown in irrigated and rainfed environments in 2009–2010, and the Gy QTL on 7B was confirmed in both environments [82]. However, the effect was small, with R2 values in the 2–3% range.
5. Conclusions
The Platte/CO940610 DH population was evaluated in field trials under well-watered and moderate water limitation (about 20% yield reduction) to identify QTL for phenological parameters, yield and yield components, NDVI, and Dsi. All agronomic traits showed considerable variation under both irrigation treatments. Overall, there were 80 QTL detected in the four environments, with approximately equal numbers of QTL detected in the full and limited irrigation treatments. Thirty-three QTL were detected in two or more environments, and 16 of these were identified in three or four environments. Many QTL for correlated traits were mapped in the same genomic regions, forming QTL clusters. Of special note were QTL clusters on chromosomes 2B and 7D, indicating the strong influence of the loci Ppd-B1 and Vrn-D3 on phenology and consequently on other agronomic traits. Because greater yield was correlated with earlier heading date, our results reinforce the importance of appropriate phenology for the growing environment and a suitable set of alleles at major phenology loci. In general, the favorable alleles at these loci appear to be the photoperiod insensitive Ppd-B1a allele from Platte and the Vrn-D3a allele from CO940610. With few exceptions, the large-effect, consistently detected QTL occurred in both the water stressed and well-watered environments, rather than being limited to a specific moisture regime. This study demonstrates that agronomic trait QTL expressed under well-watered conditions are also effective under moderate levels of water stress. Besides the phenology loci, other genomic regions suggested for further research include regions on chromosome 5A, 5B, 6A, and 7B.
Supplementary Materials
The following are available online at https://www.mdpi.com/2073-4395/8/8/133/s1, Table S1: Means of agronomic traits for the parents, CO940610 and Platte, under two irrigation levels in the 2007–2008 and 2008–2009 growing seasons. Table S2. Pearson correlation coefficients among agronomic characteristics of the CO940610/Platte population (n = 185) at Fort Collins under different irrigation levels in the 2007–2008 growing season. Values above the diagonal refer to the fully irrigated treatment and those below the diagonal refer to the limited irrigation treatment. Table S3. Pearson correlation coefficients among agronomic characteristics of the CO940610/Platte population (n = 185) at Greeley under different irrigation levels in the 2008–2009 growing season. Values above the diagonal refer to the fully irrigated treatment and those below the diagonal refer to the limited irrigation treatment.
Author Contributions
Conceptualization, P.F.B. and S.D.H.; Data curation, W.M.E.-F. and S.D.R.; Formal analysis, W.M.E.-F. and P.F.B.; Funding acquisition, P.F.B. and S.D.H.; Investigation, W.M.E.-F. and S.D.R.; Methodology, P.F.B. and S.D.R.; Supervision, P.F.B. and S.D.H.; Writing—original draft, W.M.E.-F.; Writing—review and editing, P.F.B., S.D.R. and S.D.H.
Funding
This work was supported by the USDA National Research Initiative grant 2006-55606-16629 (Wheat CAP), Agriculture and Food Research Initiative Competitive Grants 2011-68002-30029 (Triticeae-CAP) and 2017-67007-25939 (Wheat-CAP) from the USDA National Institute of Food and Agriculture, and by USDA Special Research Grants 2008-34205-19341, 2009-34205-19960, and 2010-34205-21350. We are also grateful for financial support of El-Feki’s graduate program from the Egyptian Ministry of Higher Education.
Acknowledgments
The authors are grateful to Guihua Bai, Shiaoman Chao, Mehdi Fazel-Najafabadi, Junhua Peng, and Xueyan Shan, John Stromberger, and Hong Wang for their technical assistance. We appreciate development of the DH population by Syngenta Cereals.
Conflicts of Interest
The authors declare no conflict of interest.
References
- Wheat. Wheat: Vital Grain of Civilization and Food Security; 2013 Annual Report; CGIAR Research Program on Wheat: Mexico City, Mexico, 2014. [Google Scholar]
- Weightman, R.M.; Millar, S.; Alava, J.; Foulkes, M.J.; Fish, L.; Snape, J.W. Effects of drought and the presence of the 1BL/1RS translocation on grain vitreosity, hardness and protein content in winter wheat. J. Cereal. Sci. 2008, 47, 457–468. [Google Scholar] [CrossRef]
- Peleg, Z.; Fahima, T.; Krugman, T.; Abbo, S.; Yakir, D.; Korol, A.B.; Saranga, Y. Genomic dissection of drought resistance in durum wheat x wild emmer wheat recombinant inbreed line population. Plant Environ. 2009, 32, 758–779. [Google Scholar] [CrossRef] [PubMed]
- Arumuganathan, K.; Earle, E.D. Nuclear DNA content of some important plant species. Plant Mol. Biol. Rep. 1991, 9, 208–218. [Google Scholar] [CrossRef]
- Doerge, R.W. Mapping and analysis of quantitative trait loci in experimental populations. Nat. Rev. Genet. 2002, 3, 43–52. [Google Scholar] [CrossRef] [PubMed]
- Roder, M.S.; Korzun, V.; Wendehake, K.; Plaschke, J.; Tixier, M.H.; Leroy, P.; Ganal, M.W. A microsatellite map of wheat. Genetics 1998, 149, 2007–2023. [Google Scholar] [PubMed]
- Somers, D.J.; Isaac, P.; Edwards, K. A high-density microsatellite consensus map for bread wheat (Triticum aestivum L.). Theor. Appl. Genet. 2004, 109, 1105–1114. [Google Scholar] [CrossRef] [PubMed]
- McCartney, C.A.; Somers, D.J.; Humphreys, D.G.; Lukow, O.; Ames, N.; Noll, J.; Cloutier, S.; McCallum, B.D. Mapping quantitative trait loci controlling agronomic traits in the spring wheat cross RL4452 x ‘AC Domain’. Genome 2005, 48, 870–883. [Google Scholar] [CrossRef] [PubMed]
- Wenzl, P.; Carling, J.; Kudrna, D.; Jaccoud, D.; Huttner, E.; Kleinhofs, A.; Kilian, A. Diversit Arrays Technology (DArT) for whole-genome profiling of barley. Proc. Natl. Acad. Sci. USA 2004, 101, 9915–9920. [Google Scholar] [CrossRef] [PubMed]
- Crossa, J.; Burgueno, J.; Dreisigacker, S.; Vargas, M.; Herrera-Foessel, S.A.; Lillemo, M.; Singh, R.P.; Trethowan, R.; Warburton, M.; Franco, J.; et al. Association analysis of historical bread wheat germplasm using additive genetic covariance of relatives and population structure. Genetics 2007, 177, 1889–1913. [Google Scholar] [CrossRef] [PubMed]
- Griffiths, S.; Simmonds, J.; Leverington, M.; Wang, Y.; Fish, L.; Sayers, L.; Alibert, L.; Orford, S.; Wingen, L.; Herry, L.; et al. Meta-QTL analysis of the genetic control of ear emergence in elite European winter wheat germplasm. Theor. Appl. Genet. 2009, 119, 383–395. [Google Scholar] [CrossRef] [PubMed]
- Raman, R.; Raman, H.; Martin, P. Functional gene markers for polyphenol oxidase locus in bread wheat (Triticum aestivum L.). Mol. Breed. 2007, 19, 315–328. [Google Scholar] [CrossRef]
- Huang, X.Q.; Cloutier, S.; Lycar, L.; Radovanovic, N.; Humphreys, D.G.; Noll, J.S.; Somers, D.J.; Brown, P.D. Molecular detection of QTLs for agronomic and quality traits in a doubled haploid population derived from two Canadian wheats (Triticum aestivum L.). Theor. Appl. Genet. 2006, 113, 753–766. [Google Scholar] [CrossRef] [PubMed]
- Chu, C.G.; Xu, S.S.; Friesen, T.L.; Faris, J.D. Whole genome mapping in a wheat doubled haploid population using SSRs and TRAPs and the identification of QTL for agronomic traits. Mol. Breed. 2008, 22, 251–266. [Google Scholar] [CrossRef]
- Lin, F.; Xue, S.L.; Tian, D.G.; Li, C.J.; Cao, Y.; Zhang, Z.Z.; Zhang, C.Q.; Ma, Z.Q. Mapping chromosomal regions affecting flowering time in a spring wheat RIL population. Euphytica 2008, 164, 769–777. [Google Scholar] [CrossRef]
- Galiba, G.; Quarrie, S.A.; Sutka, J.; Morgounov, A.; Snape, J.W. RFLP mapping of the vernalization (Vrn1) and frost-resistance (Fr1) genes on chromosome 5A of wheat. Theor. Appl. Genet. 1995, 90, 1174–1179. [Google Scholar] [CrossRef] [PubMed]
- Iwaki, K.; Nishida, J.; Yanagisawa, T.; Yoshida, H.; Kato, K. Genetic analysis of Vrn-B1 for vernalization requirement by using linked dCAPS markers in bread wheat (Triticum aestivum L.). Theor. Appl. Genet. 2002, 104, 571–576. [Google Scholar] [CrossRef] [PubMed]
- Nelson, J.C.; Sorrells, M.E.; VanDeynze, A.E.; Lu, Y.H.; Atkinson, M.; Bernard, M.; Leroy, P.; Faris, J.D.; Anderson, J.A. Molecular mapping of wheat-major genes and rearrangement in homologous group-4, group-5, and group-7. Genetics 1995, 141, 721–731. [Google Scholar] [PubMed]
- Yan, L.; Fu, D.; Li, C.; Blechl, A.; Tranquilli, G.; Bonafede, M.; Sanchez, A.; Valarik, M.; Yasuda, S.; Dubcovsky, J. The wheat and barley vernalization gene VRN3 is an orthologue of FT. Proc. Natl. Acad. Sci. USA 2006, 103, 19581–19586. [Google Scholar] [CrossRef] [PubMed]
- Wang, R.X.; Hai, L.; Zhang, X.Y.; You, G.X.; Yan, C.S.; Xiao, S.H. QTL mapping for grain filling rate and yield-related traits in RILs of the Chinese winter wheat population Heshangmai X Yu8679. Theor. Appl. Genet. 2009, 118, 313–325. [Google Scholar] [CrossRef] [PubMed]
- Scarth, R.; Law, C.N. The location of the photoperiod gene, Ppd2 and an additional genetic-factor for ear-emergence time on chromosome-2B of wheat. Heredity 1983, 51, 607–619. [Google Scholar] [CrossRef]
- Hoogendoorn, J. A reciprocal F1 monosomic analysis of the genetic-control of time of ear emergence, number of leaves and number of spikelets in wheat (Triticum aestivum L.). Euphytica 1985, 34, 545–558. [Google Scholar] [CrossRef]
- Shah, M.M.; Gill, K.S.; Baenziger, P.S.; Yen, Y.; Kaeppler, S.M.; Ariyarathne, H.M. Molecular mapping of loci for agronomic traits on chromosome 3A of bread wheat. Crop Sci. 1999, 39, 1728–1732. [Google Scholar] [CrossRef]
- Araki, E.; Miura, H.; Sawada, S. Identification of genetic loci affecting amylose content and agronomic traits on chromosome 4A of wheat. Theor. Appl. Genet. 1999, 98, 977–984. [Google Scholar] [CrossRef]
- Lopes, M.; Reynolds, P.; McIntyre, L.; Mathews, L.; Jalal Kamali, R.; Mossad, M.; Feltaous, Y.; Tahir, A.; Chatrath, R.; Ogbonnaya, F. QTL for yield and associated traits in the Seri/Babax population grown across several environments in Mexico, in the West Asia, North Africa, and South Asia regions. Theor. Appl. Genet. 2013, 126, 971–984. [Google Scholar] [CrossRef] [PubMed]
- Borner, A.; Schumann, E.; Furste, A.; Coster, H.; Leithold, B.; Roder, M.S.; Weber, W.E. Mapping of quantitative trait loci determining agronomic important characters in hexaploid wheat (Triticum aestivum L.). Theor. Appl. Genet. 2002, 105, 921–936. [Google Scholar] [PubMed]
- Campbell, B.T.; Baenziger, P.S.; Gill, K.S.; Eskridge, K.M.; Budak, H.; Erayman, M.; Dweikat, I.; Yen, Y. Identification of QTLs and environmental interactions associated with agronomic traits on chromosome 3A of wheat. Crop Sci. 2003, 43, 1493–1505. [Google Scholar] [CrossRef]
- Groos, C.; Robert, N.; Bervas, E.; Charme, G. Genetic analysis of grain protein- content, grain yield and thousand-kernel weight in bread wheat. Theor. Appl. Genet. 2003, 106, 1032–1040. [Google Scholar] [CrossRef] [PubMed]
- Quarrie, S.A.; Steed, A.; Calestani, C.; Semikhodskii, A.; Lebreton, C.; Chinoy, C.; Steele, N.; Pljevljakusic, D.; Waterman, E.; Weyen, J.; et al. A high-density genetic map of hexaploid wheat (Triticum aestivum L.) from the cross Chinese Spring X SQ1 and its use to compare QTLs for grain yield across a range of environments. Theor. Appl. Genet. 2005, 110, 865–880. [Google Scholar] [CrossRef] [PubMed]
- Marza, F.; Bai, G.H.; Carver, B.F.; Zhou, W.C. Quantitative trait loci for yield and related traits in the wheat population Ning7840 x Clark. Theor. Appl. Genet. 2006, 112, 688–698. [Google Scholar] [CrossRef] [PubMed]
- Maccaferri, M.; Sanguineti, M.C.; Corneti, S.; Ortega, J.L.A.; Ben Salem, M.; Bort, J.; DeAmbrogio, E.; Del Moral, L.F.G.; Demontis, A.; El-Ahmed, A.; et al. Quantitative trait loci for grain yield and adaptation of durum wheat (Triticumdurum Desf.) across a wide range of water availability. Genetics 2008, 178, 489–511. [Google Scholar] [CrossRef] [PubMed]
- McIntyre, C.L.; Mathews, K.L.; Rattey, A.; Chapman, S.C.; Drenth, J.; Ghaderi, M.; Reynolds, M.; Shorter, R. Molecular detection of genomic regions associated with grain yield and yield-related components in an elite bread wheat cross evaluated under irrigated and rainfed conditions. Theor. Appl. Genet. 2010, 120, 527–541. [Google Scholar] [CrossRef] [PubMed]
- El-Feki, W.M.; Byrne, P.F.; Reid, S.D.; Haley, S.D. Registration of CO940610/‘Platte’ wheat doubled haploid mapping population. J. Plant Reg. 2015, 9, 419–423. [Google Scholar] [CrossRef]
- El-Feki, W.M.; Byrne, P.F.; Reid, S.D.; Lapitan, N.L.V.; Haley, S.D. Quantitative trait locus mapping for end-use quality traits in hard winter wheat under contrasting soil moisture levels. Crop Sci. 2013, 53, 1953–1967. [Google Scholar] [CrossRef]
- Haley, S.D.; Johnson, J.J.; Peairs, F.B.; Quick, J.S.; Stromberger, J.A.; Clayshulte, S.R.; Butler, J.D.; Rudolph, J.B.; Seabourn, B.W.; Bai, G.H.; et al. Registration of ‘Ripper’ Wheat. J. Plant Reg. 2007, 1, 1–6. [Google Scholar] [CrossRef]
- Fischer, R.A.; Maurer, R. Drought resistance in spring wheat cultivars. Part 1, grain yield response. Aust. J. Agric. Res. 1978, 29, 897–912. [Google Scholar] [CrossRef]
- Mares, D.; Mrva, K.; Cheong, J.; Williams, K.; Watson, B.; Storlie, E.; Sutherland, M.; Zou, Y. A QTL located on chromosome 4A associated with dormancy in white and red-grained wheats of diverse origin. Theor. Appl. Genet. 2005, 112, 1357–1364. [Google Scholar] [CrossRef] [PubMed]
- Aparicio, N.; Villegas, D.; Casadesus, J.; Araus, J.L.; Royo, C. Spectral vegetation indices as nondestructive tools for determining durum wheat yield. Agron. J. 2000, 92, 83–91. [Google Scholar] [CrossRef]
- Penuelas, J.; Isla, R.; Filella, I.; Araus, J.L. Visible and near-infrared reflectance assessment of salinity effects on barley. Crop Sci. 1997, 37, 198–202. [Google Scholar] [CrossRef]
- Butler, J.D.; Byrne, P.F.; Mohammadi, V.; Chapman, P.L.; Haley, S.D. Agronomic performance of Rht alleles in a spring wheat population across a range of moisture levels. Crop Sci. 2005, 45, 939–947. [Google Scholar] [CrossRef]
- Hallauer, A.R.; Carena, M.J.; Miranda Filho, J.B. Quantitative Genetics in Maize Breeding; Springer: New York, NY, USA, 2010. [Google Scholar]
- Knapp, S.J.; Stroup, W.W.; Ross, W.M. Exact confidence intervals for heritability on a progeny mean basis. Crop Sci. 1985, 25, 192–194. [Google Scholar] [CrossRef]
- Riede, C.R.; Anderson, J.A. Linkage of RFLP markers to an aluminum tolerance gene in wheat. Crop Sci. 1996, 36, 905–909. [Google Scholar] [CrossRef]
- Sun, D.J.; He, Z.H.; Xia, X.C.; Zhang, L.P.; Morris, C.F.; Appels, R.; Ma, W.J.; Wang, H. A novel STS marker for polyphenol oxidase activity in bread wheat. Mol. Breed. 2005, 16, 209–218. [Google Scholar] [CrossRef]
- Mago, R.; Bariana, H.S.; Dundas, I.S.; Spielmeyer, W.; Lawrence, G.J.; Pryor, A.J.; Ellis, J.G. Development of PCR markers for the selection of wheat stem rust resistance genes Sr24 and Sr26 in diverse wheat germplasm. Theor. Appl. Genet. 2005, 111, 496–504. [Google Scholar] [CrossRef] [PubMed]
- Akbari, M.; Wenzl, P.; Caig, V.; Carling, J.; Xia, L.; Yang, S.Y.; Uszynski, G.; Mohler, V.; Lehmensiek, A.; Kuchel, H.; et al. Diversity arrays technology DArT for high-throughput profiling of the 615 hexaploid wheat genome. Theor. Appl. Genet. 2006, 113, 1409–1420. [Google Scholar] [CrossRef] [PubMed]
- Voorrips, R.E. MapChart, Software for the graphical presentation of linkage maps and QTLs. J. Hered. 2002, 93, 77–78. [Google Scholar] [CrossRef] [PubMed]
- Wang, S.; Basten, C.; Zeng, Z. Windows QTL Cartographer 2.5; North Carolina State University: Raleigh, NC, USA, 2010; Available online: http://statgen.ncsu.edu/qtlcart/WQTLCart.htm (accessed on 20 November 2017).
- Grogan, S.M.; Brown-Guedira, G.; Haley, S.D.; McMaster, G.S.; Reid, S.D.; Smith, J.; Byrne, P.F. Allelic variation in developmental genes and effects on winter wheat heading date in the U.S. Great Plains. PLoS ONE 2016, 11, E0152852. [Google Scholar] [CrossRef] [PubMed]
- El-Feki, W.M. Mapping Quantitative Trait Loci for Bread Making Quality and Agronomic Traits in Winter Wheat under Different Soil Moisture Levels. Ph.D. Thesis, Colorado State University, Fort Collins, CO, USA, 2010. [Google Scholar]
- Kumar, N.; Kulwal, P.L.; Gaur, A.; Tyagi, A.K.; Khurana, J.P.; Khurana, P.; Balyan, H.S.; Gupta, P.K. QTL analysis for grain weight in common wheat. Euphytica 2006, 151, 135–144. [Google Scholar] [CrossRef]
- Cuthbert, J.L.; Somers, D.J.; Brule-Babel, A.L.; Brown, P.D.; Crow, G.H. Molecular mapping of quantitative trait loci for yield and yield components in spring wheat (Triticum aestivum L.). Theor. Appl. Genet. 2008, 117, 595–608. [Google Scholar] [CrossRef] [PubMed]
- Hai, L.; Guo, H.J.; Wagner, C.; Xiao, S.H.; Friedt, W. Genomic regions for yield and yield parameters in Chinese winter wheat (Triticum aestivum L.) genotypes tested under varying environments correspond to QTL in widely different wheat materials. Plant Sci. 2008, 175, 226–232. [Google Scholar] [CrossRef]
- Quarrie, S.A.; Quarrie, S.P.; Radosevic, R.; Rancic, D.; Kaminska, A.; Barnes, J.D.; Leverington, M.; Ceoloni, C.; Dodig, D. Dissecting a wheat QTL for yield present in a range of environments, from the QTL to candidate genes. J. Exp. Bot. 2006, 57, 2627–2637. [Google Scholar] [CrossRef] [PubMed]
- Wiersma, J.J.; Busch, R.H.; Fulcher, G.G.; Hareland, G.A. Recurrent selection for kernel weight in spring wheat. Crop Sci. 2001, 41, 999–1005. [Google Scholar] [CrossRef]
- Spielmeyer, W.; Hyles, J.; Joaquim, P.; Azanza, F.; Bonnett, D.; Ellis, M.E.; Moore, C.; Richards, R.A. A QTL on chromosome 6A in bread wheat (Triticum aestivum) is associated with longer coleoptiles, greater seedling vigour and final plant height. Theor. Appl. Genet. 2007, 115, 59–66. [Google Scholar] [CrossRef] [PubMed]
- Sourdille, P.; Tixier, M.H.; Charmet, G.; Gay, G.; Cadalen, T.; Bernard, S.; Bernard, M. Location of genes involved in ear compactness in wheat (Triticum aestivum) by means of molecular markers. Mol. Breed. 2000, 6, 247–255. [Google Scholar] [CrossRef]
- Sourdille, P.; Cadalen, T.; Guyomarch, H.; Snape, J.; Perretant, M.R.; Charmet, G.; Boeuf, C.; Bernard, M.; Bernard, M. An update of the Courtot × Chinese Spring intervarietal molecular marker linkage map for the QTL detection of agronomic traits in wheat. Theor. Appl. Genet. 2003, 106, 530–538. [Google Scholar] [CrossRef] [PubMed]
- Hanocq, E.; Niarquin, M.; Heumez, E.; Rousset, M.; Le Gouis, J. Detection and mapping of QTL for earliness components in a bread wheat recombinant inbred lines population. Theor. Appl. Genet. 2004, 110, 106–115. [Google Scholar] [CrossRef] [PubMed]
- Baga, M.; Fowler, D.B.; Chibbar, R.N. Identification of genomic regions determining the phenological development leading to floral transition in wheat (Triticum aestivum L.). J. Exp. Bot. 2009, 60, 3575–3585. [Google Scholar] [CrossRef] [PubMed]
- Zhang, K.P.; Tian, J.C.; Zhao, L.; Liu, B.; Chen, G.F. Detection of quantitative trait loci for heading date based on the doubled haploid progeny of two elite Chinese wheat cultivars. Genetica 2009, 135, 257–265. [Google Scholar] [CrossRef] [PubMed]
- Kuchel, H.; Hollamby, G.; Langridge, P.; Williams, K.; Jefferies, S.P. Identification of genetic loci associated with ear-emergence in bread wheat. Theor. Appl. Genet. 2006, 113, 1103–1112. [Google Scholar] [CrossRef] [PubMed]
- Wurschum, T.; Langer, S.M.; Longin, C.F.H.; Tucker, M.R.; Leiser, W.L. A three-component system incorporating Ppd-D1, copy number variation at Ppd-B1, and numerous small-effect quantitative trait loci facilitates adaptation of heading time in winter wheat cultivars of worldwide origin. Plant Cell Environ. 2018, 41, 1407–1416. [Google Scholar] [CrossRef] [PubMed]
- Hanocq, E.; Laperche, A.; Jaminon, O.; Laine, A.L.; Le Gouis, J. Most significant genome regions involved in the control of earliness traits in bread wheat, as revealed by QTL meta-analysis. Theor. Appl. Genet. 2007, 114, 569–584. [Google Scholar] [CrossRef] [PubMed]
- Ellis, M.H.; Rebetzke, G.J.; Chandler, P.; Bonnett, D.; Spielmeyer, W.; Richards, R.A. The effect of mdifferent height reducing genes on the early growth of wheat. Funct. Plant Biol. 2004, 31, 583–589. [Google Scholar] [CrossRef]
- Ma, Z.Q.; Zhao, D.M.; Zhang, C.Q.; Zhang, Z.Z.; Xue, S.L.; Lin, F.; Kong, Z.X.; Tian, D.G.; Luo, Q.Y. Molecular genetic analysis of five spike-related traits in wheat using RIL and immortalized F-2 populations. Mol. Genet. Genom. 2007, 277, 31–42. [Google Scholar] [CrossRef] [PubMed]
- Huang, X.Q.; Coster, H.; Ganal, M.W.; Roder, M.S. Advanced backcross QTL analysis for the identification of quantitative trait loci alleles from wild relatives of wheat (Triticum aestivum L.). Theor. Appl. Genet. 2003, 106, 1379–1389. [Google Scholar] [CrossRef] [PubMed]
- Kumar, N.; Kulwal, P.L.; Balyan, H.S.; Gupta, P.K. QTL mapping for yield and yield contributing traits in two mapping populations of bread wheat. Mol. Breed. 2007, 19, 163–177. [Google Scholar] [CrossRef]
- Anderson, J.A.; Sorrells, M.E.; Tanksley, S.D. RFLP analysis of genomic regions associated with resistance to pre-harvest sprouting in wheat. Crop Sci. 1993, 33, 453–459. [Google Scholar] [CrossRef]
- Mares, D.J.; Mrva, K. Mapping quantitative trait loci associated with variation in grain dormancy in Australian wheat. Aust. J. Agric. Res. 2001, 52, 1257–1265. [Google Scholar] [CrossRef]
- Flintham, J.; Adlam, R.; Bassoi, M.; Holdsworth, M.; Gale, M. Mapping genes for resistance to sprouting damage in wheat. Euphytica 2002, 126, 39–45. [Google Scholar] [CrossRef]
- Ogbonnaya, F.C.; Imtiaz, M.; Ye, G.; Hearnden, P.R.; Hernandez, E.; Eastwood, R.F.; Van Ginkel, M.; Shorter, S.C.; Winchester, J.M. Genetic and QTL analyses of seed dormancy and preharvest sprouting resistance in the wheat germplasm CN10955. Theor. Appl. Genet. 2008, 116, 891–902. [Google Scholar] [CrossRef] [PubMed]
- Tan, M.K.; Sharp, P.J.; Lu, M.Q.; Howes, N. Genetics of grain dormancy in a white wheat. Aust. J. Agric. Res. 2006, 57, 1157–1165. [Google Scholar]
- Noda, K.; Matsuura, T.; Maekawa, M.; Taketa, S. Chromosomes responsible for sensitivity of embryo to abscisic acid and dormancy in wheat. Euphytica 2002, 123, 203–209. [Google Scholar] [CrossRef]
- Cabral, A.; Jordan, M.; McCartney, C.; You, F.; Humphreys, D.; MacLachlan, R.; Pozniak, C. Identification of candidate genes, regions and markers for pre-harvest sprouting resistance in wheat (Triticum aestivum L.). Plant Biol. 2014, 14, 340–352. [Google Scholar] [CrossRef] [PubMed]
- Bennett, D.; Reynolds, M.; Mullan, D.; Izanloo, A.; Kuchel, H.; Langridge, P.; Schnurbusch, T. Detection of two major grain yield QTL in bread wheat (Triticum aestivum L.) under heat, drought and high yield potential environments. Theor. Appl. Genet. 2012, 125, 1473–1485. [Google Scholar] [CrossRef] [PubMed]
- Edae, E.A.; Byrne, P.F.; Haley, S.D.; Lopes, M.S.; Reynolds, M.P. Genome-wide association mapping of yield and yield components of spring wheat under contrasting moisture regimes. Theor. Appl. Genet. 2014, 4, 791–807. [Google Scholar] [CrossRef] [PubMed]
- Pinto, R.S.; Reynolds, M.P.; Mathews, K.L. Heat and drought adaptive QTL in a wheat population designed to minimize confounding agronomic effects. Theor. Appl. Genet. 2010, 121, 1001–1021. [Google Scholar] [CrossRef] [PubMed] [Green Version]
- Sukumaran, S.S.; Dreisigacker, S.; Lopes, M.; Chavez, P.; Reynolds, M.P. Genome-wide association study for grain yield and related traits in an elite spring wheat population grown in temperate irrigated environments. Theor. Appl. Genet. 2015, 2, 353–363. [Google Scholar] [CrossRef] [PubMed]
- Araus, J.L.; Casadesus, J.; Bort, J. Recent tools for the screening of physiological traits determining yield. In Application of Physiology in Wheat Breeding; Reynolds, M.P., Ortiz-Monasterio, J.I., McNab, A., Eds.; CIMMYT: Mexico City, Mexico, 2001; pp. 59–77. [Google Scholar]
- Kirigwi, F.M.; Van Ginkel, M.; Brown-Guedira, G.; Gill, B.S.; Paulsen, G.M.; Fritz, A.K. Markers associated with a QTL for grain yield in wheat under drought. Mol. Breed. 2007, 20, 401–413. [Google Scholar] [CrossRef]
- Dao, H.Q.; Byrne, P.F.; Reid, S.D.; Haley, S.D. Validation of quantitative trait loci for grain quality-related traits in a winter wheat mapping population. Euphytica 2017, 213, 5. [Google Scholar] [CrossRef]
Figure 1.
Prominent QTL clusters detected for agronomic traits of the CO940610/Platte population in four Colorado environments in the 2007–2008 and 2008–2009 growing seasons.
Figure 1.
Prominent QTL clusters detected for agronomic traits of the CO940610/Platte population in four Colorado environments in the 2007–2008 and 2008–2009 growing seasons.


Table 1.
Agronomic trait means and ranges and estimates of broad sense heritability for the CO940610/Platte population (n = 185) at Fort Collins and Greeley, Colorado under two irrigation levels in the 2007–2008 and 2008–2009 growing seasons.
Table 1.
Agronomic trait means and ranges and estimates of broad sense heritability for the CO940610/Platte population (n = 185) at Fort Collins and Greeley, Colorado under two irrigation levels in the 2007–2008 and 2008–2009 growing seasons.
| Fort Collins 2007–2008 | Greeley 2008–2009 | H2 (90% CI) § | |||||||
|---|---|---|---|---|---|---|---|---|---|
| Full Irrigation (08FW) | Limited Irrigation (08FD) | Full Irrigation (09GW) | Limited Irrigation (09GD) | ||||||
| Trait † | Mean ± SE ‡ | Min–Max | Mean ± SE | Min–Max | Mean ± SE | Min–Max | Mean ± SE | Min–Max | |
| Plht (cm) | 79.4 ± 0.81 | 64.9–90.8 | 67.9 ± 0. 92 | 52.2–79.3 | 91.1 ± 0.72 | 74.9–104.3 | 74.6 ± 0.75 | 65.7–82.1 | 0.82 (0.78–0.85) |
| Ll (cm) | 13.9 ± 0.29 | 11.1–16.6 | 10.7 ± 0.39 | 9.4–12.3 | 17.3 ± 0.30 | 16.2–18.2 | 16.1 ± 0.23 | 14.3–17.5 | 0.60 (0.51–0.67) |
| Lw (cm) | 1.24 ± 0.01 | 1.09–1.67 | 1.08 ± 0.02 | 0.93–1.27 | 1.42 ± 0.02 | 1.32–1.53 | 1.29 ± 0.03 | 1.12–1.44 | 0.74 (0.68–0.79) |
| Sl (cm) | 8.6 ± 0.08 | 7.0–10.4 | 8.6 ± 0.10 | 7.2–9.8 | 9.4 ± 0.08 | 8.1–11.2 | 9.7 ± 0.13 | 8.7–10.8 | 0.84 (0.81–0.87) |
| Dth (d) | 156.3 ± 0.31 | 151.0–164.7 | 152.5 ± 0.16 | 149.5–157.9 | 144.7 ± 0.23 | 139.5–154.5 | 143.2 ± 0.19 | 138.7–152.4 | 0.96 (0.96–0.98) |
| Dpm (d) | 191.2 ± 0.30 | 189.5–195.5 | 186.7 ± 0.50 | 185.3–189.0 | 184.2 ± 0.38 | 180.1–190.9 | 181.5 ± 0.31 | 178.9–189.9 | 0.78 (0.61–0.79) |
| Gfd (d) | 34.8 ± 0.32 | 30.9–38.6 | 33.9 ± 0.38 | 31.1–37.1 | 39.4 ± 0.35 | 37.4–41.7 | 38.2 ± 0.22 | 36.3–41.3 | 0.84 (0.81–0.89) |
| Gfr (g d−1) | 4.39 ± 0.09 | 3.44–5.17 | 3.20 ± 0.20 | 2.66–3.81 | 4.25 ± 0.09 | 2.79–4.85 | 3.51 ± 0.10 | 1.90–4.37 | 0.60 (0.51–0.67) |
| Agb (g) | 366.3 ± 9.73 | 343.6–690.6 | 296.9 ± 22.7 | 278.3–321.8 | 463.5 ± 12.6 | 394.6–507.0 | 401.5 ± 13.0 | 319.3–470.9 | 0.43 (0.29–0.53) |
| Hi | 0.42 ± 0.01 | 0.39–0.48 | 0.37 ± 0.01 | 0.31–0.44 | 0.36 ± 0.01 | 0.19–0.43 | 0.34 ± 0.01 | 0.18–0.46 | 0.62 (0.54–0.69) |
| 200 Kwt (g) | 7.13 ± 0.08 | 5.31–10.53 | 7.24 ± 0.08 | 5.14–9.28 | 7.30 ± 0.09 | 4.60–8.44 | 7.22 ± 0.08 | 5.12–8.43 | 0.89 (0.88–0.92) |
| Gy (kg ha −1) | 3719.7 ± 42.1 | 2091.9–4609.6 | 2923.9 ± 40.82 | 1571.6–3832.9 | 3760.9 ± 34.2 | 837.1–4676.6 | 3056.9 ± 33.3 | 823.9–4040.1 | 0.63 (0.57–0.68) |
| Phs | 0.65 ± 0.01 | 0.31–0.81 | -------- | ------- | 0.46 ± 0.02 | 0.33–0.56 | -------- | ------- | 0.29 (0.14–0.42) |
| NDVI | -------- | -------- | -------- | ------- | 0.71 ± 0.01 | 0.66–0.73 | 0.71 ± 0.02 | 0.67–0.73 | 0.29 (0.13–0.42) |
† Plht, plant height; Ll, leaf length; Lw, leaf width; Sl, spike length; Dth, days to heading; Dpm, days to physiological maturity; Gfd, grain filling duration; Gfr, grain filling rate; Agb, above ground biomass; Hi, harvest index; 200 Kwt, 200 kernel weight; Gy, grain yield; Phs, pre-harvest sprouting; NDVI, normalized difference vegetation index. ‡ Underlined means indicate a significantly higher value (p < 0.05) than the other treatment at the same location. § Heritability estimates with 90% confidence intervals.
Table 2.
QTL detected for agronomic traits of the CO940610/Platte population in four Colorado environments in the 2007–2008 and 2008–2009 growing seasons.
Table 2.
QTL detected for agronomic traits of the CO940610/Platte population in four Colorado environments in the 2007–2008 and 2008–2009 growing seasons.
| Peak Position | |||||||
|---|---|---|---|---|---|---|---|
| Trait † | QTL ‡ | Environment § | Marker Interval ¶ | cM | LOD | A # | % R2 †† |
| Plht | QPlht.cob-2B.1 | 08FD | wPt-9402–Xbarc200 | 72.6 | 3.86 | −1.12 | 6.3 |
| QPlht.cob-3A | 08FW, 09GW, 08FD, 09GD | Xwmc50–Xbarc356 | 72.2–76.2 | 3.03–6.79 | −1.59–−0.7 | 11.5–15.3 | |
| QPlht.cob-4D.1 | 08FD | Xwmc720–wPt-0941 | 16.1 | 5.02 | −1.23 | 7.53 | |
| QPlht.cob-5A | 09GD | Xgwm443-Xwmc713 | 6.4 | 4.21 | −0.85 | 7.7 | |
| QPlht.cob-5B.1a | 08FW, 09GW, 09GD | wPt-1475–Xgdm62 | 52.5–79.0 | 2.67–4.83 | −1.37–−0.69 | 4.9–7.8 | |
| QPlht.cob-5B.1b | 08FD | Xgdm62–wPt-3661 | 89.5 | 5.21 | −1.28 | 8.18 | |
| QPlht.cob-6A.1 | 08FW, 09GW, 08FD, 09GD | Xcfd-1–Xwmc256 | 61.0–71.0 | 3.94–14.02 | −2.49–−0.94 | 9.4–17.3 | |
| QPlht.cob-7B | 08FD, 09GW | wPt-8920–wPt-7602 | 29.7–44.1 | 3.64–4.13 | −1.18–−1.15 | 6.09–7.72 | |
| QPlht.cob-7D.2 | 08FW, 09GW, 08FD, 09GD | Vrn-D3–wPt-0789 | 0.0–12.0 | 6.05–12.26 | 1.91–2.26 | 11.0–20.4 | |
| Ll | QLl.cob-1B.1 | 09GW, 08FD, 09GD | Sr24-Glu-B3 | 1.0–2.0 | 3.57–5.64 | −0.15–−0.14 | 7.3–11.5 |
| QLl.cob-2B.1a | 08FW | wPt-3561–Xbarc200 | 78.8 | 4.81 | −0.14 | 11.3 | |
| QLl.cob-2B.1b | 09GW | Xbarc55–Xgwm374 | 106.0 | 2.77 | −0.12 | 5.1 | |
| QLl.cob-3A | 09GW | Xwmc11-wPt-1688 | 19.3 | 2.96 | 0.13 | 6.0 | |
| QLl.cob-6B.1 | 08FW, 08FD | wPt-5596–wPt-2587 | 21.9–28.5 | 3.57–4.03 | 0.16–0.25 | 7.7–8.7 | |
| QLl.cob-7D.2 | 09GD | wPt-0789–Xcfd14 | 16.8 | 3.22 | −0.19 | 6.3 | |
| Lw | QLw.cob-1B.1 | 09GW, 08FD | Xbarc8–Glu-B1 | 29.3–45.9 | 4.43–4.65 | −0.02 | 9.5–10.2 |
| QLw.cob-2D.2 | 09GW | Xgdm35–Xgwm261 | 7.3 | 5.16 | −0.02 | 10.7 | |
| QLw.cob-4A.1 | 08FD | Xgwm610–Xwmc48 | 8.4 | 3.37 | 0.02 | 6.8 | |
| Sl | QSl.cob-1A.1 | 08FW, 09GW, 08FD, 09GD | Xbarc83-Glu-A1 | 85.4–96.4 | 2.89–8.34 | 0.11–0.23 | 5.9–15.2 |
| QSl.cob-1D | 08FW | Xbarc169-Glu-D1 | 87.9 | 2.71 | 0.12 | 4.4 | |
| QSl.cob-2B.1 | 08FW, 09GW, 09GD | Xbarc200–Xwmc770 | 82.8–93.4 | 2.97–7.42 | −0.22–−0.14 | 6.3–13.5 | |
| QSl.cob-3B.2 | 08FW | Xgwm533–Xgwm493 | 2.0 | 2.79 | −0.12 | 4.2 | |
| QSl.cob-3D.1 | 09GW | Xgwm314–Xgwm341 | 6.0 | 4.68 | −0.19 | 10.6 | |
| QSl.cob-4D.2 | 09GD | Xwmc622–Xcfd54a | 0.0 | 3.25 | 0.10 | 5.6 | |
| QSl.cob-6B.1 | 08FW, 09GD | Xwmc397–Xbarc198 | 55.5 | 3.0–4.37 | 0.11–0.13 | 4.9–7.7 | |
| QSl.cob-7A.2 | 08FW, 09GW | Xgwm60–wPt-3393 | 4.0–28.4 | 3.06–6.31 | 0.12–0.21 | 4.6–13.4 | |
| QSl.cob-7B | 09GD | Xbarc278–wPt-3873 | 88.3 | 3.24 | 0.10 | 5.5 | |
| QSl.cob-7D.2 | 08FD | Vrn-D3–Xbarc126 | 4.0 | 2.95 | 0.13 | 4.8 | |
| Dth | QDth.cob-1B.1 | 08FW, O8FD | Glu-B3–wPt-3927 | 4.2–8.5 | 2.76–4.55 | 0.36–0.57 | 4.3–5.3 |
| QDth.cob-2B.1 | 08FW, 08FD, 09GW, 09GD | Xbarc200–Xgwm429 | 76.8–83.4 | 13.79–17.16 | −1.17–−0.77 | 20.0–23.0 | |
| QDth.cob-3A | 08FW, 08FD, 09GD | Xwmc532–Xwmc50 | 46.2–55.2 | 2.72–3.28 | −0.52–−0.43 | 4.3–7.8 | |
| QDth.cob-7A.1 | 09GD | Xgwm635–Xbarc70 | 6.9 | 3.2 | 0.39 | 3.4 | |
| QDth.cob-7B | 08FW, 09GW | wPt-8920–Xgwm569 | 31.1 | 2.89–3.46 | −0.51–−0.46 | 3.6–4.5 | |
| QDth.cob-7D.2 | 08FW, 08FD, 09GW, 09GD | Vrn-D3–Xbarc126 | 0.0-6.1 | 13.78–25.88 | 0.87–1.43 | 25.9–38.8 | |
| Dpm | QDpm.cob-1B.1 | 09GW | Xbarc181–Xcfd20a | 40.5 | 3.55 | −0.39 | 5.3 |
| QDpm.cob-2B.1 | 08FW, 08FD, 09GW, 09GD | Xbarc200-Xgwm429 | 77.8–81.8 | 7.27–8.87 | −0.64–−0.26 | 14.3–17.5 | |
| QDpm.cob-3A | 08FD | Xwmc532–Xwmc50 | 59.2 | 3.71 | −0.21 | 9.9 | |
| QDpm.cob-7A.2 | 08FD | Xgwm60–Xbarc219 | 2.0 | 6.22 | 0.46 | 13.6 | |
| QDpm.cob-7B | 09GW | Xgwm569–wPt-7602 | 44.1 | 4.18 | −0.51 | 10.9 | |
| QDpm.cob-7D.2 | 08FW, 09GW, 09GD | Vrn-D3-Xbarc126 | 0.0–2.0 | 2.68–8.29 | 0.14–0.58 | 4.7–14.7 | |
| Gfd | QGfd.cob-1B.1 | 08FD, 08FW | Sr24-Glu-B3 | 4.2 | 3.99–5.0 | −0.38–−0.31 | 4.9–6.8 |
| QGfd.cob-2B.1 | 08FW, 08FD, 09GD | wPt-3561-Xbarc55 | 73.6–99.6 | 6.55–12.16 | 0.36–0.62 | 11.4–18.5 | |
| QGfd.cob-3A | 08FW | Xwmc50–Xgwm674 | 66.2 | 2.93 | 0.34 | 4.1 | |
| QGfd.cob-7A.2 | 08FW, 09GD | Xgwm60–wPt-1928 | 5.9–8.6 | 3.46–3.57 | −0.35–−0.29 | 4.1–5.6 | |
| QGfd.cob-7B | 09GW | wPt-7602–Xwmc76 | 68.4 | 2.86 | −0.19 | 5.3 | |
| QGfd.cob-7D.2 | 08FW, 08FD, 09GW, 09GD | Vrn-D3-Xbarc126 | 1.0–2.0 | 8.77–22.14 | −0.99–−0.37 | 17.1–35.3 | |
| Gfr | QGfr.cob-2D.2 | 09GD | wPt-4413-wPt-2544 | 53.3 | 4.36 | −0.13 | 9.5 |
| QGfr.cob-5A | 08FW | Xbarc165–Xbarc360 | 53.0 | 4.19 | 0.08 | 8.0 | |
| QGfr.cob-5B.1 | 09GD | Xbarc74–Xgwm540 | 59.6 | 3.44 | −0.11 | 6.6 | |
| QGfr.cob-7B | 09GD | Xgwm333–Xbarc278 | 82.8 | 3.79 | −0.12 | 8.4 | |
| QGfr.cob-7D.2 | 08FW | Xbarc126-wPt-0789 | 11.1 | 5.13 | 0.09 | 10.3 | |
| Agb | QAgb.cob-2D.2 | 08FW,09GD | wPt-0298-wPt-4413 | 33.7–52.3 | 3.49–3.65 | −7.79–−2.78 | 8.3–9.7 |
| QAgb.cob-4D.2 | 08FD | Xwmc622–Xcfd54a | 0.0 | 3.41 | −2.16 | 6.9 | |
| QAgb.cob-5B.1 | 09GD | Xgwm499–Xgdm62 | 84.0 | 3.0 | −6.8 | 6.1 | |
| QAgb.cob-6A.1 | 09GW | Xcfd1–Xwmc256 | 71.0 | 3.39 | −4.54 | 7.4 | |
| QAgb.cob-7D.2 | 08FW | Xbarc126-wPt-0789 | 12.0 | 2.88 | 2.16 | 5.9 | |
| Hi | QHi.cob-1B.1 | 09GD | wPt-5562–Xbarc8 | 25.3 | 2.75 | −0.01 | 6.8 |
| QHi.cob-2B.1 | 09GD | Xbarc55–Xbarc349a | 110.1 | 4.29 | 0.01 | 9.1 | |
| QHi.cob-6B.1 | 08FW, 08FD | wPt-2218–Xwmc397 | 28.5–52.3 | 2.89–4.74 | 0.01 | 6.4–10.4 | |
| 200 Kwt | Q200Kwt.cob-1A.1 | 09GW, 09GD | wPt-3904-wPt-9757 | 73.4–85.4 | 3.78–4.32 | 0.14–0.17 | 7.7–8.1 |
| Q200Kwt.cob-1B.1a | 08FW | Sr24-Glu-B3 | 1.0 | 4.56 | −0.16 | 6.8 | |
| Q200Kwt.cob-1B.1b | 08FD, 09GD | Xcfd20a-wPt-0705 | 46.9–50.6 | 4.85–7.44 | −0.19–−0.15 | 10.3–12.3 | |
| Q200Kwt.cob-2B.1 | 08FW, 09GW | wPt-3561–Xwmc770 | 79.8–86.8 | 6.26–7.81 | 0.21–0.24 | 12.0–14.5 | |
| Q200Kwt.cob-2D.1 | 08FD | Xbarc95–Xgdm35 | 3.6 | 2.79 | −0.11 | 4.3 | |
| Q200Kwt.cob-2D.2 | 08FW, 08FD | wPt-0298-wPt-4413 | 29.7–39.7 | 2.87–3.91 | −0.18–−0.13 | 5.5–7.7 | |
| Q200Kwt.cob-3B.1 | 08FD, 09GD | Xwmc231-Xgwm285 | 10.8–12.8 | 4.88–6.31 | 0.16–0.18 | 9.9–10.1 | |
| Q200Kwt.cob-6A.1 | 08FW, 08FD, 09GW, 09GD | Xcfd1-Xwmc256 | 69.0–71.0 | 3.60–7.59 | −0.23–−0.13 | 7.7–14.5 | |
| Q200Kwt.cob-7D.2 | 08FW | Vrn-D3-Xbarc126 | 0.0 | 5.95 | −0.21 | 10.1 | |
| Gy | QGy.cob-2D.2 | 08FD | wPt-4413-wPt-2544 | 52.3 | 4.04 | −107.83 | 10.1 |
| QGy.cob-5A | 08FD, 09GW, 09GD | Xbarc165–Xbarc360 | 51.0–53.0 | 2.98–5.35 | 84.27–159.6 | 6.2–11.6 | |
| QGy.cob-5B.1 | 09GD | Xbarc4–Xgwm540 | 59.6 | 7.33 | −185.16 | 13.7 | |
| QGy-cob-7B | 08FW, 09GD | wPt-7602–Xwmc76 | 59.1–65.4 | 2.70–4.96 | −102.9–−162.9 | 6.9–10.6 | |
| Phs | QPhs.cob-2B.1 | 09GW | Xgwm374–Xbarc349a | 121.4 | 3.4 | 0.01 | 9.6 |
| QPhs.cob-3D.1 | 08FW | Xgwm341–Xbarc125 | 24.9 | 2.76 | 0.02 | 5.8 | |
| QPhs.cob-4A.1 | 08FW | Xwmc48–Xwmc420 | 11.6 | 5.12 | 0.03 | 10.4 | |
| QPhs.cob-4D.1 | 08FW | wPt-0941-wPt-5809 | 22.1 | 4.08 | 0.03 | 10.3 | |
| NDVI | QNDVI.cob-4B.1 | GD09 | wPt-0391–Xcfd54b | 41.2 | 2.69 | 0.01 | 5.9 |
| QNDVI.cob-6A.1 | GW09 | Xcfd1–Xwmc256 | 70.0 | 3.44 | −0.01 | 7.6 | |
| Dsi | QDsi.cob-5B.1 | G09 | Xbarc216–Xgwm540 | 59.6 | 6.40 | 0.18 | 11.9 |
| QDsi.cob-7B | G09 | wPt-7602–Xgwm573 | 67.4 | 6.02 | 0.18 | 11.5 | |
† Traits are as defined for Table 1. ‡ QTL names include a 3-letter trait abbreviation, the lab identifier cob (for Colorado-Byrne), and the linkage group number. § The four environments were different moisture levels during two growing seasons: Fort Collins limited irrigation (08FD), Fort Collins full irrigation (08FW), Greeley limited irrigation (09GD), Greeley full irrigation (09GW), and Greeley for Dsi (G09). ¶ Markers bracketing the 1-LOD support interval. # Average additive effect: Positive values indicate an increasing effect of Platte alleles and negative values indicate an increasing effect of CO940610 alleles. Units for additive effects are as indicated in Table 1. †† Percent phenotypic variation explained. QTL: quantitative trait loci; LOD: logarithm of odds.
© 2018 by the authors. Licensee MDPI, Basel, Switzerland. This article is an open access article distributed under the terms and conditions of the Creative Commons Attribution (CC BY) license (http://creativecommons.org/licenses/by/4.0/).
Share and Cite
MDPI and ACS Style
El-Feki, W.M.; Byrne, P.F.; Reid, S.D.; Haley, S.D. Mapping Quantitative Trait Loci for Agronomic Traits in Winter Wheat under Different Soil Moisture Levels. Agronomy 2018, 8, 133. https://doi.org/10.3390/agronomy8080133
AMA Style
El-Feki WM, Byrne PF, Reid SD, Haley SD. Mapping Quantitative Trait Loci for Agronomic Traits in Winter Wheat under Different Soil Moisture Levels. Agronomy. 2018; 8(8):133. https://doi.org/10.3390/agronomy8080133
Chicago/Turabian StyleEl-Feki, Walid M., Patrick F. Byrne, Scott D. Reid, and Scott D. Haley. 2018. "Mapping Quantitative Trait Loci for Agronomic Traits in Winter Wheat under Different Soil Moisture Levels" Agronomy 8, no. 8: 133. https://doi.org/10.3390/agronomy8080133
Note that from the first issue of 2016, this journal uses article numbers instead of page numbers. See further details here.