Prediction of Sugarcane Yield Based on NDVI and Concentration of Leaf-Tissue Nutrients in Fields Managed with Straw Removal

 ,
,  ,
,  ,
,  ,
,
Abstract
:1. Introduction
2. Materials and Methods
2.1. Study Sites
2.2. Experimental Design
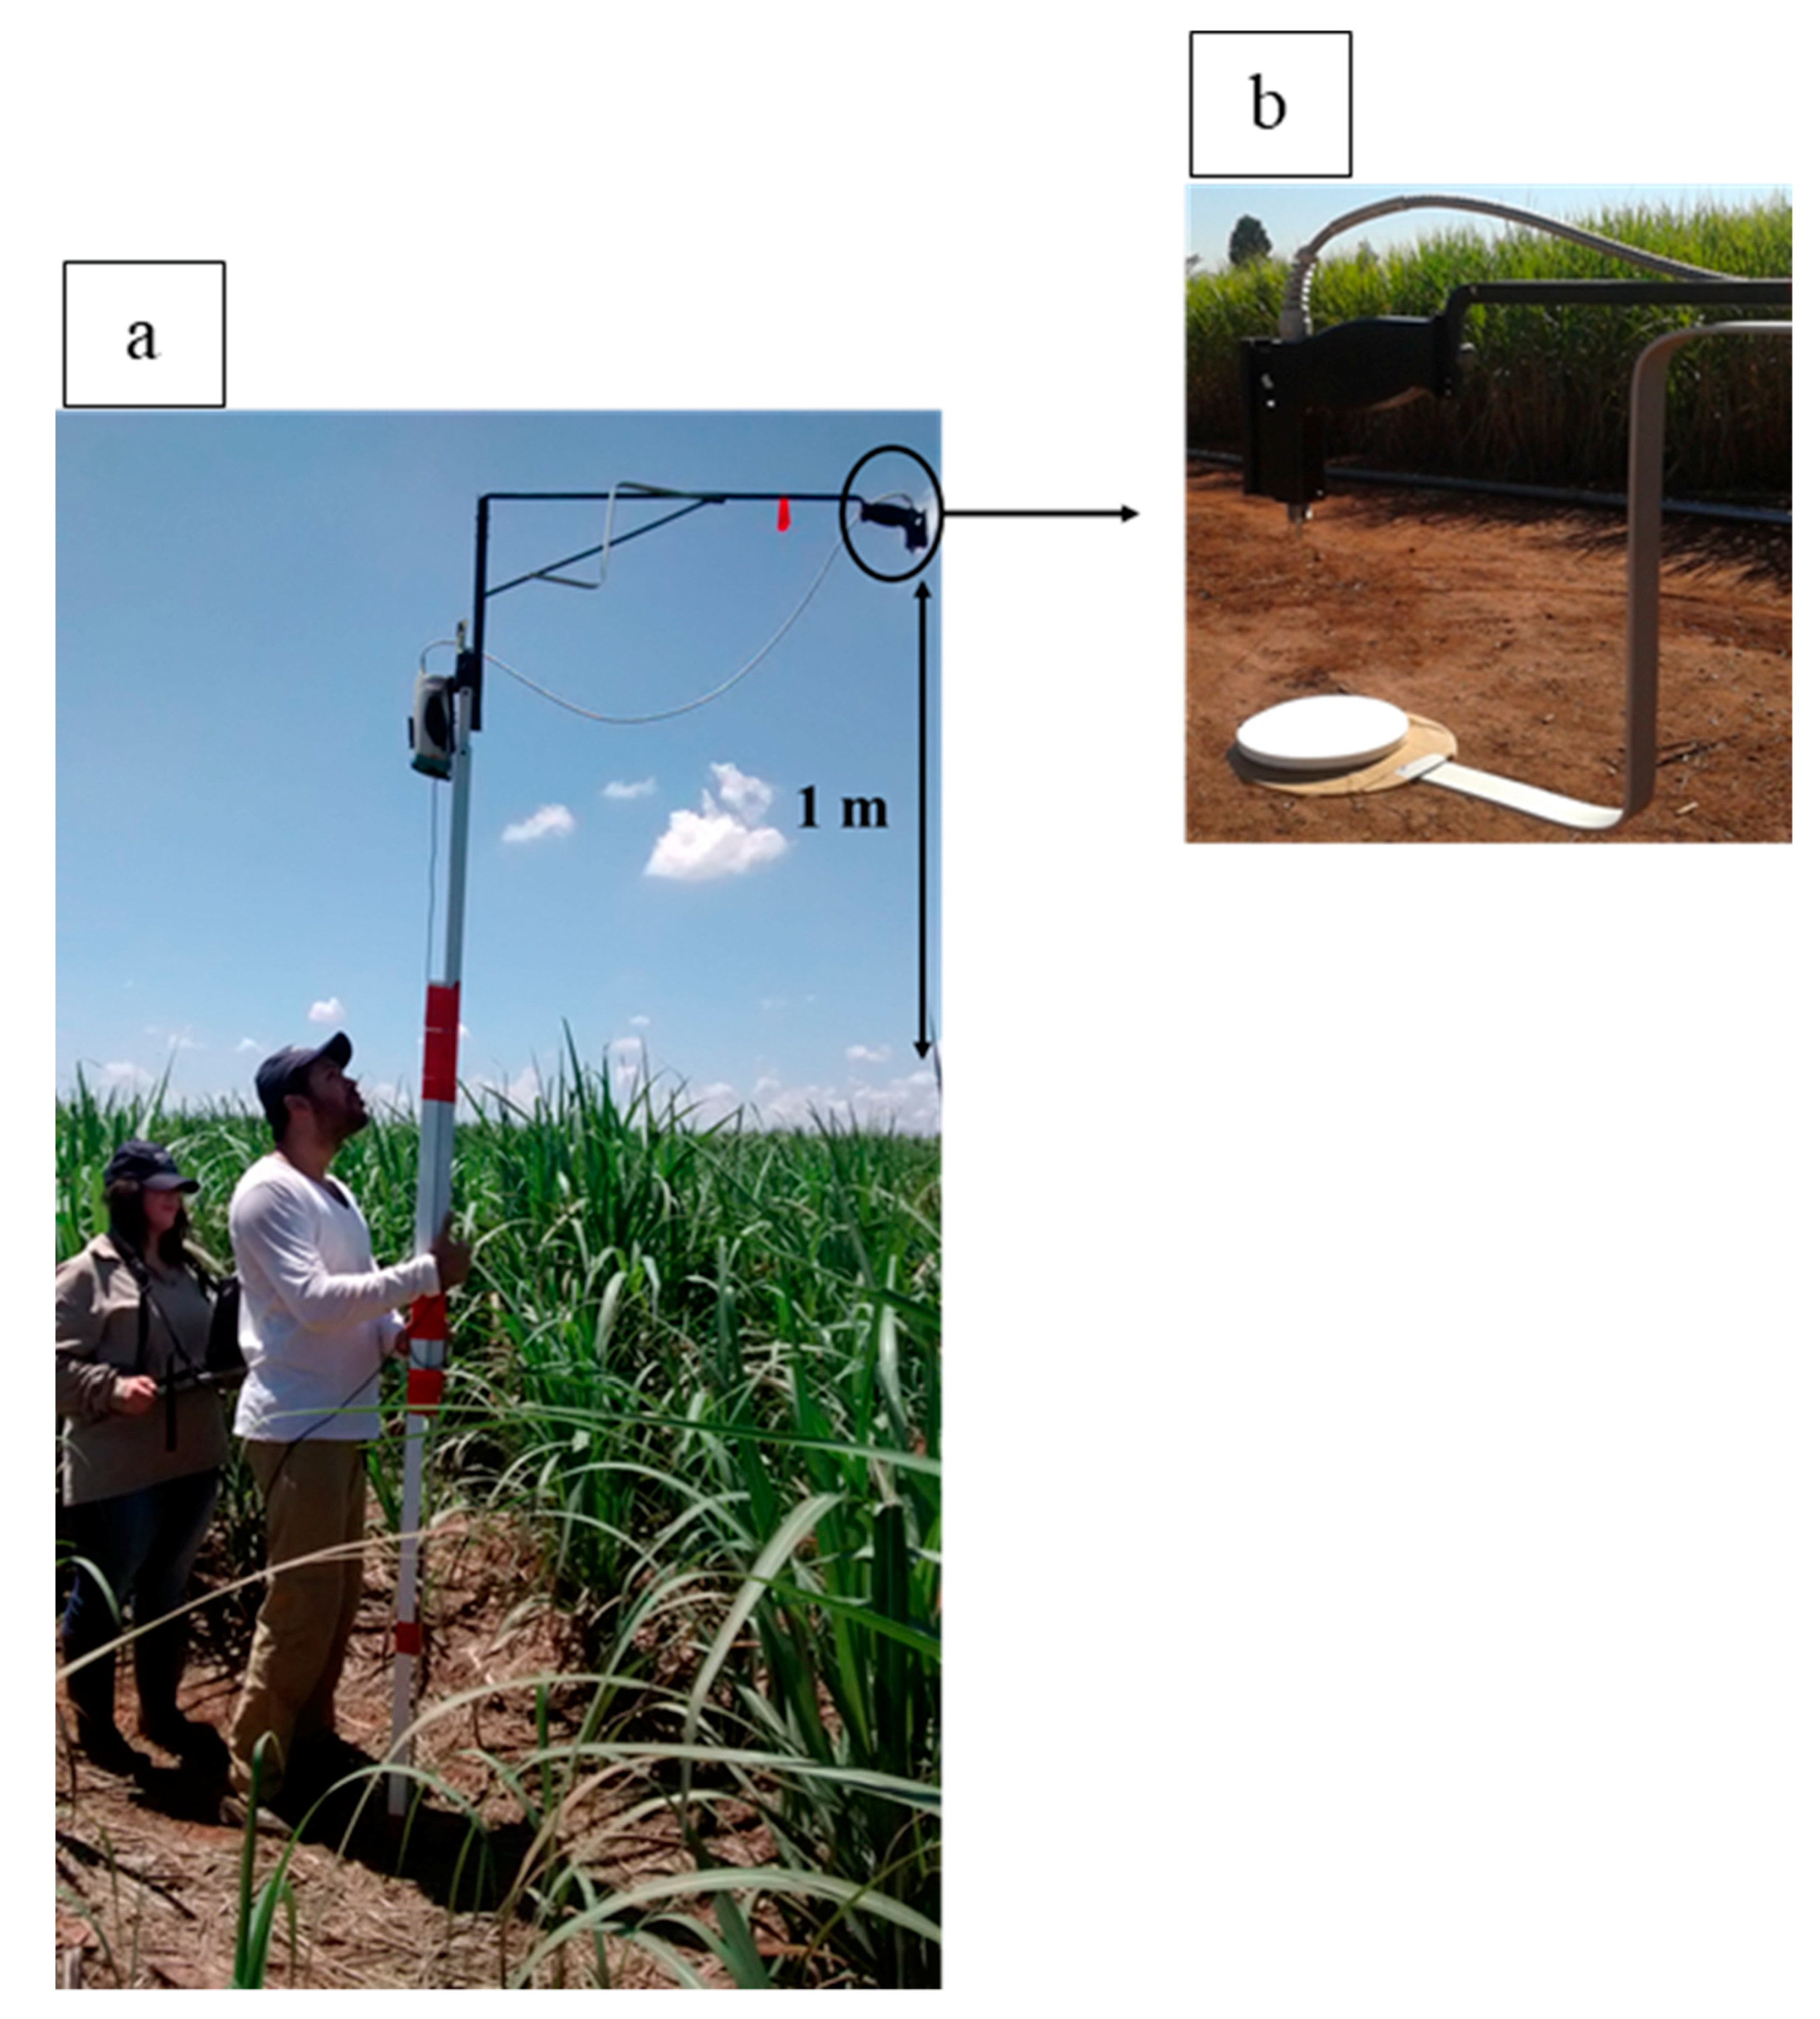
2.3. Calculation of the NDVI
2.4. Plant Parameters
2.5. Data Analysis
3. Results
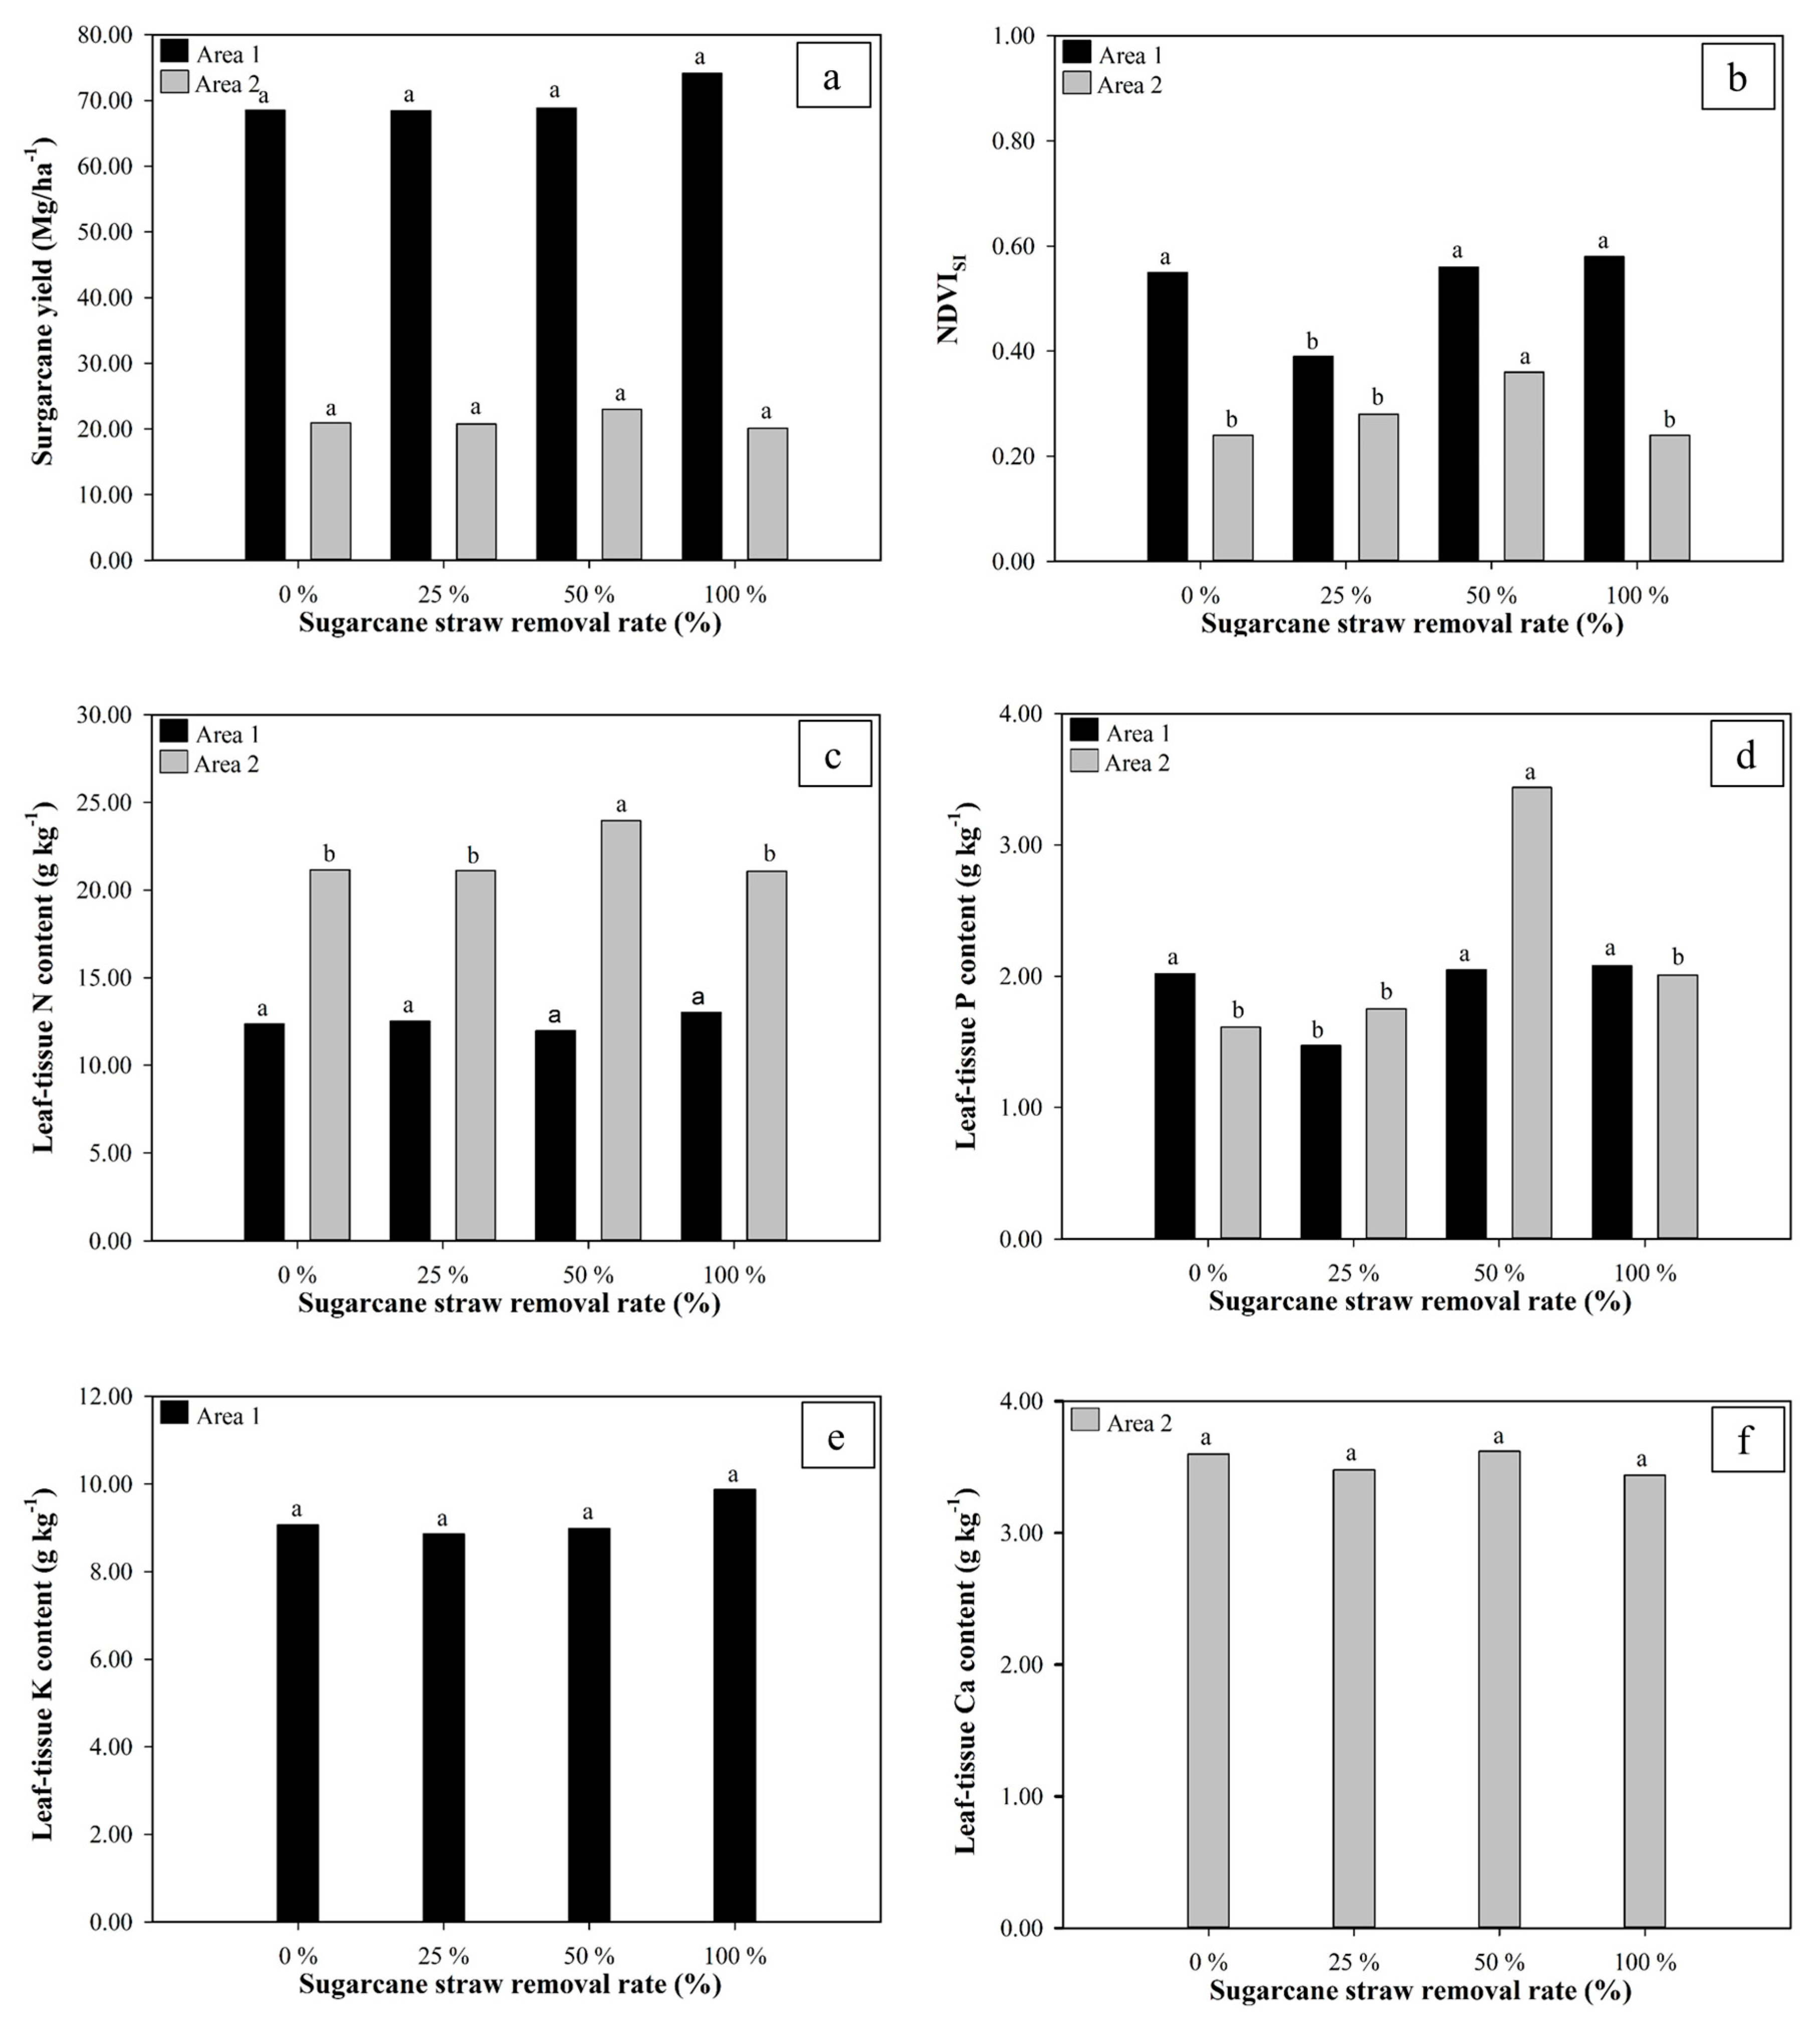
3.1. NDVI Values
3.2. Sugarcane Leaf-Tissue Nutrient Concentration
3.3. Sugarcane Yield
3.4. Modelling Sugarcane Yields by Stepwise Analysis
3.5. Effect of Sugarcane Straw Removal on Selected Yield-Explaining Variables
3.6. Validation of Models
4. Discussion
4.1. Effect of Straw Removal on the Leaf-Tissue Nutrient Concentration and Sugarcane Yield
4.2. NDVI Acquisition by Satellite Image vs Hyperspectral Sensor
4.3. Sugarcane Yield Prediction Using the NVDI and Leaf-Tissue Nutrient Concentration
5. Conclusions
Author Contributions
Funding
Acknowledgments
Conflicts of Interest
References
- FAO—Food and Agriculture Organization. Available online: http://faostat.fao.org/ (accessed on 25 July 2018).
- Companhia Nacional de Abastecimento-Conab. Available online: https://www.conab.gov.br/ (accessed on 25 July 2018).
- REN21-Highlights of the REN21 Renewables 2017 Global Status Report in Perspective. Available online: http://www.ren21.net/wp-content/uploads/2017/06/GSR2017_Highlights_FINAL.pdf (accessed on 15 June 2018).
- Goldemberg, J.; Mello, F.F.; Cerri, C.E.; Davies, C.A.; Cerri, C.C. Meeting the global demand for biofuels in 2021 through sustainable land use change policy. Energy Policy 2014, 69, 14–18. [Google Scholar] [CrossRef]
- de Expansão de Energia 2024. Available online: http://www.epe.gov.br (accessed on 1 May 2018).
- Cunha, F.M.; Badino, A.C.; Farinas, C.S. Effect of a novel method for in-house cellulase production on 2G ethanol yields. Biocatal. Agric. Biotechnol. 2017, 9, 224–229. [Google Scholar] [CrossRef]
- Lisboa, I.P.; Cherubin, M.R.; Cerri, C.C.; Cerri, D.G.P.; Cerri, C.E.P. Guidelines for the recovery of sugarcane straw from the field during harvesting. Biomass Bioenergy 2017, 96, 69–74. [Google Scholar] [CrossRef]
- Leal, M.R.L.V.; Galdos, M.V.; Scarpare, F.V.; Seabra, J.E.A.; Walter, A.; Oliveira, C.O.F. Sugarcane straw availability, quality, recovery and energy use: A literature review. Biomass Bioenergy 2013, 53, 11–19. [Google Scholar] [CrossRef]
- Carvalho, J.L.N.; Nogueirol, R.C.; Menandro, L.M.S.; Bordonal, R.D.O.; Borges, C.D.; Cantarella, H.; Franco, H.C.J. Agronomic and environmental implications of sugarcane straw removal: A major review. Glob. Chang. Biol. Bioenergy 2017, 9, 1181–1195. [Google Scholar] [CrossRef]
- Cherubin, M.R.; Oliveira, D.M.S.; Feigl, B.J.; Pimentel, L.G.; Lisboa, I.P.; Gmach, M.R.; Varanda, L.L.; Moraes, M.C.; Satiro, L.S.; Popin, G.V.; et al. Crop residue harvest for bioenergy production and its implications on soil functioning and plant growth: A review. Sci. Agric. 2018, 75, 255–272. [Google Scholar] [CrossRef] [Green Version]
- Corrêa, S.T.R.; Carvalho, J.L.N.; Hernandes, T.A.D.; Barbosa, L.C.; Menandro, L.M.S.; Leal, M.R.L.V. Assessing the effects of different amountsof sugarcane straw on temporal variability of soil moisture content and temperature. In Proceedings of the 25th European Biomass Conference and Exhibition, Stockholm, Sweden, 12–15 June 2017; pp. 12–15. [Google Scholar]
- Satiro, L.S.; Cherubin, M.R.; Safanelli, J.L.; Lisboa, I.P.; Junior, P.R.R.; Cerri, C.E.E.; Cerri, C.C. Sugarcane straw removal effects on Ultisols and Oxisols in south-central Brazil. Geod. Reg. 2017, 11, 86–95. [Google Scholar] [CrossRef]
- Dos Anjos, J.C.R.; Júnior, A.S.A.; Bastos, E.A.; Noleto, D.H.; Melo, F.B.; De Brito, R.R. Water storage in a Plinthaqualf cultivated with sugarcane under straw levels. Pesqui. Agropecu. Brasil. 2017, 52, 464–473. [Google Scholar] [CrossRef] [Green Version]
- Bordonal, R.O.; Menandro, L.M.S.; Barbosa, L.C.; Lal, R.; Milori, D.M.B.P.; Kolln, O.T.; Franco, H.C.J.; Carvalho, J.L.N. Sugarcane yield and soil carbon response to straw removal in south-central Brazil. Geoderma 2018, 328, 79–90. [Google Scholar] [CrossRef]
- Fortes, C.; Vitti, A.C.; Otto, R.; Ferreira, D.A.; Franco, H.C.J.; Trivelin, P.C.O. Contribution of nitrogen from sugarcane harvest residues and urea for crop nutrition. Sci. Agric. 2013, 70, 313–320. [Google Scholar] [CrossRef] [Green Version]
- Paredes Junior, F.P.; Portilho, I.I.R.; Mercante, F.M. Atributos microbiológicos de um latossolo sob cultivo de cana-de-açúcar com e sem queima da palhada. Semin. Ciênc. Agrár. 2015, 36, 151–164. [Google Scholar] [CrossRef]
- Valim, W.C.; Panachuki, E.; Pavei, D.S.; Sobrinho, T.A.; Almeida, W.S. Effect of sugarcane waste in the control of interrill erosion. Semin. Ciênc. Agrár. 2016, 37, 1155–1164. [Google Scholar] [CrossRef]
- Aquino, G.S.; Medina, C.C.; Costa, D.C.; Shahaba, M.; Santiago, A.D.; Cunha, A.C.B.; Kussaba, D.A.O.; Carvalho, J.B.; Moreira, A. Does straw mulch partial-removal from soil interfere in yield and industrial quality sugarcane? A long term study. Ind. Crops Prod. 2018, 111, 573–578. [Google Scholar] [CrossRef]
- Lisboa, I.P.; Cherubin, M.R.; Lima, R.P.; Cerri, C.C.; Satiro, L.S.; Wienhol, B.J.; Schmer, M.R.; Jin, V.L.; Cerri, C.E.P. Sugarcane straw removal effects on plant growth and stalk yield. Ind. Crops Prod. 2018, 111, 794–806. [Google Scholar] [CrossRef]
- Tucker, C.J.; Holben, B.N.; Elgin, J.H.; Mcmurtrey, J.E. Relationship of spectral data to grain yield variation. Photogramm. Eng. Remote Sens. 1980, 46, 657–666. [Google Scholar]
- Tarnavsky, E.; Garrigues, S.; Brown, M.E. Multiscale geostatistical analysis of AVHRR, SPOT-VGT, and MODIS global NDVI products. Remote Sens. Environ. 2008, 112, 535–549. [Google Scholar] [CrossRef]
- Sanches, G.M.; Duft, D.G.; Kölln, O.T.; Luciano, A.C.; De Castro, S.G.; Okuno, F.M.; Franco, H.C. The potential for RGB images obtained using unmanned aerial vehicle to assess and predict yield in sugarcane fields. Int. J. Remote Sens. 2018, 15, 1–3. [Google Scholar] [CrossRef]
- Peralta, N.R.; Assefa, Y.; Du, J.; Barden, C.J.; Ciampitti, I.A. Mid-season high-resolution satellite imagery for forecasting site-specific corn yield. Remote Sens. 2016, 8, 1–16. [Google Scholar] [CrossRef]
- Damian, J.M.; Santi, A.L.; Fornari, M.; Da Ros, C.O.; Eschner, V.L. Monitoring variability in cash-crop yield caused by previous cultivation of a cover crop under a no-tillage system. Comput. Electron. Agric. 2017, 142, 607–621. [Google Scholar] [CrossRef]
- Lofton, J.; Tubana, B.S.; Kanke, Y.; Teboh, J.; Viator, H.; Dalen, M. Estimating sugarcane yield potential using an in-season determination of normalized difference vegetative index. Sensors 2012, 12, 7529–7547. [Google Scholar] [CrossRef] [PubMed]
- Yang, H.; Yang, X.; Heskel, M.; Sun, S.; Tang, J. Seasonal variations of leaf and canopy properties tracked by ground-based NDVI imagery in a temperate forest. Sci. Rep. 2017, 1267, 1–10. [Google Scholar] [CrossRef] [PubMed]
- Sardans, J.; Grau, O.; Chen, H.Y.H.; Janssens, I.A.; Ciais, P.; Piao, S.; Peñuelas, J. Changes in nutrient concentrations of leaves and roots in response to global change factors. Glob. Chang. Biol. 2017, 23, 3849–3856. [Google Scholar] [CrossRef]
- USDA-United States Department of Agriculture. Available online: https://www.usda.gov/ (accessed on 18 June 2018).
- CEPAGRI—Tempo e Clima Unicamp. Available online: https://www.cpa.unicamp.br (accessed on 2 February 2017).
- Posto Meteorológico “Professor Jesus Marden dos Santos” ESALQ—USP. Available online: http://www.leb.esalq.usp.br/posto/ (accessed on 2 February 2017).
- Raij, B.; Cantarella, H.; Guaggio, J.A.; Furlani, A.M.C. Recomendações De Adubação E Calagem Para O Estado De São Paulo, 1st ed.; Instituto Agronômico and Fundacão IAC: Campinas, Brazil, 1997; pp. 6–13. [Google Scholar]
- Vermote, E.F.; Tanre, D.; Deulze, J.L.; Herman, M.; Morcrette, J.J. Second Simulation of the Satellite Signal in the Solar Spectrum, 6S: An overview. IEEE Trans. Geosci. Remote 1997, 35, 675–686. [Google Scholar] [CrossRef]
- Carlotto, M.J. Reducing the effects of space-varying, wavelength-dependent scattering in multispectral imagery. Int. J. Remote Sens. 1999, 20, 3333–3344. [Google Scholar] [CrossRef] [Green Version]
- Neter, J.; Wasserman, W.; Kutner, M.H. Applied Linear Statistical Methods, 5th ed.; Irwin Professional Publishing: Chicago, IL, USA, 1985; pp. 50–78. [Google Scholar]
- Franco, H.C.J.; Pimenta, M.T.B.; Carvalho, J.L.N.; Magalhães, P.S.G.; Rossell, C.E.V.; Braunbeck, O.A.; Vitti, A.C.; Kolln, O.T.; Neto, J.R. Assessment of sugarcane trash for agronomic and energy purposes in Brazil. Sci. Agric. 2013, 70, 305–312. [Google Scholar] [CrossRef] [Green Version]
- Trivelin, P.C.O.; Franco, H.C.J.; Otto, R.; Ferreira, D.A.; Vitti, A.C.; Fortes, C.; Faroni, C.E.; Oliveira, E.C.A.; Cantarella, H. Impact of sugarcane trash on fertilizer requirements for São Paulo, Brazil. Sci. Agric. 2013, 70, 345–352. [Google Scholar] [CrossRef] [Green Version]
- Rosolem, C.A.; Calonego, J.C.; Foloni, J.S.S. Lixiviação de potássio da palha de espécies de cobertura de solo de acordo com a quantidade de chuva aplicada. Rev. Bras. Cienc. Sol. 2003, 27, 355–362. [Google Scholar] [CrossRef] [Green Version]
- Endres, L.; Cruz, S.J.S.; Vilela, R.D.; Santos, J.M.; Barbosa, G.V.S.; Silva, J.A.C. Foliar applications of calcium reduce and delay sugarcane flowering. Bioenerg. Res. 2016, 9, 98–108. [Google Scholar] [CrossRef]
- Vitti, G.; Luz, P.; Otto, R. Agrícola Ouro Verde, 10th ed.; Lençóis Paulista: Lencóis Paulista, Brazil, 2008; pp. 1–19. [Google Scholar]
- Campos, M.; Antonangelo, J.A.; Alleoni, L.R.F. Phosphorus sorption index in humid tropical soils. Soil Tillage Res. 2016, 156, 110–118. [Google Scholar] [CrossRef]
- Damon, P.M.; Bowden, B.; Rose, T.; Rengel, Z. Crop residue contributions to phosphorus pools in agricultural soils: A review. Soil Biol. Biochem. 2014, 74, 127–137. [Google Scholar] [CrossRef]
- Pavinato, P.S.; Rosolem, C.A. Disponibilidade de nutrientes no solo—Decomposição e liberação de compostos orgânicos de resíduos vegetais. Rev. Bras. Cienc. Sol. 2008, 32, 911–920. [Google Scholar] [CrossRef]
- Leite, J.M.; Ciampitti, I.A.; Mariano, E.; Vieira-Megda, M.X.; Trivelin, P.C. Nutrient, partitioning and stoichiometry in unburnt sugarcane ratoon at varying yield levels. Front. Plant Sci. 2016, 7, 1–14. [Google Scholar] [CrossRef] [PubMed]
- Paul, G.C.; Bokhtiar, S.M.; Rehman, H.; Kabiraj, R.C.; Rahman, A.B.M.M. Efficacies of some organic fertilizers on sustainable sugarcane production in old Himalayan piedmont plain soil of Bangladesh. Pak. Sugar J. 2005, 20, 2–5. [Google Scholar]
- Dotaniya, M.L.; Datta, S.C.; Biswas, D.R.; Dotaniya, C.K.; Meena, B.L.; Rajendiran, S.; Regar, K.L.; Lata, M. Use of sugarcane industrial by-products for improving sugarcane productivity and soil health. Int. J. Recycl. Org. Waste Agric. 2016, 5, 185–194. [Google Scholar] [CrossRef] [Green Version]
- Aquino, G.S.; Medina, C.C.; Costa, D.C.; Shahaba, M.; Santiago, A.D. Sugarcane straw management and its impact on production and development of ratoons. Ind. Crops Prod. 2017, 102, 58–64. [Google Scholar] [CrossRef]
- Singh, S.N.; Singh, A.K.; Malik, J.P.S.; Kumar, R.; Sharma, M.L. Cultural-practice packages and trash management effects on sugarcane ratoons under sub-tropical climatic conditions of India. J. Agric. Sci. 2012, 150, 237–247. [Google Scholar] [CrossRef]
- Castioni, G.A.; Cherubin, M.R.; Menandro, L.M.S.; Sanches, G.M.; de Oliveira Bordonal, R.; Barbosa, L.C.; Carvalho, J.L.N. Soil physical quality response to sugarcane straw removal in Brazil: A multi-approach assessment. Soil Tillage Res. 2018, 184, 301–309. [Google Scholar] [CrossRef]
- Carvalho, J.L.; Hudiburg, T.W.; Franco, H.C.; DeLucia, E.H. Contribution of above-and belowground bioenergy crop residues to soil carbon. Glob. Chang. Biol. Bioenerg. 2017, 9, 1333–1343. [Google Scholar] [CrossRef]
- Oliveira, D.M.; Williams, S.; Cerri, C.E.; Paustian, K. Predicting soil C changes over sugarcane expansion in Brazil using the DayCent model. Glob. Chang. Biol. Bioenerg. 2017, 9, 1436–1446. [Google Scholar] [CrossRef] [Green Version]
- Pitombo, L.M.; Cantarella, H.; Packer, A.P.C.; Ramos, N.P.; do Carmo, J.B. Straw preservation reduced total N2O emissions from a sugarcane field. Soil Use Manag. 2017, 33, 583–594. [Google Scholar] [CrossRef]
- Vasconcelos, A.L.S.; Cherubin, M.R.; Feigl, B.J.; Cerri, C.E.; Gmach, M.R.; Siqueira-Neto, M. Greenhouse gas emission responses to sugarcane straw removal. Biomass Bioenergy 2018, 113, 15–21. [Google Scholar] [CrossRef]
- Tavares, R.L.M.; Spokas, K.; Hall, K.; Colosky, E.; Souza, Z.M.D.; Scala, N.L. Sugarcane residue management impact soil greenhouse gas. Ciênc. Agrotec. 2018, 42, 195–203. [Google Scholar] [CrossRef]
- da Silva, J. Sistemas de manejo da palhada influenciam acúmulo de biomassa e produtividade da cana-de-açúcar (var. RB855453). Act. Sci. Agron. 2010, 32, 345–350. [Google Scholar] [CrossRef]
- Aquino, G.S.; de Conti Medina, C.; Junior, A.D.O.M.; Pasini, A.; Brito, O.R.; Cunha, A.C.B.; Almeida, L.F. Impact of harvesting with burning and management of straw on the industrial quality and productivity of sugarcane. Afr. J. Agric. Res. 2016, 11, 2462–2468. [Google Scholar] [CrossRef]
- Aquino, G.S.; de Conti Medina, C.; Silvestre, D.A.; Gomes, E.C.; Benitez, A.C.; Cunha, D.A.O.K.; Santiago, A.D. Straw removal of sugarcane from soil and its impacts on yield and industrial quality ratoons. Sci. Agric. 2018, 75, 526–529. [Google Scholar] [CrossRef]
- Wang, Q.; Tenhunen, J.; Dinh, N.Q.; Reichstein, M.; Vesala, T.; Keronen, P. Similarities in ground- and satellite-based NDVI time series and their relationship to physiological activity of a scots pine forest in finland. Remote Sens. Environ. 2004, 93, 225–237. [Google Scholar] [CrossRef]
- Balzarolo, M.; Anderson, K.; Nichol, C.; Rossini, M.; Vescovo, L.; Arriga, N.; Wohlfahrt, G.; Calvet, J.C.; Carrara, A.; Cerasoli, S.; et al. Ground-based optical measurements at european flux sites: A review of methods, instruments and current controversies. Sensors 2011, 11, 7954–7981. [Google Scholar] [CrossRef] [PubMed] [Green Version]
- Genc, L.; Turhan, H.; Asar, B.; Smith, S.E. Comparison of spectral indices from QUICKBIRD and ground based hyper-spectral data for winter wheat. World Appl. Sci. J. 2009, 7, 756–762. [Google Scholar] [CrossRef]
- Caturegli, L.; Casucci, M.; Lulli, F.; Grossi, N.; Gaetani, M.; Magni, S.; Bonari, E.; Volterrani, M. GeoEye-1 satellite versus ground-based multispectral data for estimating nitrogen status of turfgrasses. Int. J. Remote Sens. 2015, 36, 2238–2251. [Google Scholar] [CrossRef]
- Bu, H.; Sharma, L.K.; Denton, A.; Franzen, D.W. Comparison of Satellite Imagery and Ground-Based Active Optical Sensors as Yield Predictors in Sugar Beet, Spring Wheat, Corn, and Sunflower. Agron. J. 2017, 109, 299–308. [Google Scholar] [CrossRef]
- Morel, J.; Bégué, A.; Todoroff, P.; Martiné, J.F.; Lebourgeois, V.; Petit, M. Coupling a sugarcane crop model with the remotely sensed time series of fIPAR to optimise the yield estimation. Eur. J. Agron. 2014, 61, 60–68. [Google Scholar] [CrossRef]
- Bégué, A.; Lebourgeois, V.; Bappel, E.; Todoroff, P.; Pellegrino, A.; Baillarin, F.; Siegmund, B. Spatio-temporal variability of sugarcane fields and recommendations for yield forecast using NDVI. J. Remote Sens. 2010, 31, 5391–5407. [Google Scholar] [CrossRef] [Green Version]
- Jarrell, W.M.; Beverly, R.B. The dilution effect in plant nutrition studies. Adv. Agron. 1981, 34, 197–224. [Google Scholar] [CrossRef]
- Muchovej, R.M.; Newman, P.R.; Luo, Y. Sugarcane leaf nutrient concentrations: With or without midrib tissue. J. Plant. Nutr. 2005, 28, 1271–1286. [Google Scholar] [CrossRef]
- Al-Abbas, A.H.; Barr, R.; Hall, J.D.; Crane, F.L.; Baumgardner, M.F. Spectra of normal and nutrient-deficient maize leaves. Agron. J. 1974, 66, 16–20. [Google Scholar] [CrossRef]
- Raper, T.B.; Varco, J.J.; Hubbard, K.J. Canopy-Based normalized difference vegetation index sensors for monitoring cotton nitrogen status. Agron. J. 2013, 105, 1345–1354. [Google Scholar] [CrossRef]
- Fernandes, J.L.; Ebecken, N.F.F.; Esquerdo, J.C.D.N. Sugarcane yield prediction in Brazil using NDVI time series and neural networks ensemble. ISPRS J. Photogramm. Remote Sens. 2017, 38, 4631–4644. [Google Scholar] [CrossRef]


| Soil Layer (cm) | pH | C | P | K | Ca | Mg | Base Saturation | Al Saturation | Clay |
|---|---|---|---|---|---|---|---|---|---|
| H2O | g kg−1 | mg dm−3 | mmolc dm−3 | % | |||||
| Area 1 (Bom Retiro) | |||||||||
| 0–10 | 5.2 | 11.3 | 29.3 | 9.3 | 26.1 | 7.7 | 68.8 | 0.8 | 33 |
| 10–20 | 4.8 | 11.0 | 24.9 | 5.1 | 19.0 | 5.9 | 54.7 | 3.5 | 33 |
| 20–30 | 4.5 | 9.4 | 22.1 | 3.3 | 12.5 | 2.95 | 36.8 | 4.2 | 34 |
| Area 2 (Univalem) | |||||||||
| 0–10 | 5.2 | 6.1 | 17.4 | 3.3 | 9.3 | 2.9 | 51.1 | 2.4 | 11 |
| 10–20 | 4.8 | 5.5 | 14.1 | 2.6 | 4.8 | 1.5 | 34.8 | 5.6 | 11 |
| 20–30 | 4.5 | 4.9 | 12.7 | 2.1 | 3.6 | 1.0 | 27.5 | 7.4 | 12 |
| Straw Removal Rate (%) | Area 1 (Bom Retiro) | Area 2 (Univalem) | ||
|---|---|---|---|---|
| Year I | Year II | Year I | Year II | |
| Amount of straw left on the soil surface (Mg ha−1) # | ||||
| 100 | 0.0 ± 0.0 | 0.0 ± 0.0 | 0.0 ± 0.0 | 0.0 ± 0.0 |
| 50 | 8.7 ± 0.9 | 5.5 ± 1.0 | 10.2 ± 0.9 | 6.8 ± 0.4 |
| 25 | 15.1 ± 1.5 | 10.5 ± 0.1 | 12.5 ± 0.9 | 11.6 ± 0.5 |
| 0 | 18.9 ± 1.6 | 13.6 ± 2.0 | 16.4 ± 1.4 | 13.7 ± 1.1 |
| Sites | C | N | P | K | Ca | Mg | S | C:N Ratio |
|---|---|---|---|---|---|---|---|---|
| g kg−1 | ||||||||
| Area 1 I (Bom Retiro) | 479 | 2.58 | 0.39 | 1.66 | 1.96 | 1.38 | 0.45 | 177 |
| Area 1 II (Bom Retiro) | 470 | 3.10 | 0.34 | 0.56 | 2.44 | 1.24 | 0.35 | 152 |
| Area 2 I (Univalem) | 467 | 4.02 | 0.38 | 2.45 | 2.44 | 1.54 | 0.74 | 116 |
| Area 2 II (Univalem) | 422 | 6.04 | 0.58 | 1.30 | 8.55 | 2.55 | 0.95 | 73 |
| Straw Removal Rate (%) | Models | r2* | SRE | DW |
|---|---|---|---|---|
| Area 1 | ||||
| 0 | y = 205.38 − 48.66 P − 0.83 K − 58.36 NDVISI | 0.94 | 1.76 | 1.78 |
| 25 | y = 546.65 − 58.07 P − 30.31 N + 7.18 NDVISI | 0.91 | 1.31 | 1.52 |
| 50 | y = 322.62 − 108.24 P − 6.33 N + 60.36 NDVISI | 0.88 | 4.07 | 1.48 |
| 100 | y = 193.25 − 56.54 P + 4.25 NDVISI + 0.27 N | 0.85 | 2.10 | 1.65 |
| Overall (Area 1) | y = 136.70 + 42.84 NDVISI − 51.19 P + 1.61 N | 0.97 | 2.56 | 1.56 |
| Area 2 | ||||
| 0 | y = −13.20 + 1.75 N − 13.76 NDVISI | 0.87 | 6.64 | 1.44 |
| 25 | y = −166.31 + 25.60 P + 6.51 N + 22.76 NDVISI | 0.91 | 8.65 | 1.65 |
| 50 | y = 42.25 − 12.41 P + 22.23 NDVISI | 0.76 | 4.50 | 1.59 |
| 100 | y = 134.25 – 20.90 Ca − 20.51 P + 31.89 NDVISI | 0.94 | 4.29 | 1.56 |
| Overall (Area 2) | y = −127.21 + 3.80 NDVISI − 0.26 N + 54.88 P | 0.88 | 3.86 | 1.61 |
| Overall (Area 1 and Area 2) | y = −150.028 + 79.11 NDVISI − 3.65 N + 115.28 P | 0.89 | 1.79 | 1.72 |
| Area 1 | Area 2 | |||||||||||
|---|---|---|---|---|---|---|---|---|---|---|---|---|
| 0% | ||||||||||||
| P | K | NDVISI | OY | PY | N | NDVISI | OY | PY | ||||
| P | - | N | - | |||||||||
| K | 0.19 | - | NDVISI | −0.14 | - | |||||||
| NDVISI | −0.23 | 0.22 | - | OY | 0.54 * | 0.37 * | - | |||||
| OY | −0.84 ** | 0.60 ** | 0.71 ** | - | PY | 0.87 ** | 0.60 ** | 0.75 ** | - | |||
| PY | −0.86 ** | 0.62 ** | 0.74 ** | 0.97 ** | - | |||||||
| 25% | ||||||||||||
| P | N | NDVISI | OY | PY | P | N | NDVISI | OY | PY | |||
| P | - | P | - | |||||||||
| N | −0.85 ** | - | N | −0.49 * | - | |||||||
| NDVISI | 0.01 | 0.38 | - | NDVISI | −0.56 * | 0.02 | - | |||||
| OY | −0.62 * | 0.25 | 0.50 * | - | OY | 0.62 ** | 0.23 | −0.37 * | - | |||
| PY | −0.71 ** | 0.23 | 0.45 * | 0.98 ** | - | PY | 0.68 ** | 0.26 | −0.40 * | 0.90 ** | - | |
| 50% | ||||||||||||
| P | N | NDVISI | OY | PY | P | NDVISI | OY | PY | ||||
| P | - | P | - | |||||||||
| N | 0.15 | - | NDVISI | −0.41 * | - | |||||||
| NDVISI | −0.16 | 0.46 * | - | OY | −0.73 ** | 0.60 ** | - | |||||
| OY | −0.90 ** | 0.33 * | 0.84 ** | - | PY | −0.88 ** | 0.76 ** | 0.89 ** | - | |||
| PY | −0.96 ** | 0.35 * | 0.81 ** | 0.93 ** | - | |||||||
| 100% | ||||||||||||
| P | N | NDVISI | OY | PY | P | Ca | NDVISI | OY | PY | |||
| P | - | P | - | |||||||||
| N | −0.62 ** | - | Ca | −0.54 * | - | |||||||
| NDVISI | −0.39 * | 0.25 | - | NDVISI | 0.23 | 0.30 | - | |||||
| OY | −0.96 ** | 0.56 ** | 0.73 ** | - | OY | −0.22 | 0.64 ** | 0.30 | - | |||
| PY | −0.91 ** | 0.64 ** | 0.61 ** | 0.98 ** | - | PY | −0.14 | 0.72 ** | 0.29 | 0.97 ** | - | |
| Overall | ||||||||||||
| P | N | NDVISI | OY | PY | P | N | NDVISI | OY | PY | |||
| P | - | P | - | |||||||||
| N | 0.95 ** | - | N | 0.84 ** | - | |||||||
| NDVISI | −0.54 * | −0.28 | - | NDVISI | −0.24 | 0.12 | - | |||||
| OY | −0.84 ** | 0.68 ** | 0.86 ** | - | OY | −0.28 | −0.26 | 0.61 ** | - | |||
| PY | −0.81 ** | 0.61 ** | 0.93 ** | 0.96 ** | - | PY | −0.24 | −0.28 | 0.69 ** | 0.97 ** | - | |
| Overall (Area 1 and Area 2) | ||||||||||||
| P | N | NDVISI | OY | PY | ||||||||
| P | - | |||||||||||
| N | 0.96 ** | - | ||||||||||
| NDVISI | −0.08 | 0.08 | - | |||||||||
| OY | −0.45 * | 0.55 * | 0.60 ** | - | ||||||||
| PY | −0.50 * | 0.58 * | 0.68 ** | 0.90 ** | - | |||||||
© 2018 by the authors. Licensee MDPI, Basel, Switzerland. This article is an open access article distributed under the terms and conditions of the Creative Commons Attribution (CC BY) license (http://creativecommons.org/licenses/by/4.0/).
Share and Cite
Pinheiro Lisboa, I.; Melo Damian, J.; Roberto Cherubin, M.; Silva Barros, P.P.; Ricardo Fiorio, P.; Cerri, C.C.; Eduardo Pellegrino Cerri, C. Prediction of Sugarcane Yield Based on NDVI and Concentration of Leaf-Tissue Nutrients in Fields Managed with Straw Removal. Agronomy 2018, 8, 196. https://doi.org/10.3390/agronomy8090196
Pinheiro Lisboa I, Melo Damian J, Roberto Cherubin M, Silva Barros PP, Ricardo Fiorio P, Cerri CC, Eduardo Pellegrino Cerri C. Prediction of Sugarcane Yield Based on NDVI and Concentration of Leaf-Tissue Nutrients in Fields Managed with Straw Removal. Agronomy. 2018; 8(9):196. https://doi.org/10.3390/agronomy8090196
Chicago/Turabian StylePinheiro Lisboa, Izaias, Júnior Melo Damian, Maurício Roberto Cherubin, Pedro Paulo Silva Barros, Peterson Ricardo Fiorio, Carlos Clemente Cerri, and Carlos Eduardo Pellegrino Cerri. 2018. "Prediction of Sugarcane Yield Based on NDVI and Concentration of Leaf-Tissue Nutrients in Fields Managed with Straw Removal" Agronomy 8, no. 9: 196. https://doi.org/10.3390/agronomy8090196
APA StylePinheiro Lisboa, I., Melo Damian, J., Roberto Cherubin, M., Silva Barros, P. P., Ricardo Fiorio, P., Cerri, C. C., & Eduardo Pellegrino Cerri, C. (2018). Prediction of Sugarcane Yield Based on NDVI and Concentration of Leaf-Tissue Nutrients in Fields Managed with Straw Removal. Agronomy, 8(9), 196. https://doi.org/10.3390/agronomy8090196