Article

Long-Term N Fertilization Decreased Diversity and Altered the Composition of Soil Bacterial and Archaeal Communities

1
Department of Crop Sciences, University of Illinois, Urbana, IL 61801, USA
2
Centro de Recursos Naturales Renovables de la Zona Semiárida (CERZOS), Universidad Nacional del Sur, Bahía Blanca, Argentina
*
Author to whom correspondence should be addressed.
Agronomy 2019, 9(10), 574; https://doi.org/10.3390/agronomy9100574
Submission received: 16 July 2019 / Revised: 9 September 2019 / Accepted: 18 September 2019 / Published: 23 September 2019
(This article belongs to the Special Issue Soil Health in Agroecosystems)

Abstract

:
Soil microbial communities are essential in the cycling of nutrients that affect crop production. Our goal was to characterize the microbial community structure following 34 years of nitrogen (N) fertilization treatments in continuous maize production in highly fertile soils. Using 16S rRNA gene-based analysis of the V4 region via Illumina HiSeq2500 technology with downstream bioinformatics processing and analysis with QIIME 2.0, we aimed to characterize the prokaryotic communities under three increasing N fertilization rates. Factor analyses indicated that a high N level decreased the diversity of soil bacterial and archaeal communities and altered the relative abundance (RA) of the dominant (>1% RA) and minor (<1% RA) phyla. Among the 12 major phyla, we determined increases in Gemmatimonadetes, Proteobacteria, and Euryarchaeota, accompanied by reductions in Cyanobacteria, Chloroflexi, Firmicutes, and Planctomycetes with increasing N. Within the 29 minor phyla, N fertilization led to increases in Aquificae, WPS2, Parvarchaeota, AD3, FCPU426, Armatimonadetes, TM7, Chlamydiae, and OD1, along with reductions of Nitrospirae, WS3, Tenericutes, Lentisphaerae, OP3, Synergistetes, Thermotogae, and prokaryotes that could not be reliably assigned to a phylum (classified as Other).

1. Introduction

Nitrogen fertilizers have been a major contributor to the impressive crop yield increases realized since the 1950s [1], widely used to maintain soil fertility and crop productivity [2]. Soil microbial communities provide many benefits including assimilation of nutrients, plant disease resistance, and stabilization of the soil ecosystem [3,4]. In agronomic systems, these functions positively shift the soil quality and productive capacity over the long term [5]. Therefore, investigating the effects of nitrogen (N) fertilizers on soil microbial communities is of vital importance due to the critical part that microbes play in biochemical processes. Nitrogen additions directly affect plant residue quantity, quality, and rate of decomposition, thus shifting soil nutrient content [6] which can influence the size, structure, and function of microbial communities. Modern approaches, using phylogenetic surveys of bacteria employing universal primers, allow for characterization and comparison of the microbial diversity in different soil environments as well as the comparative analysis of changes in community structure due to management practices [7,8]. Although numerous studies have examined the influence of N fertilizer on the soil microbiome [9,10,11,12], most of these studies compared responses to organic and inorganic fertilizers; only a few studies examined the response of the soil microbiome to increasing N fertilizer rates in an agroecosystem [11,13,14,15,16,17].
Changes in nutrients and type of fertilizer (mineral vs. organic) can cause a shift in bacterial communities in soils subjected to fertilization, favoring more active, copiotrophic microbial communities [14,18]. Intensive agricultural management practices, including fertilization levels, are generally considered to lead to simpler, less diverse, soil food webs [19] with varied impact on microbial biomass [20,21]. Therefore, nitrogen enrichment, as shown in many experiments [22], usually leads to declines in microbial community diversity and species richness. In addition to diversity, phylogenetic shifts of the soil microbial community have also been observed in response to N fertilization [14]. In a recent meta-analysis, Geisseler and Scow [20] researched these influential factors using a dataset based on 64 long-term field trials from across the world. Urea or ammonium salts were the most commonly used fertilizers and the durations of these trials ranged from 5 to 130 years, while the N fertilization rates ranged from 10 to 650 kg N/ha, averaging 136 kg N/ha. The authors concluded that long-term repeated mineral N applications can alter microbial community composition.
Well-maintained long-term field experiments can provide insights into the long-term effects of agricultural practices on soil properties [23]. Field trials of N fertilization rates on continuous corn in this study were established in 1981, which presents a unique opportunity to characterize the bulk soil microbiome and to test whether microbial shifts occur under increasing N fertilization levels. An improved understanding of the microbial community can help translate beneficial effects on the soil environment such as reducing nitrate runoff and greenhouse gas emission [24,25], into actionable practices. However, baseline characterization of the soil biological component and microbial shifts under N fertilization is currently lacking in Illinois. Therefore, the objective of this study was to characterize the prokaryotic community structure under long-term N rates applied to continuous corn plots using DNA sequencing and bioinformatics analyses.

2. Materials and Methods

2.1. Site Descriptions and Soil Sampling

The detailed set up for this field trial was described previously [25]. This study was established in 1981 at the Northwestern Illinois Agricultural Research and Demonstration Center in Monmouth, IL (40°90′ N, 90°73′ W) to study the effects of N fertilization on crop yields. The soils are Muscatune series (fine-silty, mixed, superactive, mesic, Aquic Argiudolls) with surface soil being usually dark, greyish brown and granular in structure. The field trial consisted of three N fertilization rates (0, 202, and 269 kg N/ha) in continuous corn (CCC) arranged in a randomized complete block design (RCBD) with three replications. These rates represent the current average (202 kg N/ha) annual application of N and what can be considered an overapplication of N (269 kg N/ha) for continuous corn production. Total experimental units include 3 × 3 = 9 plots. The main plots in this trial were 12 m × 9 m. We continued the agronomic practices that have been in use in this long-term trial [25]. Tillage consists of primary tillage with a chisel plow 20–25 cm deep in the fall after harvest, and secondary tillage with a field cultivator before planting in the spring. Corn is planted in April or early May each year, in 76-cm rows at a density of about 75,000 seeds/ha. The N fertilizer at 0, 202, and 269 kg N/ha rates for corn was injected at 10–15 cm depth before planting using urea ammonium nitrate solution (28% N). Weed control was achieved by using recommended rates and timing of appropriate herbicides along with hand weeding if necessary. Plots were maintained weed free during the study period.
Soil sampling of this study was conducted immediately after harvest and before fall tillage in 2015, following 34 years of N rate treatments in the same plots each year. Three composite subsamples (~500 g each) per plot were collected to 10 cm depth using an Eijkelkamp grass plot sampler. Each composited subsample was collected walking in a zig-zag pattern and contained about 10 pushes of the soil sampler probe. Samples were preserved with ice packs in the field, and frozen to −20 ℃ upon arrival to our lab facilities. Results from laboratory analyses and determinations were averaged to get one value per plot per block, thus n = 3 for each N rate treatment.

2.2. Soil Characterization

After determining gravimetric water content for each soil sample, field moist soil was analyzed for available N, NO3, and NH4+ (mg/kg) using KCl extraction (1:5 ratio). Concentrations of NH4+ and NO3 from soil extracts (1 M KCl) were measured colorimetrically by flow injection analysis with a Lachat Quick-Chem 8000 (Lachat Quickchem Analyzer, Lachat Instruments, Loveland, CO, USA). Soil samples were then air-dried, sieved (<2 mm), and sent to a commercial laboratory (Brookside Laboratories, Inc., New Bremen, OH, USA). Cation exchange capacity (CEC, cmol/kg) was determined by the summation method of exchangeable cations (Ca2+, Mg2+, K, Na, and H+); soil organic matter (SOM, %) by loss on ignition; and soil pH (1:1, soil:water) with potentiometry.

2.3. Soil DNA Extraction, qPCR, and Sequencing

Total genomic DNA from the soil samples was extracted employing the Power Soil DNA isolation kit (MoBio Inc., Carlsbad, CA, USA) from 0.25 g of the composited soil samples, with the soils carefully homogenized before subsampling. The extracted DNA quantity and quality were checked with a Nanodrop 1000 Spectrophotometer (Thermo Scientific, Waltham, MA, USA) following the manufacturer’s protocol. The extracted DNA samples were stored at −20 °C until analysis. An amplicon library with individual barcodes for each sample and compatible with the Illumina HiSeq was constructed. To build the amplicon library, 25 µL PCR reactions were performed using a BioRad T100 thermal cycler in 25 µL volumes with 1× buffer (GoTaq® Flexi buffer; Promega Corp.), with the following composition: 2.5 mM MgCl2, 200 µM dNTPs, 0.4 µM each primer (forward and reverse), 1.0 µL template DNA (pooled amplicons), and 1.0 unit of GoTaq polymerase. PCR parameters were: initial denaturation at 95 °C for 10 min, followed by 34 cycles of amplification (45 secs at 95 °C; 45 s at 58 °C; 45 s at 72 °C), and a final extension at 72 °C for 10 min. PCR products were visualized on a 1.3% agarose gel containing GreenGlo™ Safe DNA dye (Denville Scientific, Inc. Metuchen, NJ, USA) under UV illumination. The 16S rRNA gene (V4 region) was amplified using the primer set 515F (GTGYCAGCMGCCGCGGTAA) and 806R (GGACTACNVGGGTATCTAAT) [26]. The primers were designed as 5′-PCR-specific + gene region + 3′-PCR-specific + 10 nt barcode and the Fluidigm platform utilized two primer sets simultaneously to create the final DNA amplicon.
The resulting amplicon libraries were quantitated with a Qubit Fluorometer and run on a bio-analyzer to evaluate the profile of fragment lengths. The barcoded libraries were pooled in equimolar concentrations and diluted to 10 nM. The diluted libraries were sequenced at the Roy Carver Biotechnology Center Functional Genomics lab at the University of Illinois at Urbana-Champaign (Urbana, IL, USA) using paired-end sequencing on the Illumina HiSeq2500 (Illumina, San Diego, CA, USA) in rapid mode yielding reads 250 nt in length.

2.4. Bioinformatic Analysis

The prokaryotic community composition and diversity were analyzed using the V4 region of 16S rRNA gene sequences. Quality control of the paired-end sequences included trimming of low-quality bases at the extreme of the sequences and filtering of sequences that had an average PHRED quality score <20, sequence length <200 nt or >800 nt, presence of ambiguous nucleotides, primer mismatch, and errors in the barcode. The primers on both forward and reverse reads were trimmed using the software Trimmomatic-0.36 [27]. The overlapping paired-end reads were joined using the fastq-join program [28]. The quality of reads was assessed using FASTQC. The chimera checking of the sequences was performed with USEARCH v5.2 [29] using GOLD as a reference database [30] and sequences identified as chimeric were filtered. The high-quality sequences were assigned to samples according to the barcodes. Sequences were clustered into operational taxonomic units (OTUs) using open reference OTU picking at 97% similarity threshold and clustered against the Greengenes 16S rRNA database [31]. The most abundant sequence of each OTU served as a representative sequence and was aligned using the Python Nearest Alignment Space Termination (PyNAST) algorithm with a minimum 80% identity [32]. Annotation of the taxonomic unit to representative OTU was based on classifications from the Ribosomal Database Project (RDP) and an OTU table was generated. Downstream processing of sequences was completed using the python programs built in the QIIME (Quantitative Insights into Microbial Ecology) pipeline v1.9.1 [33]. The rarefaction plot of the three treatments was generated following the QIIME tutorial protocols. The generated OTU table was rarefied to an even depth (135,639 sequences per sample) using the single_rarefaction.py script, thus all samples were retained for further analyses. The OTUs with a number of sequences <0.005% of the total number of sequences were discarded using filter_otus_from_otu_table.py script. Alpha diversity metrics including chao1 [34], Shannon’s index, Abundance-Based Coverage Estimator (ACE) and Fisher’s alpha [35] were extracted using alpha_diversity.py in the QIIME pipeline and compared among N fertilization rates as detailed in the statistical analysis subsection. To assess overall variation in community structure among treatments (i.e., beta-diversity), rarefied data from metabarcoding profiles were subjected to multivariate analysis using weighted UniFrac distances [36]. Ordination was performed using a principal coordinate analysis (PCoA) through_plot.py script in the QIIME pipeline to create data visualization of the relationships between samples from three increasing N fertilization rates. Non-parametric testing of beta diversity was performed employing jackknife resampling based on 5000 sequences per sample. A permutational multivariate analysis of variance using distance matrices to assess beta diversity was conducted in ADONIS (R built in to compare categories.py in the QIIME pipeline) [37].

2.5. Statistical Analysis

Linear mixed models were fit to each of the measured soil properties of pH, CEC, SOM, and available N forms using PROC GLIMMIX in SAS 9.4 (SAS Institute Inc., 2012); using the N rates and block factors as fixed and random terms, respectively. To analyze the prokaryotic community changes under increasing N fertilization rates, we deployed multivariate techniques followed by linear mixed models in SAS. The data set included 41 variables, which represented the relative abundances (RA, %) of each phylum extracted with the bioinformatics pipeline. Pearson’s correlation coefficients were calculated using the CORR procedure in SAS to explore the correlation among soil prokaryotes (data not shown). Correlations between variable pairs were found to be >|0.3| (moderate to high range) in most cases which indicated the need to deploy a data reduction technique such as principal component analysis (PCA) to avoid problems of multicollinearity by compiling the information into a new smaller set of uncorrelated variables. PCA was performed using the PROC FACTOR procedure with the priors = 1 option [38]. The analysis resulted in 13 principal components (PCs) with eigenvalues >1 together explaining 88% of the variability of the data set. Only those PCs that in addition explained >5% of the variability were included in subsequent analyses. Next, linear mixed models were fit to the PCs extracted using PROC GLIMMIX to evaluate the effect of N fertilization rates on the RA of the main phyla now summarized within the PCs. Blocks were considered a random effect and N rates as fixed effects. When appropriate, least square means were separated using the lines option of the lsmeans statement, setting the probability of Type I error at 0.05(α). Figure 3 was built in Sigma Plot 12.5 (Systat Software, Inc.) plotting the standard error of treatment means as inferential error bars [39].

3. Results

3.1. General Surface Soil Properties

Table 1 shows the results for the general soil characteristics of pH, CEC, SOM, and available N forms (NO3 and NH4+) under continuous corn production and in response to increasing N fertilization rates following 34 years of treatments. Results showed a gradual and statistically significant reduction in soil pH with increasing N fertilization rates, with a parallel increase in CEC. Soil organic matter (SOM) was not found to be affected by N additions, yet both available N forms showed statistically significant responses to fertilization. Nitrate levels (NO3) increased under the maximum N rate with no statistical differences detected between the 0 and the 202 kg N/ha fertilization rates. On the other hand, NH4+ concentration showed a gradual increase with increasing N rates.

3.2. Sequencing Summary

After the elimination of low-quality sequences using Trimmomatic and chimeras using USEARCH, a total of 6,459,949 bacterial 16S rRNA sequences were obtained with a range of 107,802 to 350,409 and a mean of 239,257 sequences per sample. To measure the quality and sufficiency of sequences in the samples of each treatment, a rarefaction plot was generated (Figure 1). In this study, all rarefaction curves tended to approach the saturation plateau indicating that only the rarest species remained to be sampled, and thus the sequences obtained were enough to capture the diversity information of the prokaryotic community within our samples.

3.3. Soil Prokaryotic Community Diversity

After the upstream bioinformatics analysis, a rarefied and filtered OTU table was generated using QIIME (data not shown). Table 2 shows the observed OTUs, phylogenetic diversity, and other estimators of alpha diversity and richness of the soil prokaryotic community. Statistically significant reductions were determined in the number of observed OTUs and all richness (Chao1 richness estimate and ACE diversity index) and diversity (phylogenetic diversity (PD), Fisher’s alpha, and Shannon’s diversity) parameters at the highest fertilization level (269 kg N/ha) compared to the parameters calculated from the control (0 kg N/ha) and the intermediate rate of 202 kg N/ha (Table 2).
To characterize the overall effect of N rates on the beta diversity of the total bacterial phyla, PCoA was applied to calculate the pairwise distances between the communities at 0, 202, and 269 kg N/ha N fertilization levels. The results of PCoA are shown in Figure 2 demonstrating a contrasting separation between the three N fertilization levels.
The three axes of the PCoA respectively explained 26.81%, 5.66%, and 4.50% of the total variance. Furthermore, the results of the permutational multivariate analysis of variance using weighted UniFrac distance matrices showed that the increasing N fertilization levels had a significant effect on the dispersion of beta diversity within the soil archaeal and bacterial communities (R2 = 0.34, p < 0.001).

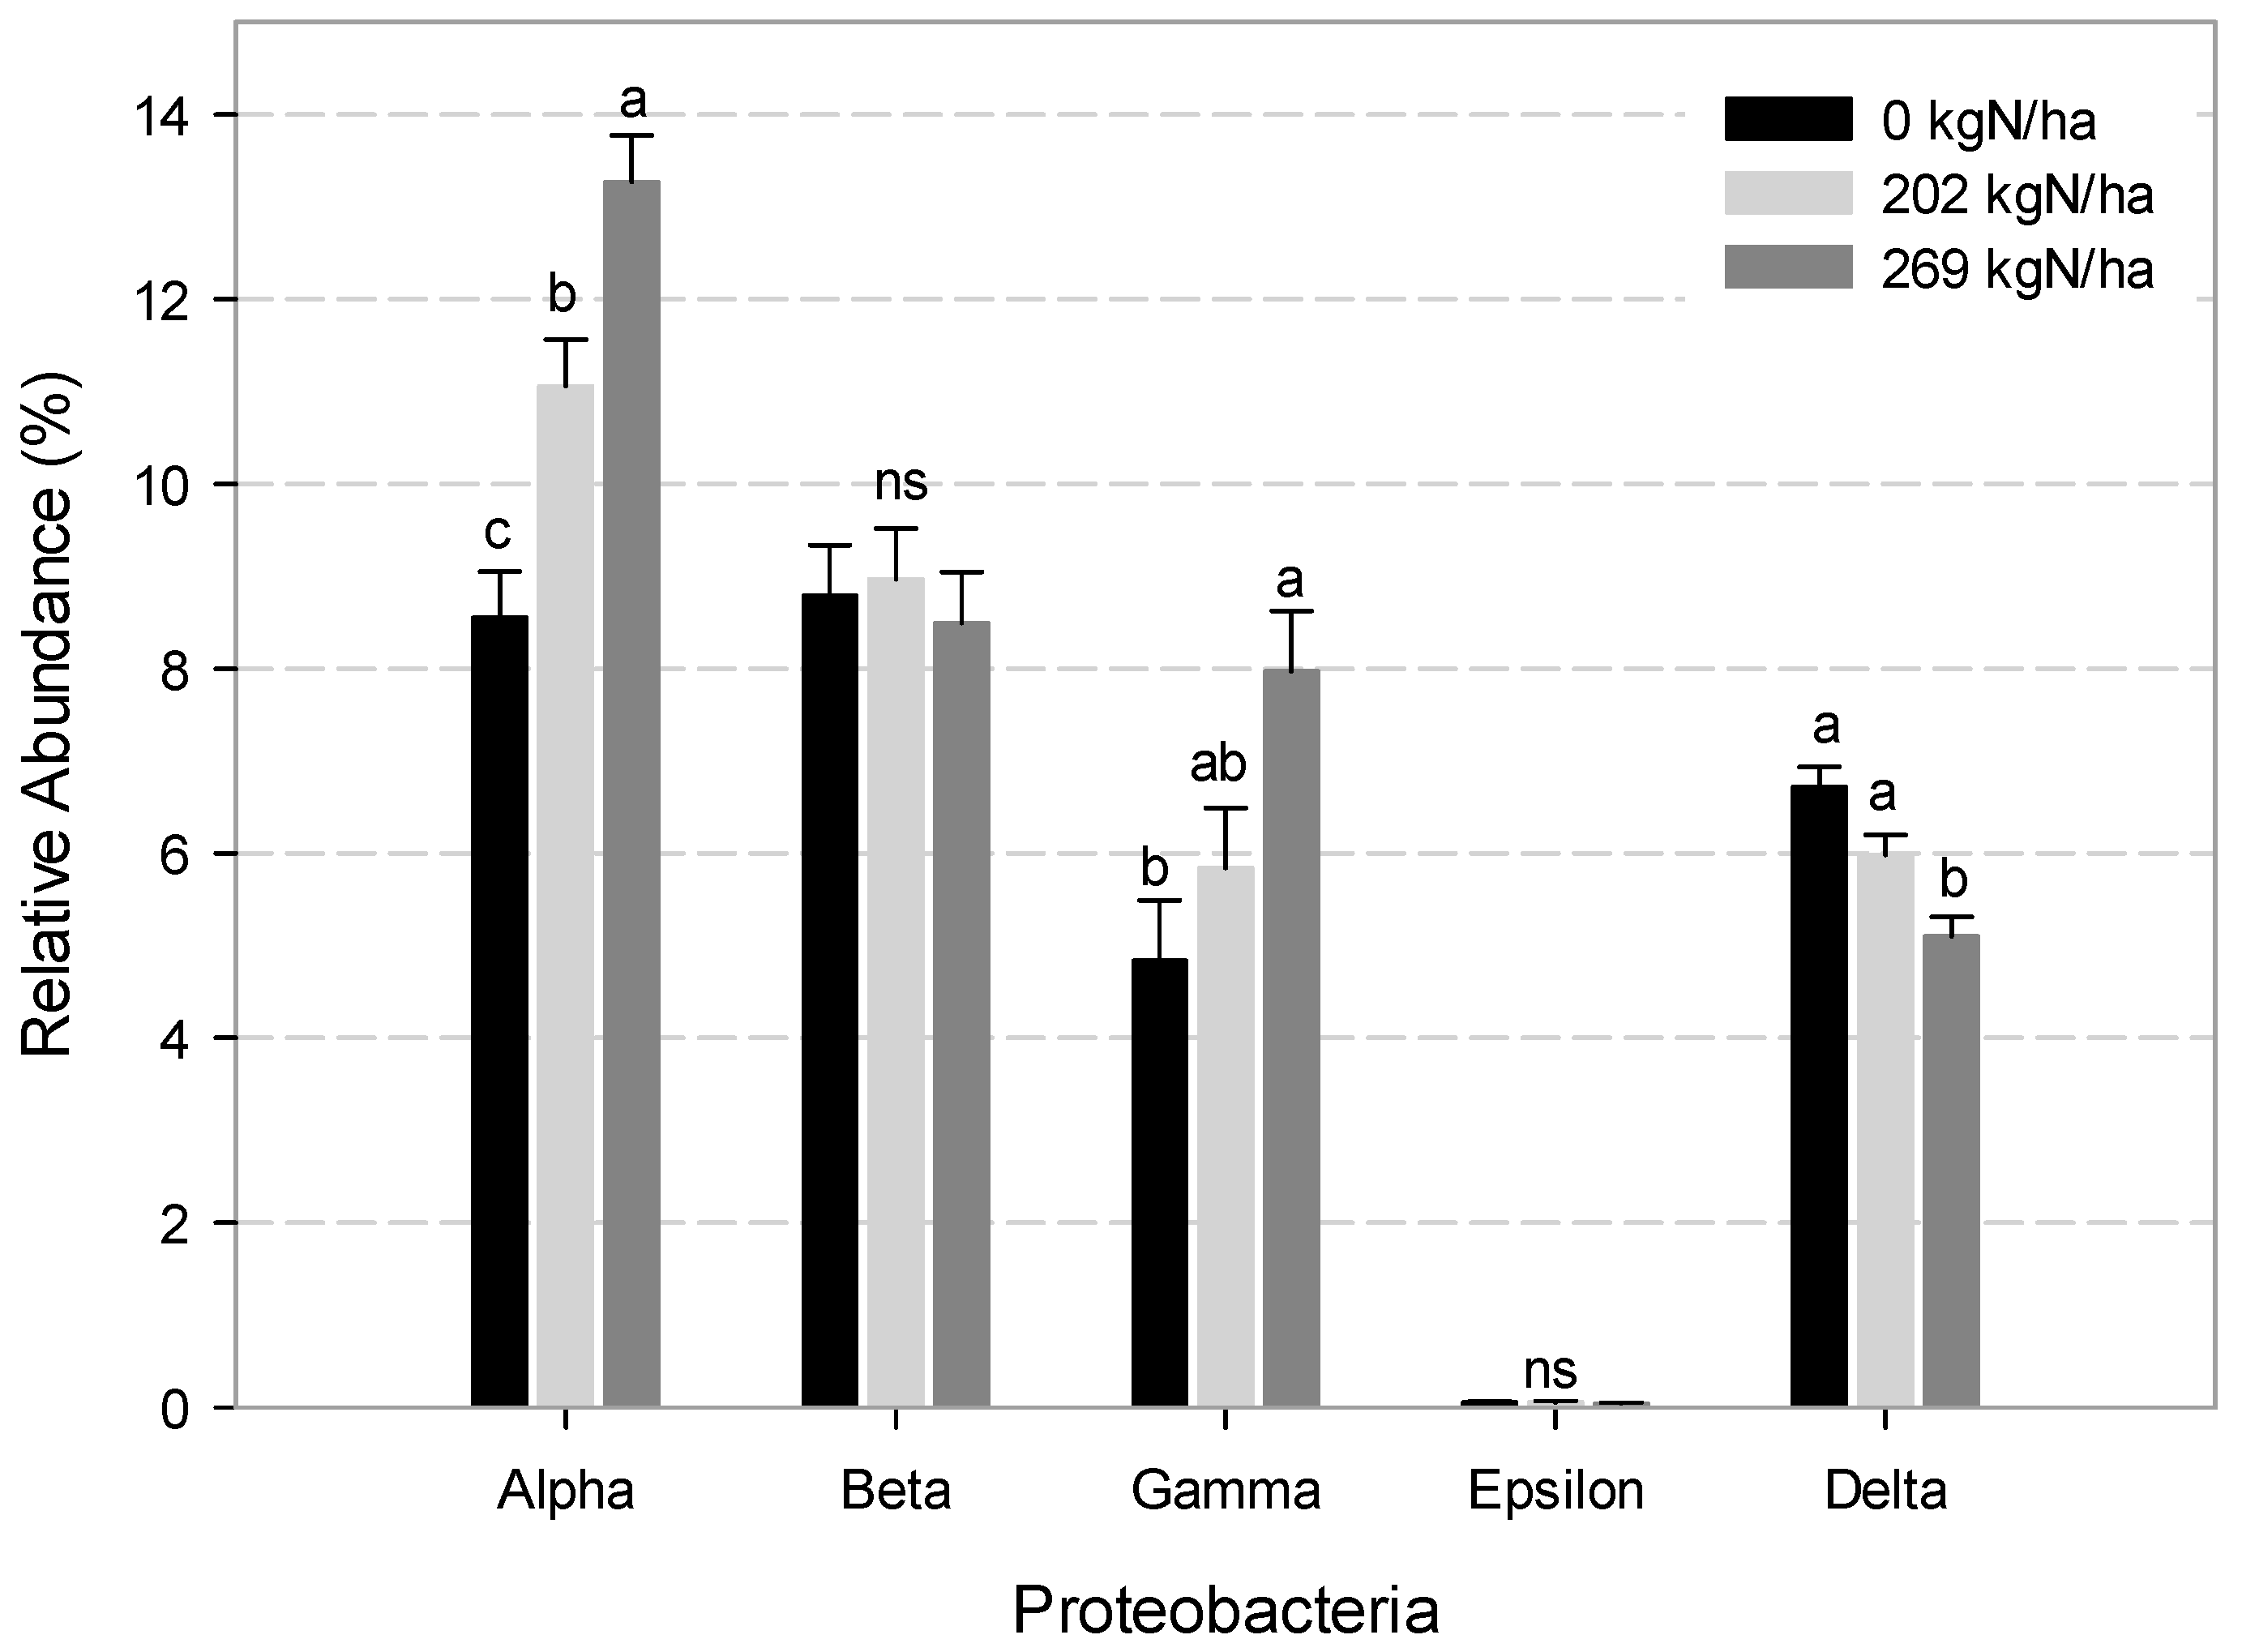
3.4. Soil Prokaryotic Community Composition

Forty-one different phyla including three archaea phyla were identified from the samples. The community structure expressed as relative abundances (RA, %) of the 41 phyla following 34 years of N fertilization at 0, 202, and 269 kg N/ha is shown in Table 3 and Table 4. Table 3 shows those phyla with >1% RA (12 groups) together accounting for about 95% of the total OTUs. Ordered from highest to lowest abundance, Table 4 shows the remaining 29 phyla detected in our samples that had <1% RA and accounted for the remaining 5% of the RA.
Thus, Table 3 shows that members of the phyla Proteobacteria, Acidobacteria, and Bacteroidetes dominated all treatment levels, with these three groups accounting for over 58% of the 94% total OTU abundance, collectively represented by the 12 phyla listed therein. On the other hand, for the minor groups listed in Table 4, the highest representation (1%–0.5% RA) within the 0 kg N/ha was determined for WS3, Nitrospirae, and Armatimonadetes, together accounting for 2.4% of the remaining 5.3% total OTUs. Phyla Parvarchaeota, Armatimonadetes, and WS3 were also within the top groups with an intermediate rate of N added (202 kg N/ha) and Aquificae appeared within the top three groups at the highest N level (269 kg N/ha) following Parvarchaeota and Armatimonadetes.
To avoid issues of multicollinearity in our results we conducted a PCA on the relative abundances of the 41 main phyla. The PCA on 41 variables rendered a set of 13 uncorrelated variables (PC 1 to PC 13) with eigenvalues larger than 1 that explained about 88% of the variability contained in the main phyla database. Only the initial five PCs extracted by this technique contributed more than 5% of explained variance and are thus presented in Table 5.
The first PC1 had the largest eigenvalue (11.99) and explained about 29% of the community taxonomic variability while including both dominant and minor taxa (Table 5). Among the dominant taxa, PC1 included high positive loadings (>0.5) for Chloroflexi, Cyanobacteria, Firmicutes, and Planctomycetes, and high negative loadings (<−0.5) for Gemmatimonadetes, Proteobacteria, and Euryarchaeota. For the minor taxa, PC1 included high positive loadings (>0.5) for Nitrospirae, WS3, Tenericutes, Lentisphaerae, OP3, Synergistetes, Thermotogae, and prokaryotes that could not be reliably assigned to a phylum (grouped as “Other”), as well as high negative loadings (<−0.5) for Aquificae, WPS2, Parvarchaeota, AD3, FCPU426, Armatimonadetes, TM7, Chlamydiae, and OD1.
As shown in Table 5, PC2 had an eigenvalue of 3.81 and explained an additional 10% of the variability in the dataset; PC2 eigenvector had high positive loadings for Chlamydiae, Chlorobi, Thermi, and TM7, and high negative loadings for AD3, Aquificae, and Elusimicrobia. The eigenvalue for PC3 was 3.37 and explained an additional 8% of the total variability. The PC3 eigenvector included high positive loadings for Acidobacteria, OP11, and Spirochaetes while including negative loadings for Actinobacteria and Choloroflexi (Table 5). The eigenvalue for PC4 was 2.75 and explained an additional 6% of the total variability. The PC4 eigenvector included high positive loadings for Crenarchaeota, and Elusimicrobia while including a negative loading for Bacteroidetes. The eigenvalue for PC5 was 2.55 and explained an additional 7% of the total variability. Lastly, the PC5 eigenvector included a high positive loading for EM19 and negative loadings for Other and Verrucomicrobia. Each of these PCs were used as independent variables in follow up analysis of variance (ANOVA) to test the effect of N fertilization levels on the RA of the phyla represented by each PC. The probability values and degrees of freedom associated with the ANOVA for the effects of N rate are shown in the lower portion of Table 5 for each extracted PCs. The N fertilization effect was statistically significant for PC1 but not statistically significant for any of the remaining PCs.
Thus, PC1 mean value under no N fertilization (1.12) was statistically and significantly different (LSD0.05 = 0.41) from the mean value measured under 202 kg N/ha (−0.9), which was also statistically different that the PC1 mean value following 34 years of N fertilization at a rate of 269 kg N/ha (−1.13). Thus, the phyla represented within PC1 showed a clear and gradual response to the increased N application. Scheme 1 depicts the changes in RA% of dominant and minor prokaryotic phyla with increasing N rates following 34 years of management as summarized by the measured changes in PC1 scores.
Specifically, for the Proteobacteria phyla, Figure 3 shows the changes in the RA of the main classes under increasing N additions. Thus, Alphaproteobacteria and Gammaproteobacteria showed gradual and statistically significant increases in their RAs with each additional N rate (p < 0.0001 and p = 0.0028, respectively). While the RA of Deltaproteobacteria decreased with the rates of 202 kg N/ha and 269 kg N/ha (p = 0.0009), Betaproteobacteria and Epsilonproteobacteria were not affected by N fertilization.

4. Discussion

A number of previous studies have revealed that N application level significantly influences microbial biomass, community composition, and function [14,15,40]. While many studies on 25 grassland sites across the world detected changes in soil bacterial communities across the N gradient over the long-term [41], research on Illinois agricultural field sites was missing in this regard. Using a long-term fertilization field experiment established in 1981, we monitored the structure of soil prokaryotic communities. We chose sequencing the V4 locus of 16S ribosomal RNA genes of prokaryotes in order to characterize the community shifts associated with long-term N-fertilization treatment. While the analysis of the response of microbial communities within this low level of taxonomic resolution (phylum) is done under the (false) assumption that all members of a phylum have similar biochemical and metabolic capabilities, it is however a convenient and commonly adopted approach to look for patterns within a manageable number of groups. Moreover, despite the enormous amount of phylogenetic and physiological diversity within the main bacterial phyla, functional diversity may be broadly mapped across major phyla of Bacteria and Archaea [42,43].
The highest rate of N fertilization caused a decline in all alpha diversity indexes after a 34-year treatment, which coincides with other research studies [43,44]. Direct effect of increased N input on prokaryotic community structure may be linked to the indirect effect of pH changes when soil nutrient availability and pH are concomitantly altered by fertilization [16]. Ding et al. [44] observed significant reduction of alpha diversity indexes in N P K fertilization treatment compared to unfertilized soil cropped with maize–wheat–soybean rotation. These contrasting changes are mainly associated with reduced soil pH [43], due to the long-term application of urea and ammonium fertilizers [45]. Likely, high N levels in mineral fertilizer have resulted in intensified soil acidification through nitrification of the ammonium applied [17]. Intermediate levels of N may not reflect pronounced shifts in soil pH, given that some of the acidity produced by nitrification is neutralized when plants take up more nitrate than cations [46]. Our results demonstrate a similar point, in that there is a significant difference between the intermediate and high N rate group on all alpha diversity and richness indicators, while no significant differences were found between the control and intermediate N rate group (Table 2). Shifts in the prokaryotic community structure could be attributed not only to pH changes but also to the change of the C/N ratio brought about by long-term N fertilization [47].
Results from our PCA showed that soil prokaryotic communities significantly differed among the three levels of N input, along the PC1. The variability among samples was explained by seven dominant taxa (with RA >1%) and 15 minor taxa (RA <1%). Therefore, we focused the analysis of composition shifts in that subset of phyla. Phyla showing negative correlations with PC1 are those that increased in RA under increased N input. Conversely, the phyla that have positive correlations with the PC1 diminished in their RA with increasing N levels. We found that the relative abundance of 11 bacterial and two archaeal groups increased with increasing N rates. The major bacterial group affected was Proteobacteria. This phylum comprises more than one third of the species that have been characterized up to date [42], and their members display enormous metabolic diversity. Increased nutrient inputs stimulate the growth of potential copiotrophic bacteria, while impairing oligotrophs [14]. It is of no surprise, then, that the overall group responded to increasing levels of N as most members of this group fall in the copiotrophic and generalist lifestyle, demanding high nutrient levels [48]. Moreover, the main steps in the biogeochemical N cycle such as N fixation, denitrification, and nitrification, are driven by Proteobacteria [42]. At the finer level of resolution of classes, N fertilization increased the relative abundances of the so-called copiotrophic Alphaproteobacteria and Gammaproteobacteria, while Deltaproteobacteria diminished and Betaproteobacteria and Epsilonproteobacteria were unaffected by N inputs (Figure 3). Our results are in agreement with those reported by Li et al. [43], in soil cultivated with maize with different N levels, as well as with similar patterns observed in soil under wheat–maize–soybean crop rotation and fertilized with inorganic N [44].
The phylum Gemmatimonadetes was the second largest group responding positively to N fertilization. This phylum is one of the most commonly detected phyla in 16S rRNA gene libraries from soil [49]. Other authors have previously reported increased relative abundance of Gemmatimonadetes in fertilized soils of distinct origin [50,51,52]. Under changing environments, it has been proposed that these microorganisms are able to fine-tune their C and N intake according to their metabolic needs, suggesting a generalist ecological strategy [52]. In that way, Gemmatimonadetes may be able to take advantage of the higher nutrient input provided with the highest N rate.
Aquificae and Armatimonadetes were among the bacterial groups which positively responded to long-term inorganic N input. Aquificae harbors some species that display autotrophic, chemolitotrophic, and microaerophilic growth, and some of them are able to use nitrate as an electron acceptor conducive to denitrification [42], while in previous studies, Armatimonadetes responded positively to the addition of inorganic NPK fertilizer [50]. These responses might help explain their higher abundance under high N levels in the present study.
Other bacterial groups that comprised a small proportion of total diversity, with RA<0.1% also responded positively to N input, namely Chlamydia, FCPU-426, WPS-2, AD3, TM7, and OD1 (Parcubacteria). Phylum Chlamydia comprises few species within a single order Chlamydiales, all of which are obligate intracellular parasites of eukaryotes, and are ubiquitous in nature within free living amoeba [42]. The rest of those groups are candidate phyla, with no cultivated representatives, that are collectively designated as the “microbial dark matter”; they remain to be characterized [53]. However, they have been detected previously in fertilized soils at comparable relative abundances (<1%) [49].
Both Euryarchaeota, which showed RA slightly higher than 1%, and Parvarchaeota (RA <1%), responded positively to N input. The Euryarchaeota is the largest archaeal phyla and the most metabolically diverse. This group includes strictly anaerobic methanogens; obligate aerobic extreme halophiles, and the acidophiles Thermoplasma and Ferroplasma, that thrive in low pH environments growing as chemolithotrophs oxidizing ferrous iron [42]. Members of Euryachaeota are capable of both N2 fixation and denitrification, so it is not surprising that their relative abundance increases under higher N input. Parvarchaeota members are characterized by their small size and limited metabolic capabilities, as they lack biosynthetic pathways for all amino acid synthesis, and thus, they must scavenge them from the environment contributing to the N cycling. Studied representatives have been shown to closely interact with Thermoplasmatales (Euryarchaeota) which possibly act as a host providing amino acids and thus explain the co-occurrence in our study and others [54].
Groups that decreased under increasing N levels belong to four dominant bacterial phyla (Chloroflexi, Cyanobacteria, Firmicutes, and Planctomycetes) and eight minor taxa with RA <1%. Chloroflexi, Cyanobacteria, and Firmicutes are frequent inhabitants in the soil environment, contributing to the main steps of the N cycle (N fixation and denitrification), while members of the Planctomycetes phylum are responsible for the anaerobic ammonia oxidation. Their RA in our study where comparable to the reported values in Chinese black soils during the maize growing season [43]. Relative abundances of Cyanobacteria [55] and Planctomycetes [50] were reported to decrease with inorganic N fertilization compared to unfertilized control or organic fertilization. Both Chloroflexi and Planctomycetes were reported among the most abundant phyla in soils of the Argentine Pampas, with higher RA in pristine soil in comparison to fertilized agricultural soil [52].
Among the less abundant taxa (RA <1%) the phylum Nitrospirae was also negatively affected by increasing N inputs. This phylum comprises species that oxidize nitrite autotrophically, and have been classified as K-strategist, oligotrophic bacteria with a high affinity for nitrite scavenging. Thus, it can be argued that high levels of N fertilization may negatively affect the growth of this group by favoring the growth of other competing nitrite oxidizers, such as Nitrobacter with an r-strategist lifestyle [53]. The RA of candidate phylum Latescibacteria (WS3) was highest in unfertilized soils (0.98%). In contrast to our results, Latescibacteria sequences showed higher RA in fertilized agricultural soil samples from the Pampas region (4%) in comparison to pristine soil [9,52]. Both phyla have been shown to correlate positively to soil pH [16], thus the high N ratio might have indirectly reduced their RA by decreasing soil pH. Relative abundances of Tenericutes, Lentisphaerae, OP3, Synergistetes, and Thermotogae also decreased with increasing N fertilization, yet their RA was well below 1%. Little is known about these groups and their physiological and ecological roles, so discussion of the observed results is limited by the available information.
Usually, as it occurs in our study, data reporting prokaryotic community structure refer to relative, not absolute, abundances. As such, decreases in the relative abundance of certain groups could mean no change at all in the absolute number of these taxa, especially right after incorporation of crop residues and/or nutrient inputs that may greatly increase the abundance of fast-growing copiotrophic prokaryotes but not necessarily result in reduced abundance of other groups [47]. This present study was conducted after continuous corn was fertilized annually for 34 years, however, soil sampling was done immediately after harvest. Thus, we can safely attribute the detected changes in prokaryotic community structure among treatments to the long-lasting effects of fertilization on the soil environment.
Although we are aware that the prokaryotic community response may be better assessed by refining the analysis and examining bacterial and archaeal composition at a lower taxonomic level (at genus or OTU level), the broad taxonomic level used in this first exploratory analysis was efficient and sensitive enough to disclose the large impact of long-term N fertilization on overall prokaryotic diversity.
Our results suggest that main responding taxa may be those driving key steps in the N cycle. This hypothesis is partially supported by a recent research conducted to quantify genes encoding N cycle functions in the same field trial [13]. However, it should be confirmed by our future work towards prediction of functions based on 16S rRNA gene sequences by in silico analysis (with tools such as PiCrust or Tax4Fun).

5. Conclusions

Long-term N fertilization treatments have resulted in differences in the structure of soil prokaryotic communities modifying the relative abundance of archaeal and bacterial groups. A more complete understanding of the long-term interactions and feedback between fertilization practices, soil properties, and diversity of prokaryotic communities is essential for enabling the design of optimal agronomic practices that improve agricultural sustainability.

Author Contributions

Conceptualization, M.B.V., S.R.-Z., and M.C.Z.; methodology, R.S., P.Z., C.W.R., M.C.Z. and S.R.-Z.; formal analysis, R.S., P.Z., M.B.V., and S.R.-Z.; resources, M.B.V., S.R.-Z. and C.W.R.; data curation, M.B.V., S.R.-Z., R.S. and C.W.R.; writing—original draft preparation, R.S., M.C.Z. and M.B.V.; writing—review and editing, M.B.V. and M.C.Z.; supervision, M.B.V., and S.R.-Z.; project administration, M.B.V.; funding acquisition, M.B.V.

Funding

This research was partially funded by a HATCH Grant (no. ILLU-802-947) and by Award No. AG 2018-67019-27807, both from the USDA National Institute of Food and Agriculture.

Acknowledgments

We are thankful to Alvaro Hernandez and Mark Band from the Roy Carver Biotechnology Center for Functional Genomics lab at the University of Illinois at Urbana-Champaign for their assistance with the creation of soil DNA libraries. We appreciate the contributions of Greg Steckel, and Marty Williams in managing the experimental site, and the everyday help of Samuel Kato, and Gevan Behnke, with field and lab activities.

Conflicts of Interest

The authors declare no conflicts of interest. The funders had no role in the design of the study; in the collection, analyses, or interpretation of data; in the writing of the manuscript, or in the decision to publish the results.

References

  1. Robertson, G.; Vitousek, P.M. Nitrogen in Agriculture: Balancing the Cost of an Essential Resource. Annu. Rev. Environ. Resour. 2009, 34, 97–125. [Google Scholar] [CrossRef] [Green Version]
  2. Shen, J.P.; Zhang, L.M.; Guo, J.F.; Ray, J.L.; He, J.Z. Impact of long-term fertilization practices on the abundance and composition of soil bacterial communities in Northeast China. Appl. Soil Ecol. 2010, 46, 119–124. [Google Scholar] [CrossRef]
  3. Figueiredo, M.; Seldin, L.; Araujo, F.; Mariano, R. Plant Growth Promoting Rhizobacteria: Fundamentals and Applications. In Plant Growth and Health Promoting Bacteria. Microbiology Monographs; Springer: Berlin/Heidelberg, Germany, 2010. [Google Scholar]
  4. Gupta, V.V.S.R.; Germida, J.J. Soil aggregation: Influence on microbial biomass and implications for biological processes. Soil Biol. Biochem. 2015, 80, A3–A9. [Google Scholar] [CrossRef]
  5. LeBauer, D.S.; Treseder, K.K. Nitrogen limitation of net primary productivity in terrestrial ecosystems is globally distributed. Ecology 2008, 89, 371–379. [Google Scholar] [CrossRef] [PubMed]
  6. Zhong, W.H.; Gu, T.; Wang, W.; Zhang, B.; Lin, X.G.; Huang, Q.R.; Shen, W.S. The effects of mineral fertilizer and organic manure on soil microbial community and diversity. Plant Soil 2010, 326, 511–522. [Google Scholar] [CrossRef]
  7. Daniel, R. The metagenomics of soil. Nat. Rev. Microbiol. 2005, 3, 470–478. [Google Scholar] [CrossRef]
  8. Myrold, D.D.; Zeglin, L.H.; Jansson, J.K. The Potential of Metagenomic Approaches for Understanding Soil Microbial Processes. Soil Sci. Soc. Am. J. 2014, 78, 3–10. [Google Scholar] [CrossRef]
  9. Paul Chowdhury, S.; Babin, D.; Sandmann, M.; Jacquiod, S.; Sommermann, L.; Sorensen, S.J.; Fliessbach, A.; Mader, P.; Geistlinger, J.; Smalla, K.; et al. Effect of long-term organic and mineral fertilization strategies on rhizosphere microbiota assemblage and performance of lettuce. Environ. Microbiol. 2019, 21, 2426–2439. [Google Scholar] [CrossRef]
  10. Francioli, D.; Schulz, E.; Lentendu, G.; Wubet, T.; Buscot, F.; Reitz, T. Mineral vs. Organic Amendments: Microbial Community Structure, Activity and Abundance of Agriculturally Relevant Microbes Are Driven by Long-Term Fertilization Strategies. Front. Microbiol. 2016, 7, 1446. [Google Scholar] [CrossRef] [Green Version]
  11. Babin, D.; Deubel, A.; Jacquiod, S.; Sørensen, S.J.; Geistlinger, J.; Grosch, R.; Smalla, K. Impact of long-term agricultural management practices on soil prokaryotic communities. Soil Biol. Biochem. 2019, 129, 17–28. [Google Scholar] [CrossRef]
  12. Hartmann, M.; Frey, B.; Mayer, J.; Mäder, P.; Widmer, F. Distinct soil microbial diversity under long-term organic and conventional farming. ISME J. 2015, 9, 1177–1194. [Google Scholar] [CrossRef] [PubMed]
  13. Huang, L.; Riggins, C.; Rodríguez-Zas, S.; Zabaloy, M.; Villamil, M. Long-term N fertilization imbalances potential N acquisition and transformations by soil microbes. Sci. Total Environ. 2019, 691, 562–571. [Google Scholar] [CrossRef] [PubMed]
  14. Fierer, N.; Lauber, C.L.; Ramirez, K.S.; Zaneveld, J.; Bradford, M.A.; Knight, R. Comparative metagenomic, phylogenetic and physiological analyses of soil microbial communities across nitrogen gradients. ISME J. 2012, 6, 1007–1017. [Google Scholar] [CrossRef] [PubMed]
  15. Yevdokimov, I.; Gattinger, A.; Buegger, F.; Munch, J.C.; Schloter, M. Changes in microbial community structure in soil as a result of different amounts of nitrogen fertilization. Biol. Fertil. Soils 2008, 44, 1103–1106. [Google Scholar] [CrossRef]
  16. Zhang, Y.; Shen, H.; He, X.; Thomas, B.W.; Lupwayi, N.Z.; Hao, X.; Thomas, M.C.; Shi, X. Fertilization Shapes Bacterial Community Structure by Alteration of Soil pH. Front. Microbiol. 2017, 8, 1325. [Google Scholar] [CrossRef] [PubMed] [Green Version]
  17. Zhao, S.; Qiu, S.; Cao, C.; Zheng, C.; Zhou, W.; He, P. Responses of soil properties, microbial community and crop yields to various rates of nitrogen fertilization in a wheat–maize cropping system in north-central China. Agric. Ecosyst. Environ. 2014, 194, 29–37. [Google Scholar] [CrossRef]
  18. Ramirez, K.S.; Craine, J.M.; Fierer, N. Consistent effects of nitrogen amendments on soil microbial communities and processes across biomes. Glob. Chang. Biol. 2012, 18, 1918–1927. [Google Scholar] [CrossRef]
  19. Bender, S.F.; Wagg, C.; Van Der Heijden, M.G. An Underground Revolution: Biodiversity and Soil Ecological Engineering for Agricultural Sustainability. Trends Ecol. Evol. 2016, 31, 440–452. [Google Scholar] [CrossRef]
  20. Geisseler, D.; Scow, K.M. Long-term effects of mineral fertilizers on soil microorganisms—A review. Soil Biol. Biochem. 2014, 75, 54–63. [Google Scholar] [CrossRef]
  21. McDaniel, M.D.; Tiemann, L.K.; Grandy, A.S. Does agricultural crop diversity enhance soil microbial biomass and organic matter dynamics? A meta-analysis. Ecol. Appl. 2014, 24, 560–570. [Google Scholar] [CrossRef] [PubMed] [Green Version]
  22. Suding, K.N.; Collins, S.L.; Gough, L.; Clark, C.; Cleland, E.E.; Gross, K.L.; Milchunas, D.G.; Pennings, S. Functional-and abundance-based mechanisms explain diversity loss due to N fertilization. Proc. Natl. Acad. Sci. USA 2005, 102, 4387–4392. [Google Scholar] [CrossRef] [PubMed]
  23. Powlson, D.S.; Stirling, C.M.; Jat, M.L.; Gerard, B.G.; Palm, C.A.; Sanchez, P.A.; Cassman, K.G. Limited potential of no-till agriculture for climate change mitigation. Nat. Clim. Chang. 2014, 4, 678–683. [Google Scholar] [CrossRef]
  24. Kramer, S.B.; Reganold, J.P.; Glover, J.D.; Bohannan, B.J.M.; Mooney, H.A. Reduced nitrate leaching and enhanced denitrifier activity and efficiency in organically fertilized soils. Proc. Natl. Acad. Sci. USA 2006, 103, 4522–4527. [Google Scholar] [CrossRef] [PubMed] [Green Version]
  25. Jagadamma, S.; Lal, R.; Hoeft, R.G.; Nafziger, E.D.; Adee, E.A. Nitrogen fertilization and cropping systems effects on soil organic carbon and total nitrogen pools under chisel-plow tillage in Illinois. Soil Tillage Res. 2007, 95, 348–356. [Google Scholar] [CrossRef]
  26. Fierer, N.; Jackson, J.A.; Vilgalys, R.; Jackson, R.B. Assessment of soil microbial community structure by use of taxon-specific quantitative PCR assays. Appl. Environ. Microbiol. 2005, 71, 4117–4120. [Google Scholar] [CrossRef]
  27. Bolger, A.M.; Lohse, M.; Usadel, B. Trimmomatic: A flexible trimmer for Illumina sequence data. Bioinformatics 2014, 30, 2114–2120. [Google Scholar] [CrossRef]
  28. Aronesty, E. Comparison of Sequencing Utility Programs. Open Bioinform. J. 2013, 7, 1–8. [Google Scholar] [CrossRef]
  29. Edgar, R.C. Search and clustering orders of magnitude faster than BLAST. Bioinformatics 2010, 26, 2460–2461. [Google Scholar] [CrossRef] [Green Version]
  30. Reddy, T.B.; Thomas, A.D.; Stamatis, D.; Bertsch, J.; Isbandi, M.; Jansson, J.; Mallajosyula, J.; Pagani, I.; Lobos, E.A.; Kyrpides, N.C. The Genomes OnLine Database (GOLD) v.5: A metadata management system based on a four level (meta) genome project classification. Nucleic Acids Res. 2015, 43, D1099–D1106. [Google Scholar] [CrossRef]
  31. DeSantis, T.Z.; Hugenholtz, P.; Larsen, N.; Rojas, M.; Brodie, E.L.; Keller, K.; Huber, T.; Dalevi, D.; Hu, P.; Andersen, G.L. Greengenes, a chimera-checked 16S rRNA gene database and workbench compatible with ARB. Appl. Environ. Microbiol. 2006, 72, 5069–5072. [Google Scholar] [CrossRef]
  32. Caporaso, J.G.; Bittinger, K.; Bushman, F.D.; DeSantis, T.Z.; Andersen, G.L.; Knight, R. PyNAST: A flexible tool for aligning sequences to a template alignment. Bioinformatics 2010, 26, 266–267. [Google Scholar] [CrossRef]
  33. Caporaso, J.G.; Kuczynski, J.; Stombaugh, J.; Bittinger, K.; Bushman, F.D.; Costello, E.K.; Fierer, N.; Peña, A.G.; Goodrich, J.K.; Gordon, J.I.; et al. QIIME allows analysis of high-throughput community sequencing data. Nat. Methods 2010, 7, 335–336. [Google Scholar] [CrossRef] [Green Version]
  34. Chao, A. Nonparametric-Estimation of the Number of Classes in a Population. Scand. J. Stat. 1984, 11, 265–270. [Google Scholar]
  35. Walther, B.A.; Moore, J.L. The concepts of bias, precision and accuracy, and their use in testing the performance of species richness estimators, with a literature review of estimator performance. Ecography 2005, 28, 815–829. [Google Scholar] [CrossRef]
  36. Lozupone, C.; Knight, R. UniFrac: A new phylogenetic method for comparing microbial communities. Appl. Environ. Microbiol. 2005, 71, 8228–8235. [Google Scholar] [CrossRef] [PubMed]
  37. Warton, D.I.; Wright, S.T.; Wang, Y. Distance-based multivariate analyses confound location and dispersion effects. Methods Ecol. Evol. 2012, 3, 89–101. [Google Scholar] [CrossRef]
  38. Yeater, K.M.; Villamil, M.B. Chapter 14: Multivariate Methods for Agricultural Research, in Applied Statistics in Agricultural, Biological, and Environmental Sciences; American Society of Agronomy, Crop Science Society of America, and Soil Science Society of America, Inc.: Madison, WI, USA, 2018; pp. 371–400. [Google Scholar] [CrossRef]
  39. Cumming, G.; Fidler, F.; Vaux, D.L. Error bars in experimental biology. J. Cell Biol. 2007, 177, 7–11. [Google Scholar] [CrossRef] [Green Version]
  40. Lu, M.; Yang, Y.; Luo, Y.; Fang, C.; Zhou, X.; Chen, J.; Yang, X.; Li, B. Responses of ecosystem nitrogen cycle to nitrogen addition: A meta-analysis. New Phytol. 2011, 189, 1040–1050. [Google Scholar] [CrossRef]
  41. Leff, J.W.; Jones, S.E.; Prober, S.M.; Barberán, A.; Borer, E.T.; Firn, J.L.; Harpole, W.S.; Hobbie, S.E.; Hofmockel, K.S.; Knops, J.M.H.; et al. Consistent responses of soil microbial communities to elevated nutrient inputs in grasslands across the globe. Proc. Natl. Acad. Sci. USA 2015, 112, 10967–10972. [Google Scholar] [CrossRef] [Green Version]
  42. Madigan, M.T.; Martinko, J.M.; Bender, K.S.; Buckley, D.H.; Stahl, D.A. Brock Biology of Microorganisms, 14th ed.; Pearson: Boston, MA, USA, 2015. [Google Scholar]
  43. Li, H.; Zhang, Y.; Yang, S.; Wang, Z.; Feng, X.; Liu, H.; Jiang, Y. Variations in soil bacterial taxonomic profiles and putative functions in response to straw incorporation combined with N fertilization during the maize growing season. Agric. Ecosyst. Environ. 2019, 283, 106578. [Google Scholar] [CrossRef]
  44. Ding, J.; Jiang, X.; Ma, M.; Zhou, B.; Guan, D.; Zhao, B.; Zhou, J.; Cao, F.; Li, L.; Li, J. Effect of 35 years inorganic fertilizer and manure amendment on structure of bacterial and archaeal communities in black soil of northeast China. Appl. Soil Ecol. 2016, 105, 187–195. [Google Scholar] [CrossRef]
  45. Guo, J.H.; Liu, X.J.; Zhang, Y.; Shen, J.L.; Han, W.X.; Zhang, W.F.; Christie, P.; Goulding, K.W.T.; Vitousek, P.M.; Zhang, F.S. Significant acidification in major Chinese croplands. Science 2010, 327, 1008–1010. [Google Scholar] [CrossRef] [PubMed]
  46. Barak, P.; Jobe, B.O.; Krueger, A.R.; Peterson, L.A.; Laird, D.A. Effects of long-term soil acidification due to nitrogen fertilizer inputs in Wisconsin. Plant Soil 1997, 197, 61–69. [Google Scholar] [CrossRef]
  47. Chávez-Romero, Y.; Navarro-Noya, Y.E.; Reynoso-Martínez, S.C.; Sarria-Guzmán, Y.; Govaerts, B.; Verhulst, N.; Dendooven, L.; Luna-Guido, M. 16S metagenomics reveals changes in the soil bacterial community driven by soil organic C, N-fertilizer and tillage-crop residue management. Soil Tillage Res. 2016, 159, 1–8. [Google Scholar] [CrossRef]
  48. Fierer, N.; Bradford, M.A.; Jackson, R.B. Toward an ecological classification of soil bacteria. Ecology 2007, 88, 1354–1364. [Google Scholar] [CrossRef] [PubMed]
  49. Debruyn, J.M.; Nixon, L.T.; Fawaz, M.N.; Johnson, A.M.; Radosevich, M. Global biogeography and quantitative seasonal dynamics of Gemmatimonadetes in soil. Appl. Environ. Microbiol. 2011, 77, 6295–6300. [Google Scholar] [CrossRef] [PubMed]
  50. Van Der Bom, F.; Nunes, I.; Raymond, N.S.; Hansen, V.; Bonnichsen, L.; Magid, J.; Nybroe, O.; Jensen, L.S. Long-term fertilisation form, level and duration affect the diversity, structure and functioning of soil microbial communities in the field. Soil Biol. Biochem. 2018, 122, 91–103. [Google Scholar] [CrossRef]
  51. Nemergut, D.R.; Townsend, A.R.; Sattin, S.R.; Freeman, K.R.; Fierer, N.; Neff, J.C.; Bowman, W.D.; Schadt, C.W.; Weintraub, M.N.; Schmidt, S.K. The effects of chronic nitrogen fertilization on alpine tundra soil microbial communities: Implications for carbon and nitrogen cycling. Environ. Microbiol. 2008, 10, 3093–3105. [Google Scholar] [CrossRef]
  52. Carbonetto, B.; Rascovan, N.; Álvarez, R.; Mentaberry, A.; Vazquez, M.P. Structure, composition and metagenomic profile of soil microbiomes associated to agricultural land use and tillage systems in Argentine Pampas. PLoS ONE 2014, 9, e99949. [Google Scholar] [CrossRef]
  53. Rinke, C.; Schwientek, P.; Sczyrba, A.; Ivanova, N.N.; Anderson, I.J.; Cheng, J.-F.; Darling, A.; Malfatti, S.; Swan, B.K.; Gies, E.A.; et al. Insights into the phylogeny and coding potential of microbial dark matter. Nature 2013, 499, 431–437. [Google Scholar] [CrossRef] [Green Version]
  54. Chen, L.X.; Méndez-García, C.; Dombrowski, N.; Servín-Garcidueñas, L.E.; Eloe-Fadrosh, E.A.; Fang, B.Z.; Luo, Z.H.; Tan, S.; Zhi, X.Y.; Hua, Z.S.; et al. Metabolic versatility of small archaea Micrarchaeota and Parvarchaeota. ISME J. 2018, 12, 756–775. [Google Scholar] [CrossRef] [PubMed]
  55. Poulsen, P.H.; Abu Al-Soud, W.; Bergmark, L.; Magid, J.; Hansen, L.H.; Sørensen, S.J. Effects of fertilization with urban and agricultural organic wastes in a field trial—Prokaryotic diversity investigated by pyrosequencing. Soil Biol. Biochem. 2013, 57, 784–793. [Google Scholar] [CrossRef]
Figure 1. Rarefaction curves of the different soil DNA samples analyzed through Illumina HiSeq. The number of operative taxonomic units (OTUs) of prokaryotes is indicated for an increasing sampling effort (“sample size”) under each N rate treatment. Error bars are standard errors of treatment means at each increasing sampling effort; since all subsamples are considered in the creation of these plots, n = 9 for each fertilization rate.
Agronomy 09 00574 g001
Figure 2. Principal coordinate analysis (PCoA) plots based on weighted UniFrac distances generated for the soil 16S rRNA gene sequences from samples under each N rate treatment: 0 kg N/ha (red squares), 202 kg N/ha (blue circles), and 269 kg N/ha (orange triangles).
Agronomy 09 00574 g002
Scheme 1. An illustration of changes in the relative abundance (RA) of dominant (increased size font) and minor (regular font size) prokaryotic phyla brought about by increasing N fertilization levels after long-term N fertilization management. Phyla in green font show increases in their RA, while phyla in blue font show decreased RA with increasing N.
Agronomy 09 00574 sch001
Figure 3. Changes in the relative abundance of classes of Proteobacteria under increasing N rate treatments: 0 kg N/ha, 202 kg N/ha, and 269 kg N/ha. Error bars represent standard error of the treatment means (n = 3). Within a given class, bars with the same lowercase letter are not statistically different (p = 0.05). Likewise, “ns” for a class indicates no N rate effect for that group.
Agronomy 09 00574 g003
Table 1. General surface soil characteristics following 34 years of nitrogen (N) fertilization at rates of 0, 202, and 269 kg N/ha. Values represent treatment means of pH, cation exchange capacity (CEC, cmol/kg), soil organic matter (SOM, %), and available N forms (NO3 and NH4+, mg/kg). Probability values for the analysis of variance (ANOVA) for the effects of N fertilization rates (N rate, kg N/ha) are shown below for each variable. Within a column, values followed by the same letter are not significantly different from each other (α = 0.05).
N Rate
(kg N/ha)
pHCEC
(cmol/kg)
SOM
(%)
NO3
mg/kg
NH4+
mg/kg
0 6.33 a18.96 b3.62 a11.01 b2.71 b
202 6.04 ab19.93 ab3.93 a12.63 b3.68 ab
269 5.42 b22.51 a3.98 a24.47 a4.28 a
p-value0.01780.04900.24140.00450.0480
Table 2. Alpha diversity metrics for soil DNA samples following 34 years of N fertilization at rates of 0, 202, and 269 kg N/ha. Values represent treatment means of observed OTUs, phylogenetic diversity (PD), Chao1 richness estimate (Chao1), and Shannon’s, Abundance-Based Coverage Estimator (ACE), and Fisher’s alpha diversity indexes. Probability values for the analysis of variance (ANOVA) for the effects of N fertilization rates (N rate) are shown below for each variable. Within a column, values followed by the same letter are not significantly different from each other (α = 0.05).
N Rate
(kg N/ha)
Observed OTUsPDChao1Shannon’sACEFisher’s
0 2258 a122.0 a2379 a10.00 a2340 a420.3 a
202 2245 a120.8 a2367 a9.93 a2336 a414.0 a
269 2055 b111.7 b2191 b9.62 b2151 b370.3 b
p-value0.01930.00340.03850.00070.02740.0102
Table 3. Mean values (mean), and standard errors of the means (SEM) of relative abundances measured for the dominant taxa (>1% relative abundance (RA)) determined under each N fertilization rate (0, 202, and 269 kg N/ha) following 34 years of N treatments.
N Rate0202269
VariableMeanSEMMeanSEMMeanSEM
Proteobacteria29.020.8431.960.7234.900.82
Acidobacteria17.450.8116.560.6015.760.76
Bacteroidetes11.830.6712.530.9610.220.53
Actinobacteria9.220.877.590.498.240.72
Chloroflexi5.850.434.590.304.070.20
Verrucomicrobia5.570.205.990.185.090.23
Gemmatimonadetes5.190.366.020.287.230.31
Planctomycetes4.260.084.030.113.600.12
Euryarchaeota1.870.072.250.062.390.13
Crenarchaeota1.740.181.430.101.560.17
Cyanobacteria1.450.330.500.140.230.03
Firmicutes1.250.061.050.070.920.07
Cumulative RA94.70 94.50 94.21
Table 4. Mean values (mean), and standard errors of the means (SEM) of relative abundances measured for the non-dominant taxa (<1% RA) determined under each N fertilization rate (0, 202, and 269 kg N/ha) following 34 years of N treatments.
N rate0202269
VariableMeanSEMMeanSEMMeanSEM
WS30.9800.1100.6400.0500.2700.050
Nitrospirae0.8500.0800.4500.0500.3300.040
Armatimonadetes0.5800.0500.7800.0900.8100.060
Parvarchaeota0.3400.0400.8600.1301.0700.160
Aquificae0.1800.0400.4600.0900.7000.110
Tenericutes0.6210.0370.4410.0480.2740.032
Other0.5680.0630.4150.0340.4270.062
Elusimicrobia0.2920.0460.3340.0410.3240.045
Chlorobi0.1810.0240.1740.0240.2220.055
Spirochaetes0.1430.0330.1490.0300.1190.018
Fibrobacteres0.0830.0290.1150.0790.0620.015
OP30.0750.0190.0340.0100.0260.006
AD30.0720.0310.2120.0570.3270.061
Thermi0.0700.0150.0400.0110.0470.011
Lentisphaerae0.0700.0240.0040.0020.0010.001
Thermotogae0.0510.0130.0360.0130.0090.004
FCPU4260.0430.0190.1100.0280.1370.027
Synergistetes0.0330.0090.0110.0030.0040.003
WS20.0190.0090.0070.0030.0010.000
BRC10.0140.0050.0070.0020.0130.007
EM190.0140.0060.0090.0030.0110.008
TM60.0100.0060.0200.0100.0170.006
TM70.0080.0060.0530.0180.2400.089
Deferribacteres0.0070.0040.0040.0020.0070.003
OD10.0050.0030.0160.0060.0400.015
Chlamydiae0.0020.0020.0070.0030.0390.012
WPS20.0020.0010.1050.0260.2190.048
OP110.0010.0010.0070.0040.0190.012
OP80.0010.0000.0060.0030.0180.008
Cumulative RA5.32 5.50 5.78
Table 5. Principal component analysis results for the identified soil prokaryotic taxa showing eigenvalues and cumulative proportion of the variability explained by each of the five principal components (PCs) extracted with eigenvalues >1 and explaining >5% of the data set variability. Component correlation scores (eigenvectors) with loadings greater than |0.5| are in bold. Probability values for the analysis of variance (ANOVA) for the effects of N fertilization rates (N rate) are shown below for each extracted PC.
PC1PC2PC3PC4PC5
Eigenvalue11.993.813.372.752.55
Cum. Proportion0.290.390.470.530.60
Microbial groupEigenvalues
Acidobacteria0.10.00.50.30.4
Actinobacteria0.2−0.1−0.90.1−0.2
AD3−0.7−0.50.00.00.0
Aquificae−0.8−0.50.00.1−0.1
Armatimonadetes−0.6−0.1−0.20.3−0.3
Bacteroidetes0.4−0.10.3−0.6−0.3
BR−C10.20.30.00.2−0.2
Chlamydiae−0.60.6−0.10.10.1
Chlorobi−0.20.70.10.00.1
Chloroflexi0.70.1−0.60.10.3
Crenarchaeota0.40.20.20.5−0.4
Cyanobacteria0.70.0−0.30.0−0.1
Deferribacteres0.10.40.20.3−0.2
Elusimicrobia−0.1−0.50.30.50.2
EM190.1−0.40.30.10.6
Euryarchaeota−0.60.20.20.20.0
FCPU426−0.70.00.0−0.20.3
Fibrobacteres0.20.3−0.10.10.0
Firmicutes0.70.2−0.10.20.0
Gemmatimonadetes−0.7−0.3−0.10.40.1
Lentisphaerae0.60.20.40.3−0.2
Nitrospirae0.8−0.10.20.40.2
OD1−0.50.20.0−0.10.1
OP11−0.3−0.20.50.00.4
OP30.60.0−0.20.10.3
OP8−0.4−0.3−0.10.0−0.3
Other0.50.0−0.10.2−0.5
Parvarchaeota−0.70.3−0.10.20.0
Planctomycetes0.7−0.4−0.1−0.1−0.1
Proteobacteria−0.70.30.2−0.30.2
Spirochaetes0.20.40.5−0.3−0.1
Synergistetes0.6−0.1−0.40.00.5
Tenericutes0.80.00.00.20.2
Thermi0.40.50.0−0.10.2
Thermotogae0.60.1−0.1−0.40.1
TM6−0.20.10.40.2−0.1
TM7−0.60.6−0.20.00.2
Verrucomicrobia0.4−0.30.4−0.3−0.5
WPS2−0.80.0−0.20.3−0.2
WS20.3−0.10.0−0.30.2
WS30.80.00.40.30.0
Factorp-values
N rate<0.00010.60470.31560.37070.6335

