Article

Assessing the Impact of Best Management Practices in a Highly Anthropogenic and Ungauged Watershed Using the SWAT Model: A Case Study in the El Beal Watershed (Southeast Spain)

by
Adrián López-Ballesteros
1,
Javier Senent-Aparicio
1,*,
Raghavan Srinivasan
2 and
Julio Pérez-Sánchez
1
1
Department of Civil Engineering, Catholic University of San Antonio, Campus de Los Jeronimos s/n, 30107 Guadalupe, Murcia, Spain
2
Department of Ecosystem Science and Management, Texas A&M University, 534 John Kimbrough Blvd., College Station, TX 77843-2120, USA
*
Author to whom correspondence should be addressed.
Agronomy 2019, 9(10), 576; https://doi.org/10.3390/agronomy9100576
Submission received: 22 July 2019 / Revised: 12 September 2019 / Accepted: 14 September 2019 / Published: 24 September 2019
(This article belongs to the Special Issue Model Application for Sustainable Agricultural Water)

Abstract

:
Best management practices (BMPs) provide a feasible solution for non-point source pollution problems. High sediment and nutrient yields without retention control result in environmental deterioration of surrounding areas. In the present study, the soil and water assessment tool (SWAT) model was developed for El Beal watershed, an anthropogenic and ungauged basin located in the southeast of Spain that drains into a coastal lagoon of high environmental value. The effectiveness of five BMPs (contour planting, filter strips, reforestation, fertilizer application and check dam restoration) was quantified, both individually and in combination, to test their impact on sediment and nutrient reduction. For calibration and validation processes, actual evapotranspiration (AET) data obtained from a remote sensing dataset called Global Land Evaporation Amsterdam Model (GLEAM) were used. The SWAT model achieved good performance in the calibration period, with statistical values of 0.78 for Kling–Gupta efficiency (KGE), 0.81 for coefficient of determination (R2), 0.58 for Nash–Sutcliffe efficiency (NSE) and 3.9% for percent bias (PBIAS), as well as in the validation period (KGE = 0.67, R2 = 0.83, NS = 0.53 and PBIAS = −25.3%). The results show that check dam restoration is the most effective BMP with a reduction of 90% in sediment yield (S), 15% in total nitrogen (TN) and 22% in total phosphorus (TP) at the watershed scale, followed by reforestation (S = 27%, TN = 16% and TP = 20%). All effectiveness values improved when BMPs were assessed in combination. The outcome of this study could provide guidance for decision makers in developing possible solutions for environmental problems in a coastal lagoon.

1. Introduction

Highly anthropogenic regions commonly have serious environmental problems, due to the impact of such human activities as intensive agriculture and mining extractions, among others. Environmental impact intensifies when extreme climate conditions characterize the affected area [1]. Surrounding areas that have high ecological value can also aggravate the problem. All of the conditions described above characterize the El Beal watershed, which drains into the coastal lagoon Mar Menor. A site of special environmental significance, Mar Menor has been classified as one of the most valuable and threatened sites in the European Natura 2000 network and included in the list of Wetlands of International Importance (RAMSAR) and Specially Protected Areas of Mediterranean Importance (SPAMI) [2]. Historically, external nutrient inputs into Mar Menor occurred primarily via atmospheric deposition and groundwater, mainly due to the high ratio of sediment surface area to water volume and lack of major watercourses. Recently, as is the case for many other Mediterranean coastal zones, the area surrounding Mar Menor has experienced an intensification of agricultural practices and a marked increase in tourist activities, resulting in increased nutrient inputs into the lagoon. In 2016, the eutrophication process caused an important reduction in water turbidity, affecting the tourism industry and regional economy. The local government reacted by creating the Scientific Advisory Committee of Mar Menor [3] and approving, by decree law, some urgent measures to ensure environmental sustainability of the Mar Menor area [2,4]. These measures include fertilizer application control and the implementation of best management practices (BMPs). Such requirements are applied mainly in the surrounding areas of the coastal lagoon to mitigate the problems with water quality. The implementation of these measures promises to impact both the private and public sectors, with clear socioeconomic consequences: Recent studies appraised the economic impact of farmers’ implementing these measures at over 500 million euros [5]. However, the effectiveness of the measures proposed have not yet been evaluated.
BMPs are established to ensure the environmental sustainability of a particular area. BMPs refer to the soil and water conservation practices, management techniques and social actions that protect the environment [6]. Reduction of sediment and nutrients in the incoming watercourses is a central requirement of the applied regulations in the Mar Menor coastal lagoon. BMPs are an effective mechanism to reduce sediment and nutrients from non-point sources [7]. However, there is a remarkable lack of knowledge concerning the extent to which the required BMPs can effectively reduce the sediment and nutrient yields in the application area. Given that the effectiveness of BMPs cannot be tested across all situations, watershed managers depend on models to provide an estimate of their impact on improving water quality at the watershed scale [8]. It is important to estimate the pollution reduction efficiency of these BMPs to help policymakers guide future resource allocations [9]. To estimate pollution and determine the effectiveness of BMPs, use of the Soil and Water Assessment Tool (SWAT) [10] is proposed. This is the most widely used hydrological model in the world [11]. Many studies use SWAT to evaluate the water quality benefits of agricultural conservation practices [12]. Such studies usually focus on fertilizer application control, changes in land use and other management practices, such as tillage management, filter strips or contour farming [13]. However, SWAT applications evaluating BMPs in Spain are scarce in the scientific literature. Such studies have been conducted mostly in the north of the country [14,15], where streams are perennial and water resources are in a natural regime.
The SWAT model is usually calibrated using stream gauging stations. However, in ungauged catchments, where discharge measurements are not available, calibration based on remotely-sensed data may provide an alternative solution [16]. Actual evapotranspiration (AET) is a key process in the hydrologic cycle and one of the most difficult components to evaluate [17]. In the present study, satellite AET data from the Global Land Evaporation Amsterdam Model (GLEAM) [18] was used to calibrate and validate the SWAT model. AET calibration and validation is less common, because evapotranspiration data are usually unavailable. However, recent studies have demonstrated that the SWAT model can be calibrated and validated with AET data [17,19,20,21]. Moreover, the use of AET data entails the incorporation of actual agricultural practices carried out in the watershed, which supposes an improvement in the accuracy of the model.
Therefore, the main objectives of this study were as follows: (1) to obtain a high-performance calibrated and validated SWAT model for El Beal watershed, using remote-sensing AET data and (2) to implement individual and combined BMPs in SWAT to evaluate their effectiveness in controlling non-point source pollutants. To the best of our knowledge, no studies have used the approach proposed in this study of using remote-sensing data to calibrate the SWAT model in an ungauged watershed to assess the effectiveness of BMPs.

2. Materials and Methods
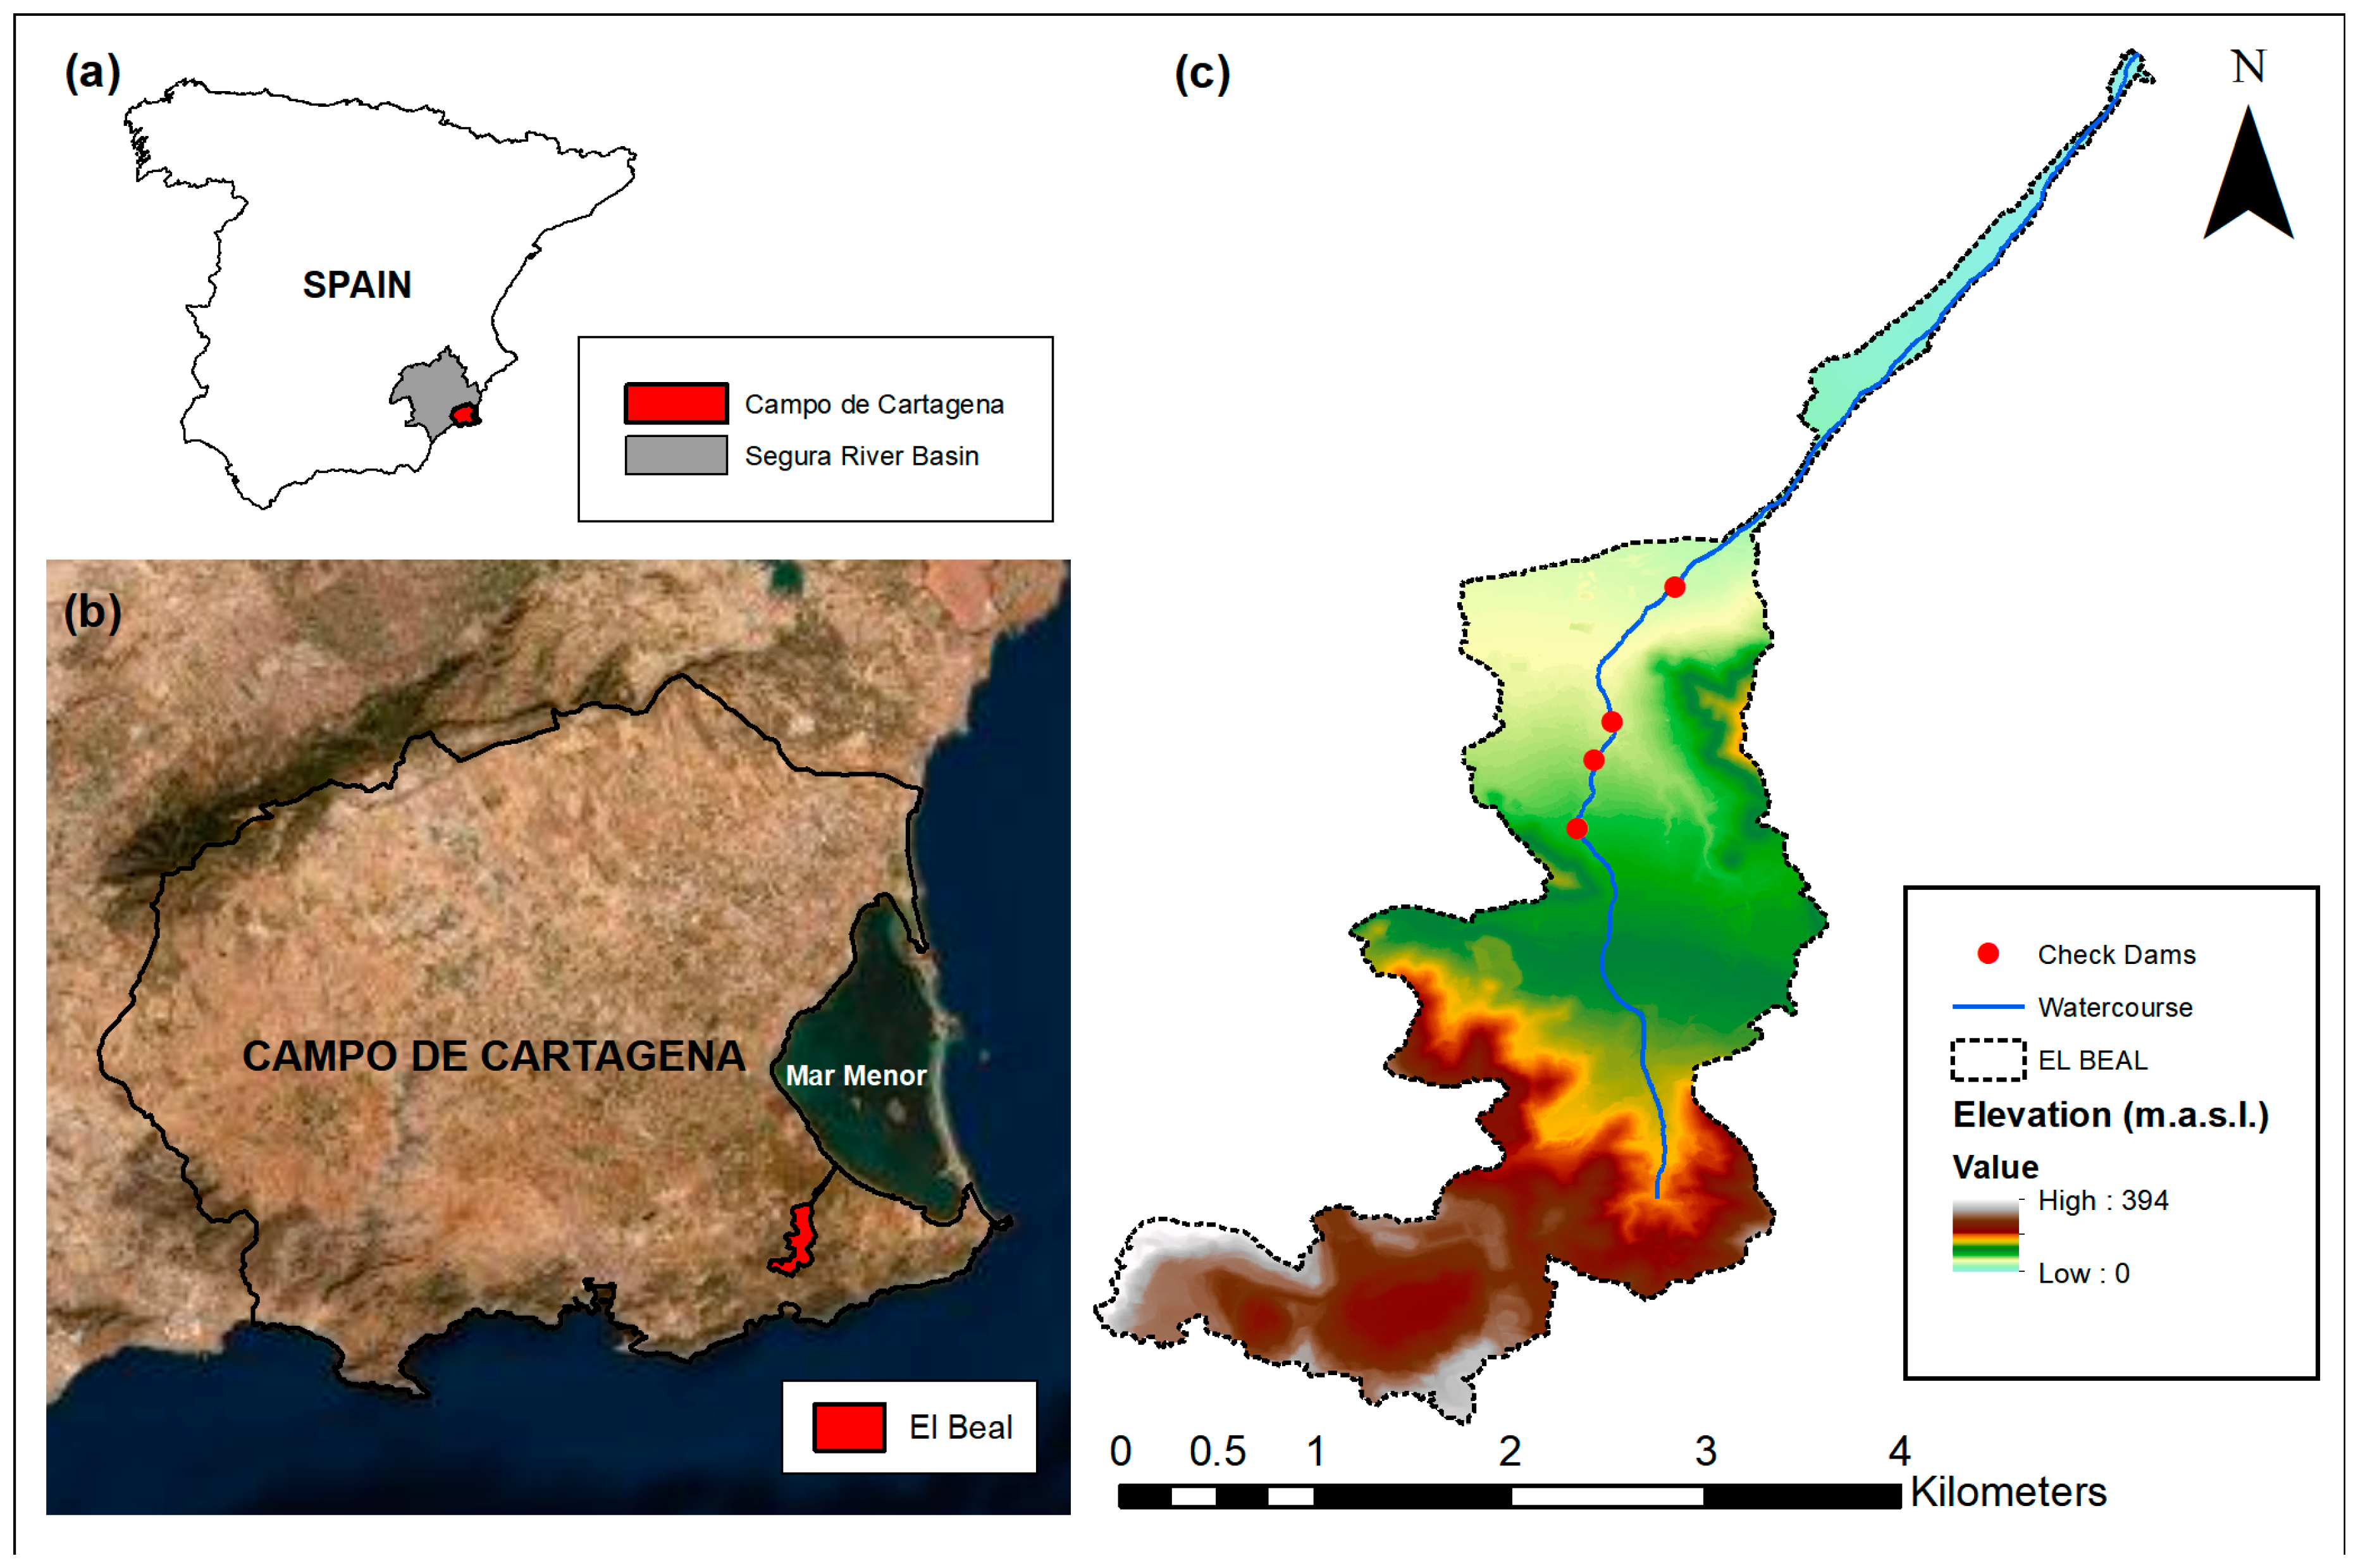
2.1. Study Area

The Segura River Basin, in the southeast of Spain, lies between latitude 39°00′–37°00′ N and longitude 2°50′–0°40′ W. The study site, El Beal watershed, is located in the southeast part of Segura River Basin within the area known as Campo de Cartagena (Figure 1), which is one of the main horticultural producers in Europe [22] and is characterized by an intensive agriculture and torrential rainfall regime. Water scarcity has resulted in the use of drip irrigation and the need to make efficient use of water [23]. Moreover, the southern portion of Campo de Cartagena was a very active mining region for hundreds of years, although the area is currently abandoned [24].
The region is one of the most arid in the Mediterranean region, with an average annual temperature of 16 °C and average annual precipitation of 300 mm distributed across a few intensive events, mainly in spring and autumn. The drainage system of El Beal watershed is an ephemeral watercourse. The Campo de Cartagena watercourses flow into the Mar Menor coastal lagoon, bringing great quantities of sediment and nutrients [22]. In the study area, intensive agriculture is possible through a water transfer known as the Tagus–Segura transfer, in operation since 1979. This hydraulic infrastructure changed the traditional unirrigated agricultural activities, without significant influence on sediment and nutrient yields [25], to intensively irrigated crops.
The total area of El Beal basin is around 6 km2, with an average elevation of 152 m above sea level (m.a.s.l.). The main land uses of El Beal watershed are abandoned mineral extraction sites (37%), scrubland (27%), urban (12%), cropland (11%) and forest (6%). Moreover, the soil cover is mainly Calcaric Cambisols [26], which is characterized by high sand and silt content.

2.2. SWAT Model

The SWAT is a semi-distributed and physically based model developed by the United States Department of Agriculture [10] to predict the impact of land management practices on sediment yield and water quality. It can be used to model the water cycle and crop yields in a river catchment and to assess the effects of agricultural practices and water resource management [27]. The SWAT model divides the catchment into sub-basins composed of hydrologic response units (HRUs), which are characterized by unique combinations of land use, soil and slope characteristics. The water and sediment processes are simulated at individual HRUs, the outputs of which are summed up and routed through the sub-basin to the stream network [28].
The main components of the model include weather, surface runoff, percolation, groundwater flow, nutrient and sediment loads, reach routing, crop growth and irrigation, water transfer and evapotranspiration. A detailed SWAT model component description is given in the theoretical documentation [10,28].
In the SWAT model, the hydrologic cycle is based on the water balance equation of soil water content:
S W t = S W o +   ( R Q s E T W s e e p Q g w )
where SWt is the final soil water content (mm), SWo the initial water content on day i (mm), R the precipitation on day i (mm), Qs the surface runoff on day i (mm), ET the evapotranspiration on day i (mm), Wseep the amount of water entering the vadose zone on day i (mm) and Qgw the return flow on day i (mm).
In this study, the Soil Conservation Service (SCS) curve number method was used to estimate surface runoff and the Penman–Monteith method, to determine potential evapotranspiration values; these are generally acknowledged to be the most rigorous and physically realistic approaches [20]. Once potential evapotranspiration is obtained, the SWAT model determines the AET for each HRU, calculating the amount of sublimation and evaporation from the soil surface and from water intercepted by the plant canopy [28]. The soil erosion process is simulated for each HRU using the Modified Universal Soil Loss Equation (MUSLE), and the transformation and movement of nitrogen and phosphorus are computed through a function of nutrient cycles [8]. Additionally, in the SWAT model, BMPs can be defined by simulating the management parameters for each HRU.

2.2.1. Model Inputs

In the present study, the SWAT model was developed with the input data listed in Table 1.
The DEM of a 5-m spatial resolution, obtained from the Spanish National Geographic Institute (IGN), was used to calculate the physical watershed characteristics in the SWAT: slope lengths, stream network, as well as flow direction and accumulation. The land use map, downloaded from the Corine Land Cover project (CLC2012), was rasterized and reclassified into 12 classes, included in the land use SWAT database. In the agricultural land uses, the management practices regarding planting, irrigation, fertilization and harvesting were simulated, according to the criteria of Francés et al. (2018) [29]. The Harmonized World Soil Map (HWSD) dataset includes the physical properties of soil required for soil map in the SWAT: texture, bulk density, soil depth and organic carbon, sand, silt, clay and rock content. The daily climate data (precipitation, temperature, wind speed, solar radiation and relative humidity) was obtained from the closest meteorological station (TP42) to the centroid of the watershed, for the period 1999 to present.
GLEAM is a remote-sensing evapotranspiration dataset developed by the Vrije University of Amsterdam [18], and used in this study. GLEAM includes a set of algorithms that estimate the different components of terrestrial evaporation (i.e., transpiration, bare soil evaporation, sublimation, interception loss and open-water evaporation) and root-zone soil moisture from satellite data. The last version of GLEAM (v3) has been globally validated through 91 eddy-covariance towers and 2325 in situ sensors [30]. In this study, the AET data of version 3.2b of GLEAM was implemented. This dataset is available on a 0.25°-latitude-longitude regular grid.

2.2.2. Model Setup, Sensitivity Analysis, Calibration and Validation

The Quantum Geographic Information System interface for SWAT (QSWAT 1.7) was used to configure and parameterize the SWAT model. Based on the distribution of the land use classes, soil types and slopes (< 8%, 8–30%, > 30%), the watershed is divided into 2 basins and 42 HRUs. The simulation period was from 2000 to 2015 (16 years) at a monthly time step. To balance the initial soil water conditions, a three-year warm-up period (2000–2003) was established.
Although the SWAT model operates on a daily scale, the model calibration process was carried out at a monthly time-step, pursuant to the Split Sample Test hierarchical scheme proposed by Klemes (1986) [31]. The simulation period was split 70/30. AET data from 2003 to 2011 (a 9-year period) was selected for calibration of the model and from 2012 to 2015 (a 4-year period) for the validation process.
In the SWAT model, there is a multitude of calibration parameters, and, to avoid over-parameterization and identify the most sensitive parameters in the AET process of our study area, a sensitivity analysis was executed [32] before the calibration and validation processes. The sensitivity analysis and automatic calibration were carried out using the Sequential Uncertainty Fitting procedure (SUFI-2) included in the SWAT Calibration and Uncertainty Programs (SWAT-CUP) [33]. Based on the literature reviewed [17,19,20,34], 12 of the most frequently used parameters for AET calibration (Table 2) were selected for a global sensitivity analysis. Parameter sensitivity was calculated on the basis of the significance of the sensitivity (p-value); the lower the p-value, the more sensitive the parameter [33]. After sensitivity analysis, ALPHA_BF and the seven most sensitive parameters (ESCO, CN2, EPCO, SOL_BD, CANMX, SOL_AWC and SOL_K) and were chosen for automatic calibration.
Tobin and Bennett (2017) [20] and Odusanya et al. (2019) [17] proved that the AET GLEAM product can be an alternative approach to calibrate the SWAT model. Therefore, due to the unavailability of recorded discharge measurements in El Beal watershed, the satellite-derived AET data from GLEAM were selected as observed inputs. For the automatic calibration process, the Kling–Gupta efficiency index (KGE) (Gupta et al., 2009) (Eq. 2) was set as the objective function. A total of 1000 simulations were run, divided into two iterations of 500 simulations, and the parameter ranges were adjusted after the first iteration.
K G E   =   1     ( α 1 ) 2 + ( β 1 ) 2 + ( γ 1 ) 2
where α is the Pearson correlation coefficient between the observed and simulated AET data, β is the fraction of standard deviation of the simulated AET data over the observed AET data and γ is the average simulated AET value over the average observed value. KGE ranges from −∞ to 1, with 1 being the optimal value.
The validation process involved introduction of the fitted parameters obtained during the calibration process to the SWAT model and the comparison between the satellite-derived AET data and SWAT-simulated AET data. To assess the performance of the SWAT model, three of the most commonly used statistical indices in the calibration and validation procedures were selected: the coefficient of determination (R2), the percent bias (PBIAS) and the Nash–Sutcliffe efficiency (NSE) [35], as shown in Equations (3)–(5), respectively.
R 2 =   i = 1 n ( Y o b s   i     Y o b s ¯ ) ( Y s i m   i     Y s i m ¯ ) i = 1 n ( Y o b s   i     Y o b s ¯ ) 2 i = 1 n ( Y s i m   i     Y s i m ¯ ) 2
where Y o b s   i and Y s i m   i are the observed and simulated AET values, Y o b s ¯ and Y s i m ¯ are the average observed and simulated AET values and n is the total number of observations. R2 ranges from 0 to 1, with 1 being the optimal value.
P B I A S =   i = 1 n ( Y o b s   i     Y s i m   i ) i = 1 n Y o b s   i * 100
where Y o b s   i and Y s i m   i are the observed and simulated AET values. PBIAS is the mass balance error in percent, with 0 being the optimal value.
N S E   = 1   i = 1 n ( Y o b s   i     Y s i m   i ) 2 i = 1 n ( Y o b s   i     Y o b s ¯ ) 2
where Y o b s   i and Y s i m   i are the observed and simulated AET values, Y o b s ¯ is the average observed AET value and n is the total number of observed data. NSE ranges from -∞ to 1, where 1 is the optimal value.

2.3. Best Management Practice Scenarios

Based on the different controlling non-point source pollutant strategies applied in Campo de Cartagena [2], five management practices were selected and implemented in the SWAT model: contour planting, filter strips, reforestation, fertilizer application and check dam restoration. These BMP scenarios were assessed individually and in combination, to test their impact on reduction of sediment and nutrient loadings.
The effectiveness of these BMP scenarios was quantified by comparing each one with the baseline scenario to obtain a percent of reduction. This effectiveness was computed using Equation (6):
E f f e c t i v e n e s s   ( % )   =   ( Y B a s e l i n e Y B M P ) Y B a s e l i n e × 100 ,  
where Y B a s e l i n e and Y B M P are the average annual sediment or nutrient yields in the baseline scenario and in the BMP scenario, respectively.

2.3.1. Baseline Scenario

The baseline scenario was obtained by running the SWAT model on an annual basis with the calibrated parameters and the current management and crop rotation practices of the agricultural land use (Table 3).

2.3.2. Contour Planting

Contour planting practices entail tilling and planting crops, delineating the contour of the field to increase soil infiltration capacity, intercept surface runoff and reduce sediment and nutrient losses. In the present study, contour planting was simulated by activating the contouring option in the scheduled management operations tool (.ops) for the non-woody agricultural land uses in the SWAT. The main parameters for simulating contour planting in the SWAT model are curve number (CONT_CN) and USLE Practice factor (CONT_P), the values of which were set to 65 and 0.8, respectively, following Arnold et al. (2012) [32].

2.3.3. Filter Strips

Dense vegetation is installed along the perimeter of the field to intercept and filter surface runoff. Sediment and nutrient loads are trapped in the strip vegetation. The SWAT calculates trapping efficiency (trapef) for sediment and nutrients, using Equation (7) and the parameter FILTERW, which reflects the width of the vegetation strip.
t r a p e f   =   0.367 × F I L T E R W 0.2967 ,
Based on the recent laws enforced in the study area [2,4], the efficiency of 2 m, 3 m and 5 m filter strips applied in agricultural land uses was assessed.

2.3.4. Reforestation

Reforestation requires the conversion of land to its historically natural conditions. Mineral extraction sites are highly prone to soil erosion due to a general scarcity of vegetation [24]. In the present study, the conversion of mining sites (SHRB) to forest (FRST) was carried out by applying the Land Use Update module in the SWAT.

2.3.5. Fertilizer Application

The SWAT includes a management module for the representation of crop practices (.mgt), where fertilizer can be adjusted. Maximum doses of fertilizer were established in the context of agricultural land use, based on the guidelines provided by a regional regulation known as the Code of Good Agricultural Practices of Murcia [2], which entails a reduction of about 15%–25% of the maximum amount of elemental nitrogen applied to each crop per year.

2.3.6. Check Dam Restoration

Check dam practice requires the construction of rock dams across a watercourse to intercept sediment and nutrient loads and reduce erosion of the stream. However, the siltation due to sediment loads suppose a serious problem in check dam performance. In the study area, there are four filled dams (Figure 1), which were simulated in their original conditions (without saturation) by the SWAT. According to Waidler et al.’s (2009) [36] guidelines, check dams were introduced as ponds. Ponds were simulated in the ponds module (.pnd), using the parameter PND_FR, which represents the fraction of the sub-basin area that drains into ponds.

2.3.7. BMP Combination

The combination of BMPs can be more effective than individual BMPs [37]. Based on the action scale, three combinations of BMPs were implemented in the SWAT to assess their effectiveness to reduce sediment and nutrients (Table 4).
Combination 1 includes all structural BMPs, which encompass management practices that require a significant investment, because of their application process. Combination 2 includes contour planting, 3 m filter strips and fertilizer application, which are grouped under a classification of agricultural BMPs, because they are applied mainly at the cropland scale. Additionally, among the filter strip widths evaluated, 3 m filter strips were selected for combination with other BMPs, because they were considered the most representative for the study area. Finally, Combination 3 was conducted to assess the application of all BMPs.

3. Results and Discussion

3.1. Sensitivity Analysis

In the global sensitivity analysis, eight parameters were identified as the most influential to the AET process: CN2, ALPHA_BF, SOL_BD, SOL_AWC and SOL_K, which control the amount of water in soil layers; and ESCO, EPCO and CANMX, which are related to the soil water evaporation processes. Overall, the ESCO was the most sensitive parameter, because it relates closely to soil evaporation, followed by CN2 and EPCO. Similar sensitivity results were achieved in other AET calibration reports [20,34]. Table 5 shows the initial maximum and minimum range, default values and calibrated values applied in the SWAT model.

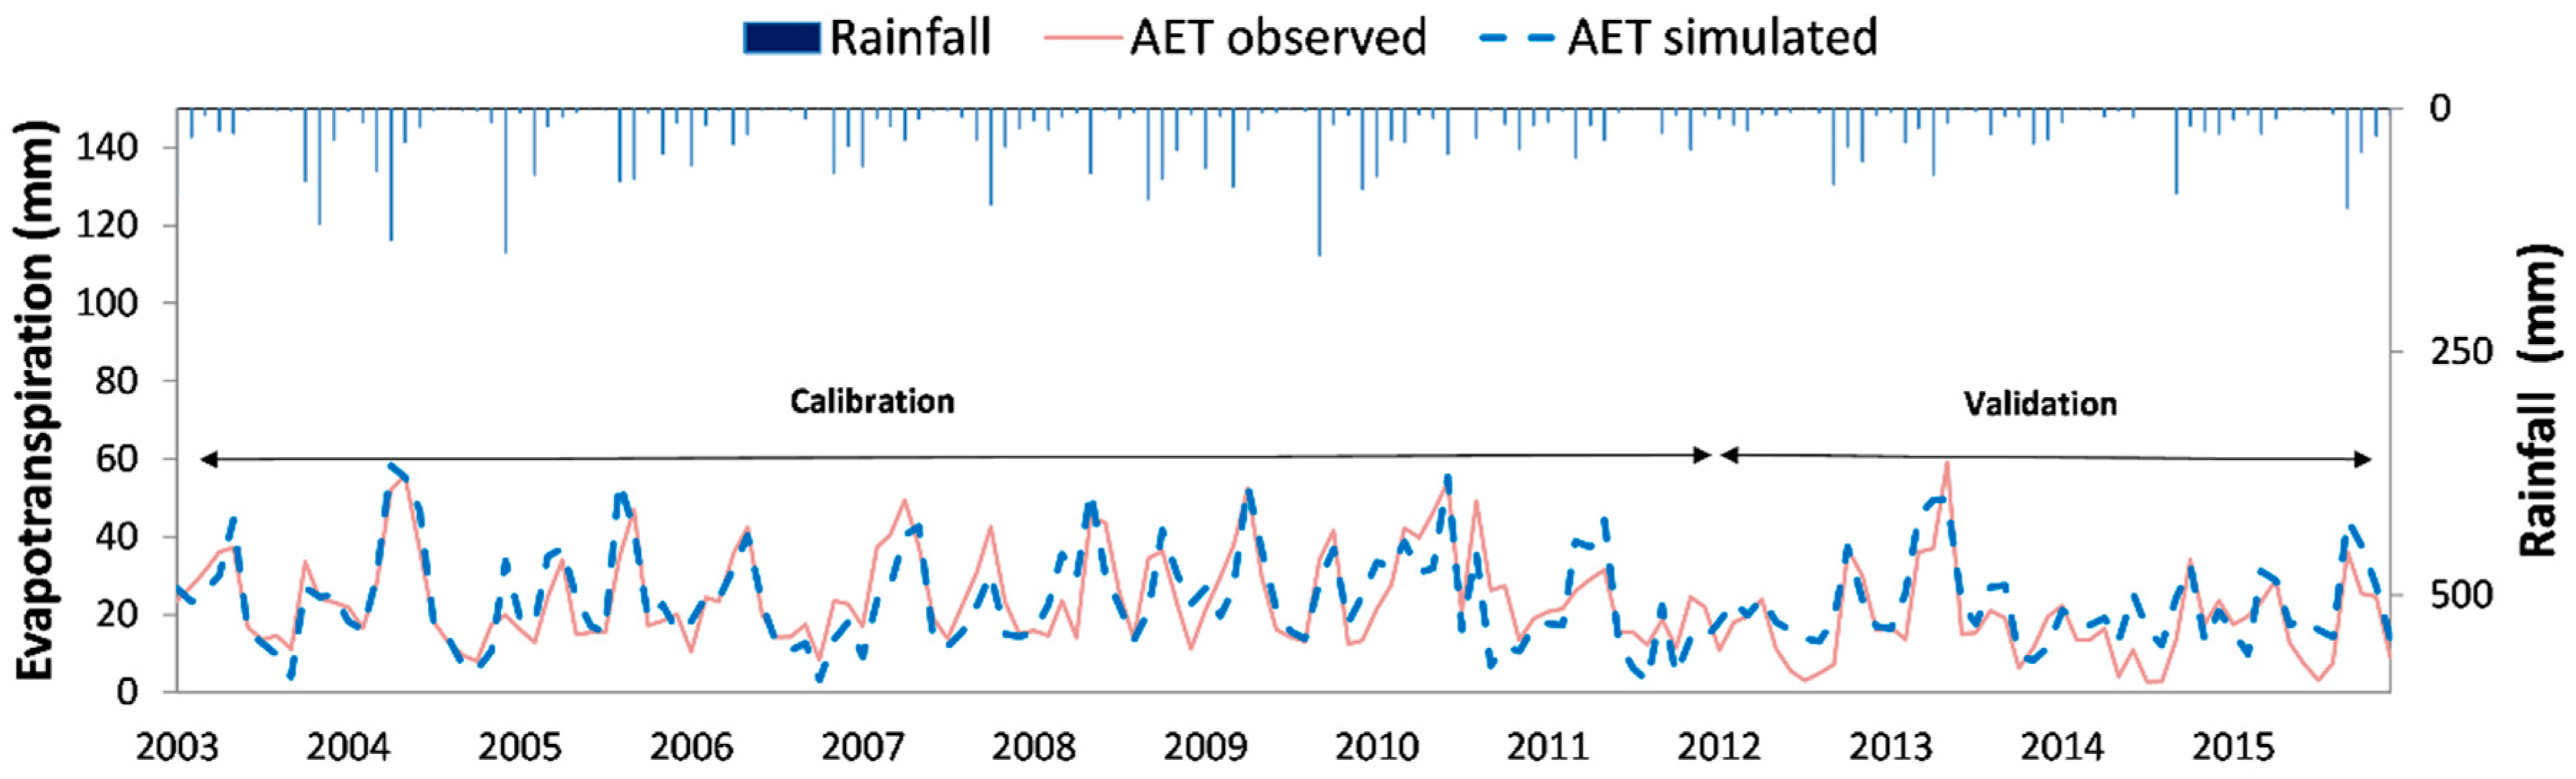
3.2. Model Calibration and Validation

The model performance was satisfactory in both periods: calibration (2003–2011) and validation (2012–2015). Figure 2 shows the simulated and observed AET in El Beal watershed over the total period. The SWAT model simulated the trend of the observed AET data with high accuracy, with R2 values of 0.81 for calibration and 0.83 for validation. The other statistical indices also showed good performance for calibration (KGE = 0.78, NS = 0.58 and PBIAS = 3.9%) and validation (KGE = 0.67, NS = 0.53 and PBIAS = −25.3%). The higher values of KGE relative to NSE are due to overemphasis of peak values in NSE [38]. The PBIAS value for the validation period was higher than for the calibration period because, in the last years of the study period, the amount of available water for irrigation in El Beal watershed decreased, due to water constraints in the Tagus–Segura transfer. As a result, the observed AET was less than the simulated AET.
As can be seen in the monthly distribution of observed and simulated AET (Figure 3), the model’s over/under prediction is acceptable. The simulated average annual precipitation, potential evapotranspiration, total flow and AET were 301.9 mm, 1283.8 mm, 46.2 mm and 270.5 mm, respectively. Similar results were reported in other work on the study area [39]. Ninety percent of the annual precipitation was lost due to evapotranspiration, which is fairly common in semiarid areas. The model estimated an annual sediment yield of 2.64 Tn/ha. This result fell within the range 0–5 Tn/ha/year of sediment yield estimated by the National Soil Erosion Inventory of Murcia for the study area [40]. A calibrated SWAT model simulation was established as the base scenario to assess the impacts of BMPs on sediment and nutrients.

3.3. BMP Effectiveness

The assessment of BMPs was performed individually and in combination for the total period. The simulation results showed an effective reduction of sediment yield, total nitrogen (TN) and total phosphorus (TP) by application of individual BMPs (Figure 4) and a higher effectiveness when they were combined.

3.3.1. Individual BMPs

Contouring practice is highly recommended to avoid soil erosion during extreme weather events in Mediterranean regions [41]. The results showed that contour planting simulation reduced sediment yield by 6%, TN by 10% and TP by 8% at the watershed scale. However, contouring was found to improve the percent of sediment reduction to 71% at the cropland level. Filter strips with a width of 2 m achieved a reduction of 4%, 7% and 5% for sediment yield, TN and TP, respectively. Increasing the filter strip width to 3 m improved all the effectiveness values by 1%, and for 5 m of width, there was a 5% enhancement in the reduction of sediment, 10% for TN and 7% for TP. These findings indicate that increasing the width of filter strips results in an insignificant improvement in the effectiveness at the basin scale. Notwithstanding these results, at the cropland scale, the improvement rate ranged from 45% to 60%, with the improvement rate increasing as the widths increased. Other studies have reported finding similar trends related to filter strips [42,43]. Reforestation entails a land use conversion from SHRB to FRST. The results showed that reforestation was one of the most effective practices for reducing sediment and nutrients in El Beal watershed. Sediment yield generated from the basin was reduced by up to 27%, and TN and TP reduction were 16% and 20%, respectively. These results are consistent with the findings of other research carried out in the study area [29]. According to the agricultural practice guidelines of Murcia [2], the maximum annual amount of elemental nitrogen applied in agricultural land use was reduced. As a result of fertilizer application BMP, the nitrogen decreased by 20% at the cropland level. However, at the basin scale, the percent of reduction was 2%. Regarding the check dam restoration, almost 90% of the sediment was found to be retained at the dams. Mtibaa et al. (2018) [37] proved that the highest sediment yield reductions were achieved by structural BMPs. Check dams also reduced the TN by 15% and the TP by 22%. Although check dam restoration was found to be the most effective individual practice, this BMP requires special maintenance to avoid saturation. The relatively lower results at the watershed level for contour planting, filter strips and fertilizer application are attributable to the small proportion of the agricultural area in the El Beal watershed.

3.3.2. Combination BMPs

Combinations of BMPs achieved better results than individual BMPs (Table 6). Similar studies, using the SWAT model, in different regions of the world corroborate these results [37,44,45,46].
Combination 1 involved testing the percent of reduction by applying the structural BMPs. High reductions were achieved for all yields at the watershed scale, although with a particularly level of effectivity in sediment reduction. The effectiveness was 92% for sediment loads, 18% for TN and 23% for TP. Combination 2 was used to check the effectiveness of BMPs applicable only in agricultural land use. A greater percent of reduction was achieved when agricultural BMPs were implemented simultaneously, relative to their being implemented individually, at both the watershed and cropland levels. This combination achieved an effectiveness of 7% for sediment reduction, 14% for TN and 10% for TP at the watershed scale. However, at the cropland scale, these results reached values higher than 80% for sediment reduction and nutrient yields. Similar scale patterns were obtained by Uribe et al. (2018) [47] in an agricultural watershed in Colombia. When all evaluated BMPs were applied in El Beal watershed at the same time, the effectiveness reached the highest values. Predictably, Combination 3 was the most effective, with reduction values of 93%, 32% and 33% for sediment, TN and TP, respectively. With respect to sediment reductions, the structural BMPs obtained the best results. Although BMP Combination 1 produced an important reduction of TN and TP at the watershed scale, when structural BMPs were combined with agricultural BMPs, meaningfully greater effectiveness was achieved. These results provide useful information on how to assess which BMPs better fit current conditions of El Beal watershed. They may be feasible future solutions to reduce the sediment and nutrient loadings that flow into the Mar Menor coastal lagoon.

3.4. Cost-Effective BMP Simulation

The total costs for BMPs implementation are listed in Table 7. Unit costs related to reforestation, check dam restoration and fertilizer application were obtained from the Spanish Ministry for the Ecological Transition [48] while unit costs related to filter strips and contour planting were obtained from Cuttle et al. (2007) [49]. Agricultural BMPs are the most cost-effective strategies to remove sediments, N and TP in El Beal watershed. Taking into account that the environmental restoration of Mar Menor to good ecological status has the potential to generate a total economic value of more than 45 million euros per year [50], the implementation of structural BMPs is also recommended. The results presented aim to facilitate decision-making for cost-effective management of pollution by stakeholders.

4. Conclusions

A SWAT model for El Beal watershed was developed to evaluate the effectiveness of selected BMPs. The SWAT model achieved good performance in calibration and validation processes with satellite-derived AET data from GLEAM on a monthly basis. The applicability of the assessed BMPs was tested in a semiarid and highly anthropogenic watershed in the southern region of Spain. Among the individual BMPs simulated, check dam restoration and reforestation were found to be the most effective to reduce the loads of sediment and nutrients that flow into the Mar Menor coastal lagoon. All effectiveness values improved when BMPs were assessed in combination. Despite the model’s uncertainties and taking into account the high socioeconomic impact of the implementation of these measures, this study may provide guidance for decision makers to implement the best BMPs to reduce nutrient and sediment inputs. The results can be extended to similar watersheds.

Author Contributions

A.L.-B. and J.S.-A. conceived and developed the study; A.L.-B., J.S.-A. and R.S. analyzed the input and output data; A.L.-B. wrote the paper; J.S.-A., R.S. and J.P.-S. revised the paper.

Funding

This research was funded by the Region of Murcia Government.

Acknowledgments

This research was supported by the Ministerio de Educación y Formación Profesional of Spain under an FPU grant (FPU17/00923). The authors gratefully acknowledge support from the Region of Murcia Government through the project “Modelización hidrológica distribuida de la cuenca de la rambla del Albujón mediante el uso de datos de teledetección”. We acknowledge Papercheck Proofreading and Editing Services.

Conflicts of Interest

The authors declare no conflict of interest.

References

  1. Herman, M.R.; Nejadhashemi, A.P.; Abouali, M.; Hernandez-Suarez, J.S.; Daneshvar, F.; Zhang, Z.; Anderson, M.C.; Sadeghi, A.M.; Hain, C.R.; Sharifi, A. Evaluating the role of evapotranspiration remote sensing data in improving hydrological modeling predictability. J. Hydrol. 2018, 556, 39–49. [Google Scholar] [CrossRef]
  2. Comunidad Autónoma de la Región de Murcia. Ley 1/2018, de 7 de Febrero, de Medidas Urgentes Para Garantizar la Sostenibilidad Ambiental en el Entorno Del Mar Menor; Boletín Oficial de la Región de Murcia: Murcia, Spain, 2018. (In Spanish) [Google Scholar]
  3. Comunidad Autónoma de la Región de Murcia. Orden de 29 de Julio de 2016 Por la Que se Crea el Comité de Asesoramiento Científico Del Mar Menor; Boletín Oficial de la Región de Murcia: Murcia, Spain, 2016. (In Spanish) [Google Scholar]
  4. Comunidad Autónoma de la Región de Murcia. Decreto-Ley nº 1/2017, de 4 de abril, de Medidas Urgentes Para Garantizar la Sostenibilidad Ambiental en el Entorno Del Mar Menor; Boletín Oficial de la Región de Murcia: Murcia, Spain, 2017. (In Spanish) [Google Scholar]
  5. La Opinión de Murcia. Available online: https://www.laopiniondemurcia.es/comunidad/2018/01/13/pasando/889517.html (accessed on 10 July 2019).
  6. Sharpley, A.N.; Daniel, T.; Gibson, G.; Bundy, L.; Cabrera, M.; Sims, T.; Stevens, R.; Lemunyon, J.; Kleinman, P.; Parry, R. Best Management Practices to Minimize Agricultural Phosphorus Impacts on Water Quality; Agricultural Research Service of the United States Department of Agriculture (USDA-ARS): Washington, DC, USA, 2006.
  7. Bosch, N.S.; Allan, J.D.; Selegean, J.P.; Scavia, D. Scenario-testing of agricultural best management practices in Lake Erie watersheds. J. Great Lakes Res. 2013, 39, 429–436. [Google Scholar] [CrossRef]
  8. Arabi, M.; Frankenberger, J.R.; Engel, B.A.; Arnold, J.G. Representation of agricultural conservation practices with SWAT. Hydrol. Process. 2008, 22, 3042–3055. [Google Scholar] [CrossRef]
  9. Tuppad, P.; Kannan, N.; Srinivasan, R.; Rossi, C.G.; Arnold, J.G. Simulation of agricultural management alternatives for watershed protection. Water Resour. Manag. 2010, 24, 3115–3144. [Google Scholar] [CrossRef]
  10. Arnold, J.G.; Srinivasan, R.; Muttiah, R.S.; Williams, J.R. Large area hydrologic modeling and assessment Part I: Model development. J. Am. Water Resour. Assoc. 1998, 34, 73–89. [Google Scholar] [CrossRef]
  11. Mannschatz, T.; Wolf, T.; Hülsmann, S. Nexus Tools Platform: Web-based comparison of modelling tools for analysis of water-soil-waste nexus. Environ. Modell. Softw. 2016, 76, 137–153. [Google Scholar] [CrossRef]
  12. Park, J.Y.; Yu, Y.S.; Hwang, S.J.; Kim, C.; Kim, S.J. SWAT modeling of best management practices for Chungju dam watershed in South Korea under future climate change scenarios. Paddy Water Environ. 2014, 12, 65–75. [Google Scholar] [CrossRef]
  13. Xie, H.; Chen, L.; Shen, Z. Assessment of agricultural best management practices using models: Current issues and future perspectives. Water 2015, 7, 1088–1108. [Google Scholar] [CrossRef]
  14. Cerro, I.; Antigüedad, I.; Srinivasan, R.; Sauvage, S.; Volk, M.; Sánchez-Pérez, J.M. Simulating land management options to reduce nitrate pollution in an agricultural watershed dominated by an alluvial aquifer. J. Environ. Qual. 2014, 43, 67–74. [Google Scholar] [CrossRef]
  15. Epelde, A.M.; Cerro, I.; Sánchez-Pérez, J.M.; Sauvage, S.; Srinivasan, R.; Antigüedad, I. Application of the SWAT model to assess the impact of changes in agricultural management practices on water quality. Hydrolog. Sci. J. 2015, 60, 825–843. [Google Scholar] [CrossRef]
  16. Immerzeel, W.W.; Droogers, P. Calibration of a distributed hydrological model based on satellite evapotranspiration. J. Hydrol. 2008, 349, 411–424. [Google Scholar] [CrossRef]
  17. Odusanya, A.; Mehdi, B.; Schürz, C.; Oke, A.O.; Awokola, S.O.; Awomeso, J.A.; Adejuwon, J.O.; Schulz, K. Multi-site calibration and validation of SWAT with satellite-based evapotranspiration in a data sparse catchment in southwestern Nigeria. Hydrol. Earth Syst. Sci. 2019, 23, 1113–1144. [Google Scholar] [CrossRef]
  18. Miralles, D.G.; Holmes, T.H.R.; de Jeu, R.A.M.; Gash, J.H.; Meesters, A.G.C.A.; Dolman, A.J. Global land-surface evaporation estimated from satellite-based observations. Hydrol. Earth Syst. Sci. 2011, 15, 453–469. [Google Scholar] [CrossRef] [Green Version]
  19. Ha, L.; Bastiaanssen, W.G.M.; van Griensven, A.; van Dijk, A.I.J.M.; Senay, G.B. Calibration of spatially distributed hydrological processes and model parameters in SWAT using remote sensing data and an auto-calibration procedure: A case study in a Vietnamese river basin. Water 2018, 10, 212. [Google Scholar] [CrossRef]
  20. Tobin, K.; Marvin, E.B. Constraining SWAT calibration with remotely sensed evapotranspiration data. J. Am. Water Resour. Assoc. 2017, 53, 593–604. [Google Scholar] [CrossRef]
  21. Cheema, M.J.M.; Immerzeel, W.W.; Bastiaanssen, W.G.M. Spatial quantification of groundwater abstraction in the irrigated indus basin. Groundwater 2014, 52, 25–36. [Google Scholar] [CrossRef] [PubMed]
  22. Velasco, J.; Lloret, J.; Millán, A.; Marín, A.; Barahona, J.; Abellán, P.; Sánchez-Fernández, D. Nutrient and particulate inputs into the Mar Menor Lagoon (SE Spain) from an intensive agricultural watershed. Water Air Soil Pollut. 2006, 176, 37–56. [Google Scholar] [CrossRef]
  23. Senent-Aparicio, J.; Pérez-Sánchez, J.; García-Aróstegui, J.L.; Bielsa-Artero, A.; Domingo-Pinillos, J.C. Evaluating groundwater management sustainability under limited data availability in semiarid zones. Water 2015, 7, 4305–4322. [Google Scholar] [CrossRef]
  24. Navarro, M.C.; Pérez-Sirvent, C.; Martínez-Sánchez, M.J.; Vidal, J.; Tovar, P.J.; Bech, J. Abandoned mine sites as a source of contamination by heavy metals: A case study in a semi-arid zone. J. Geochem. Explor. 2008, 96, 183–193. [Google Scholar] [CrossRef]
  25. Pérez-Rufaza, A.; Navarro, S.; Barba, A.; Marcos, C.; Cámara, M.A.; Salas, F.; Gutiérrez, J.M. Presence of pesticides through trophic compartments of the food web in the Mar Menor lagoon (SE Spain). Mar. Pollut. Bull. 2000, 40, 140–151. [Google Scholar] [CrossRef]
  26. Food and Agriculture Organization of the United Nations–International Soil Reference and Information Centre (FAO–ISRIC). Guidelines for Profile Description, 3rd ed.; FAO–ISRIC: Roma, Italy, 1990. [Google Scholar]
  27. Krysanova, V.; White, M. Advances in water resources assessment with SWAT—An overview. Hydrol. Sci. J. 2015, 60, 771–783. [Google Scholar] [CrossRef]
  28. Neitsch, S.; Arnold, J.; Kiniry, J.; Williams, J.; King, K. Soil and Water Assessment Tool: Theoretical Documentation, version 2009; Texas Water Resources Institute: College Station, TX, USA, 2011. [Google Scholar]
  29. Francés, F. Informe Sobre el Análisis de Afecciones de Diferentes Actuaciones en la Zona Sur Del Mar Menor Sobre Aportaciones a la Laguna de Agua, Sedimentos y Nitrógeno; Comunidad Autónoma de la Región de Murcia: Murcia, Spain, 2018. (In Spanish) [Google Scholar]
  30. Martens, B.; Miralles, D.G.; Lievens, H.; Fernández-Prieto, D.; Verhoest, N.E.C. GLEAMv3: Satellite-based land evaporation and root-zone soil moisture. Geosci. Model Dev. 2017, 10, 1903–1925. [Google Scholar] [CrossRef]
  31. Klemes, V. Operational testing of hydrological simulation models. Hydrolog. Sci. J. 1986, 31, 13–24. [Google Scholar] [CrossRef]
  32. Arnold, J.G.; Moriasi, D.; Gassman, P.W.; Abbaspour, K.C.; White, M.J.; Srinivasan, R.; Santhi, C.; Harmel, R.D.; Griensven, A.V.; Liew, M.; et al. SWAT: Model use, calibration, and validation. Trans. ASABE 2012, 55, 1491–1508. [Google Scholar] [CrossRef]
  33. Abbaspour, K.C. SWAT-CUP-2012: SWAT Calibration and Uncertainty Program—A User Manual; Swiss Federal Institute of Aquatic Science and Technology: Dubendorf, Switzerland, 2012. [Google Scholar]
  34. Sun, C.; Ren, L. Assessment of surface water resources and evapotranspiration in the Haihe River basin of China using SWAT model. Hydrol. Process. 2013, 27, 1200–1222. [Google Scholar] [CrossRef]
  35. Nash, J.E.; Sutcliffe, J.V. River flow forecasting through conceptual models. Part I: A discussion of principles. J. Hydrol. 1970, 10, 282–290. [Google Scholar] [CrossRef]
  36. Waidler, D.; White, M.; Steglich, E.; Wang, S.; Williams, J.; Jones, C.A.; Srinivasan, R. Conservation Practice Modeling Guide for SWAT and APEX; Texas Water Resources Institute: College Station, TX, USA, 2009. [Google Scholar]
  37. Mtibaa, S.; Hotta, N.; Irie, M. Analysis of the efficacy and cost-effectiveness of best management practices for controlling sediment yield: A case study of the Joumine watershed, Tunisia. Sci. Total Environ. 2018, 616, 1–16. [Google Scholar] [CrossRef]
  38. Gupta, H.V.; Kling, H.; Yilmaz, K.K.; Martinez, G.F. Decomposition of the mean squared error and NSE performance criteria: Implications for improving hydrological modelling. J. Hydrol. 2009, 377, 80–91. [Google Scholar] [CrossRef] [Green Version]
  39. Contreras, S.; Hunink, J.E.; Baille, A. Building a Watershed Information System for the Campo de Cartagena basin (Spain) integrating hydrological modeling and remote sensing. Report Future Water 2014, 125. [Google Scholar] [CrossRef]
  40. Dirección General de Conservación de la Naturaleza. Inventario Nacional de Erosión de Suelos 2002–2012; Ministerio de Medio Ambiente: Murcia, Spain, 2002; ISBN 84-8014-483-1. (In Spanish)
  41. Durán-Zuazo, V.H.; Rodríguez-Pleguezuelo, C.R. Soil-erosion and runoff prevention by plant covers. Agron. Sustain. Dev. 2008, 28, 65–86. [Google Scholar] [CrossRef]
  42. Yuan, Y.; Bingner, R.A.; Locke, M.A. Review of effectiveness of vegetative buffers on sediment trapping in agricultural areas. Ecohydrology 2009, 2, 321–336. [Google Scholar] [CrossRef]
  43. Parajuli, P.B.; Mankin, K.R.; Barnes, P.L. Applicability of targeting vegetative filter strips to abate fecal bacteria and sediment yield using SWAT. Agric. Water Manag. 2008, 95, 1189–1200. [Google Scholar] [CrossRef]
  44. Briak, H.a.; Mrabet, R.; Moussadek, R.A.; Aboumaria, K. Use of a calibrated SWAT model to evaluate the effects of agricultural BMPs on sediments of the Kalaya river basin (North of Morocco). Int. Soil Water Conserv. Res. 2019, 7, 176–183. [Google Scholar] [CrossRef]
  45. Leh, M.; Sharpley, A.N.; Singh, G.; Matlock, M. Assessing the impact of the MRBI program in a data limited Arkansas watershed using the SWAT model. Agric. Water Manag. 2018, 202, 202–219. [Google Scholar] [CrossRef]
  46. Wagena, M.; Zachary, M.E. Agricultural conservation practices can help mitigate the impact of climate change. Sci. Total Environ. 2018, 635, 132–143. [Google Scholar] [CrossRef]
  47. Uribe, N.; Corzo, G.; Quintero, M.; van Griensven, A.; Solomatine, D. Impact of conservation tillage on nitrogen and phosphorus runoff losses in a potato crop system in Fuquene watershed, Colombia. Agric. Water Manag. 2018, 209, 62–72. [Google Scholar] [CrossRef]
  48. Ministerio de Agricultura y Pesa, Alimentación y Medio Ambiente (2018). Análisis de Soluciones Para el Objetivo Del Vertido Cero al Mar Menor Proveniente Del Campo de Cartagena. Available online: https://www.chsegura.es/chs/servicios/informacionpublica/vcerommenor/ (accessed on 4 September 2019).
  49. Cuttle, S.; Macleod, C.; Chadwick, D.; Scholefield, D.; Havgarth, P.; Newell-Price, P.; Harris, D.; Sepherd, M.; Chambers, B.; Humphrey, R. An Inventory of Methods to Control Diffuse Water Pollution from Agriculture (DWPA). User Manual. Defra Report, Project ES0203 2007. Available online: http://www.cost869.alterra.nl/UK_Manual.pdf (accessed on 2 September 2019).
  50. Perni, A.; Martínez-Carrasco, F.; Martínez-Paz, J.M. Economic valuation of coastal lagoon environmental restoration: The Mar Menor (Spain). Cienc. Mar. 2011, 37, 175–190. [Google Scholar] [CrossRef]
Figure 1. (a) Location map of Campo de Cartagena watershed as part of the Segura River Basin (Spain); (b) Situation map of El Beal within the Campo de Cartagena basin and Mar Menor coastal lagoon location; (c) Digital elevation model (DEM) and check dam location of El Beal watershed.
Agronomy 09 00576 g001
Figure 2. Comparison of simulated and observed actual evapotranspiration of the El Beal watershed for the calibration and validation periods.
Agronomy 09 00576 g002
Figure 3. Comparison of average monthly simulated and observed AET for the calibration and validation periods.
Agronomy 09 00576 g003
Figure 4. Effectiveness of individual BMPs in sediment and nutrient loadings at the watershed scale.
Agronomy 09 00576 g004
Table 1. List of input datasets used for model setup.
DataDescriptionSource
DEM5 m × 5 m resolution map Spanish National Geographic Institute (IGN)
Land use mapVector database Corine Land Cover programme of year 2012 (CLC2012)
Soil map1 km × 1 km resolution mapHarmonized World Soil Map (HWSD)
Climate dataDaily meteorological station called TP42Murcian Institute of Agrarian and Food Research and Development (IMIDA)
Table 2. Ranking of selected SWAT parameters with their p-values, based on sensitivity analysis.
ParameterDescriptionp-ValueRank
ESCO.hruSoil evaporation compensation factor0.001
CN2.mgtInitial SCS runoff curve number0.002
EPCO.hruPlant uptake compensation factor0.003
SOL_BD.solMoist bulk density (g/cm3)0.014
CANMX.hruMaximum canopy storage (mm)0.085
SOL_AWC.solSoil available water content (mm/mm)0.196
SOL_K.solSaturated hydraulic conductivity (mm/h)0.257
GWQMN.gwThreshold depth of water in the shallow aquifer for return flow to occur (m)0.278
GW_DELAY.gwGroundwater delay (days)0.309
GW_REVAP.gwGroundwater revap coefficient0.4110
ALPHA_BF.gwBase flow recession constant (days)0.8811
REVAPMN.gwThreshold depth of water in the shallow aquifer for revap to occur (m)0.9912
Table 3. Schedule of management and rotation practices in agricultural land use.
YearDateOperationApplication RateCrop
MonthDay
1January1Planting begin Broccoli
1January1Irrigation~36 mm/monthBroccoli
1January1Auto fertilizationMax. 250 KgN/haBroccoli
1April30Harvest and kill Broccoli
1June1Planting begin Cantaloupe
1June1Irrigation~72 mm/monthCantaloupe
1June1Auto fertilizationMax. 130 KgN/haCantaloupe
1August31Harvest and kill Cantaloupe
1October1Planting begin Lettuce
1October1Irrigation~25 mm/monthLettuce
1October1Auto fertilizationMax. 130 KgN/haLettuce
1December31Harvest and kill Lettuce
Table 4. Selected Best management Practices (BMPs) combinations.
BMP CombinationDescriptionBMPs
1Structural BMPs Reforestation
Check dam restoration
2Agricultural BMPs Contour planting
3 m filter strips
Fertilizer application
3All BMPsReforestation
Check dam restoration
Contour planting
3 m filter strips
Fertilizer application
Table 5. Optimized SWAT parameters for calibration of AET.
ParameterValue RangeDefault ValueFitted Value
ESCO.hru0–1 0.950.86
CN2.mgt±20%-−7.24%
EPCO.hru0–110.14
SOL_BD.sol±20%-−8.2%
CANMX.hru0–100012.1
SOL_AWC.sol±20%-+14.84%
SOL_K.sol±20%-−5.32%
ALPHA_BF.gw0–10.0480.16
Table 6. Effectiveness of combination BMPs in sediment and nutrient loadings at the watershed scale.
BMP CombinationDescriptionAverage Annual Reduction (%)
SedimentTNTP
1Structural BMPs92%18%23%
2Agricultural BMPs7%14%10%
3All BMPs93%32%33%
Table 7. Analysis of cost-effective BMPs.
BMPCost per HectareLand UseTotal Cost (€)Cost per Ton of Reduction
SedimentTNTP
Reforestation46000 €Abandoned mineral extraction sites10212000248983359485331
Check dam restoration200000 € 1-80000057527905885
Fertilizer application100 €Cropland10800-267-
3 m filter strips30 €Cropland3240482191
Contour planting10 €Cropland108011624
Structural BMPs--1101200076933212479397
Agricultural BMPs--1512013257257
All BMPs--1102712076401810955922
1 This cost is per dam.

