Article

Conservation Tillage Increases Water Use Efficiency of Spring Wheat by Optimizing Water Transfer in a Semi-Arid Environment

1
Gansu Provincial Key Laboratory of Aridland Crop Science, Gansu Agricultural University, Lanzhou 730070, China
2
College of Agronomy, Gansu Agricultural University, Lanzhou 730070, China
3
Department of Agronomy and Plant Genetics, University of Minnesota, St. Paul, MN 55108, USA
4
College of Resource and Environment, Gansu Agricultural University, Lanzhou 730070, China
5
International Crops Research Institute for Semi-arid Tropics (ICRISAT), Patancheru 502324, India
*
Authors to whom correspondence should be addressed.
Agronomy 2019, 9(10), 583; https://doi.org/10.3390/agronomy9100583
Submission received: 8 August 2019 / Revised: 20 September 2019 / Accepted: 22 September 2019 / Published: 26 September 2019
(This article belongs to the Section Farming Sustainability)

Abstract

:
Water availability is a major constraint for crop production in semiarid environments. The impact of tillage practices on water potential gradient, water transfer resistance, yield, and water use efficiency (WUEg) of spring wheat was determined on the western Loess Plateau. Six tillage practices implemented in 2001 and their effects were determined in 2016 and 2017 including conventional tillage with no straw (T), no-till with straw cover (NTS), no-till with no straw (NT), conventional tillage with straw incorporated (TS), conventional tillage with plastic mulch (TP), and no-till with plastic mulch (NTP). No-till with straw cover, TP, and NTP significantly improved soil water potential at the seedling stage by 42, 47, and 57%, respectively; root water potential at the seedling stage by 34, 35, and 51%, respectively; leaf water potential at the seedling stage by 37, 48, and 42%, respectively; tillering stage by 21, 24, and 30%, respectively; jointing stage by 28, 32, and 36%, respectively; and flowering stage by 10, 26, and 16%, respectively, compared to T. These treatments also significantly reduced the soil–leaf water potential gradient at the 0–10 cm soil depth at the seedling stage by 35, 48, and 35%, respectively, and at the 30–50 cm soil depth at flowering by 62, 46, and 65%, respectively, compared to T. Thus, NTS, TP, and NTP reduced soil–leaf water transfer resistance and enhanced transpiration. Compared to T, the NTS, TP, and NTP practices increased biomass yield by 18, 36, and 40%; grain yield by 28, 22, and 24%; and WUEg by 24, 26, and 24%, respectively. These results demonstrate that no-till with straw mulch and plastic mulching with either no-till or conventional tillage decrease the soil–leaf water potential gradient and soil–leaf water transfer resistance and enhance sustainable intensification of wheat production in semi-arid areas.

1. Introduction

Wheat (Triticum aestivum L.) is a major food crop in the world, which plays an important role in ensuring food security [1]. The western Loess Plateau of China is characterized by harsh climatic conditions including frequent spring drought, severe wind erosion, and water erosion [2,3]. Spring wheat is one of the dominant crops in this region, but its growth is restricted by limited and erratic rainfall [4,5]. Thus, yield of spring wheat in this region is far less than potential yield, ranging from 1500 to 3000 kg ha−1 [6,7,8]. Increasing water use efficiency (WUE) is a major goal for advancing sustainable intensification of crop production on the western Loess Plateau, which will have a great impact at local and regional scales [9].
Water use efficiency depends on the amount of water uptake by plants, of which the majority is lost through transpiration [10]. Plant water uptake depends on the free energy of water in plants and water potential in the soil–plant–atmosphere continuum [11]. The lower the water potential of the plant, the stronger the water absorption capacity. Van den Honert [12] found that the transpiration rate was positively correlated with the water potential difference of the leaf–atmosphere system. Yang et al. [13] found that the leaf water potential of maize (Zea mays L.) decreased from the lower to upper part of the canopy and that there was relatively large resistance among the different interfaces of water flow in the transmission process. Xerophytes have moderately deep roots and show a rapid drop in leaf water potential with increasing leaf water deficit, which generates a steep water potential gradient in the soil–plant continuum that enhances water uptake by roots [14].
Conservation tillage reduces soil disturbance and retains crop residues on the soil surface [15]. It can effectively reduce wind erosion [16], water erosion [17], and soil bulk density, and enhance soil total porosity and saturated water conductivity [18,19,20,21], thereby increasing rainfall infiltration and soil water holding capacity [22,23], reducing soil evaporation, and enhancing crop growth, yield, and WUE [24,25,26]. No-till with straw cover has been shown to improve grain yield by 13%, and WUE by 7.6% in winter wheat on the Loess Plateau of China [27]. No-till with straw cover has been shown to improve grain yield by 153%, and WUE by 46% in a wheat and maize (Zea mays L.) relay-planting system on the Hexi Corridor of northwestern China with a typical temperate arid zone of the continent [28]. Subsoil tillage with 50% chopped straw mulching has been shown to improve grain yield by 5%–7%, and WUE by 51%–52% in maize on the Huang–Huai–Hai valley with a mean annual precipitation of 556.2 mm [29]. Ridge mulched with plastic film has been shown to improve grain yield by 30%, and WUE by 35% in wheat on the Loess Plateau of China [4]. However, the mechanism in which conservation tillage improves water use efficiency from the perspective of water potential gradient is poorly understood. Therefore, the objectives of this study were to assess the effects of different tillage practices on soil, root, and leaf water potential indexes, soil–leaf water transfer resistance, transpiration, yield, and WUE of spring wheat.

2. Materials and Methods

2.1. Experimental Site

This study was conducted in 2016 and 2017 based on a long-term field experiment initiated in 2001. The experiment was at the Rainfed Agricultural Experimental Station (35°28′ N, 104°44′ E, elevation: 1971 m above sea level) of Gansu Agricultural University in Gansu Province in northwestern China, a typical rainfed area on the western Loess Plateau. The area is characterized by a hilly landscape and is prone to soil erosion. The aeolian soil at the experimental site is locally known as Huangmian [30], is a Calcaric Cambisol according to the IUSS Working Group WRB (2015) [31], and is primarily used for annual crop production [32]. This soil has a sandy loam texture with ≥50% sand. Detailed soil physical and water characteristics before sowing in 2001 are presented in Table 1, and detailed procedures for the measurement of indicators in Table 1 are described in Huang et al. [33]. Annual precipitation was 300.2 mm in 2016, 361.4 mm in 2017, and 396.7 mm averaged in the 2001–2015 period (Figure 1). The annual (January through December), fallow period (January through March and August through December), and growing season (April through July) rainfall, drought index (DI), and soil water condition for 2016, 2017, and the 2001–2017 average are shown in Table 2. Daily maximum air temperature can reach 38 °C in July, while minimum air temperature can drop to –22 °C in January. Average annual temperature 6.4 °C. Long–term climatic records show that annual cumulative air temperature >10 °C is 2240 °C and annual radiation is 5930 MJ/m2, with 2480 h of sunshine per year. Average annual evaporation is 1531 mm (coefficient of variation: 24.3%), which is three- to four-fold greater than precipitation.

2.2. Experimental Design and Agronomic Management

The experimental design was a randomized complete block with four replications.
Plots were 4 m wide × 17 m long in block 1, 21 m long in blocks 2 and 3, and 20 m long in block 4. The long-term experiment included six tillage practice treatments in a two-year spring wheat/pea (Pisum sativum L.) rotation, with both phases of the rotation present in each year. All measurements in this study were made from plots planted with wheat. The conventional tillage with no straw (T) treatment included the removal of all aboveground crop residues at the time of grain harvest before moldboard plowing to a depth of 20 cm. The conventional tillage with straw incorporated (TS) treatment was the same as T, except that all residues from the previous crops were retained and incorporated into the soil with tillage. The no-till with no straw (NT) treatment had all aboveground crop residues removed at the time of grain harvest and no tillage operations. The no-till with straw cover (NTS) treatment was the same as NT, except that all residues from the previous crops were retained. The conventional tillage with plastic mulch (TP) treatment was the same as T, except that alternating ridges (10 cm high × 40 cm wide) and furrows (10 cm wide) were made after harrowing with a ridging implement and all ridges and furrows were covered with colorless plastic film mulch using a plastic mulch laying machine prior to sowing crops in the furrows. The no-till with plastic mulch (NTP) treatment was the same as NT, except that the entire plot area was covered with colorless plastic film mulch using a plastic mulch laying machine. There were the same ridges and furrows with TP.
The spring wheat and pea cultivars were Dingxi 40 and Lvnong 2, respectively. Wheat was sown at a rate of 187.5 kg ha−1 in rows spaced 20 cm apart and pea was seeded at 180 kg ha−1 in rows spaced 24 cm apart. Immediately prior to the time of plastic mulch laying in the treatments with plastic mulch, all treatments were fertilized with calcium superphosphate (105 kg P2O5 ha−1 for wheat and pea) and urea (105 and 20 kg N ha−1 for wheat and pea, respectively) that was broadcast uniformly over the entire plot area. Wheat was sown on 27 March 2016 and 26 March 2017, and harvested on 25 July 2016 and 20 July 2017. Weeds were removed by hand during the growing season and controlled with herbicides during the fallow period.

2.3. Measurements and Calculation

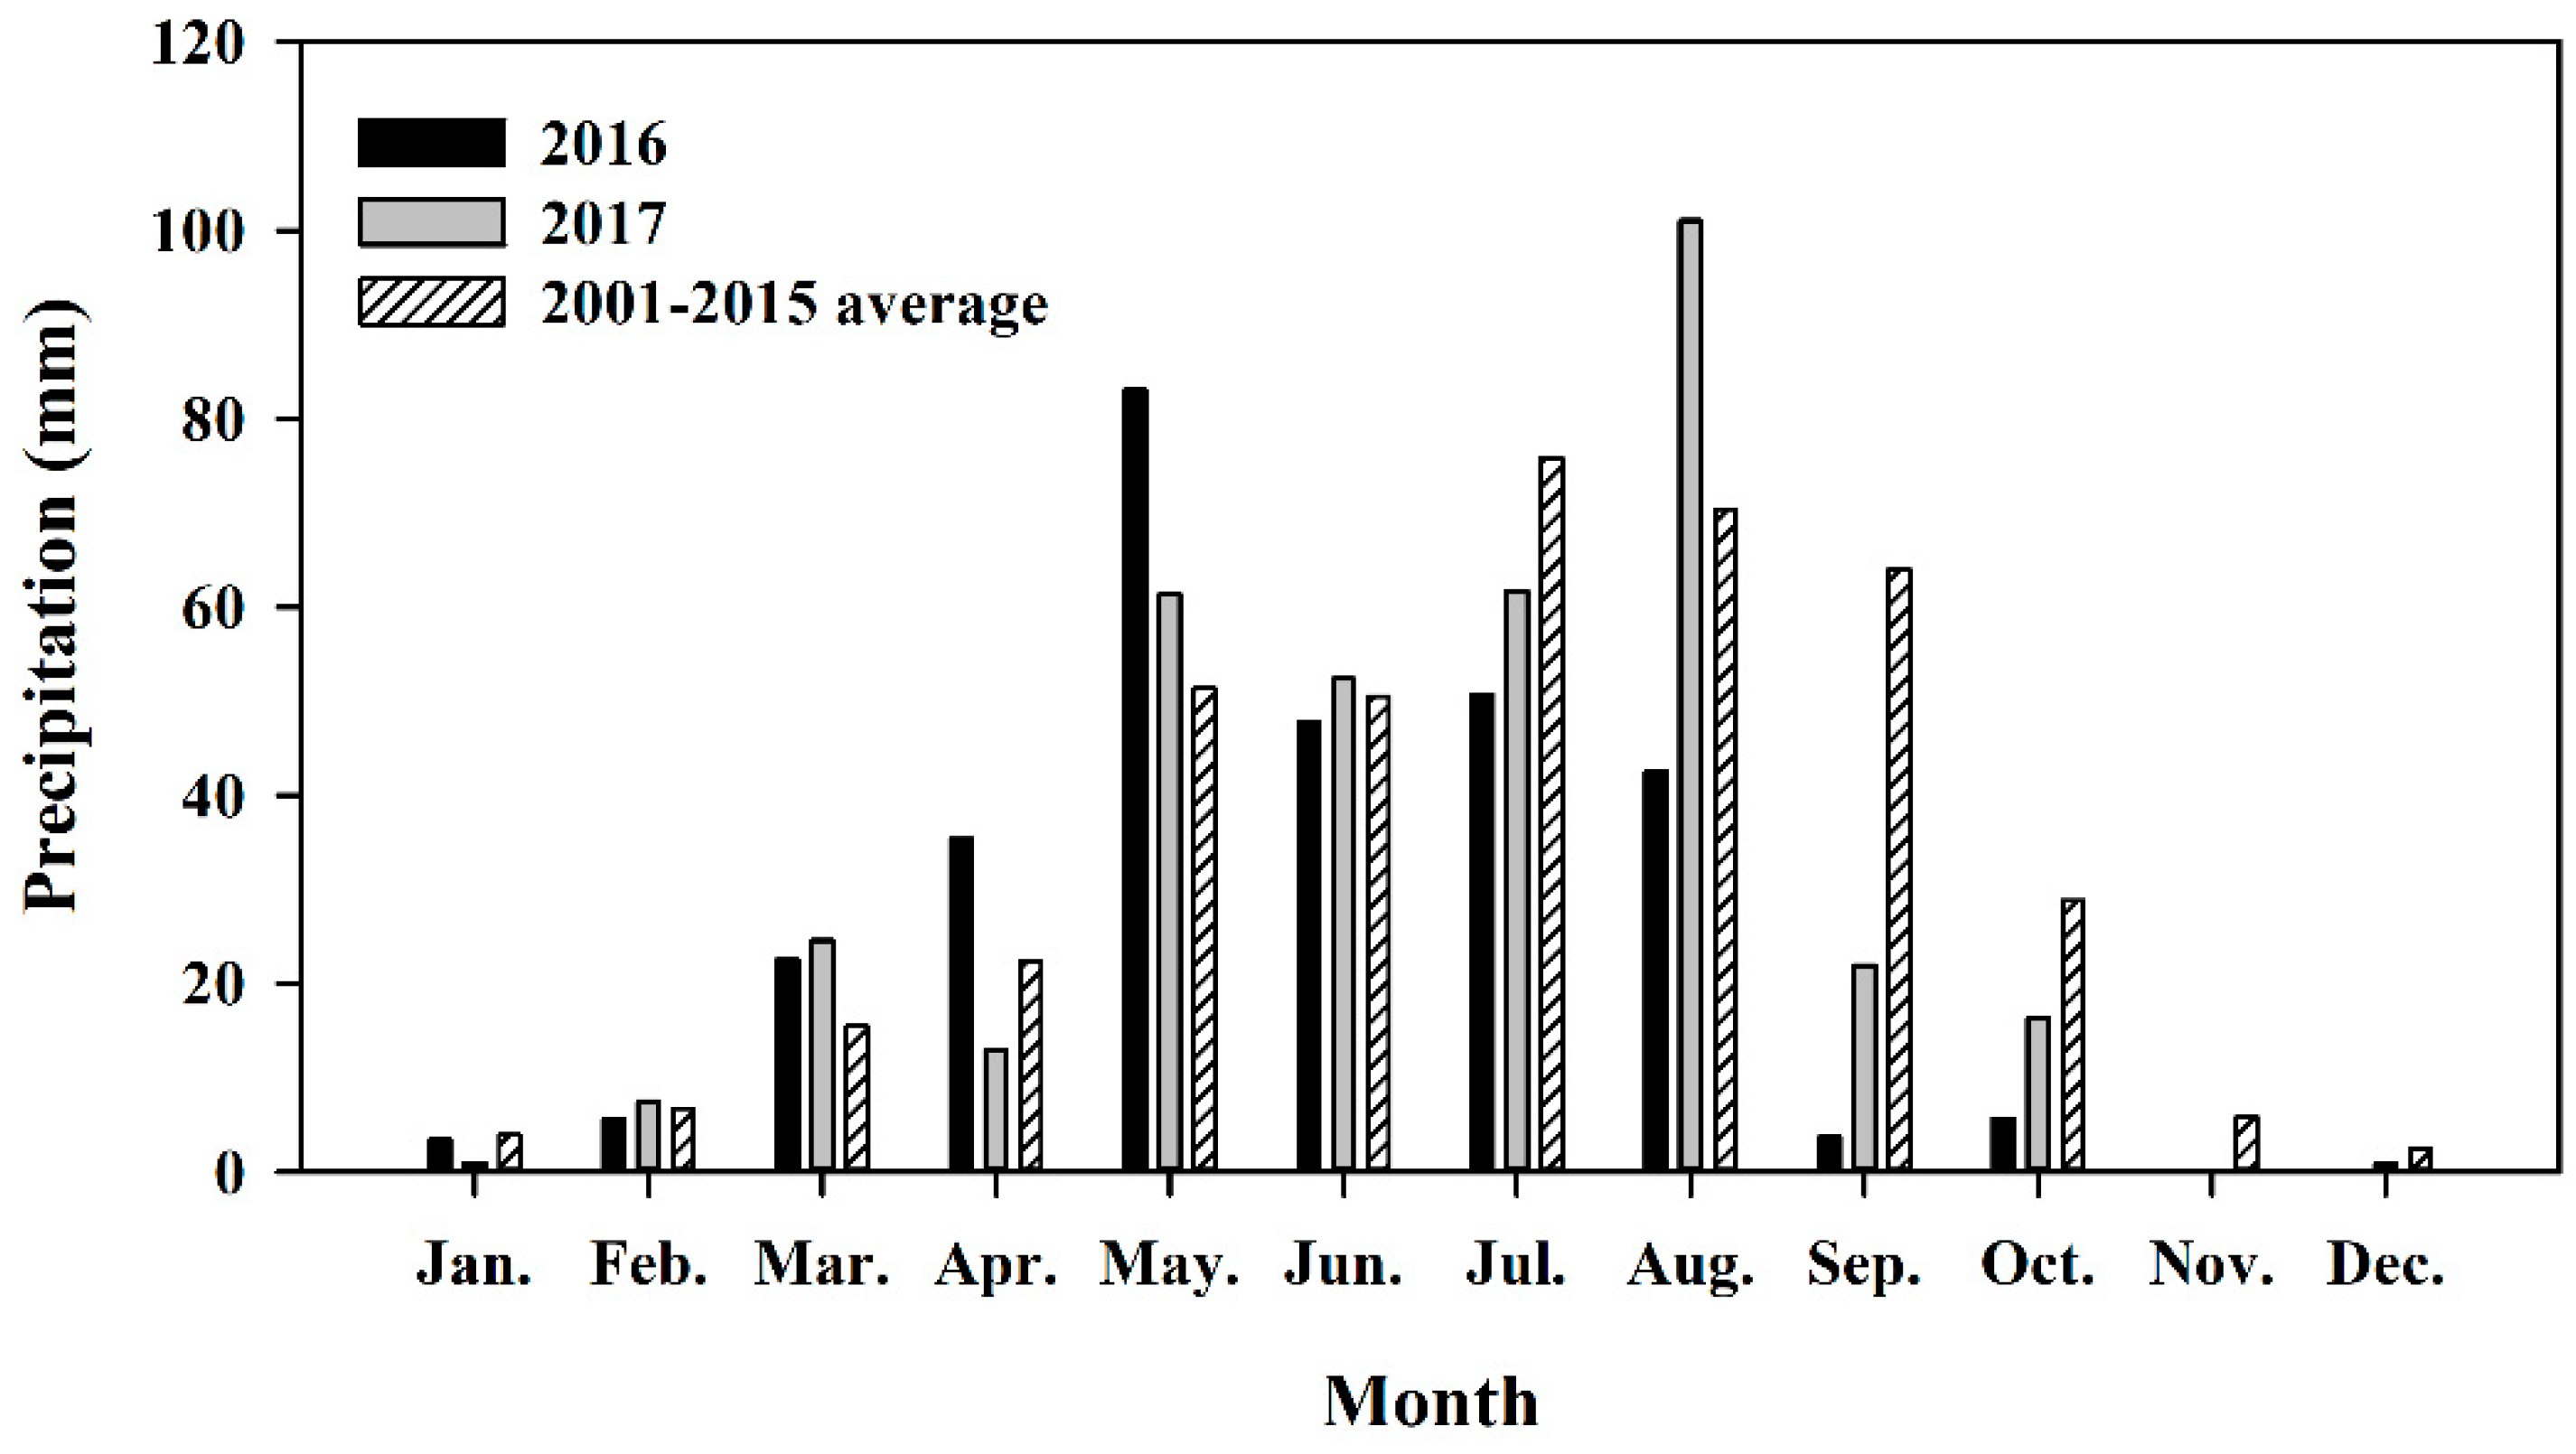
2.3.1. Precipitation and Drought Index

Daily precipitation was measured with a rainfall canister at the experimental site and DI was calculated as follows [34]:
DI = A r M δ
where Ar is annual rainfall, M is average annual rainfall, and δ is the standard deviation for annual rainfall. Drought index can be used to distinguish among wet ( DI > 0.35), normal (−0.35 ≤ DI ≤ 0.35), and dry ( DI < −0.35) soil water conditions for various time periods including on an annual basis, for a growing season, and for a fallow period [34]. Therefore, rainfall during the growing season and fallow period were used to also calculate the DI for these periods in the two study years.

2.3.2. Water Potential and Soil–Leaf Resistance

Water potential indexes were measured at four growth stages of wheat including the seedling stage (30 April 2016 and 12 May 2017), tillering stage (20 May 2016 and 27 May 2017), jointing stage (30 May 2016 and 10 June 2017), and flowering stage (15 June 2016 and 27 June 2017). Three representative plants were randomly selected per plot, their leaves were removed with scissors, and placed into the leaf sample box. Next, a root and soil sample for the selected plants was taken using a soil corer (9-cm inner diameter) from the 0–10 cm soil depths at the seedling stage; at the 0–10 and 10–30 cm soil depths at tillering and jointing; and 0–10, 10–30, and 30–50 cm soil depth at flowering, respectively. Sampled root systems were gently shaken to let the rhizosphere soil fall into the soil sample box, then the root system was placed into the root sample box. Leaf water potential, root water potential, and soil water potential were measured immediately after each were sampled using a dew point water potential meter (WP4C Dewpoint PotentiaMeter, METER Group, Pullman, WA, USA) [35,36].
Transpiration rate and net photosynthetic rate was measured at 9:00 to 11:00 on the morning of the flowering stage (15 June 2016 and 27 June 2017) of wheat with a portable photosynthesis system (model GFS3000, Heinz Walz GmbH, Effeltrich, Germany). Three wheat plants were randomly selected in each plot, the flag leaves of each plant were measured, and the average value of the three plants was obtained as the transpiration rate and net photosynthetic rate of the plot. Soil–leaf water transfer resistance (Rsl) was calculated using following equation [37]:
R sl = Ψ s Ψ l CT
where Rsl is the soil–leaf water transfer resistance; Ψs is soil water potential; Ψl is leaf water potential; and CT is also transpiration rate.

2.3.3. Soil Water Content, Evapotranspiration, and Evaporation

Soil water content was measured to a depth of 2 m before sowing and after harvest in 2016 and 2017 using the oven-dry method [38] for the 0–5 and 5–10 cm soil depths, and using a time domain reflectometry soil moisture sensor (TRIME-PICO IPH/T3, IMKO GmbH, Ettlingen, BW, Germany) for the 10–30, 30–50, 50–80, 80–110, 110–140, 140–170, and 170–200 cm soil depths. The volumetric moisture content for the 0–5 and 5–10 cm soil depths was calculated by weight moisture content multiplied by corresponding soil bulk density. Evapotranspiration (ET) was calculated using the following equation [9]:
ET = P + W 1 W 2
where ET is evapotranspiration during the growing season; P is precipitation during the growing season; and W1 and W2 are water storage in the 0–200 m soil layer before sowing and after harvest, respectively.
Soil evaporation was measured with a micro-evaporator made from polyvinylchloride tubing with the length of 150 mm, internal diameter of 110 mm, and external diameter of 115 mm [39]. On the sampling day, the soil mass of the micro-evaporator was weighed using an electronic balance with a sensitivity of 0.01 g, returned back to its original location in the field, and measured again at 07:00 h the following day. The loss in mass was the amount of evaporation the day before (equivalent to 0.1051 mm g−1). Soil inside the micro-evaporator was changed every three days and after precipitation, the tube emptied of soil, and placed in a new location in the field, which ensured that soil moisture inside the micro-evaporator was consistent with the surrounding soil. The calculation of evaporation in a growth period is based on the daily average evaporation measured during the growth stage multiplied by the number of days during the growth period without precipitation. The amount of transpiration during a growing season is the sum of that for all growth periods in the growing season using the following equation [40]:
T = ET E
where T is transpiration during growing season; ET is evapotranspiration during growing season; and E is soil evaporation during growing season.

2.3.4. Yield and Water Use Efficiency

The whole plot was harvested manually using sickles at 5 cm above ground. The edges (0.5 m) of the plot were trimmed and discarded. Biological yield (BY) was measured by natural drying and before threshing. The grain moisture content after threshing was measured by the PM-8188 grain moisture meter (Kett Electric Lab., Tokyo, Japan), repeated five times, and the mean was taken. In addition, grain yield (GY) at 13% water content was calculated. All straw and chaff from stubble incorporated treatments were returned to the original plots immediately after threshing. Water use efficiency was calculated using following equations [9]:
WUE g = G Y E T
WUE b = B Y E T
where WUEg and WUEb are water use efficiency of the grain and biomass yield, respectively.

2.4. Statistical Analysis

All data were checked for normality of distribution using the SPSS 19.0 software (IBM Corp., Chicago, IL, USA) and the Shapiro–Wilk test, and for homoscedasticity using the Levene’s test with the general linear model. Data were transformed using either square root or natural log transformation to achieve normality when assumptions could not be met. All data were normal after testing. Analysis of variance was conducted for all dependent variables. Year and tillage practice were considered as fixed effects, and replication was considered a random effect. Differences among means were determined using Tukey’s honestly significant different test (p ≤ 0.05). The linear relationship of water potential indexes with transpiration, BY, GY, WUEg, and WUEb were assessed using Pearson’s correlation coefficient.

3. Results

3.1. Effect of Tillage Practices on Water Potential at Different Growth Stages

Soil water potential varied with year, tillage practice, soil depth, and growth stage of wheat (Table 3). In 2016, soil water potential with NTS and TP were significantly greater in the 0–10 cm soil layer at the seedling and jointing stages compared to T. In 2017, soil water potential with the different treatments had a similar pattern to that in 2016. On average, compared with T, soil water potential with NTS was significantly greater in the 0–10 cm soil depth at the seedling and jointing stages. Soil water potential with TP was significantly greater than that with T in the 0–10 cm soil depth at the seedling stage and in the 0–10 and 10–30 cm soil depths at the jointing stage. Compared to T, soil water potential with NTP was significantly increased in the 0–10 cm soil depth at the seedling stage, in the 10–30 cm soil depth at tillering stage, and in the 10–30 cm soil depth at the jointing stage.
Year, tillage practice, soil depth, and growth stage of wheat influenced root water potential (Table 4). In general, compared to T, root water potential was significantly increased with NTS and NT in the 0–10 cm soil depth at the seedling and jointing stages, and with NTS in the 30–50 cm soil depth at flowering. Root water potential was not significantly different between TS and T in all soil layers at every growth stage. Root water potential with TP was significantly greater than that with T in the 0–10 cm soil depth at the seedling, tillering, and jointing stages, and in the 0–10 and 30–50 cm soil depths at flowering. Root water potential with NTP was significantly greater than that with T in the 0–10 cm soil depth at the seedling stage, in the 0–10 and 10–30 cm soil depths at tillering and jointing, and in the 0–10 and 30–50 cm soil depths at flowering.
Leaf water potential differed with year, tillage practice, soil depth, and growth stage of wheat (Table 5). In 2016, compared to T, leaf water potential with NTS was significantly increased at the seedling stage, and not significantly different with NT and TS at any growth stage. Leaf water potential in 2016 was significantly greater with NTP and TP at the seedling stage, and with TP at flowering, compared to T. In 2017, compared to T, leaf water potential with NTS was significantly increased at the seedling and tillering stages; however, leaf water potential with NT was not significantly increased at any growth stage. Leaf water potential was significantly greater with TS than T at the seedling and tillering stages, and with TP than T increased at the seedling, tillering, and jointing stages. On average, leaf water potential with NTS and NTP was significantly greater than that with T at the seedling, tillering, and jointing stages. Leaf water potential with NT and TP was not significantly different when compared to that with T at any growth stage. However, leaf water potential with TS was significantly greater than that with T at the seedling stage.

3.2. Effect of Tillage Practices on Water Potential Gradient at Different Growth Stages

The soil–root water potential gradient was affected by year, tillage practice, soil layer, and growth stage of wheat (Table 6). In 2016, the soil–root water potential gradient was not significantly different among tillage practices at all soil layers at all growth stages. In 2017, the soil–root water potential gradient was significantly reduced with NTS and NTP compared to the other tillage practices in the 0–10 cm soil depth at the jointing stage and in the 0–10 and 30–50 cm soil depths at the flowering stage.
The root–leaf water potential gradient varied with year, tillage practice, soil depth, and growth stage of wheat (Table 7). On average, compared to T, the root–leaf water potential gradient with NTS was significantly reduced at the 0–10 cm soil depth at the seedling stage, 10–30 cm soil depth at jointing stage, and 30–50 cm soil depth at the flowering stage; however, the root–leaf water potential gradient with NT was significantly increased at the 0–10 cm soil depth at the tillering stage. The root–leaf water potential gradient was significantly decreased with TS at the 0–10 cm soil depth at the seedling stage, and with TP at the 0–10 cm soil depth at the seedling stage and 30–50 cm soil depth at flowering, compared to T. The root–leaf water potential gradient with NTP was significantly reduced at the 0–10 cm soil depth at the seedling stage and 30–50 cm soil depth at flowering, compared to T.
The soil–leaf water potential gradient varied with year, tillage practice, soil layer, and growth stage of wheat (Table 8). On average, the soil–leaf water potential gradient with NTS was significantly less than that with T at the 0–10 cm soil depth at the seedling stage and 30–50 cm soil depth at flowering. The soil–leaf water potential gradient with NT and TS was not significantly different from that with T at all soil depths and growth stages. Compared to T, the soil–leaf water potential gradient was significantly decreased with TP at the 0–10 cm soil depth at the seedling stage and at the 30–50 cm soil depth at flowering, and with NTP at the 0–10 cm soil depth at the seedling and jointing stages and at the 30–50 cm soil depth at flowering.

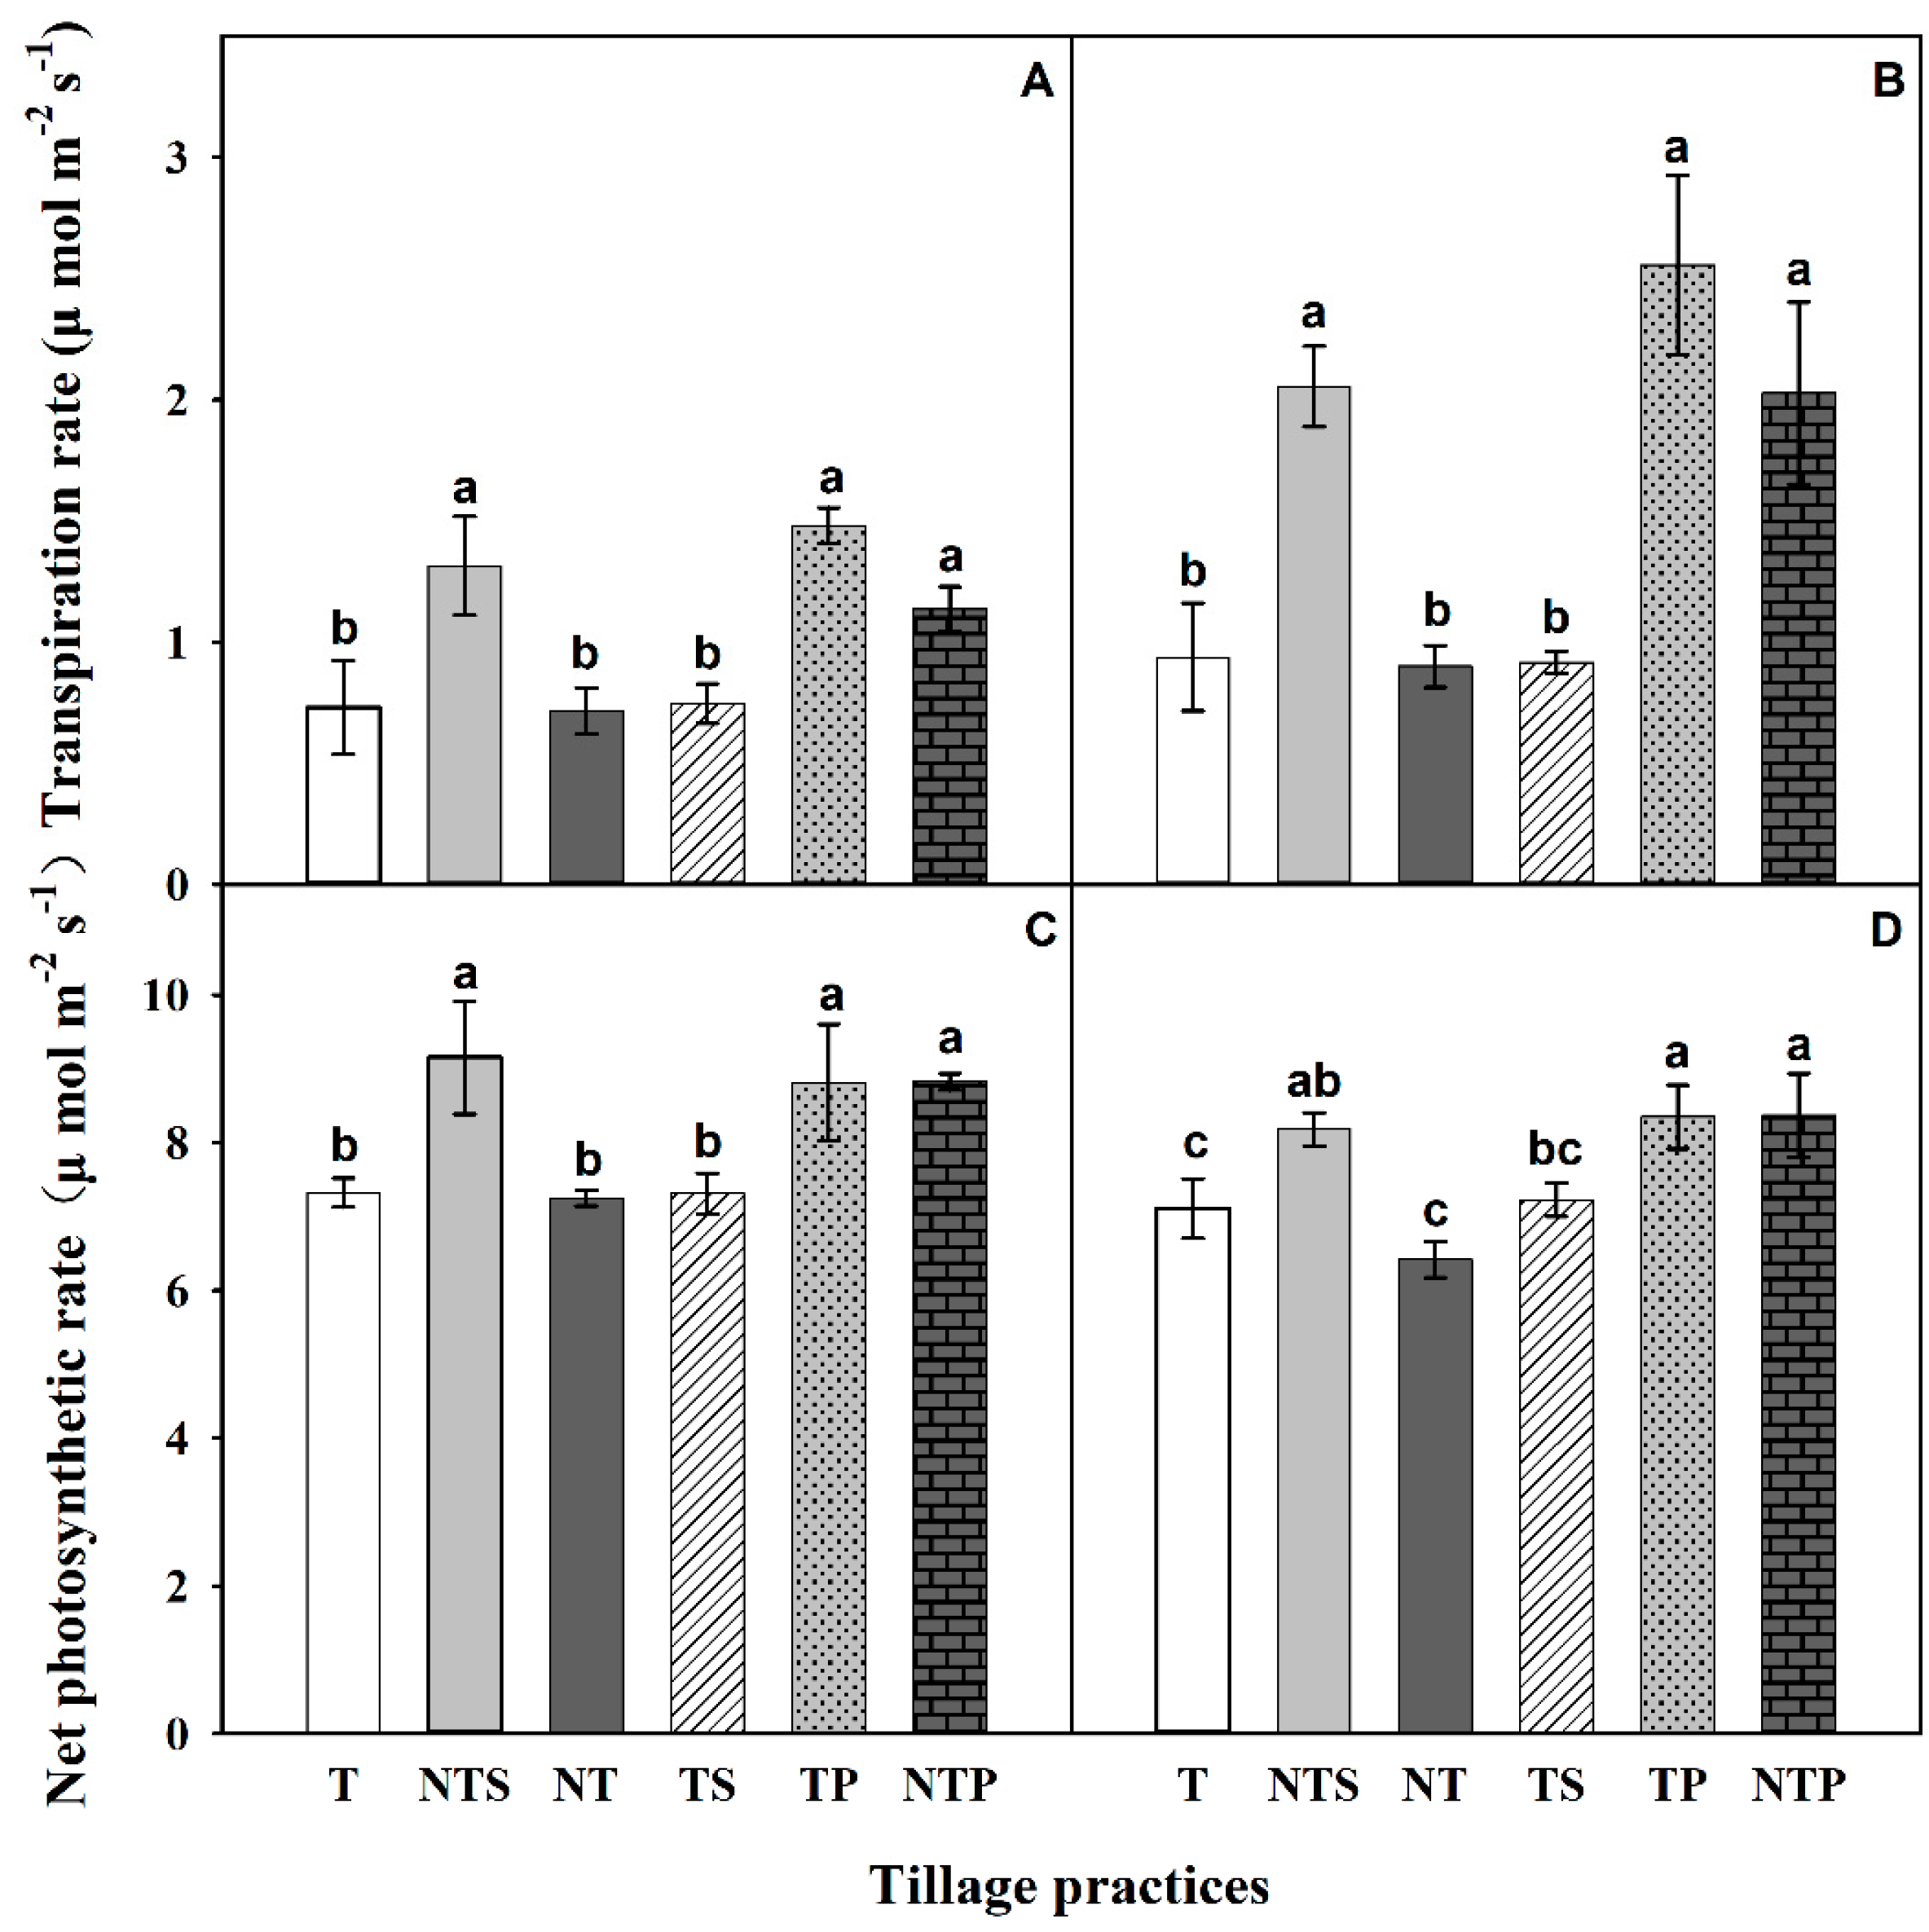
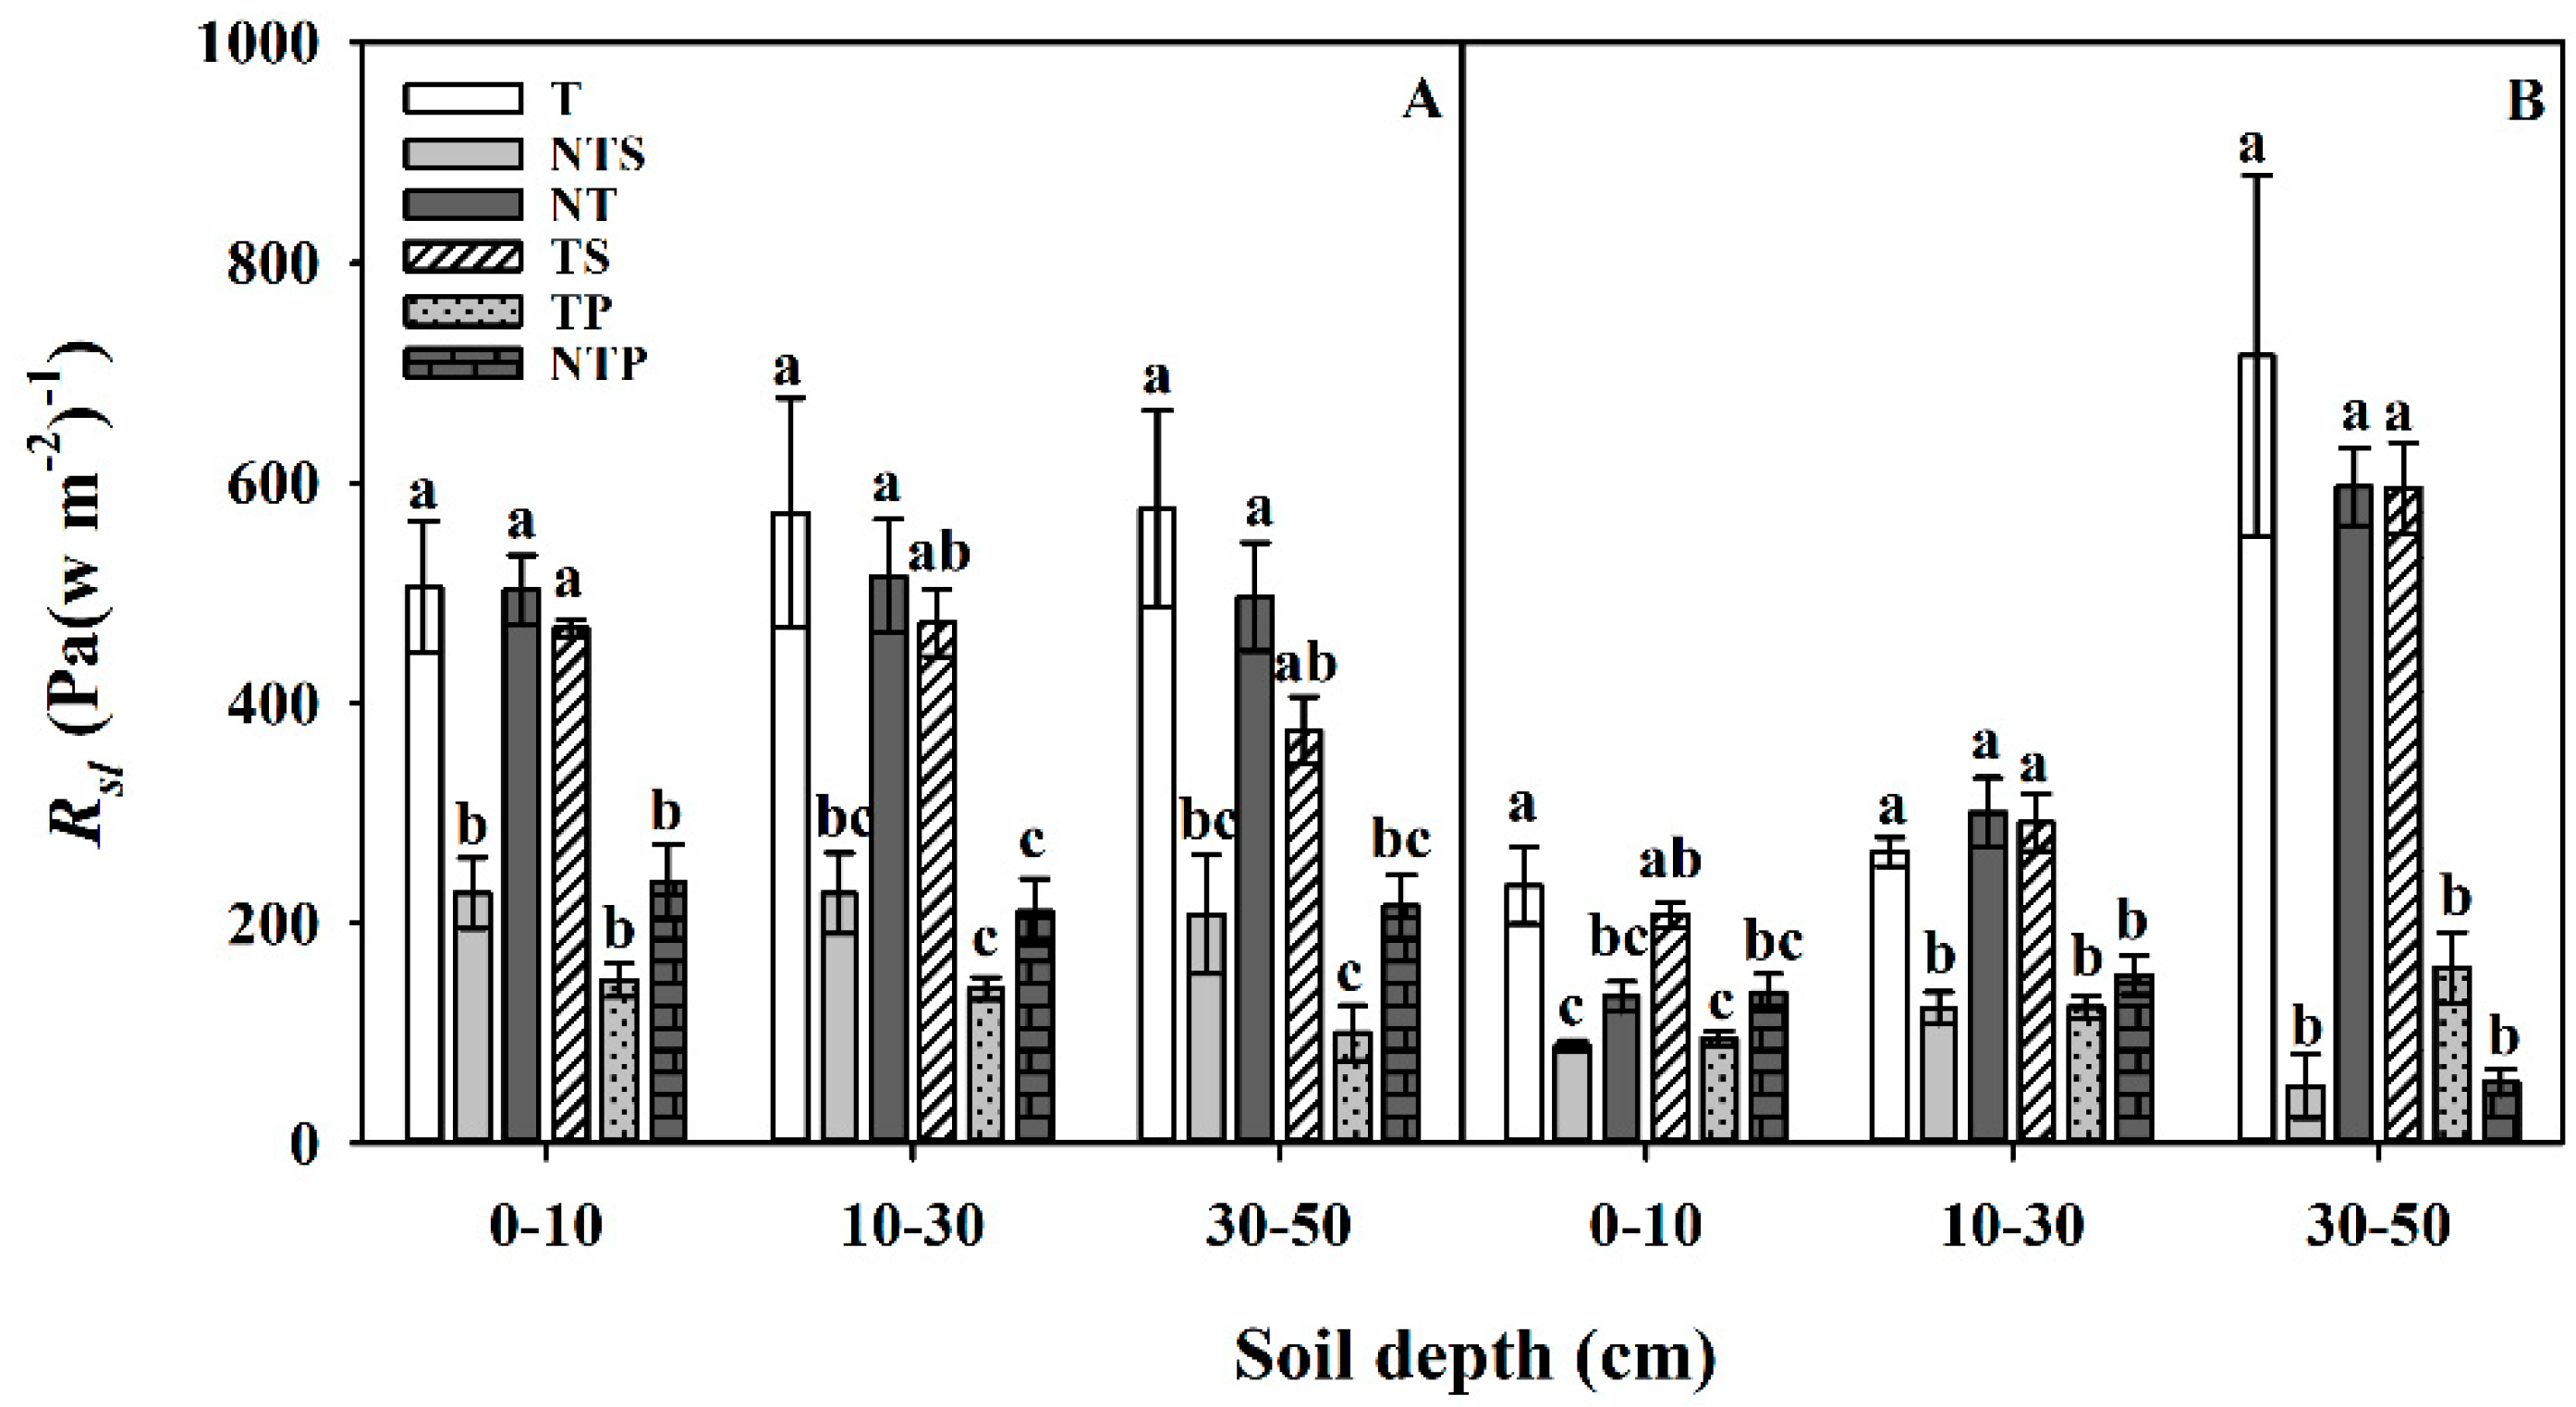
3.3. Effects of Tillage Practices on Transpiration Rate and Soil–Leaf Water Transfer Resistance at Flowering

Transpiration rate of wheat at flowering varied with tillage practice (Figure 2). Compared with T, transpiration rate was significantly increased with NTS, TP, and NTP, but not significantly different with NT and TS in all years (Figure 2A,B); on average, NTS, TP, and NTP significantly increased transpiration rate by 103, 143, and 91%, respectively, compared with T. Net photosynthetic rate and soil–leaf water transfer resistance at flowering were impacted by tillage practices (Figure 2 and Figure 3). Net photosynthetic rate was significantly increased with NTS, TP, and NTP, but was not significantly different with NT and TS (Figure 2C,D); over the two years, NTS, TP, and NTP significantly increased the net photosynthetic rate by 20, 19, and 19%, respectively, when compared to T. Compared to T, soil–leaf water transfer resistance at all soil layers was significantly reduced with NTS, TP, and NTP, but not significantly different with NT and TS (Figure 3). Averaged across years and soil layers, compared to T, the soil–leaf water transfer resistance with NTS, TP, and NTP was significantly decreased by 66, 70, and 63%, respectively.

3.4. Effect of Tillage Practices on Yield and Water Use Efficiency

Tillage practice significantly affected transpiration at flowering, BY, WUEb, GY, and WUEg (Table 9). Over the two years, compared with T, transpiration with NTS, TP, and NTP was significantly increased by 40, 64, and 76%, respectively; however, transpiration was not significantly different with NT and TS. Compared to T, BY was significantly increased with NTS, TP, and NTP by 18, 36, and 40%, respectively; however, it was not significantly different with NT and TS. Water use efficiency of BY was significantly increased with TP and NTP by 25 and 22%, respectively, but was not significantly different with NTS and TS, compared to T. Grain yield with NTS, TP, and NTP was significantly increased by 28, 22 and 24%, respectively, compared to T; however, it was not significantly different among NT, TS, and T. Water use efficiency of GY with NTS, TP and NTP was significantly increased by 24, 26, and 24%, respectively, but not significantly different with NT and TS, compared to T.

3.5. Correlations of Water Potential Indexes with Transpiration, Biomass and Grain Yields, and Water Use Efficiency of Grain and Biomass Yields

Significant correlations among the water potential indexes, transpiration at growing season, BY, WUEb, GY, and WUEg of wheat were observed (Table 10). Soil water potential, root water potential, and leaf water potential at the seedling stage was highly significant and positively associated with transpiration, BY, WUEb, GY, and WUEg. Soil water potential, root water potential, and leaf water potential at other growth stages showed different patterns. The root–leaf water potential gradient and soil–leaf water potential gradient at the seedling stage had a significant negative correlation with transpiration, BY, WUEb, GY, and WUEg. The soil–root water potential gradient, root–leaf water potential gradient, and soil–leaf water potential gradient at the 30–50 cm soil depth at flowering had a significant negative correlation with transpiration, BY, WUEb, GY, and WUEg. The soil–root water potential gradient, root–leaf water potential gradient, and soil–leaf water potential gradient at other growth stages showed different patterns.

4. Discussion

4.1. Effects of Tillage Practices on Water Potential in the Soil–Plant System

Soil, roots, and leaves are important indicators of whether plants are subject to drought stress [41,42,43], and have been employed in the selection of appropriate tillage practices. Tillage practices can affect soil, root, and leaf water potential [44,45]. In this study, NTS significantly increased soil water potential in the 0–10 cm soil depth at the seedling and jointing stages of wheat compared to T because NTS increased topsoil moisture at the seedling stage. However, with wheat growth and development, canopy coverage increased, transpiration dominated evapotranspiration, and the positive effect of straw mulching on topsoil moisture gradually weakened [26,46], thus NTS did not significantly increase the soil water potential at flowering. Conventional tillage and no-till improved soil water potential compared to T in the 0–30 cm soil depths at all growth stages, mainly because plastic film mulching reduced soil evaporation, which led to greater soil water moisture throughout the growing season [47]. No-till with straw cover, TP, and NTP increased leaf water potential compared to T at all growth stages, in agreement with results from previous studies [44,48]. However, Zhang et al. [49] found that NTS reduced leaf water potential by 11% compared to T. This discrepancy is likely to be due to differences in soils and early rainfall prior to measurement. The study reported by Zhang et al. (1999) was conducted on a quaternary red clay soil with high viscosity, and long-term no-till led to subsurface soil compaction and shallow root systems. The present study was conducted on a deep loess soil with deep uniform texture and high water storage capacity [50], which is favorable for the growth and development of crop root systems.
Water potential gradients drive water transport from soil to plants, with a greater water potential gradient resulting in faster water absorption [51]. In this study, NTS, TP, and NTP reduced the soil–root water potential gradient in the 30–50 cm soil depth at the flowering of wheat. No-till with straw cover, TP, and NTP significantly decreased the root–leaf water potential gradient compared to T at the 0–10 cm soil depth at the seedling stage and 30–50 cm soil depth at flowering. These treatments also significantly reduced the soil–leaf water potential gradient at the 0–10 cm soil depth at the seedling stage and 30–50 cm soil depth at flowering, most likely because they stored more water from the fallow period. Moreover, wheat canopy coverage reaches a maximum at flowering, thereby limiting evaporation after this stage.
Water transfer resistance exists in the process of water transport from soil to plants [52]. In this study, NTS, TP, and NTP reduced the soil–leaf water transfer resistance at flowering of wheat compared to T. This could be due to NTS, TP, and NTP having increased root length and root surface area, and more favorable spatial distribution of roots for water uptake [53]. This was demonstrated in this study, as NTS, TP, and NTP had greater soil water absorption by plants than T.
In this study, NTS, TP, and NTP significantly increased the transpiration and net photosynthetic rate of wheat at flowering compared to T, as shown in previous studies [54,55,56]. The net photosynthetic rate of wheat flag leaves has been reported to be 24 to 39% higher with NTS compared to conventional tillage, and also has a significantly higher transpiration rate [54,57]. In contrast, Jiang et al. [58] found that NTS reduced the photosynthetic rate of wheat, likely because their straw cover was applied after sowing, resulting in less soil moisture stored during the fallow season. Straw coverage in this study occurred after harvest, leading to more soil moisture stored during the fallow season, thereby enabling an increase in photosynthetic rate. Transpiration is fundamental to understanding crop water use efficiency [10]. In this study, transpiration with NTS, TP, and NTP was significantly increased compared to T, mainly because NTS, TP, and NTP increased precipitation infiltration and reduced soil evaporation [23,47,59].
Biomass yield of wheat was significantly greater with NTS, TP, and NTP compared to T. Garofalo and Rinaldi [60] found that a greater rate of transpiration was associated with greater BY. However, Dam et al. [61] found that the long-term BY of maize did not differ between NTS and T. This may be attributable to differences in soil texture at the experimental sites, which was sandy loam in their study and loess in the present study. In agreement with our results, Zhang et al. [62] found that plastic mulching increased the BY of maize. This could be due to enhanced crop growth resulting from greater soil temperature [63,64], soil moisture [62], and radiation capture [65] with plastic mulching.

4.2. Effects of Tillage Practices on Grain Yield and Water Use Efficiency

Conservation tillage practices have been shown to increase soil water storage, wheat yield, and WUE on the semi-arid Loess Plateau of China [27,66]. However, Pittelkow et al. [15] found that conservation tillage practices did not increase the GY of cereals in moist regions. This is likely to be because the impact of conservation tillage on yield varies among climatic zones. The improvement of wheat GY and WUEg with NTS, TP, and NTP compared to T in this study can be attributed to increased water potential and decreased water potential gradient and water transfer resistance, thus enhancing transpiration and BY.

5. Conclusions

This study demonstrated that NTS, TP, and NTP significantly increased grain yield and WUEg as a result of increased water potential, decreased water potential gradient, and water transfer resistance, and led to increases in transpiration rate, transpiration, and biomass yield. These results demonstrate that no-till with straw cover, conventional tillage with plastic mulch, and no-till with plastic mulch are suitable tillage practices for the sustainable intensification of wheat production in semi-arid areas.

Author Contributions

Conceptualization, L.L.; Data curation, Z.P.; Formal analysis, Z.P., L.W. and Z.L.; Funding acquisition, L.L.; Investigation, L.W.; Methodology, J.X. and Z.L.; Project administration, J.X.; Supervision, L.L. and R.Z.; Validation, J.X.; Writing – original draft, Z.P.; Writing – review & editing, L.L., J.A.C., R.Z., J.K. and S.C.

Funding

This work was supported by the Research Program of the Gansu Provincial Key Laboratory of Aridland Crop Science, Gansu Agricultural University (GSCS-2019-Z04, GSCS-2019-09, and GSCS-2017-4), the National Natural Science Foundation of China (31761143004 and 31660373), and the Department of Education of Gansu Province (2017C-12).

Conflicts of Interest

The authors declare no conflicts of interest.

References

  1. Wei, T.; Dong, Z.; Zhang, C.; Ali, S.; Chen, X.; Han, Q.; Zhang, F.; Jia, Z.; Zhang, P.; Ren, X. Effects of rainwater harvesting planting combined with deficiency irrigation on soil water use efficiency and winter wheat (Triticum aestivum L.) yield in a semiarid area. Field Crops Res. 2018, 218, 231–242. [Google Scholar] [CrossRef]
  2. Li, F.M.; Wang, J.; Xu, J.Z.; Xu, H.L. Productivity and soil response to plastic film mulching durations for spring wheat on entisols in the semiarid Loess Plateau of China. Soil Tillage Res. 2004, 78, 9–20. [Google Scholar] [CrossRef]
  3. Wu, J.; Miao, C.; Tang, X.; Duan, Q.; He, X. A nonparametric standardized runoff index for characterizing hydrological drought on the Loess Plateau, China. Glob. Planet. Chang. 2018, 161, 53–65. [Google Scholar] [CrossRef]
  4. Zhang, S.; Sadras, V.; Chen, X.; Zhang, F. Water use efficiency of dryland wheat in the Loess Plateau in response to soil and crop management. Field Crops Res. 2013, 151, 9–18. [Google Scholar] [CrossRef]
  5. Deng, X.P.; Shan, L.; Zhang, H.; Turner, N.C. Improving agricultural water use efficiency in arid and semiarid areas of China. Agric. Water Manag. 2006, 80, 23–40. [Google Scholar] [CrossRef]
  6. Huang, Y.; Chen, L.; Fu, B.; Huang, Z.; Gong, J. The wheat yields and water-use efficiency in the Loess Plateau: Straw mulch and irrigation effects. Agric. Water Manag. 2005, 72, 209–222. [Google Scholar] [CrossRef]
  7. Wang, Y.; Xie, Z.; Malhi, S.S.; Vera, C.L.; Zhang, Y.; Wang, J. Effects of rainfall harvesting and mulching technologies on water use efficiency and crop yield in the semi-arid Loess Plateau, China. Agric. Water Manag. 2009, 96, 374–382. [Google Scholar] [CrossRef]
  8. Yeboah, S.; Zhang, R.; Cai, L.; Song, M.; Li, L.; Xie, J.; Luo, Z.; Wu, J.; Zhang, J. Greenhouse gas emissions in a spring wheat–field pea sequence under different tillage practices in semi-arid Northwest China. Nutr. Cycl. Agroecosyst. 2016, 106, 77–91. [Google Scholar] [CrossRef]
  9. Wang, L.; Palta, J.A.; Chen, W.; Chen, Y.; Deng, X. Nitrogen fertilization improved water-use efficiency of winter wheat through increasing water use during vegetative rather than grain filling. Agric. Water Manag. 2018, 197, 41–53. [Google Scholar] [CrossRef]
  10. Unkovich, M.; Baldock, J.; Farquharson, R. Field measurements of bare soil evaporation and crop transpiration, and transpiration efficiency, for rainfed grain crops in Australia–A review. Agric. Water Manag. 2018, 205, 72–80. [Google Scholar] [CrossRef]
  11. Fu, A.; Chen, Y.; Li, W.; Zhang, H. Research advances on plant water potential under drought and salt stress. J. Desert Res. 2005, 25, 744–749. [Google Scholar]
  12. Van Den Honert, T. Water transport in plants as a catenary process. Discuss. Faraday Soc. 1948, 3, 146–153. [Google Scholar] [CrossRef]
  13. Yang, X.G.; Liu, H.L.; Hu-ning, Y.U. The changing of water transfer potential in soil-plant-atmosphere continuum system of maize field. Chin. J. Eco-Agric. 2003, 11, 27–29. [Google Scholar]
  14. Kalapos, T. Leaf water potential-leaf water deficit relationship for ten species of a semiarid grassland community. Plant Soil 1994, 160, 105–112. [Google Scholar] [CrossRef]
  15. Pittelkow, C.M.; Liang, X.Q.; Linquist, B.A.; Groenigen, K.J.; Lee, J.; Lundy, M.E.; Gestel, N.; Johan, S.; Venterea, R.T.; Kessel, C. Productivity limits and potentials of the principles of conservation agriculture. Nature 2015, 517, 365–368. [Google Scholar] [CrossRef] [PubMed]
  16. Young, D.L.; Schillinger, W.F. Wheat farmers adopt the undercutter fallow method to reduce wind erosion and sustain profitability. Soil Tillage Res. 2012, 124, 240–244. [Google Scholar] [CrossRef]
  17. Tan, C.; Cao, X.; Yuan, S.; Wang, W.; Feng, Y. Effects of Long-term Conservation Tillage on Soil Nutrients in Sloping Fields in Regions Characterized by Water and Wind Erosion. Sci. Rep. 2015, 5, 17592. [Google Scholar] [CrossRef] [PubMed] [Green Version]
  18. Wu, J.; Cai, L.Q.; Luo, Z.Z.; Li, L.L.; Zhang, R.Z. Effects of conservation tillage on soil physical properties of rainfed field of the Loess Plateau in Central of Gansu. J. Soil Water Conserv. 2014, 28, 112–117. [Google Scholar]
  19. Peng, Z.; Li, L.; Xie, J.; Kang, C.; Essel, E.; Wang, J.; Xie, J.; Shen, J. Effects of conservational tillage on water characteristics in dryland farm of central Gansu, Northwest China. Chin. J. Appl. Ecol. 2018, 29, 4022–4028. [Google Scholar]
  20. Jakab, G.; Madarász, B.; Szabó, J.; Tóth, A.; Zacháry, D.; Szalai, Z.; Kertész, Á.; Dyson, J. Infiltration and soil loss changes during the growing season under ploughing and conservation tillage. Sustainability 2017, 9, 1726. [Google Scholar] [CrossRef]
  21. Madarász, B.; Juhos, K.; Ruszkiczay-Rüdiger, Z.; Benke, S. Conservation tillage vs. conventional tillage: Long-term effects on yields in continental, sub-humid Central Europe, Hungary. Int. J. Agric. Sustain. 2016, 14, 408–427. [Google Scholar]
  22. Bescansa, P.; Imaz, M.J.; Virto, I.; Enrique, A.; Hoogmoed, W.B. Soil water retention as affected by tillage and residue management in semiarid Spain. Soil Tillage Res. 2006, 87, 19–27. [Google Scholar] [CrossRef]
  23. Cai, L.Q.; Luo, Z.Z.; Zhang, R.Z.; Huang, G.B.; Li, L.L.; Xie, J.H. Effect of different tillage methods on soil water retention and infiltration capability of rainfed field. J. Desert Res. 2012, 32, 1362–1368. [Google Scholar]
  24. Shao, Y.; Xie, Y.; Wang, C.; Yue, J.; Yao, Y.; Li, X.; Liu, W.; Zhu, Y.; Guo, T. Effects of different soil conservation tillage approaches on soil nutrients, water use and wheat-maize yield in rainfed dry-land regions of North China. Eur. J. Agron. 2016, 81, 37–45. [Google Scholar] [CrossRef]
  25. Brunel, N.; Seguel, O.; Acevedo, E. Conservation tillage and water availability for wheat in the dryland of central Chile. J. Soil Sci. Plant Nutr. 2013, 13, 622–637. [Google Scholar] [CrossRef]
  26. Li, L.; Huang, G.; Zhang, R.; Jin, X.; Li, G.; Chan, K.Y. Effects of no-till with stubble retention on soil water regimes in rainfed areas. J. Soil Water Conserv. 2005, 19, 94–96, 116. [Google Scholar]
  27. Su, Z.; Zhang, J.; Wu, W.; Cai, D.; Lv, J.; Jiang, G.; Huang, J.; Gao, J.; Hartmann, R.; Gabriels, D. Effects of conservation tillage practices on winter wheat water-use efficiency and crop yield on the Loess Plateau, China. Agric. Water Manag. 2007, 87, 307–314. [Google Scholar] [CrossRef]
  28. Yin, W.; Yu, A.; Chai, Q.; Hu, F.; Feng, F.; Gan, Y. Wheat and maize relay-planting with straw covering increases water use efficiency up to 46%. Agron. Sustain. Dev. 2015, 35, 815–825. [Google Scholar] [CrossRef]
  29. Tao, Z.; Li, C.; Li, J.; Ding, Z.; Xu, J.; Sun, X.; Zhou, P.; Zhao, M. Tillage and straw mulching impacts on grain yield and water use efficiency of spring maize in Northern Huang–Huai–Hai Valley. Crop J. 2015, 3, 445–450. [Google Scholar] [CrossRef]
  30. Gong, Z. Chinese Soil Taxonomy; Science Press: Beijing, China, 1999. [Google Scholar]
  31. IUSS Working Group WRB. World Reference Base for Soil Resources 2014, Update 2015: International Soil Classification System for Naming Soils and Creating Legends for Soil Maps; FAO: Rome, Italy, 2015. [Google Scholar]
  32. Zhu, X.; Li, Y.; Peng, X.; Zhang, S. Soils of the loess region in China. Geoderma 1983, 29, 237–255. [Google Scholar]
  33. Huang, G.; Zhang, R.; Li, G.; Li, L.; Chan, K.; Heenan, D.; Chen, W.; Unkovich, M.; Robertson, M.; Cullis, B.; et al. Productivity and sustainability of a spring wheat–field pea rotation in a semi-arid environment under conventional and conservation tillage systems. Field Crops Res. 2008, 107, 43–55. [Google Scholar] [CrossRef]
  34. Xing, N.; Zhang, Y.; Wang, L. The Study on Dryland Agriculture in North China, Chinese version; Chinese Agriculture Press: Beijing, China, 2001. [Google Scholar]
  35. Gubiani, P.I.; Reichert, J.M.; Campbell, C.; Reinert, D.J.; Gelain, N.S. Assessing errors and accuracy in dew-point potentiometer and pressure plate extractor meaurements. Soil Sci. Soc. Am. J. 2013, 77, 19–24. [Google Scholar] [CrossRef]
  36. Luo, T.; Wu, J. Analysis of The Moisture Transmission Resistance of Corn and the Distribution Characteristics of Stomatal Morphological Index of Leaves under Drip Irrigation. Water Sav. Irrig. 2018, 8, 19–29. [Google Scholar]
  37. Kang, S.Z.; Xiong, Y.Z.; Wang, Z.Y. Distribution of hydraulic resistance and water potential in soil-plant-atmosphere continuum. J. Hydraul. Eng. 1990, 7, 1–9. [Google Scholar]
  38. O’Kelly, B.C. Accurate determination of moisture content of organic soils using the oven drying method. Dry. Technol. 2004, 22, 1767–1776. [Google Scholar] [CrossRef]
  39. Plauborg, F. Evaporation from bare soil in a temperate humid climate—measurement using micro-lysimeters and time domain reflectometry. Agric. For. Meteorol. 1995, 76, 1–17. [Google Scholar] [CrossRef]
  40. Eberbach, P.; Humphreys, E.; Kukal, S. The effect of rice straw mulch on evapotranspiration, transpiration and soil evaporation of irrigated wheat in Punjab, India. Agric. Water Manag. 2011, 98, 1847–1855. [Google Scholar]
  41. Bittelli, M. Measuring soil water potential for water management in agriculture: A review. Sustainability 2010, 2, 1226–1251. [Google Scholar] [CrossRef]
  42. Tinus, R.W. Root growth potential as an indicator of drought stress history. Tree Physiol. 1996, 16, 795–799. [Google Scholar] [CrossRef] [Green Version]
  43. AL-Darby, A.M.; Lowery, B.; Daniel, T.C. Corn leaf water potential and water use efficiency under three conservation tillage systems. Soil Tillage Res. 1987, 9, 241–254. [Google Scholar] [CrossRef]
  44. Zhang, M.; Zhang, R.Z.; Cai, L.Q. Leaf water potential of spring wheat and field pea under different tillage patterns and its relationships with environmental factors. Chin. J. Appl. Ecol. 2008, 19, 1467–1474. [Google Scholar]
  45. Salem, H.M.; Valero, C.; Muñoz, M.Á.; Rodríguez, M.G.; Silva, L.L. Short-term effects of four tillage practices on soil physical properties, soil water potential, and maize yield. Geoderma 2015, 237–238, 60–70. [Google Scholar] [CrossRef]
  46. Zhu, W.; Wang, J. Surface Mulching and Conservation of Soil Water. Res. Soil Water Conserv. 1996, 3, 141–145. [Google Scholar]
  47. Peng, Z.; Li, L.; Xie, J.; Deng, C.; Essel, E.; Wang, J.; Xie, J.; Shen, J.; Kang, C. Effects of different tillage practices on water consumption structure and water use efficiency during crop growth period in arid farmland. J. Soil Water Conserv. 2018, 32, 214–221. [Google Scholar]
  48. Wang, K.; Zhang, R.; Dong, B.; Xie, J. Effect of long-term conservation tillage on soil water regimes and leaf water potential of crops in rainfed areas of the Loess Plateau. Acta Ecol. Sin. 2014, 34, 3752–3761. [Google Scholar] [Green Version]
  49. Zhang, B.; Zhang, T.L.; Zhao, Q.G. Relationship between water potentials of red soiland crop leaves under five farming systems andtheir responses to drought stress in dry season. Acta Pedol. Sin. 1999, 36, 101–110. [Google Scholar]
  50. Li, L.; Huang, G.; Zhang, R.; Jin, X.; Li, G.; Chan, K. Effects of conservation tillage on soil water regimes in rainfed areas. Acta Ecol. Sin. 2005, 25, 2326–2332. [Google Scholar]
  51. Li, Q.; Chen, Y.; Liu, M.; Zhou, X.; Dong, B.; Yu, S. Water potential characteristics and yield of summer maize in different planting patterns. Plant Soil Environ. 2008, 54, 14–19. [Google Scholar] [Green Version]
  52. Liu, C. Study on interface processes of water cycle in soil-plant-atmosphere continuum. Acta Geogr. Sin. 1997, 4, 366–373. [Google Scholar]
  53. Zhang, M.; Li, L.; Xie, J.; Peng, Z.; Ren, J. Effects of tillage practices on root spatial distribution and yield of spring wheat and pea in the dry land farming areas of central Gansu, China. Chin. J. Appl. Ecol. 2017, 28, 3917–3925. [Google Scholar]
  54. Wang, J.B.; Yan, C.R.; Liu, E.K.; Chen, B.Q.; Zhang, H.H. Effects of long-term no-tillage with straw mulch on photosynthetic characteristics of flag leaues and dry matter accumulation and translocation of winter wheat in dryland. J. Plant Nutr. Fertil. 2015, 21, 296–305. [Google Scholar]
  55. Hou, X.; Jia, Z.; Han, Q.; Li, R.; Wang, W.; Li, Y. Effects of rotational tillage practices on soil water characteristics and crop yields in semi-arid areas of north-west China. Soil Res. 2011, 49, 625–632. [Google Scholar] [CrossRef]
  56. Wang, J.; Lin, Q.; Ni, Y.J.; Liu, Y.G.; Wang, B.J. Effect of conservation tillage on photosynthetic characteristics and yield of winter wheat in dry land. J. Triticeae Crop. 2009, 29, 480–483. [Google Scholar]
  57. Liu, N.; Yang, W.X. Photosynthetic Rate and Water Utilization of Rainfed Wheat with Plastic Mulching on the Semiarid Loess Plateau, China. Proc. Natl. Acad. Sci. India Sect. B Biol. Sci. 2019, 89, 1047–1056. [Google Scholar] [CrossRef]
  58. Jiang, X.; Yun, W.; Hou, L.; Li, Z.; Wang, X.; Guo, Z. Effects of minimum tillage and no-tillage systems on photosynthetic characteristics at late growth stages of winter wheat. Trans. Chin. Soc. Agric. Eng. 2006, 22, 66–69. [Google Scholar]
  59. Wang, X.; Huang, G.; Li, Q.; Ma, J.; Gao, Y.; Liu, B. Characteristics of the evapotranspiration and its yield performance of rainfed spring wheat and peas fileds. J. Arid Land Resour. Environ. 2010, 24, 172–177. [Google Scholar]
  60. Garofalo, P.; Rinaldi, M. Water-use efficiency of irrigated biomass sorghum in a Mediterranean environment. Span. J. Agric. Res. 2013, 11, 1153–1169. [Google Scholar] [CrossRef]
  61. Dam, R.F.; Mehdi, B.B.; Burgess, M.S.E.; Madramootoo, C.A.; Mehuys, G.R.; Callum, I.R. Soil bulk density and crop yield under eleven consecutive years of corn with different tillage and residue practices in a sandy loam soil in central Canada. Soil Tillage Res. 2005, 84, 41–53. [Google Scholar] [CrossRef]
  62. Zhang, S.; Li, P.; Yang, X.; Wang, Z.; Chen, X. Effects of tillage and plastic mulch on soil water, growth and yield of spring-sown maize. Soil Tillage Res. 2011, 112, 92–97. [Google Scholar] [CrossRef]
  63. Anikwe, M.A.N.; Mbah, C.N.; Ezeaku, P.I.; Onyia, V.N. Tillage and plastic mulch effects on soil properties and growth and yield of cocoyam (Colocasia esculenta) on an ultisol in southeastern Nigeria. Soil Tillage Res. 2007, 93, 264–272. [Google Scholar] [CrossRef]
  64. Li, X.Y.; Gong, J.D.; Gao, Q.Z.; Li, F.R. Incorporation of ridge and furrow method of rainfall harvesting with mulching for crop production under semiarid conditions. Agric. Water Manag. 2001, 50, 173–183. [Google Scholar] [CrossRef]
  65. Liu, Y.; Yang, S.; Li, S.; Chen, X.; Chen, F. Growth and development of maize (Zea mays L.) in response to different field water management practices: Resource capture and use efficiency. Agric. For. Meteorol. 2010, 150, 606–613. [Google Scholar]
  66. He, J.; Wang, Q.; Li, H.; Liu, L.; Gao, H. Effect of alternative tillage and residue cover on yield and water use efficiency in annual double cropping system in North China Plain. Soil Tillage Res. 2009, 104, 198–205. [Google Scholar]
Figure 1. Monthly total precipitation for 2016, 2017, and the 2001-2015 average at the study area.
Agronomy 09 00583 g001
Figure 2. Transpiration rate at the flowering stage of wheat in 2016 (A) and 2017 (B) and net photosynthetic rate at the flowering stage of wheat in 2016 (C) and 2017 (D) as affected by tillage practice. T, conventional tillage with no straw; NTS, no-till with straw cover; NT, no-till with no straw; TS, conventional tillage with straw incorporated; TP, conventional tillage with plastic mulch; NTP, no-till with plastic mulch. Bars with different letters indicate treatment means that are significantly different (p ≤ 0.05). Error bars denote standard errors of the means (n = 4).
Agronomy 09 00583 g002
Figure 3. Soil-leaf water transfer resistance (Rsl) at the flowering stage of wheat in 2016 (A) and 2017 (B) as affected by tillage practice for different soil layers. T, conventional tillage with no straw; NTS, no-till with straw cover; NT, no-till with no straw; TS, conventional tillage with straw incorporated; TP, conventional tillage with plastic mulch; NTP, no-till with plastic mulch. Within a year for a given soil layer, bars with different letters indicate treatment means that are significantly different (p ≤ 0.05). Error bars denote standard errors of the means (n = 4).
Agronomy 09 00583 g003
Table 1. Soil physical and water characteristics in 2001.
Soil Layer (cm)Bulk Density
(g cm−3)
Upper Limit of Soil
Drainage
(cm3 cm−3)
Lower Limit of Effective
Moisture in Wheat
(cm3 cm−3)
0–51.290.270.09
5–101.230.270.09
10–301.320.270.09
30–501.200.270.09
50–801.140.260.09
80–1101.140.270.11
110–1401.130.260.11
140–1701.120.260.12
170–2001.110.260.13
Table 2. Annual, fallow period, and growing season rainfall, drought index (DI), and soil water condition for 2016, 2017, and the 2001−2015 average a.
YearAnnual Rainfall (mm)DI for Annual RainfallAnnual Soil Water Condition bFallow Period RainfallDI for Fallow Period RainfallFallow Period Soil Water ConditionGrowing Season Rainfall (mm)DI for Growing Season RainfallGrowing Season Soil Water Condition
2016300.2−1.29Dry60.8−2.25Dry239.40.85Wet
2017361.4−0.47Dry175.4−0.35Normal186.0−0.31Normal
Average (2001–2015)396.7196.5200.2
a Annual (January through December), fallow period (January through March and August through December), and growing season (April through July); b Classified as dry, normal, and wet for different time periods for DI < −0.35, −0.35 ≤ DI ≤ 0.35, and DI > 0.35, respectively.
Table 3. Soil water potential (Mpa) as affected by tillage practice for different growth stages of wheat and soil depths (cm) in 2016 and 2017.
YearTillage Practice bSeedlingTilleringJointingFlowering
0–100–1010–300–1010–300–1010–3030–50
2016T−2.60b a−3.50a−2.54a−0.76b−0.43ab−2.95a−2.25a−2.17a
NTS−1.50a−3.30a−2.53a−0.42a−0.25ab−2.84a−2.87a−3.16a
NT−3.03b−3.00a−2.66a−0.53ab−0.20a−3.20a−3.08a−3.32a
TS−2.61b−3.36a−3.08a−0.73b−0.82b−2.32a−2.20a−3.54a
TP−1.52a−2.20a−1.65a−0.38a−0.62ab−1.89a−2.11a−3.16a
NTP−1.15a−1.92a−0.94a−0.51ab−0.25ab−2.23a−2.78a−2.66a
2017T−1.39b−1.91a−2.12a−0.76a−1.61b−5.54ab−4.84b−5.11c
NTS−0.81a−1.58a−1.59a−0.41a−1.32b−5.42ab−4.17b−3.57b
NT−1.26b−1.96a−2.05a−0.63a−1.48b−6.50b−3.82ab−3.25b
TS−0.74a−1.81a−1.75a−0.61a−1.44b−5.91b−4.54b−2.95ab
TP−0.63a−1.57a−1.54a−0.42a−0.46a−3.65a−2.38a−1.89a
NTP−0.60a−1.33a−1.37a−0.63a−0.81ab−3.86a−3.30ab−3.36b
AverageT−2.00bc−2.71a−2.33b−0.76b −1.02bc−4.24ab−3.54a−3.64a
NTS−1.16a−2.44a−2.06b−0.41a−0.79ab−4.13ab−3.52a−3.37a
NT−2.15c−2.48a−2.40b−0.58ab−0.84abc−4.85b−3.45a−3.29a
TS−1.68b−2.59a−2.42b−0.67b−1.13c−4.11ab−3.37a−3.25a
TP−1.07a−1.89a−1.60ab−0.40a−0.54a−2.77a−2.25a−2.53a
NTP−0.87a−1.63a−1.16a−0.57ab−0.53a−3.04a−3.04a−3.01a
a Within a column for a given year, means followed by different letters are significantly different (p ≤ 0.05); b T, conventional tillage with no straw; NTS, no-till with straw cover; NT, no-till with no straw; TS, conventional tillage with straw incorporated; TP, conventional tillage with plastic mulch; NTP, no-till with plastic mulch.
Table 4. Root water potential (Mpa) as affected by tillage practice for different growth stages of wheat and soil depths (cm) in 2016 and 2017.
YearTillage Practice bSeedlingTilleringJointingFlowering
0–100–1010–300–1010–300–1010–3030–50
2016T−3.06ba−5.54b−4.30a−1.45bc−1.04a−3.34a−4.69a−5.65a
NTS−1.94a−4.52ab−3.74a−0.63ab−1.71a−3.92a−4.55a−6.01a
NT−3.21b−3.04a−3.50a−0.73ab−0.85a−3.24a−4.70a−6.20a
TS−3.03b−4.44ab−3.65a−2.01c−1.17a−2.98a−4.23a−5.27a
TP−1.74a−3.70ab−3.60a−0.41a−1.79a−2.37a−4.25a−4.29a
NTP−1.55a−2.48a−2.65a−0.56a−1.22a−2.95a−4.87a−5.63a
2017T−1.55b−2.25ab−2.72b−2.95d−2.71c−8.44c−7.20c−10.77c
NTS−1.13ab−2.14ab−2.50ab−1.24ab−1.79abc−5.82ab−4.84a−4.58a
NT−1.43b−2.55b−2.70b−1.83bc−2.16c−7.02bc−6.82bc−8.05b
TS−1.26b−1.94ab−1.79a−2.31cd−1.96bc−6.06ab−6.74bc−7.88b
TP−1.24ab−2.07ab−2.40ab−0.66a−0.87a−4.24a−6.54bc−5.54a
NTP−0.73a−1.65a−2.01ab−1.60b−0.94ab−4.35a−5.75ab−4.42a
AverageT−2.31c−3.90c−3.51b−2.20c−1.87b−5.89b−5.95a−8.21b
NTS−1.53b−3.33bc−3.12ab−0.94b−1.75ab−4.87ab−4.70a−5.30a
NT−2.32c−2.80ab−3.10ab−1.28b−1.51ab−5.13ab−5.76a−7.13b
TS−2.15c−3.19bc−2.72ab−2.16c−1.57ab−4.52ab−5.49a−6.58ab
TP−1.49ab−2.89ab−3.00ab−0.54a−1.33ab−3.30a−5.40a−4.92a
NTP−1.14b−2.06a−2.33a−1.08b−1.08a−3.65a−5.31a−5.03a
a Within a column for a given year, means followed by different letters are significantly different (p ≤ 0.05); b T, conventional tillage with no straw; NTS, no-till with straw cover; NT, no-till with no straw; TS, conventional tillage with straw incorporated; TP, conventional tillage with plastic mulch; NTP, no-till with plastic mulch.
Table 5. Leaf water potential (Mpa) as affected by tillage practice for different growth stages of wheat in 2016 and 2017.
YearTillage Practice bSeedlingTilleringJointingFlowering
2016T−7.19c a−7.08abc−5.27a−9.41b
NTS−4.49ab−5.73ab−3.41a−8.20ab
NT−6.77bc−7.99c−4.32a−9.63b
TS−5.48abc−7.39bc−4.01a−8.60b
TP−4.39a−5.49ab−3.48a−5.87a
NTP−3.84a−4.99a−3.23a−7.03ab
2017T−5.22c−3.53b−3.13b−9.36b
NTS−3.30b−2.64a−2.64ab−8.69ab
NT−5.03c−3.05ab−3.19b−8.64ab
TS−4.04b−2.67a−2.77ab−9.33ab
TP−2.11a−2.56a−2.23a−7.99a
NTP−3.35b−2.47a−2.16a−8.74ab
AverageT−6.21c−5.31b−4.20c−9.39b
NTS−3.90ab−4.19a−3.02ab−8.44ab
NT−5.90c−5.52b−3.75bc−9.14b
TS−4.77b−5.03b−3.39abc−8.96b
TP−3.25a−4.02a−2.86ab−6.93a
NTP−3.59a−3.73a−2.70a−7.89ab
a Within a column for a given year, means followed by different letters are significantly different (p ≤ 0.05); b T, conventional tillage with no straw; NTS, no-till with straw cover; NT, no-till with no straw; TS, conventional tillage with straw incorporated; TP, conventional tillage with plastic mulch; NTP, no-till with plastic mulch.
Table 6. Soil-root water potential gradient (Mpa) as affected by tillage practice for different growth stages of wheat and soil depths (cm) in 2016 and 2017.
YearTillage Practice bSeedlingTilleringJointingFlowering
0–100–1010–300–1010–300–1010–3030–50
2016T0.46a a2.04a1.77a0.70ab0.61a0.39ab2.45a3.47a
NTS0.43a1.22a1.21a0.21b1.46a1.08a1.68a2.84a
NT0.18a0.05a0.84a0.20b0.66a0.04b1.63a2.87a
TS0.42a1.08a0.57a1.28a0.35a0.66ab2.03a1.73a
TP0.22a1.50a1.95a0.03b1.17a0.48ab2.13a1.13a
NTP0.41a0.55a1.71a0.06b0.97a0.73ab2.09a2.97a
2017T0.15c0.33a0.60a2.19a1.09a2.91a2.36ab5.67a
NTS0.32bc0.56a0.90a0.83cd0.46a0.40b0.67b1.01b
NT0.16c0.59a0.65a1.20bc0.68a0.52b3.00ab4.81a
TS0.53ab0.13a0.04a1.70ab0.52a0.15b2.20ab4.93a
TP0.61a0.50a0.86a0.24d0.41a0.59b4.16a3.65a
NTP0.13c0.32a0.64a0.97bcd0.13a0.50b2.45ab1.06b
AverageT0.31ab1.19a1.18a1.44a0.85a1.65a2.41a4.57a
NTS0.38ab0.89a1.06a0.52ab0.96a0.74b1.17a1.93c
NT0.17b0.32a0.75ab0.70b0.67a0.28b2.32a3.84ab
TS0.47a0.61a0.31b1.49a0.44a0.41b2.11a3.33abc
TP0.42ab1.00a1.40a0.14c0.79a0.53b3.15a2.39bc
NTP0.27ab0.44a1.17a0.52bc0.55a0.61b2.27a2.01c
a Within a column for a given year, means followed by different letters are significantly different (p ≤ 0.05); b T, conventional tillage with no straw; NTS, no-till with straw cover; NT, no-till with no straw; TS, conventional tillage with straw incorporated; TP, conventional tillage with plastic mulch; NTP, no-till with plastic mulch.
Table 7. Root-leaf water potential gradient (Mpa) as affected by tillage practice for different growth stages of wheat and soil depths (cm) in 2016 and 2017.
YearTillage Practice bSeedlingTilleringJointingFlowering
0–100–1010–300–1010–300–1010–3030–50
2016T4.13a a1.54b2.78a3.82a4.23a6.07a4.71a3.76a
NTS2.56a1.21b1.99a2.78a1.70b4.27a3.64a2.19a
NT3.56a4.94a4.49a3.58a3.46ab6.39a4.93a3.43a
TS2.45a2.95ab3.74a2.00a2.84ab5.62a4.37a3.33a
TP2.66a1.78b1.88a3.07a1.69b3.50a1.62a1.57a
NTP2.28a2.51ab2.34a2.67a2.01b4.07a2.16a1.40a
2017T3.67a1.29a0.81ab0.18b0.42b0.92d2.16ab1.54c
NTS2.17b0.50a0.14c1.40a0.85ab2.87bc3.85a3.36ab
NT3.60a0.50a0.35abc1.36a1.03ab1.63cd1.82ab1.72c
TS2.78ab0.72a0.87a0.47b0.81ab3.27ab2.58ab2.93ab
TP0.87c0.49a0.16bc1.57a1.36a3.76ab1.45b2.60bc
NTP2.62ab0.82a0.46abc0.56b1.23ab4.39a2.99ab3.69a
AverageT3.90a1.41b1.80ab2.00ab2.33a3.49a3.44a4.71a
NTS2.36bc0.85b1.07b2.09ab1.28b3.57a3.75a1.60c
NT3.58ab2.72a2.42a2.47a2.25a4.01a3.37a4.12ab
TS2.61bc1.84ab2.31a1.23b1.82ab4.44a3.48a4.13ab
TP1.77c1.14b1.02b2.32a1.53ab3.63a1.54a2.61bc
NTP2.45bc1.67ab1.40ab1.61ab1.62ab4.23a2.58a1.23c
a Within a column for a given year, means followed by different letters are significantly different (p ≤ 0.05); b T, conventional tillage with no straw; NTS, no-till with straw cover; NT, no-till with no straw; TS, conventional tillage with straw incorporated; TP, conventional tillage with plastic mulch; NTP, no-till with plastic mulch.
Table 8. Soil-leaf water potential gradient (Mpa) as affected by tillage practice for different growth stages of wheat and soil depths (cm) in 2016 and 2017.
YearTillage Practice bSeedlingTilleringJointingFlowering
0–100–1010–300–1010–300–1010–3030–50
2016T4.59a a3.58a4.55a4.52a4.84a6.46a7.16a7.23a
NTS2.99a2.43a3.20a2.99a3.15a5.36a5.32ab5.03ab
NT3.74a4.99a5.33a3.79a4.12a6.43a6.55ab6.31ab
TS2.87a4.04a4.31a3.28a3.18a6.28a6.40ab5.06ab
TP2.88a3.28a3.83a3.10a2.86a3.98a3.75b2.70b
NTP2.69a3.06a4.05a2.72a2.98a4.80a4.25b4.36ab
2017T3.83a1.62a1.41a2.37a1.52a3.83ab4.52a11.33a
NTS2.48bc1.05a1.04a2.23a1.32a3.27bc4.52a2.02b
NT3.76a1.09a1.00a2.56a1.70a2.14c4.82a9.61a
TS3.31ab0.85a0.92a2.16a1.33a3.42bc4.78a9.86a
TP1.48c0.99a1.01a1.81a1.77a4.34ab5.61a7.30a
NTP2.75ab1.14a1.10a1.53a1.36a4.89a5.44a2.11b
AverageT4.21a2.60a2.98a3.44a3.18a5.14a5.84a9.28a
NTS2.74bc1.74a2.12a2.61ab2.24a4.31a4.92a3.53c
NT3.75ab3.04a3.16a3.17ab2.91a4.29a5.69a7.96a
TS3.09abc2.45a2.62a2.72ab2.26a4.85a5.59a7.46ab
TP2.18c2.14a2.42a2.45ab2.32a4.16a4.68a5.00bc
NTP2.72bc2.10a2.57a2.13b2.17a4.84a4.85a3.24c
a Within a column for a given year, means followed by different letters are significantly different (p ≤ 0.05); b T, conventional tillage with no straw; NTS, no-till with straw cover; NT, no-till with no straw; TS, conventional tillage with straw incorporated; TP, conventional tillage with plastic mulch; NTP, no-till with plastic mulch.
Table 9. Transpiration at the growing season, biomass and grain yields, and water use efficiency of grain yield and biomass yield (WUEb and WUEg, respectively) of wheat as affected by tillage practice in 2016 and 2017.
YearTillage Practice bTranspiration (mm)Biomass Yield
(kg ha−1)
WUEb
(kg ha−1 mm−1)
Grain Yield
(kg ha−1)
WUEg
(kg ha−1 mm−1)
2016T176.4c a4107d15.38bc1430c5.36bc
NTS209.1b4798b16.73ab1859a6.48a
NT177.3c3916d14.75c1216d4.50c
TS171.1c4367c17.08a1560bc6.13ab
TP214.5b4669b18.08a1686ab6.55a
NTP252.0a5150a17.25a1839a6.15ab
2017T58.7c2498bc13.77b
NTS120.2b2994b13.09bc
NT68.6c2090c10.70c
TS84.7c2369bc11.11bc
TP170.0a4310a18.23a
NTP161.4a4074a18.29a
AverageT117.58c3303c14.58b1460bc5.48bc
NTS164.68b3896b14.91b1862a6.78a
NT122.96c3003c12.73c1416c5.56c
TS127.88c3368c14.10bc1647b6.28b
TP192.26a4489a18.16a1776ab6.90ab
NTP206.70a4612a17.77a1815ab6.78ab
a Within a column for a given year, means followed by different letters are significantly different (p ≤ 0.05); b T, conventional tillage with no straw; NTS, no-till with straw cover; NT, no-till with no straw; TS, conventional tillage with straw incorporated; TP, conventional tillage with plastic mulch; NTP, no-till with plastic mulch.
Table 10. Pearson’s correlation coefficient for correlations of water potential indexes with transpiration, biomass and grain yields, and water use efficiency of biomass and grain yields (WUEb and WUEg, respectively) across years for different growth stages of wheat and soil layers.
Growth StageSoil Depth (cm)Water Potential Index bTranspirationBiomass YieldWUEbGrain YieldWUEg
Seeding0–10S0.888** a0.854**0.757**0.839**0.646**
R0.892**0.834**0.738**0.767**0.531*
L0.839**0.861**0.705**0.826**0.732**
S-R0.1040.1710.1580.3330.443
R-L−0.639**−0.699**−0.543*−0.689**−0.689**
S-L−0.654**−0.704**−0.543*−0.665**−0.645**
Tillering0–10S0.615**0.480*0.4610.183−0.043
R0.649**0.561*0.3760.3310.093
L0.875**0.844**0.764**0.783**0.547*
S-R−0.073−0.1280.090−0.203−0.177
R-L−0.282−0.330−0.414−0.471*−0.450
S-L−0.369−0.463−0.395−0.676**−0.634**
10–30S0.769**0.686**0.657**0.551*0.327
R0.511*0.3570.2780.3350.092
S-R0.370.4420.497*0.3010.300
R-L−0.505*−0.588*−0.566*−0.543*−0.485*
S-L−0.325−0.370−0.299−0.428−0.356
Jointing0−10S0.490*0.510*0.3710.4420.483*
R0.687**0.703**0.542*0.4280.356
L0.765**0.705**0.4610.614**0.342
S-R−0.681**−0.694**−0.542*−0.383−0.285
R-L−0.131−0.0490.054−0.234−0.008
S-L−0.660**−0.595**−0.380−0.518*−0.233
10–30S0.765**0.735**0.644**0.4650.348
R0.551*0.581*0.3850.3340.121
S-R−0.033−0.0850.053−0.0190.118
R-L−0.590**−0.489*−0.315−0.557*−0.36
S-L−0.526*−0.472*−0.236−0.488*−0.233
Flowering0–10S0.664**0.664**0.786**0.470*0.407
R0.649**0.607**0.613**0.4550.419
L0.722**0.730**0.721**0.530*0.505*
S-R−0.235−0.1460.058−0.156−0.189
R-L−0.021−0.115−0.089−0.057−0.082
S-L−0.243−0.258−0.038−0.205−0.262
10–30S0.489*0.503*0.634**0.1690.278
R0.2890.2390.1240.248−0.006
S-R0.0930.1470.338−0.0960.201
R-L−0.444−0.486*−0.558*−0.301−0.455
S-L−0.554*−0.552*−0.428−0.566*−0.440
30–50S0.4270.3280.4560.2430.399
R0.807**0.748**0.585*0.642**0.471*
S-R−0.753**−0.731**−0.475*−0.647**−0.367
R-L−0.775**−0.771**−0.559*−0.781**−0.528*
S-L−0.803**−0.790**−0.547*−0.757**−0.479*
a Correlation coefficients followed by * and ** are significant at P ≤ 0.05 and 0.01, respectively; b S, soil water potential; R, root water potential; L, leaf water potential; S-R, soil-root water potential gradient; R-L, root-leaf water potential gradient; S-L, soil-leaf water potential gradient.

