Article

Effects of Irrigation Amount and Irrigation Frequency on Flue-Cured Tobacco Evapotranspiration and Water Use Efficiency Based on Three-Year Field Drip-Irrigated Experiments

1
College of Agricultural Engineering, Hohai University, Nanjing 210000, China
2
Key Laboratory of Efficient Irrigation-Drainage and Agricultural Soil-Water Environment in Southern China, Nanjing 210000, China
3
Nanjing Vegetable and Flower Research Institute, Nanjing 210000, China
4
Guizhou Tobacco Science Research Institute, Guizhou 550000, China
*
Authors to whom correspondence should be addressed.
Agronomy 2019, 9(10), 624; https://doi.org/10.3390/agronomy9100624
Submission received: 18 September 2019 / Revised: 26 September 2019 / Accepted: 8 October 2019 / Published: 10 October 2019
(This article belongs to the Special Issue Model Application for Sustainable Agricultural Water)

Abstract

:
This study aimed to determine the effect of irrigation amount and irrigation frequency on drip-irrigated flue-cured tobacco evapotranspiration (ETa), yield, and water use efficiency. Four irrigation treatment levels were imposed: 100% IRT (fully irrigated treatment, no stress), 85% IRT, 70% IRT, RFT (rainfed treatment), and high, medium, and low irrigation frequencies were set. The relationship between irrigation volume and yield is a quadratic curve. The evapotranspiration had a positive relationship with the irrigation amount. The yield of flue-cured tobacco was the highest in 2016 (wet year), and the corresponding ETa was the smallest. The irrigation water use efficiency (IWUE) in the driest year, 2017, was lower than IWUE in the wet years 2015 and 2016, and the crop water use efficiency (CWUE) had similar results for the three years. IWUE increased with irrigation amount. The effect of irrigation frequency on CWUE was not significant. The CWUE had a positive relationship with yield. No significant differences due to irrigation frequency were found for yield.

1. Introduction

In some areas of China, flue-cured tobacco is an important cash crop. China’s flue-cured tobacco planting area is about 1,010,937 hectares and accounts for about 50% of worldwide total tobacco production [1]. Due to the large population and climate change, China’s water resources are extremely scarce [2,3]. Well-managed irrigation can improve water production efficiency. In terms of enhancing water use efficiency and reducing soil evaporation, drip irrigation (subsurface and on surface) has been shown to be more effective than other forms of irrigation [4], because it is easy to control the irrigation flow rate, which leads to a smaller wetting root zone, smaller runoff, and less deep percolation. Studies on more than 30 crops have shown that yield under drip irrigation is higher than that under other irrigation methods, and less water is required in most instances [5]. The drip irrigation amount and frequency are critical for plant growth, yield, and water use efficiency (WUE) [6,7]. Some studies have suggested that regulating the irrigation schedule would improve water use efficiency [8,9]. The impact of irrigation amount on crop yield and crop water use efficiency (CWUE) depend on crop characteristics [10,11]. According to Moore et al. [12], deficit irrigation and over irrigation can significantly reduce both tobacco quality and yield. Irrigation frequency is one of the important factors in irrigation management, especially for porous soils [13]. Studies have shown that increasing the frequency of irrigation can help plant roots better absorb water in the soil, which is beneficial for increasing the yield of crops and the CWUE [14]. Hunsaker et al.’s [15] research on cotton and lint showed that yields were 15 and 21% lower under low-frequency irrigation treatments than that under high irrigation frequency; the treatment under low frequency was not as effective in increasing crop productivity as the high frequency treatment, although evapotranspiration under low-frequency irrigation was lower than that under high frequency irrigation. Cao et al.’s [16] research on cucumber showed that when the total amount of irrigation is constant, a small amount of multiple irrigations can distribute the root system to the wet layer and improve water use efficiency. El-Hendawy et al. [17] reported that the correlation between corn yield and irrigation frequency is a quadratic function, and the CWUE increases as the irrigation frequency increases. Zegada-Lizarazu et al. [18] reported that increasing the frequency of irrigation leads to an increase in the root area, while low irrigation frequency leads to an increase in root depth. For different crops, different irrigation frequencies may lead to an increase or decrease in yield. Raviv et al. [19] reported that a high irrigation frequency can maintain a high water content in the crop root zone for a long time, reducing the nutrient loss in the root zone, and reducing groundwater pollution. Uçan et al. [20] reported that the effect of irrigation on sesame yield is significant, while the frequency of irrigation has no effect on sesame yield. El-Hendawy and Schmidhalter [21] reported that maize yield and CWUE increase with increasing irrigation frequency and irrigation water volume. Howell [22] suggested that irrigation frequency has no significant effect on maize yield. Flue-cured tobacco is a drought-tolerant solanaceous crop. The research on the irrigation of flue-cured tobacco mainly focuses on water distribution during the growth period. There is not much research on the yield and water use efficiency of flue-cured tobacco with irrigation amount and irrigation frequency. The objectives of this study were to evaluate the effects of surface drip irrigation amount and irrigation frequency on flue-cured tobacco yield and CWUE.

2. Materials and Methods

2.1. Experiment Site

The weather data was obtained from the National Meteorological Information Center of China [23]. The experiment was conducted in the 2015 to 2017 growing seasons at the Nanjing Vegetable and Flower Research Institute (31°43′ N, 118°46′ E). Nanjing has a subtropical monsoon climate with abundant rainfall. The four seasons are distinct. The annual average temperature is 15.4 °C. The annual extreme temperature is 39.7 °C and the lowest is −13.1 °C. The annual average precipitation is 1106 mm. The soil at the experimental site was continuously used as a tobacco planting soil for three years, and the texture of the soil is clay loam. The detailed characteristics of the experimental soil are shown in Table 1.

2.2. Experimental Design

K-326 tobacco cultivar was used in the experiment. The detailed agronomic management practices are shown in Table 2. The amount of irrigation was calculated separately for each treatment. Table 3 shows the irrigation amount and irrigation frequency setting. Four irrigation treatment levels were designed, 100% IRT (full irrigation treatment), 85% IRT, 75% IRT, and RFT (rainfed treatment). The available soil water in the top 0.5 m profile was kept at approximately 90%, 75%, and 60% for 100% IRT, 85% IRT, and 75% IRT, respectively. Each irrigation treatment level had three irrigation frequencies—low, medium, and high. The frequencies for low, medium, and high per week were one to two times, two to three times, and daily, respectively. The low frequency irrigation treatment in this study represented the conditions in which the plant was irrigated when soil water depletion was about 45% of the total available water to avoid water stress. Soil moisture was monitored with the online moisture monitor (Qingdao Juchuang Environmental Protection Equipment Co., Ltd. Qingdao, China) on an hourly basis. The average weekly soil moisture content under the high, medium, and low irrigation frequencies was the same under the same irrigation level. The irrigation time depended on the average weekly soil moisture content unless the precipitation exceeded the crop water requirement. The planting row spacing was 1 m, and the vine spacing was 0.8 m. There was a total of 12 treatments. The experimental design was random with three replications. In the experiment, we used manual weeding to avoid the impact of herbicides on yield. The other management measures for all treatments were the same. The drip irrigation belt was installed in 2015. The drip heads were installed at a depth of 0.10 m and a distance of 0.15 m from the root of the flue-cured tobacco plant. The actual irrigation amount is shown in Table 3.

2.3. Tobacco Leaf Yield

When five to six top leaves of the plant were fully ripe, the leaves of each plant were collected individually. All leaves were dried in a forced-air oven at 60 °C. Finally, they were weighted to determine the dry weight.

2.4. Seasonal Evapotranspiration Calculation

Seasonal actual tobacco evapotranspiration (ETa) was calculated using the general water balance equation:
ETa = P + I + Eg Δ S Rg D
where ∆S is the amount of soil water storage during the growth period of flue-cured tobacco (mm), P is effective precipitation during the growth period of flue-cured tobacco (mm), I is the amount of irrigation during the growth period of flue-cured tobacco (mm), Eg is groundwater recharge (mm), Rg is surface runoff (mm), D is deep percolation (mm). Effective precipitation was calculated according to Hou et al. [24]. Deep percolation was calculated using the lysimeter method (Beijing Time Domain Technology Co., Ltd. LYS40 micro lysimeter, Beijing, China). The water-table depth was about 1 m at the experimental site, and the depth of the root distribution of flue-cured tobacco was 0.3–0.5 m, assuming the upflow and Eg was negligible.

2.5. Water Use Efficiency (CWUE) Calculation

CWUE = Y/Eta
The unit of CWUE is kg m−3, and Y is tobacco dry leaves yield (kg ha−1).

2.6. Irrigation Water Use Efficiency (IWUE) Calculation

IWUE = Y/Irrigation amount
The unit of IWUE is kg m−3.

2.7. Statistical Analyses

Fisher’s protected least significant differences (LSD) at the 5% level of probability were used to identify potential significant differences in tobacco leaves yield between treatments. Data were statistically analysed in software SPSS Statistics 22.0 (Analytical Software, Tallahassee, FL, USA).

3. Results

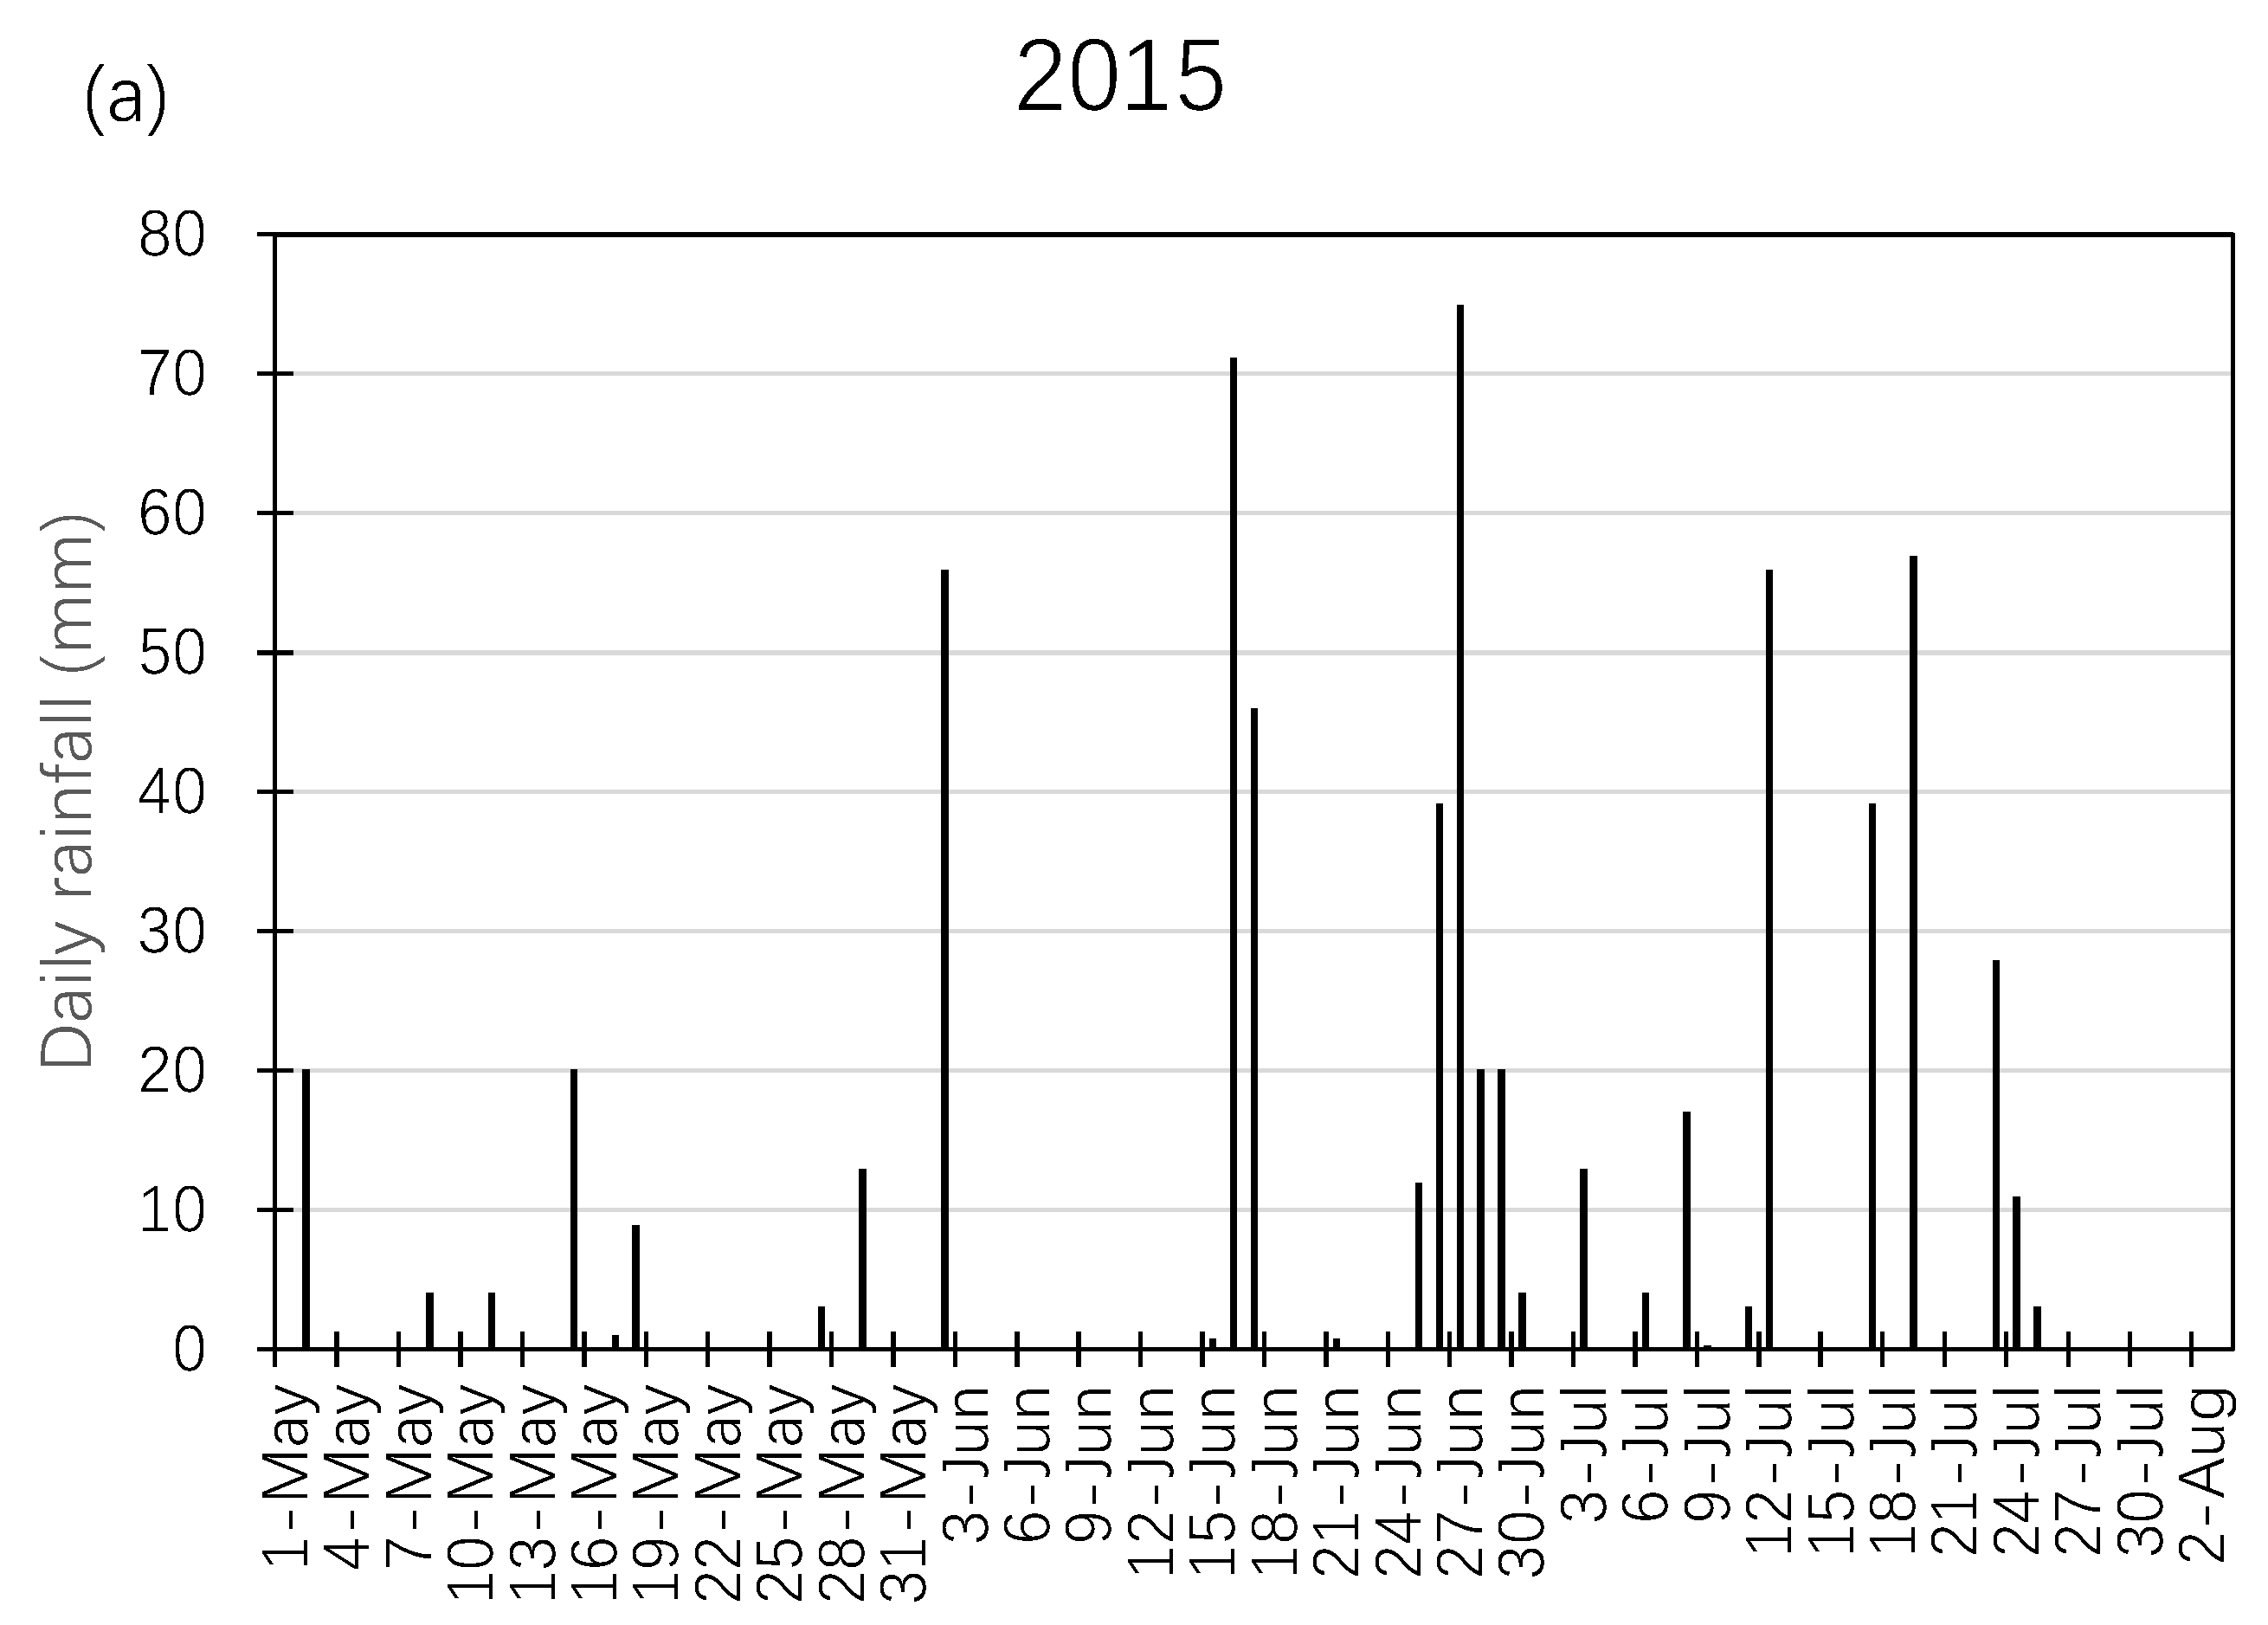
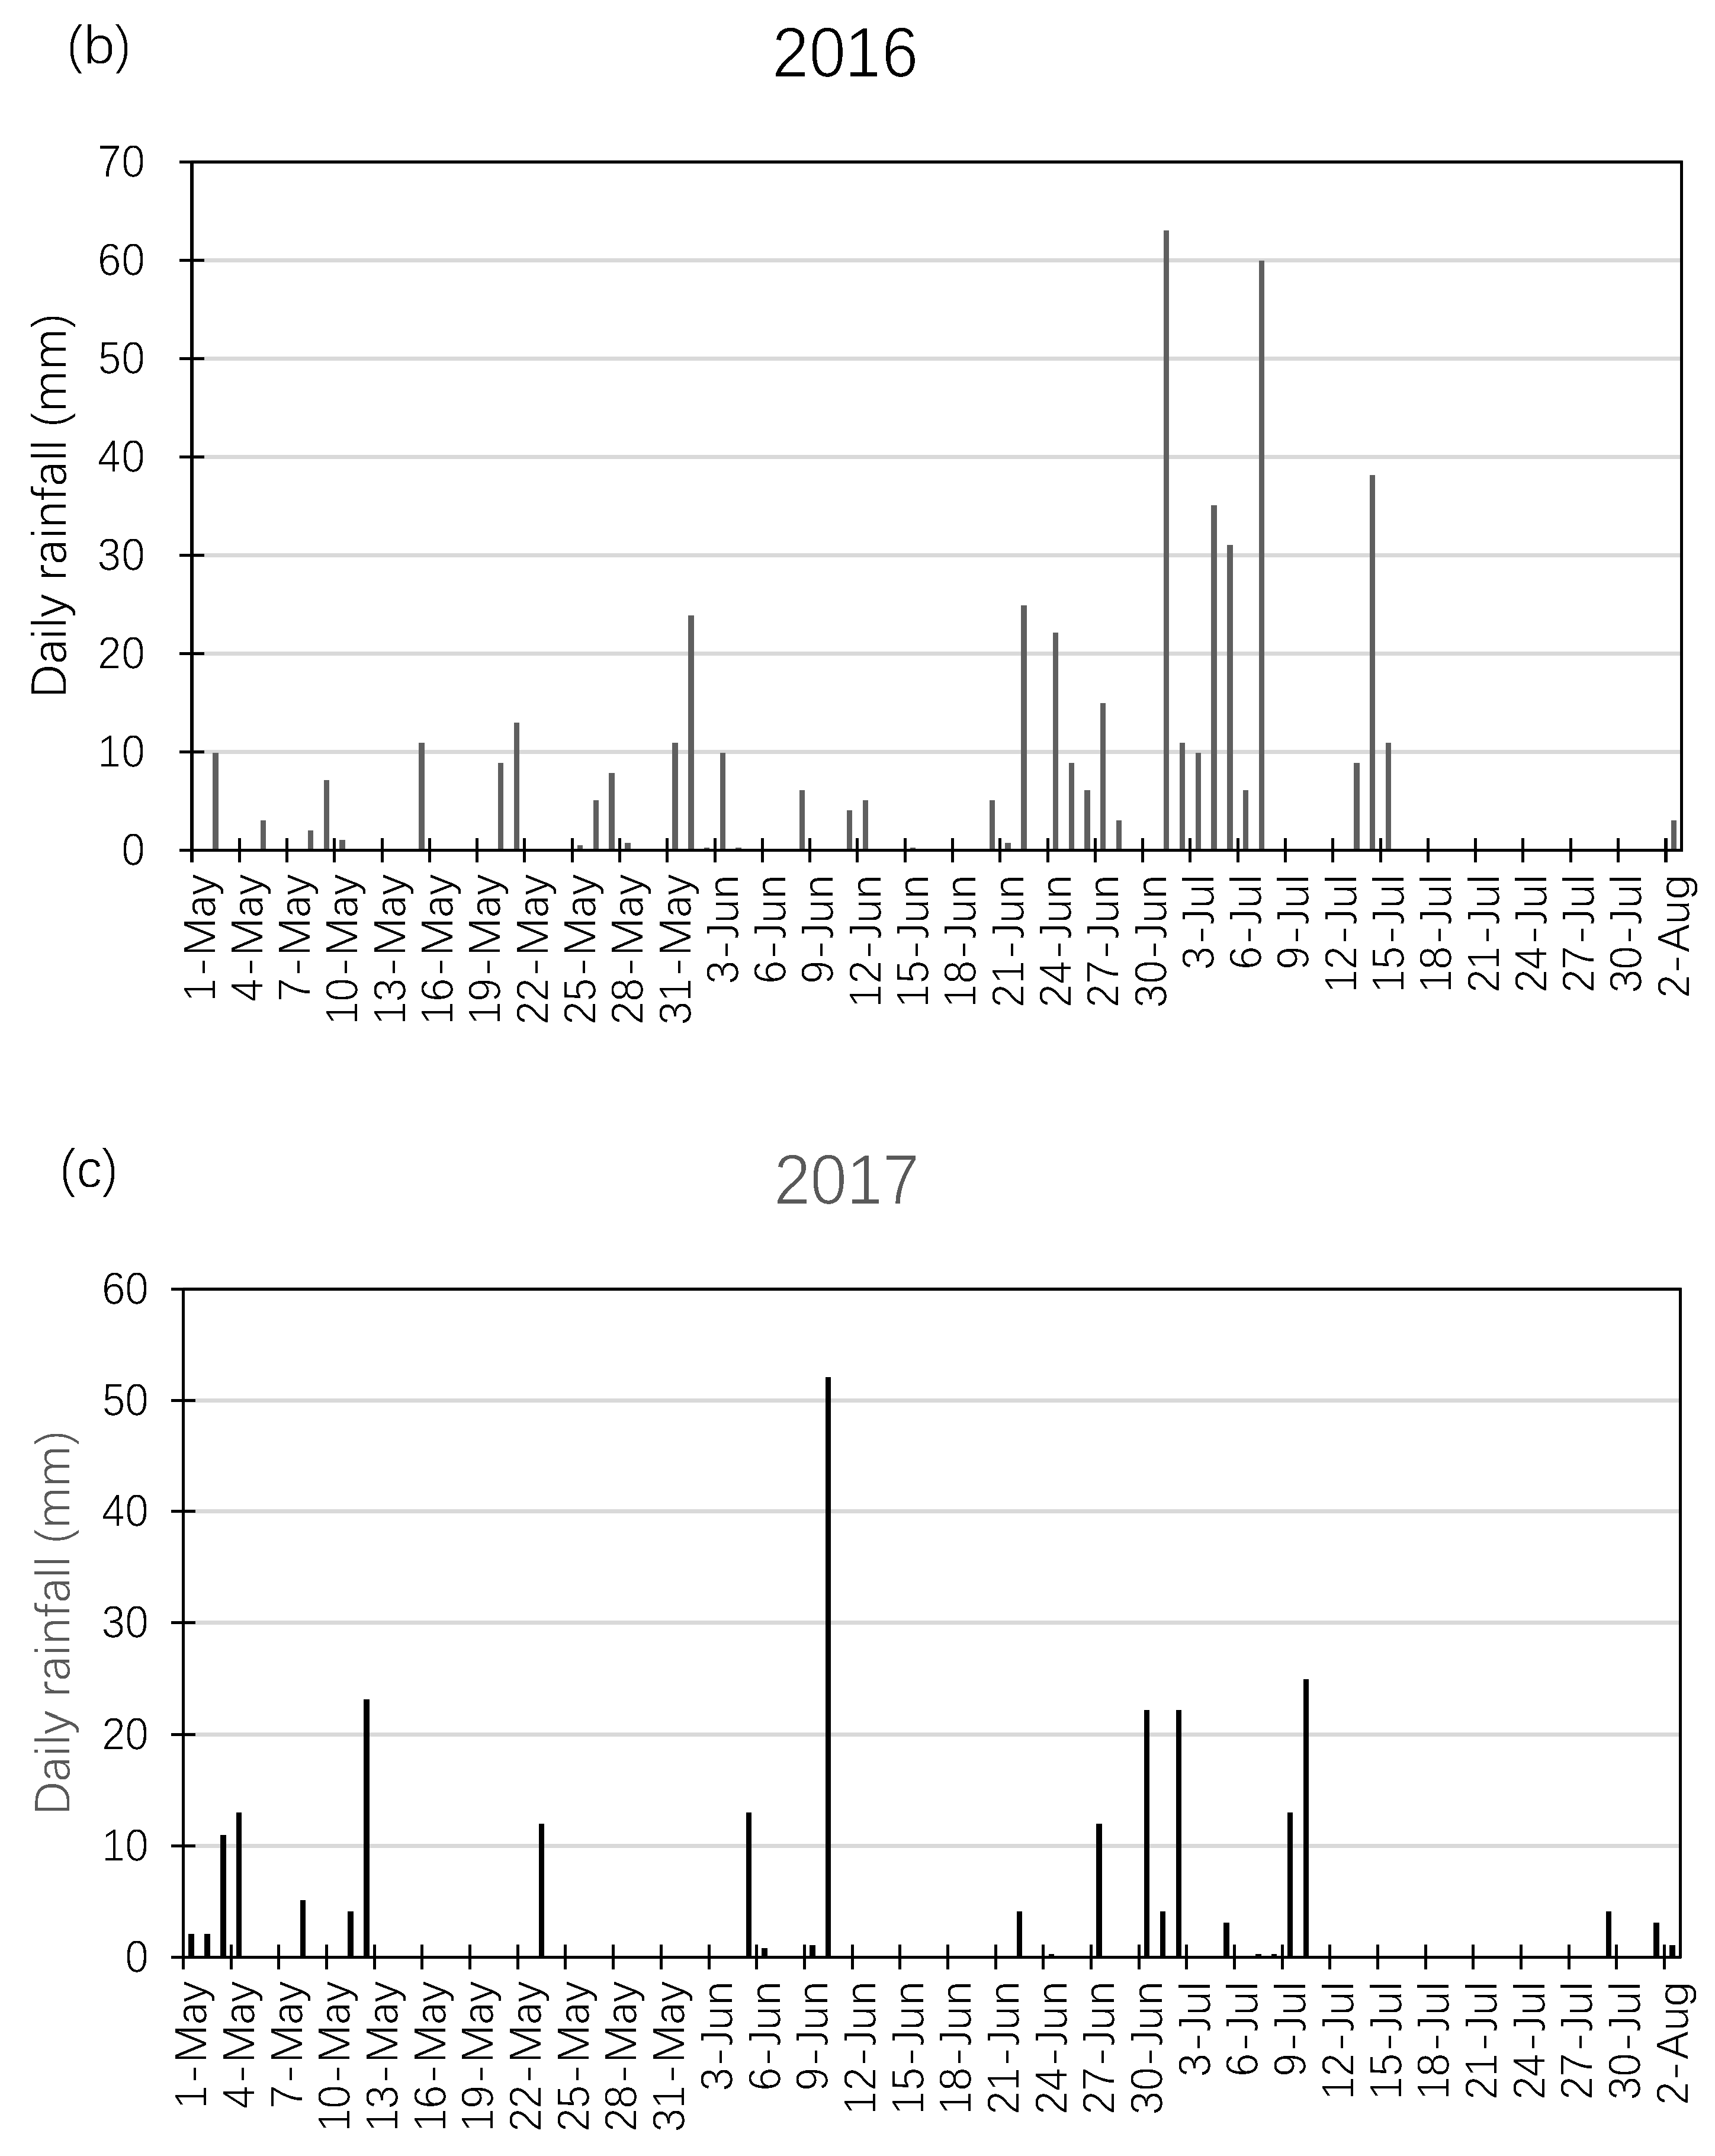
3.1. Weather Conditions in the Experimental Area

A summary of monthly measured weather variables for the 2015, 2016, and 2017 growing seasons for the experimental site is reported in Table 4. On average, May had the lowest daily temperature of 22 °C for all growing seasons and the lowest daily average temperature was 17 °C, 16 °C, and 18 °C for the 2015, 2016, and 2017 growing seasons, respectively. On average, August had the highest daily temperature of 29 °C for all growing seasons and the highest daily average temperature was 32 °C, 34 °C, and 32 °C for the 2015, 2016, and 2017 growing seasons, respectively. The growing season accumulated temperatures were 3056 °C, 3153 °C, and 3288 °C for 2015, 2016, and 2017. May had the lowest minimum relative humidity, and August had the highest relative humidity. The 2017 and 2016 growing seasons were windier than 2015. Seasonal average maximum wind speed was 21 m s−1, 31 m s−1, 33 m s−1 for the 2015, 2016, and 2017 growing seasons, respectively. Substantial interannual variability was observed in seasonal rainfall amount and distribution (Figure 1).
On average, May had the lowest monthly rainfall of 76 mm for all growing seasons and the lowest monthly average rainfall was 74 mm, 81 mm, and 72 mm for the 2015, 2016, and 2017 growing seasons, respectively. On average, June had the highest monthly rainfall of 195 mm for all growing seasons and the highest monthly average rainfall was 345 mm, 136 mm, and 105 mm for the 2015, 2016, and 2017 growing seasons, respectively. The growing duration rainfall was 252 mm in 2017, significantly less than that in 2015 and 2016. The seasonal rainfall in 2017 was 49% lower than that in 2015 and 30% less than that in 2016. Therefore, 2017 was the driest year and 2015 was the wettest year during the experiment duration. Irrigation events occurred between 7 May and 20 July in 2015, 11 May and 23 July in 2016, and 5 May and 27 July in 2017. The accumulated temperature in 2017 was higher than that in 2015 and 2016, and the rainfall was lower than that in 2015 and 2016. The lower rainfall coupled with higher wind speed and accumulated temperature in 2017 necessitated a higher irrigation water demand to meet the evapotranspiration requirement as compared to 2016 and 2015.

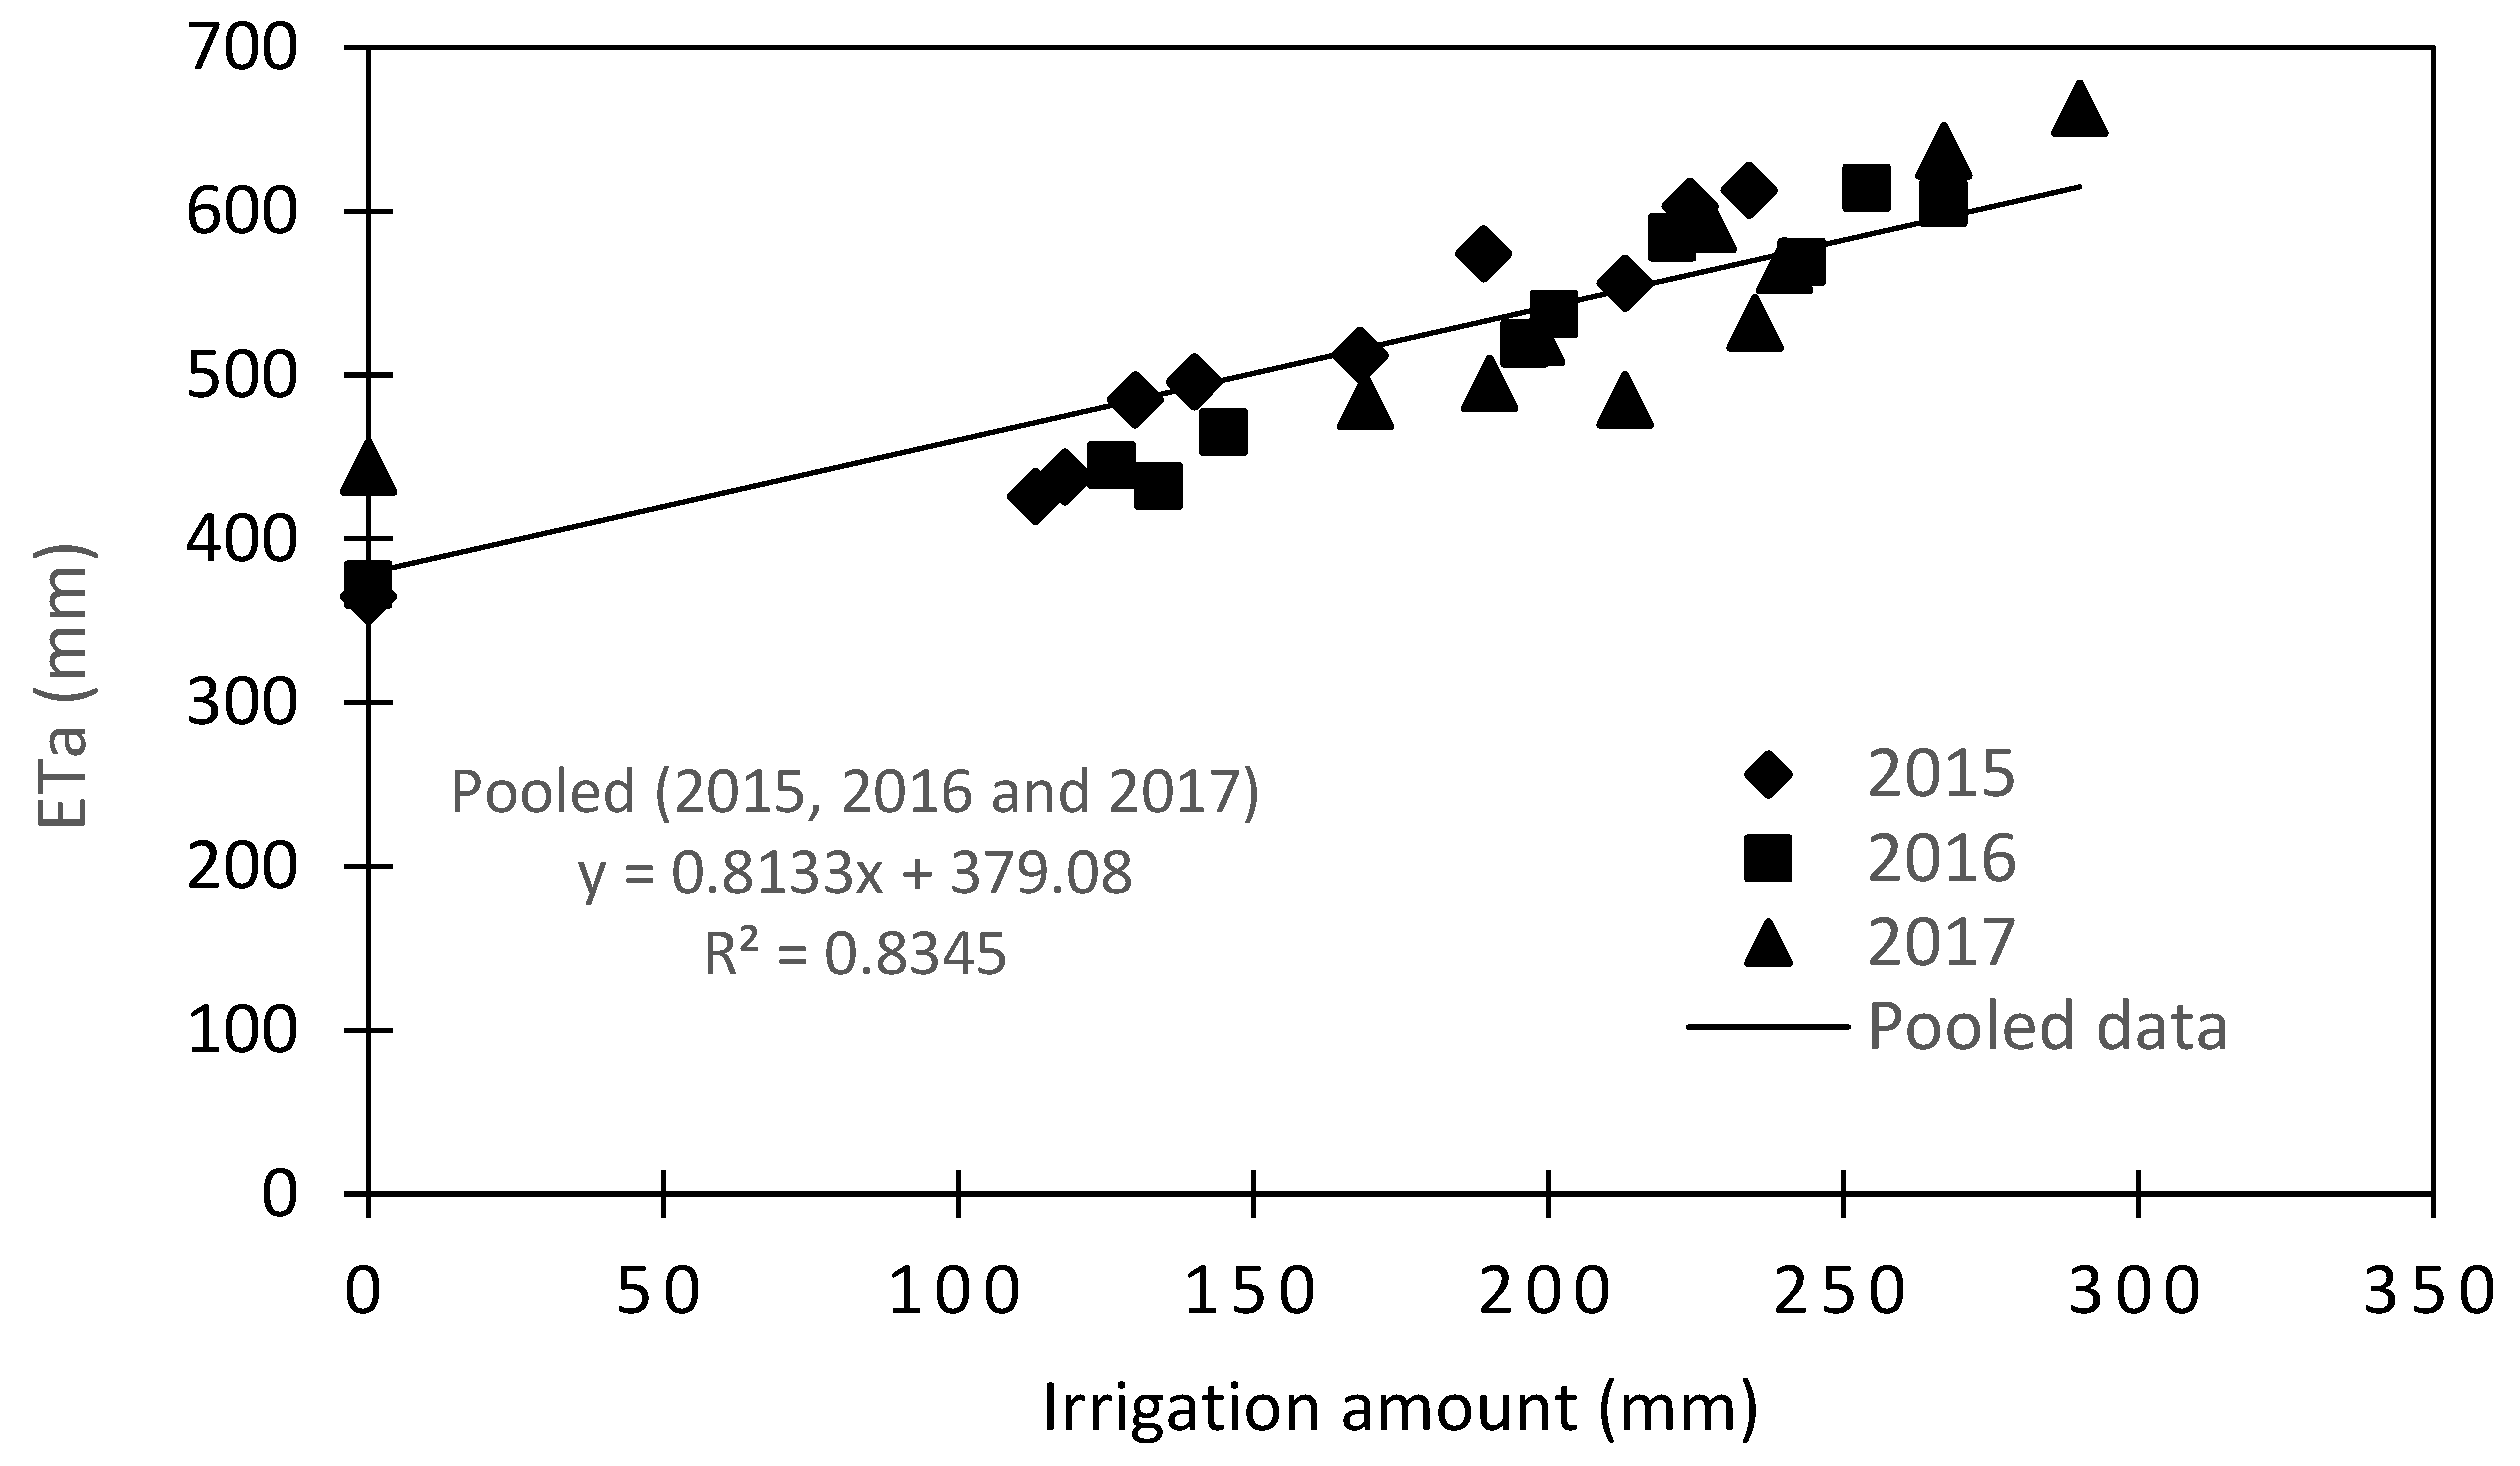
3.2. Effect of Irrigation Rate and Frequency on ETa

As can be seen in Table 3, the minimum irrigation amount was in 2015 (the wettest year), and the highest irrigation amount water was in 2017 (the driest year). The irrigation amount was the highest under high irrigation frequencies, and lowest under low irrigation frequencies.
Irrigation water demand varies with irrigation frequency and irrigation level in different years. The total growing season rainfall was 783 mm, 564 mm, and 397 mm for 2015, 2016, and 2017, respectively. Irrigation amounts ranged from 113 to 234 mm, 126 to 267 mm, and 169 to 290 mm in 2015, 2016, and 2017, respectively (Table 3). The ETa in the dry year was higher than that in a wet year, which implies the dry year requires more irrigation water to meet the flue-cured tobacco ETa than a wet year. It can be seen in Table 3 that the higher the irrigation frequency, the greater the irrigation water requirement under the same year. The ETa was highest under the high irrigation frequency. The relationship between irrigation amount and flue-cured tobacco ETa is presented for pooled 2015, 2016, and 2017 growing season data in Figure 2. The ETa was the smallest in the year of 2015, with the largest rainfall and lowest irrigation amount. The ETa ranged from 389 to 613 mm, 404 to 614 mm, and 446 to 663 mm in 2015, 2016, and 2017, respectively (Table 5). RFT treatment was the smallest ETa in all treatments. ANOVA was used to analyze the effect of irrigation frequency on ETa in 2015, 2016, and 2017 (p > 0.05).
The results of this study, in line with previous studies, show that ETa increase is consistent with irrigation [25,26]. Aka [27] also reported that an increase in surface irrigation water adds to the amount of evaporation much more than runoff and leakage.

3.3. Effect of Irrigation Rate and Frequency on Flue-Cured Tobacco Yield

For different treatments, the flue-cured tobacco yield ranged from 1136 to 2306 kg ha−1, 1302 to 2248 kg ha−1, and 832 to 1859 kg ha−1 in 2015, 2016, and 2017, respectively (Table 6). The wettest year had the highest yield.
The interannual variation in yield under RFT treatment was most significant. The uneven distribution of rainfall amount and rainfall time exacerbated the instability of RFT treated yield. The RFT treatment reached a maximum yield of 1428 kg ha−1 in 2015. The flue-cured tobacco yield had a quadratic relationship with irrigation amount, where yield increased with irrigation amount from RFT to 100% IRT. One-way ANOVA results showed that there were non-significant differences in low, medium, and high frequencies. According to the data of 2015, 2016, and 2017, there were significant difference in yield between RFT and 70% IRT treatments (p = 0.0001), and between 70% IRT and 100% IRT treatments (p = 0.004), while there were non-significant difference in yield between 70% IRT and 85% IRT treatments (p = 0.335), and between 85% IRT and 100% IRT treatments (p = 0.051). Compared to 100% IRT treatment, 85% IRT treatment reduced yield by 0.04% to 24.33%, 75% of IRT treatment decreased by 8.14% to 30.53%, and RFT treatment decreased by 38.07% to 52.43%.

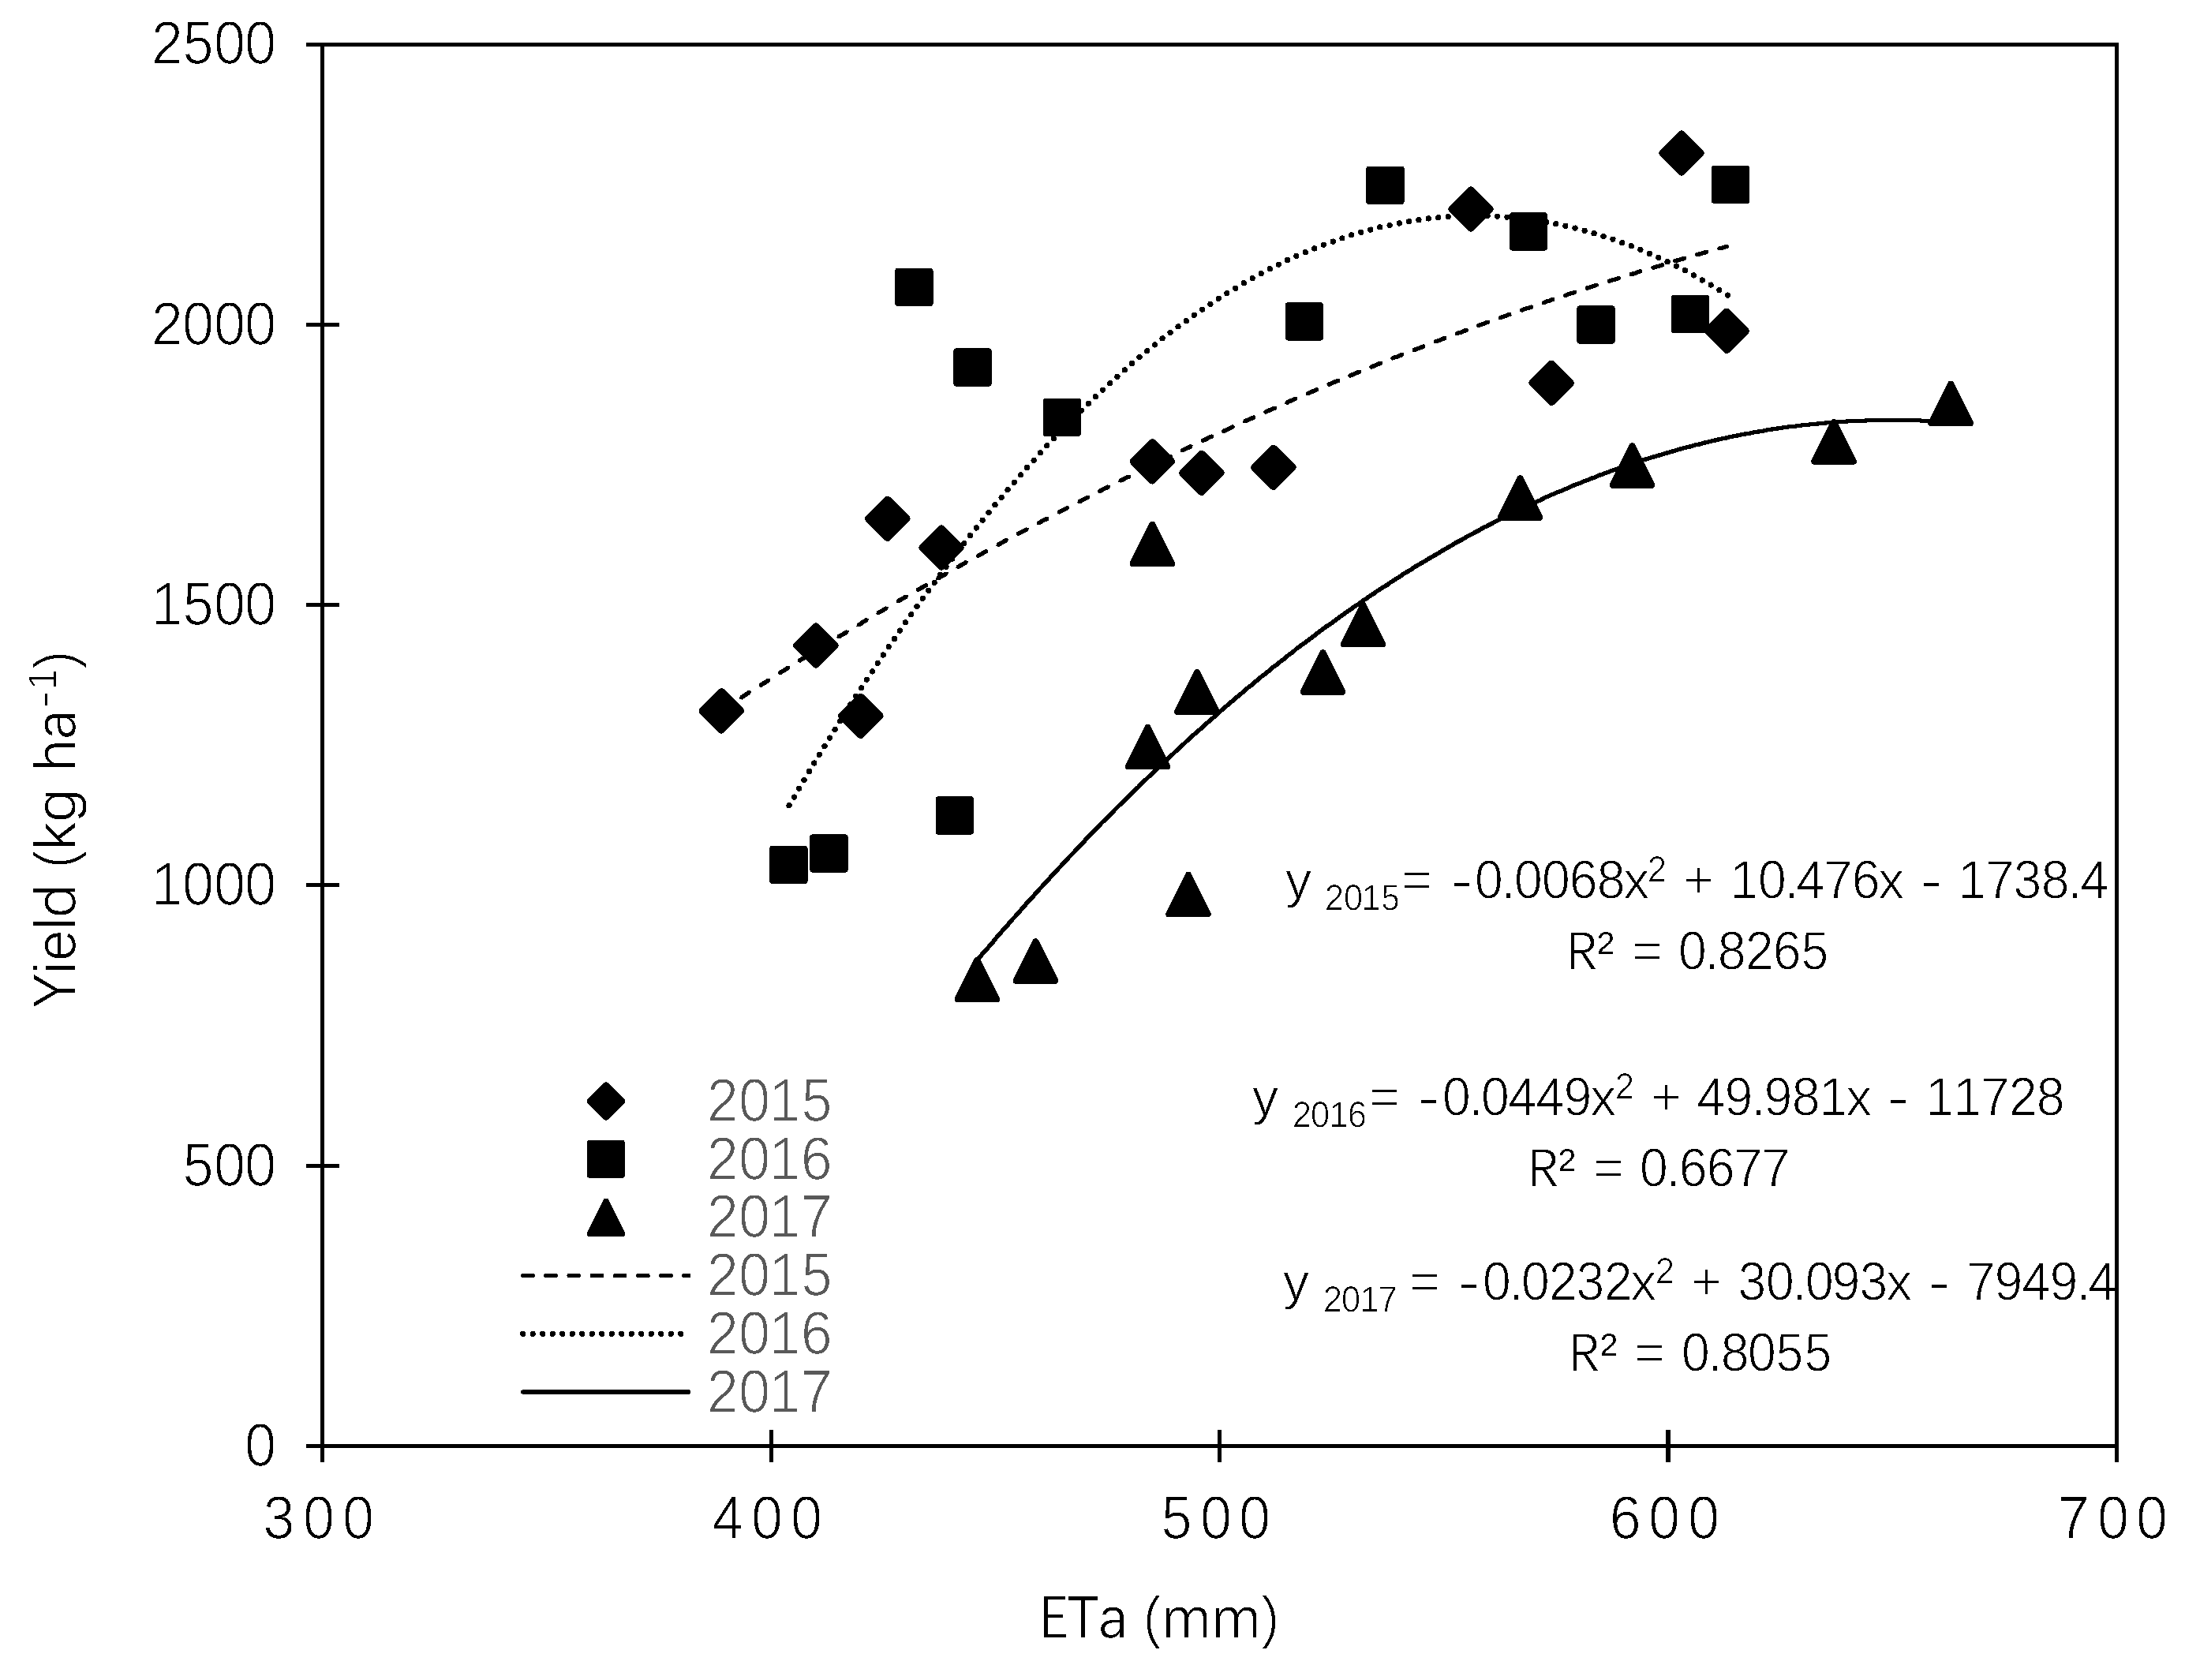
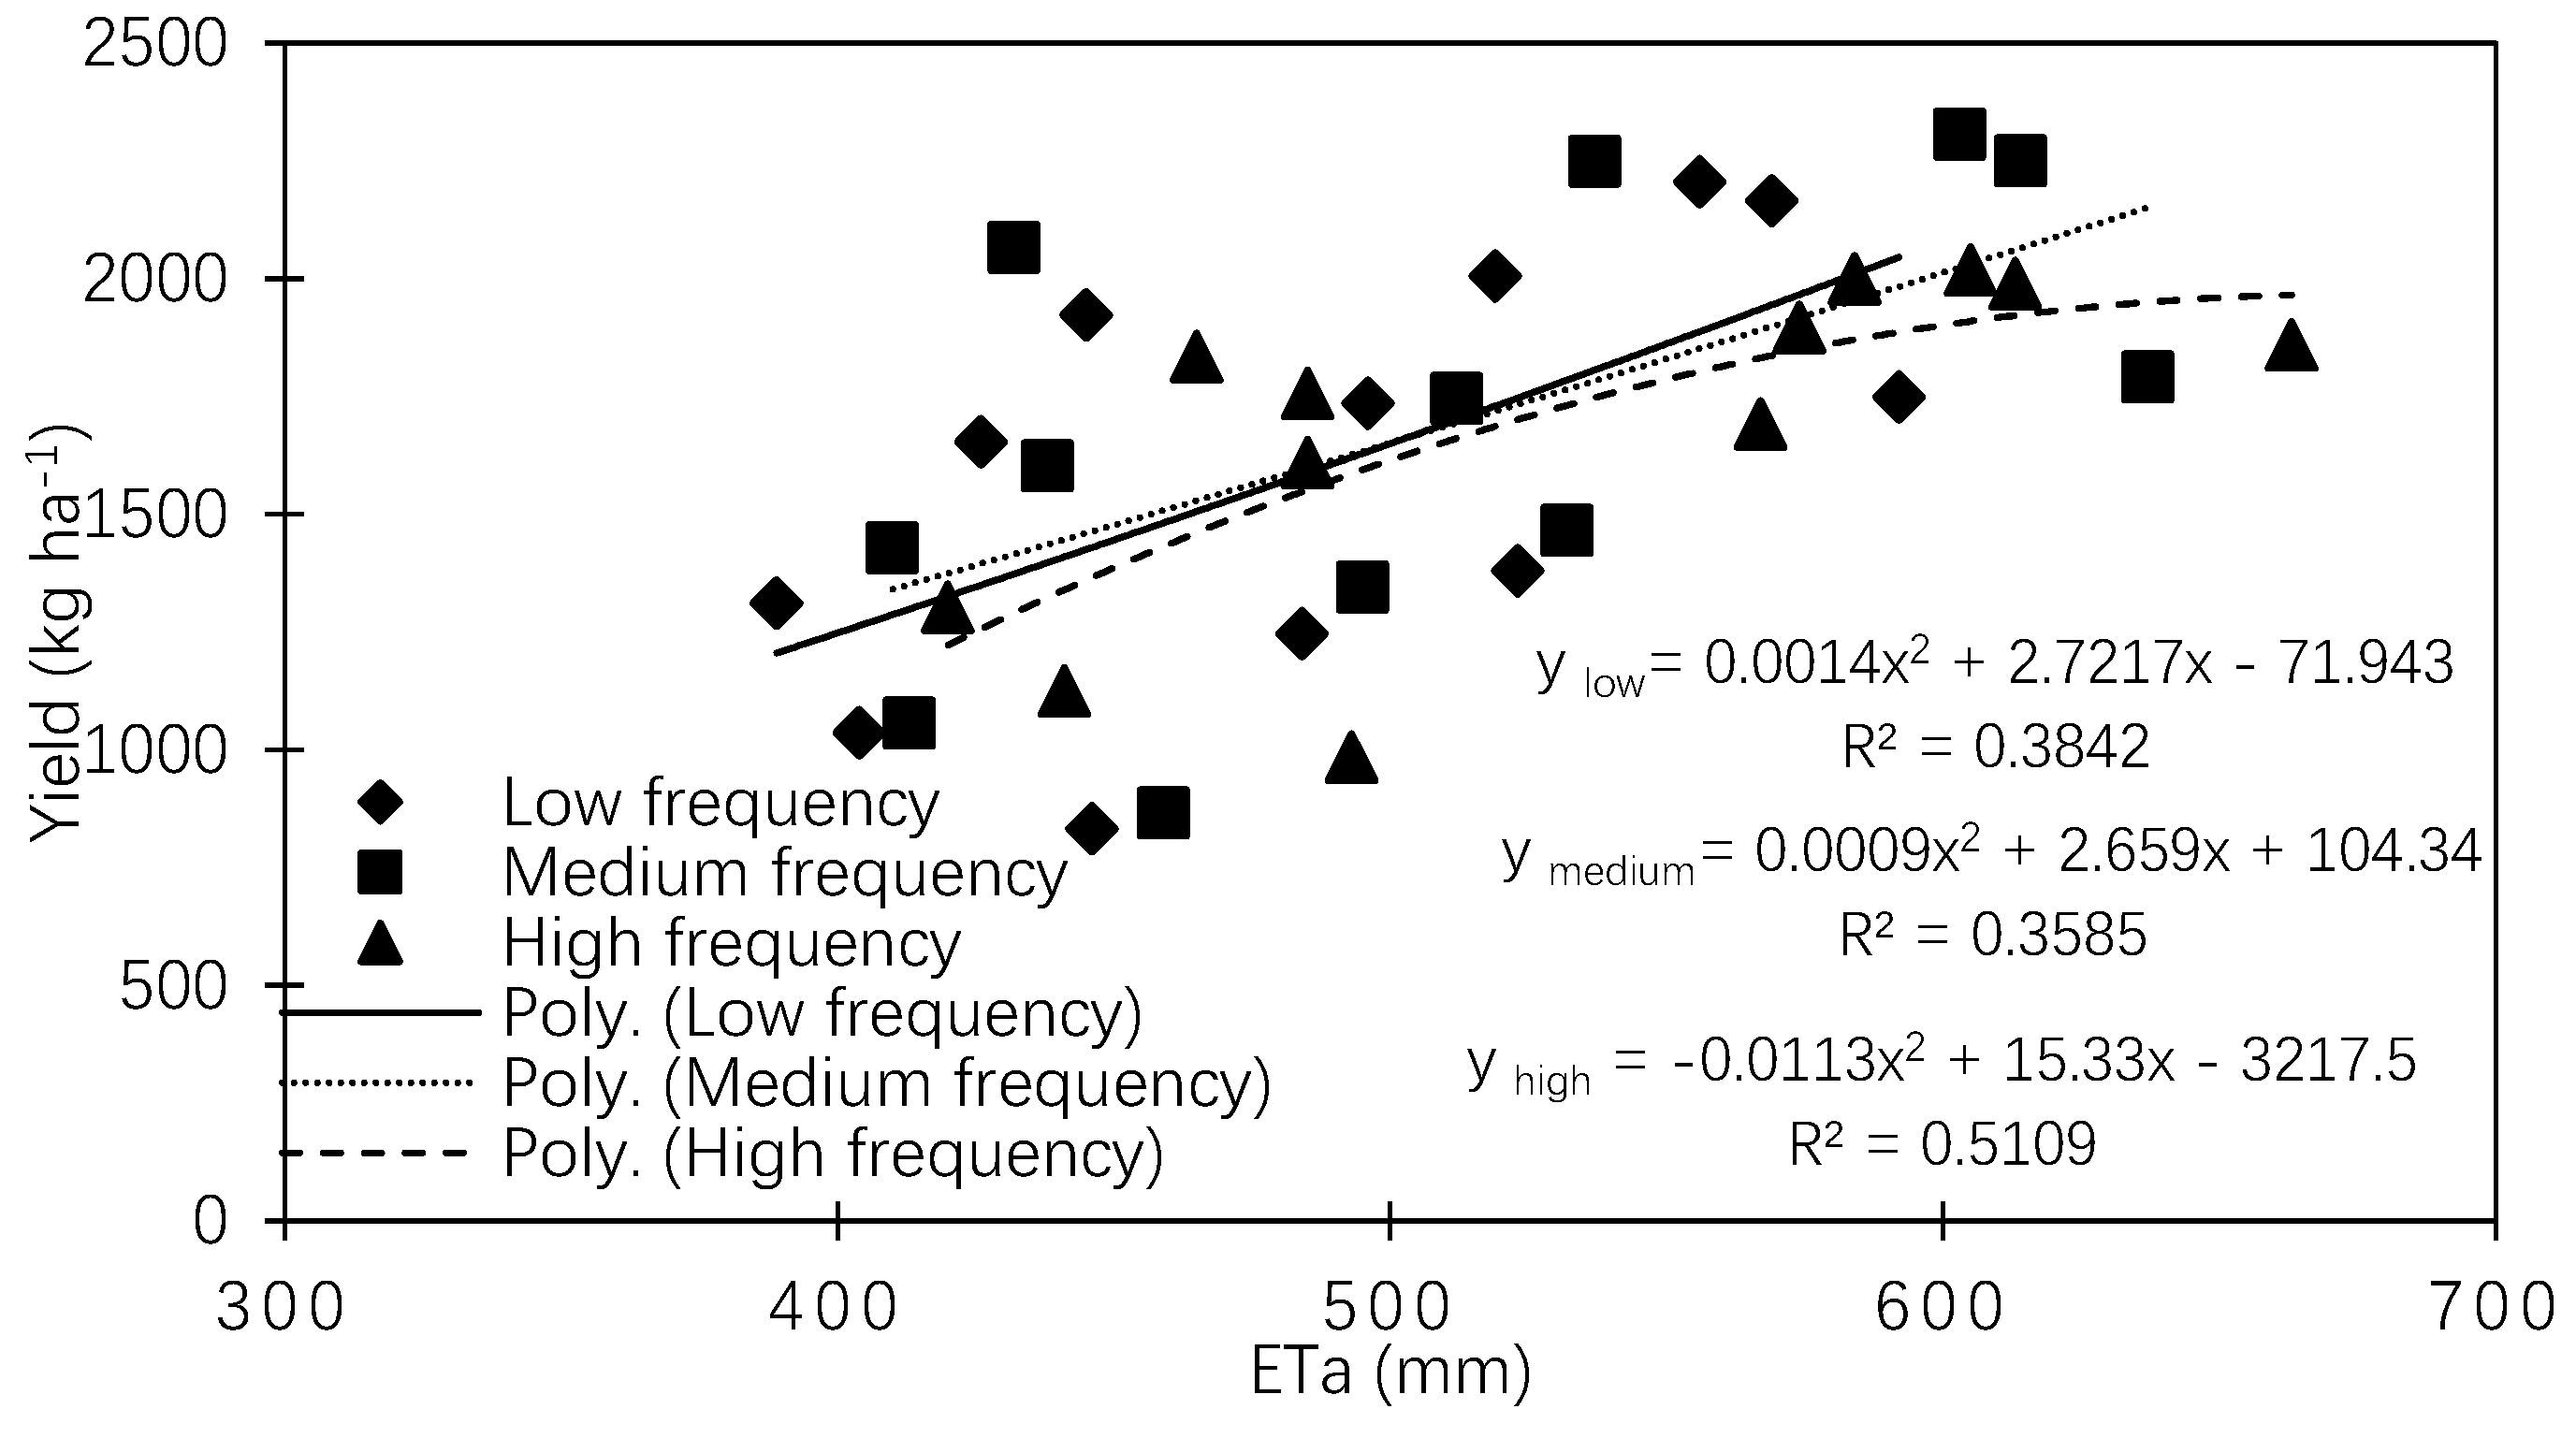
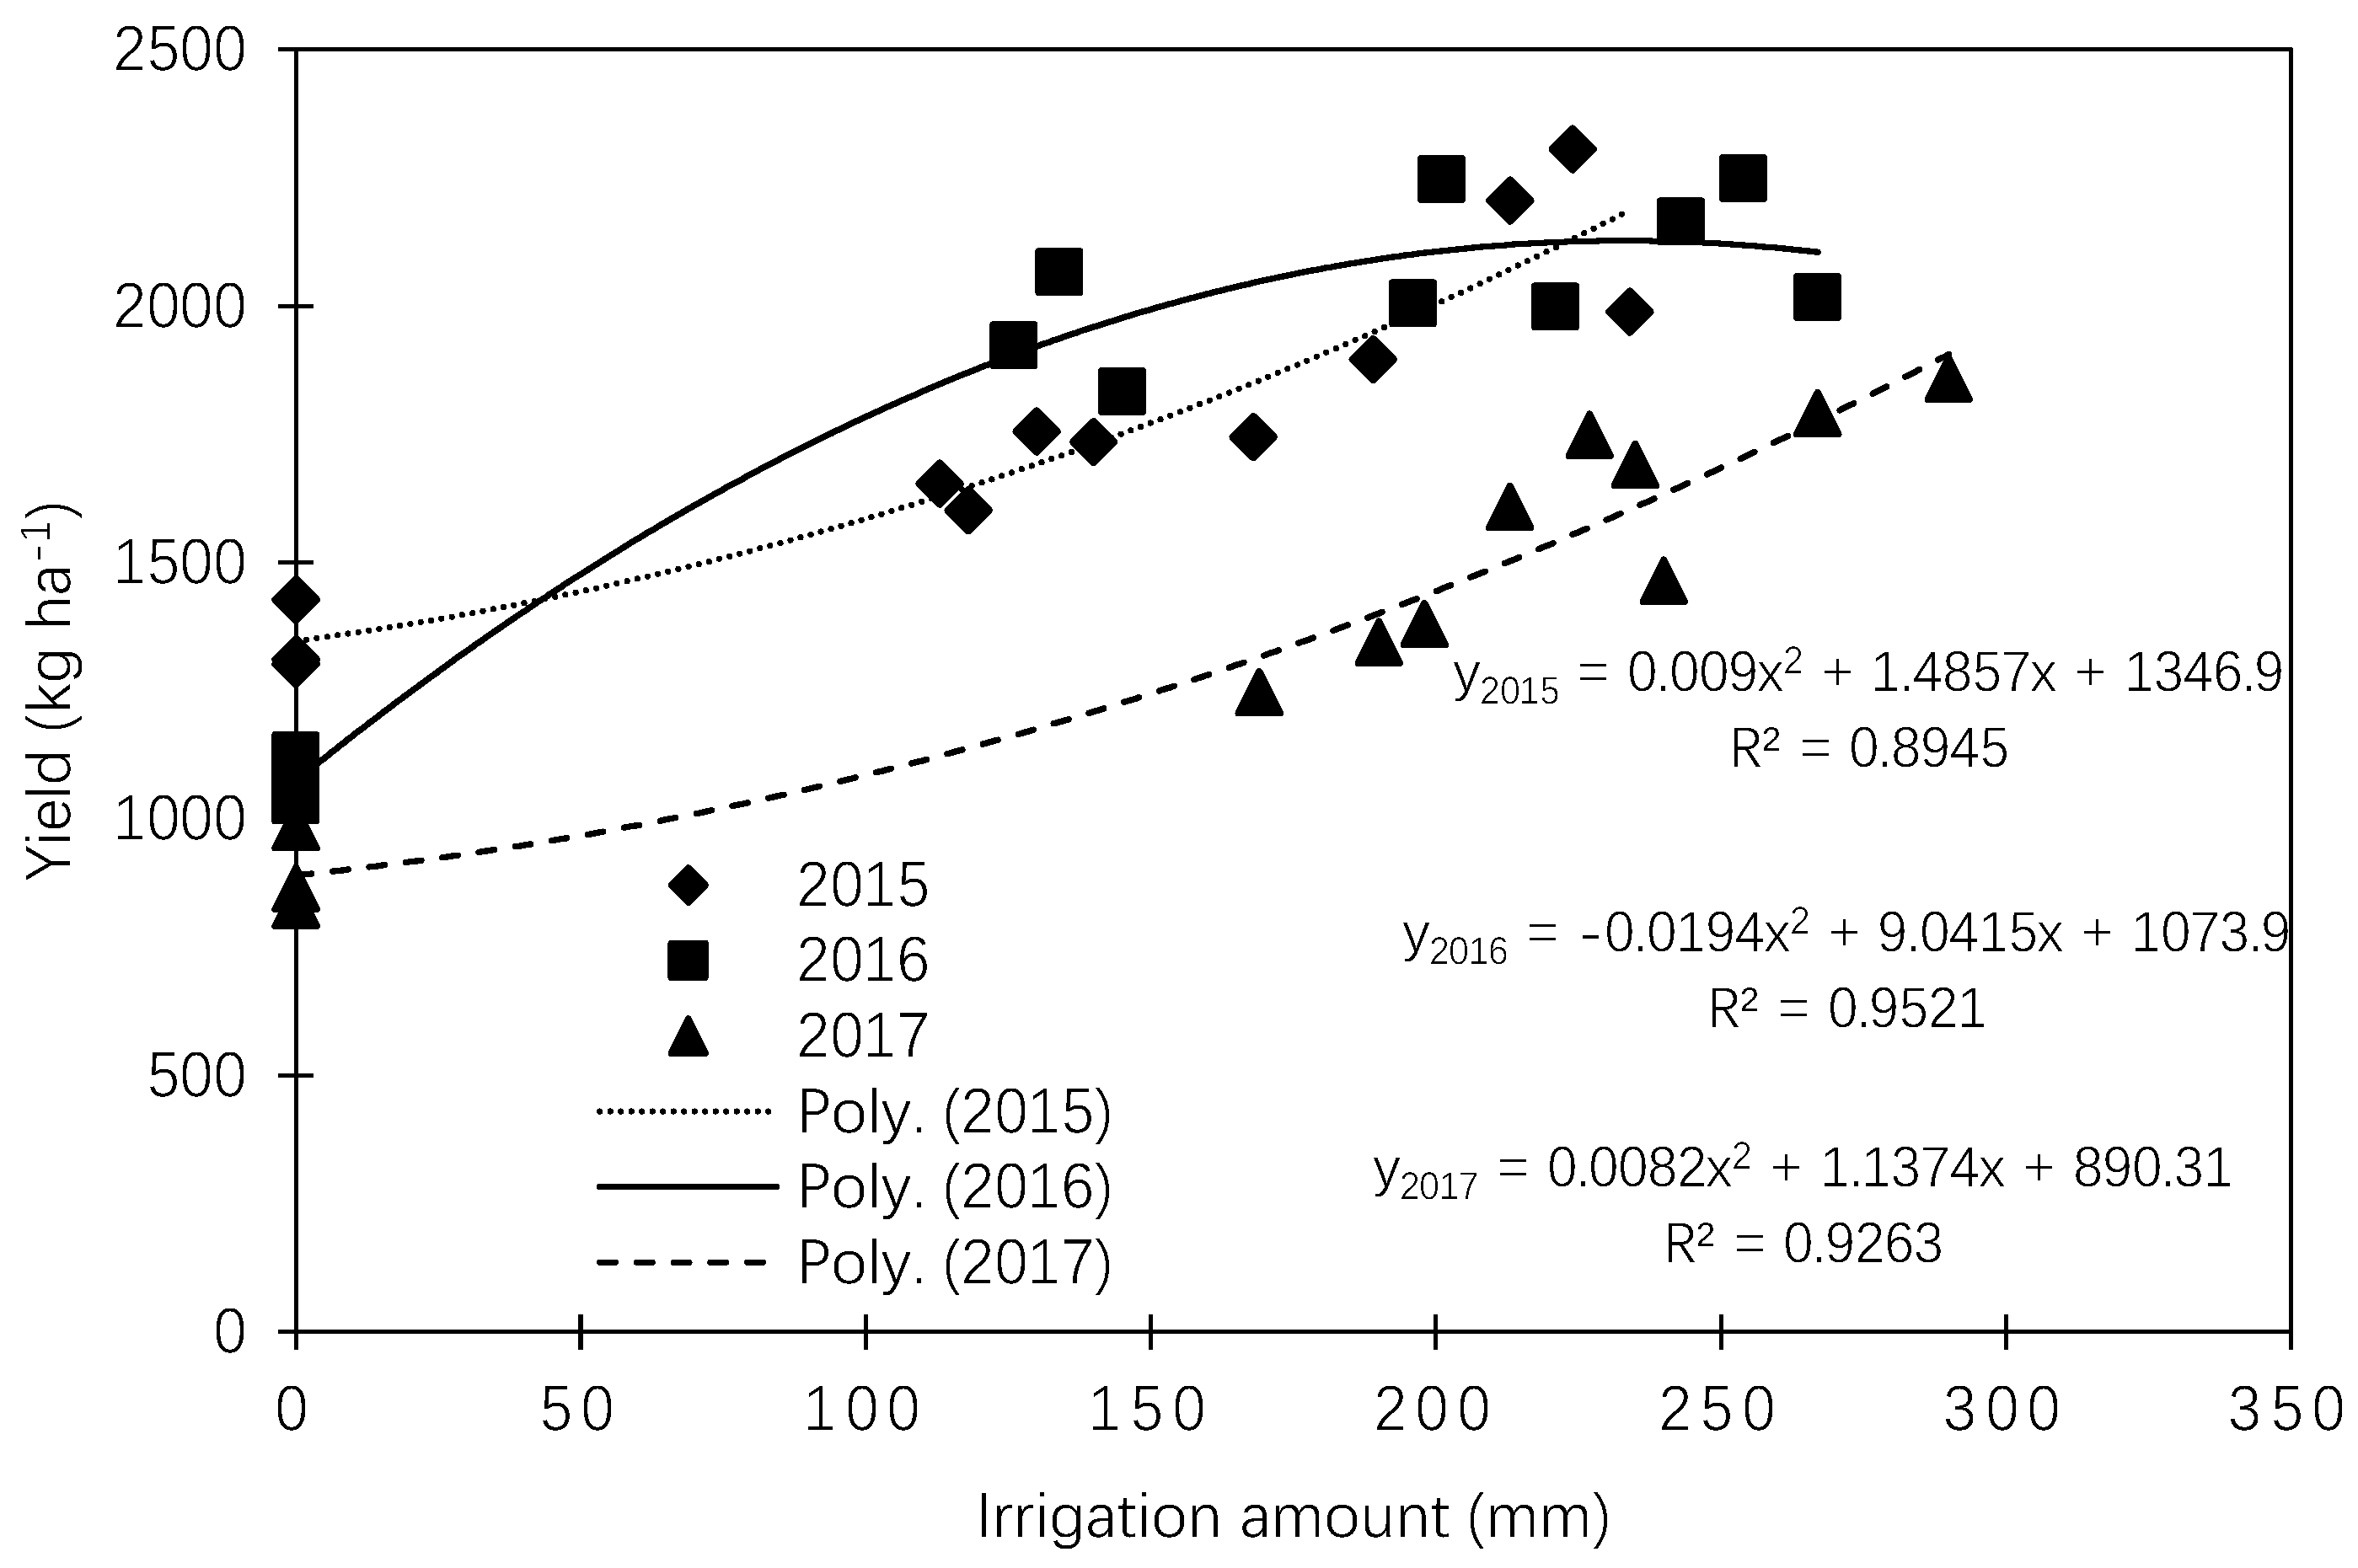
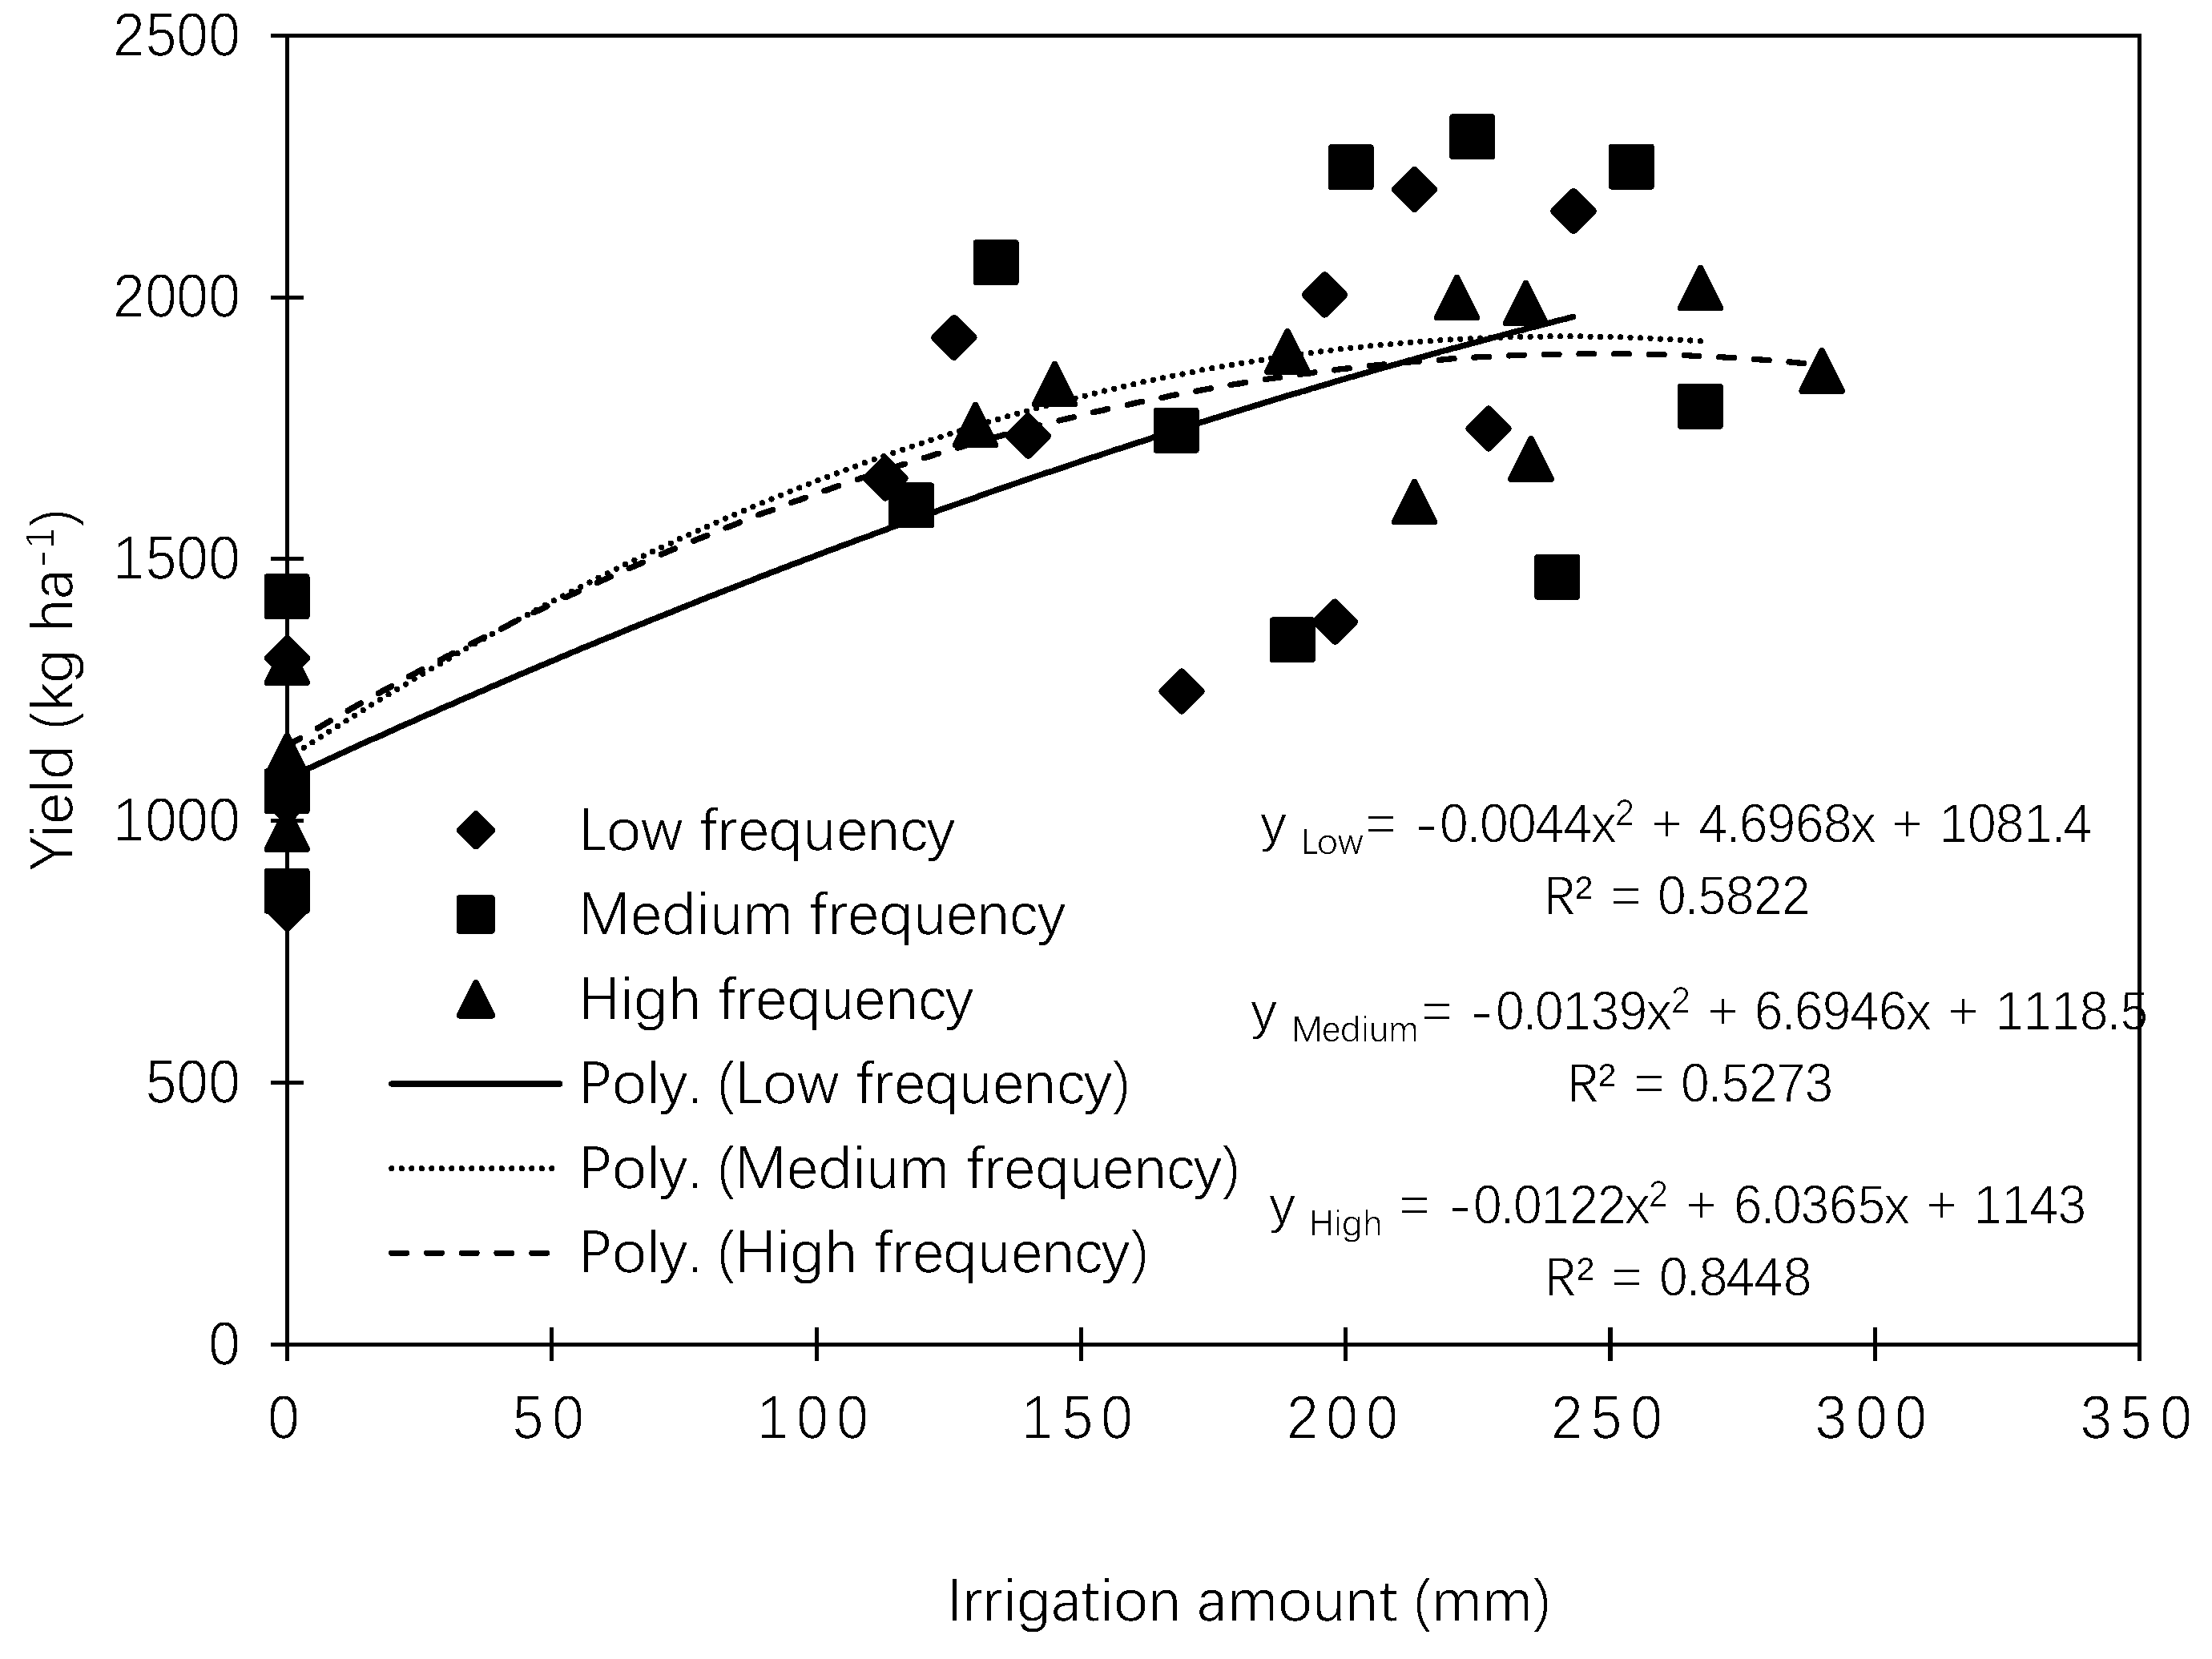
3.4. Relationship between Flue-Cured Tobacco Yield, Eta, and Irrigation Amount

The flue-cured tobacco yield had a quadratic relationship with ETa. The corresponding R2 were 0.83, 0.67, and 0.81 in 2015, 2016, and 2017, respectively (Figure 3). With the increase in ETa, the yield showed an increase and then decrease (Figure 3). The coefficient of determination, R2, was the smallest in 2016, and the ETa in 2016 had the least effect on the yield of flue-cured tobacco. The determination coefficients of flue-cured tobacco yield and ETa under high, medium, and low irrigation frequencies were 0.38, 0.36, and 0.52 in 2015, 2016, and 2017, respectively (Figure 4). It can be seen from Figure 4 that yield increased as ETa increased, and yield under high frequency irrigation was lower than that under medium and low frequency irrigation. The flue-cured tobacco yield had a quadratic relationship with irrigation amount, and the decision coefficients R2 were 0.89, 0.95, and 0.93 in 2015, 2016, and 2017, respectively (Figure 5). The yield of flue-cured tobacco and the irrigation amount R2 was 0.58, 0.53, and 0.85 under low, medium, and high irrigation frequencies, respectively (Figure 6). The flue-cured tobacco yield in the driest year of 2017 was significantly lower than that in 2015 and 2016. The pooled 2015–2017 data showed that the tobacco yield had a curvilinear relationship with irrgation amount (Figure 7). Yield was significantly affected by irrigation amount in 2015, 2016, and 2017, while the irrigation frequency was not significant during the 2015, 2016, and 2017 growing duration, and the interacting effect was not significant.

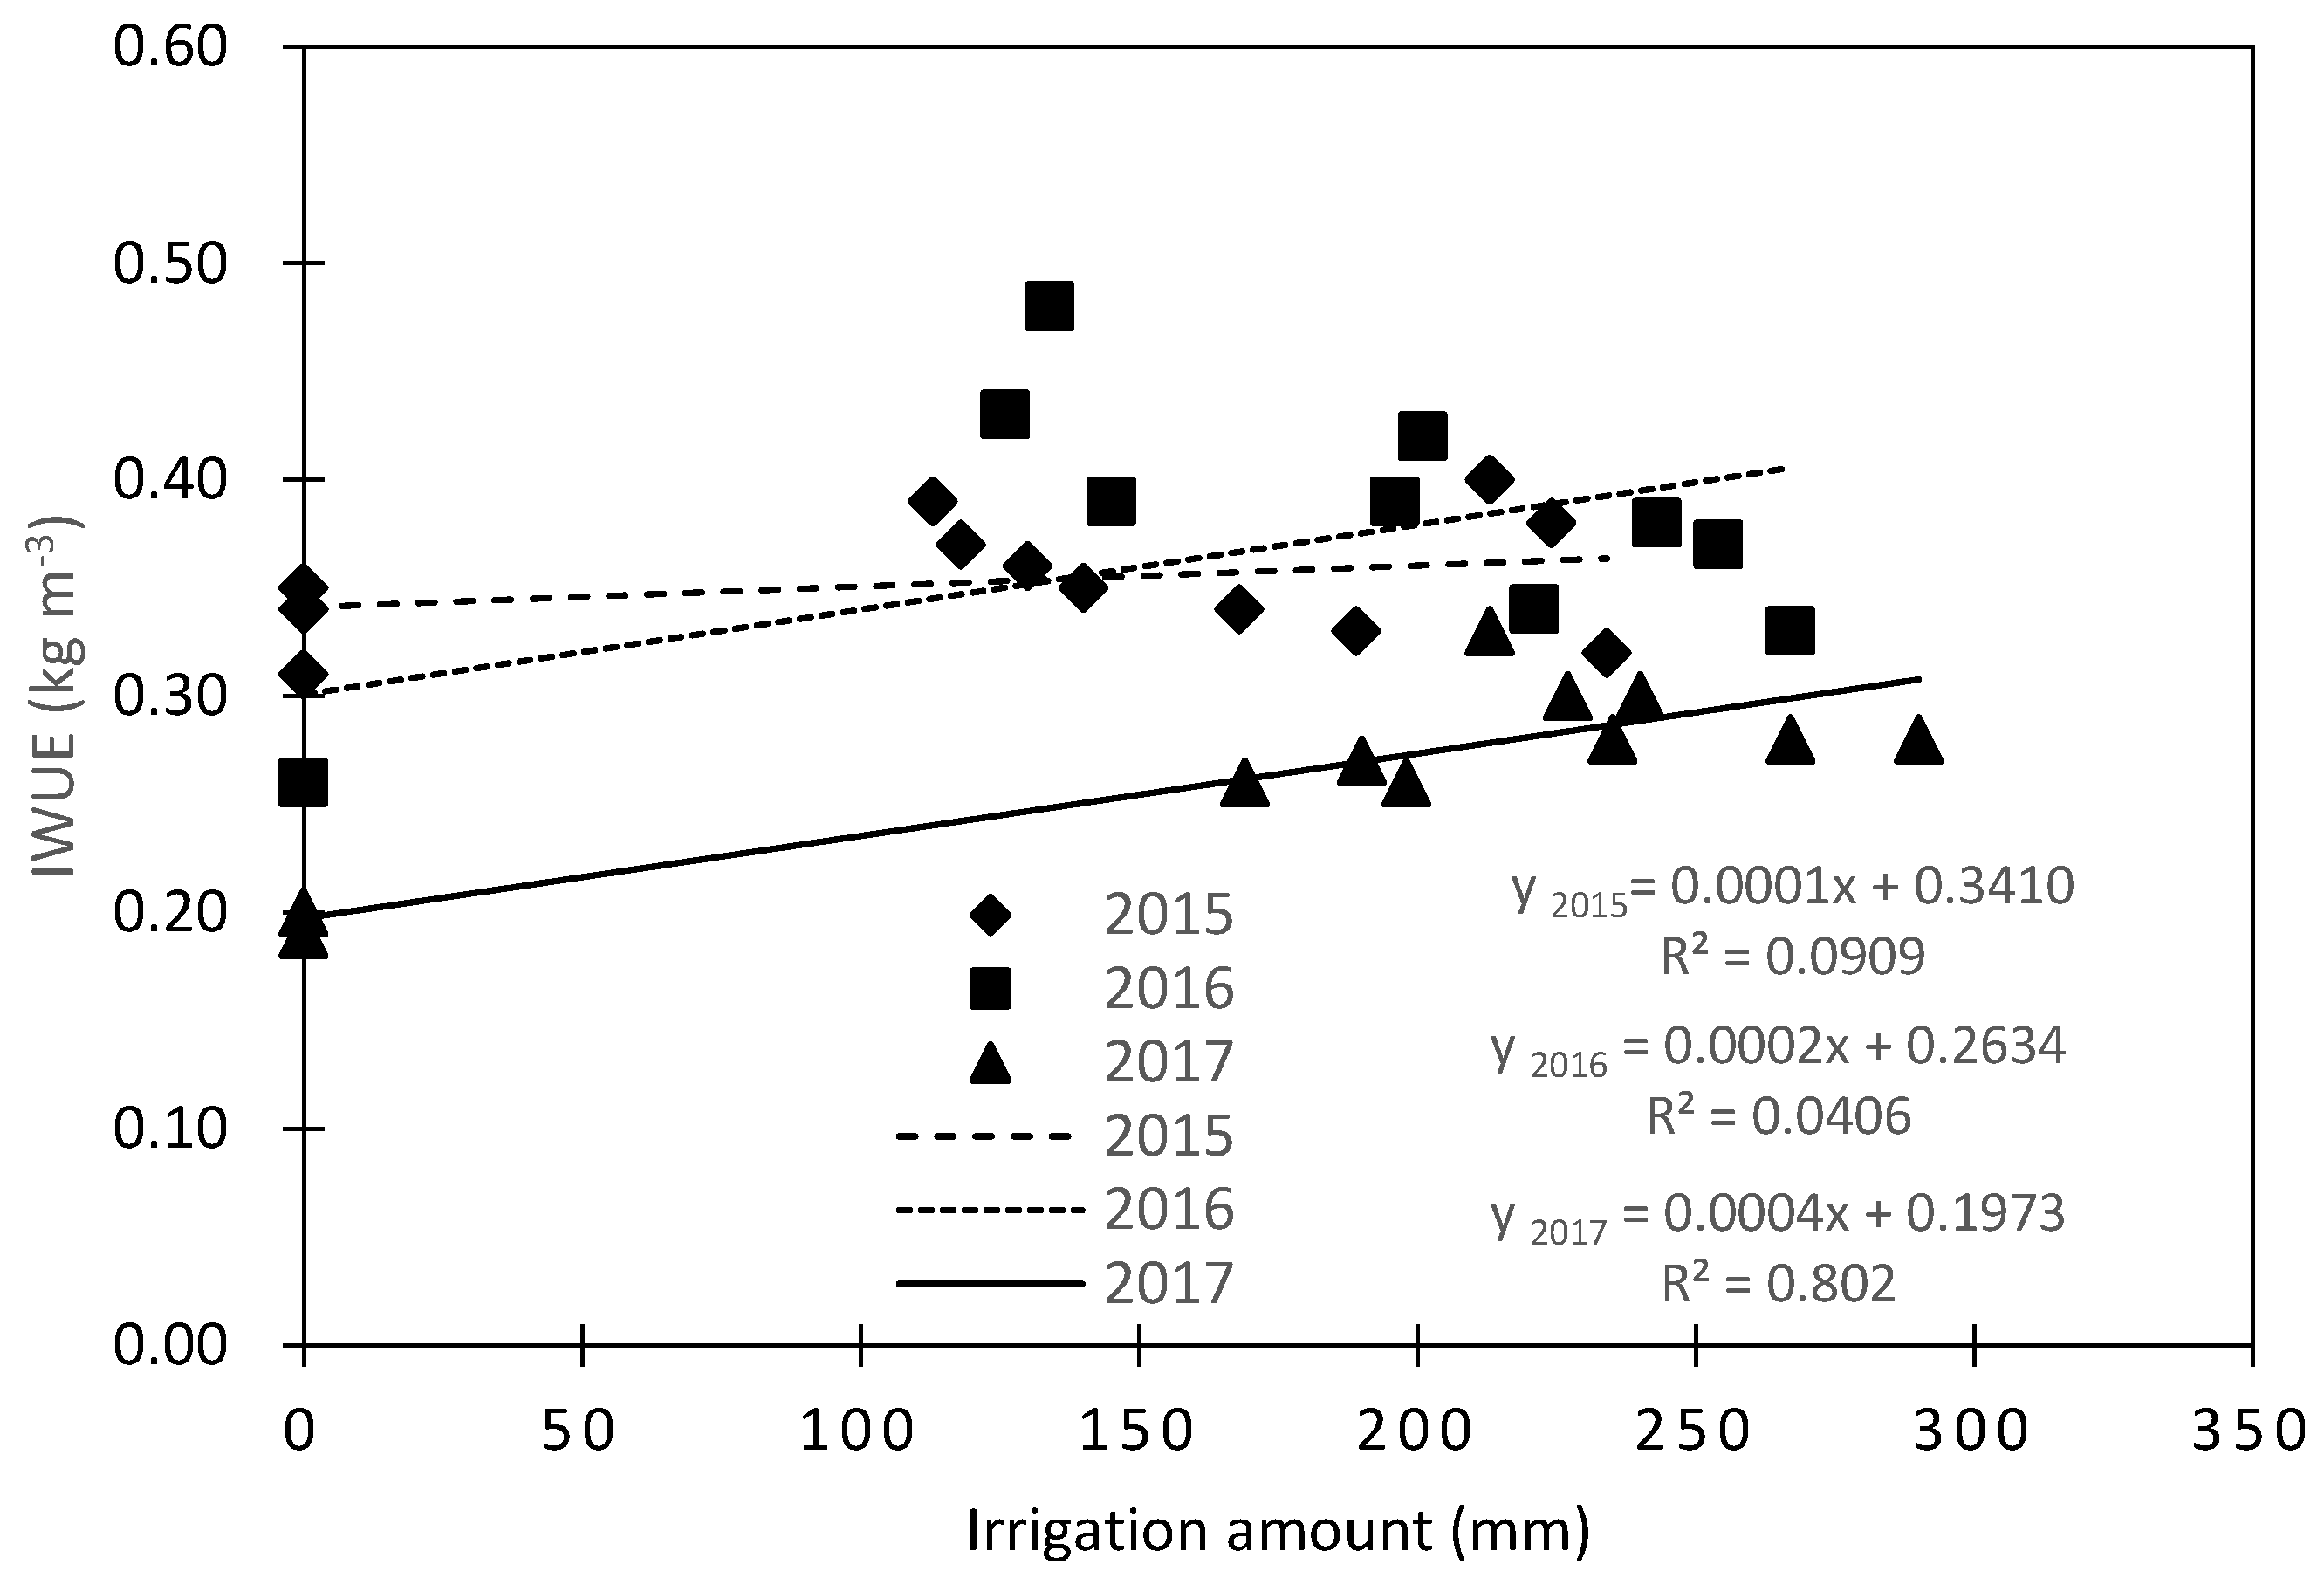
3.5. The Relationship between IWUE and Irrigation Amount

According to Doorenbos [28], when the precipitation does not meet crop water requirement, IWUE is lower in the year of less precipitation. Payero et al. [29] on maize’s IWUE, Djaman et al. [30] on wheat’s IWUE, and Djaman et al. [31] on maize’s IWUE all demonstrated that IWUE decreased linearly with irrigation amount, both in wet or dry growing seasons, and IWUE in a wet year was higher than a dry year. Different from corn and wheat, our results showed that IWUE increased with irrigation amount, but the similar results show that IWUE in the wet year was higher than the dry year, where flue-tobacco IWUE varied from 0.31 to 0.40 kg m−3, 0.25 to 0.48 kg m−3, and from 0.19 to 0.33 kg m−3 in 2015, 2016, and 2017, respectively (Figure 8). The average IWUE was 0.35 kg m−3, 0.36 kg m−3, and 0.26 kg m−3 in 2015, 2016, and 2017, respectively. The IWUE in the driest year 2017 was lower than IWUE in the wet years 2015 and 2016.

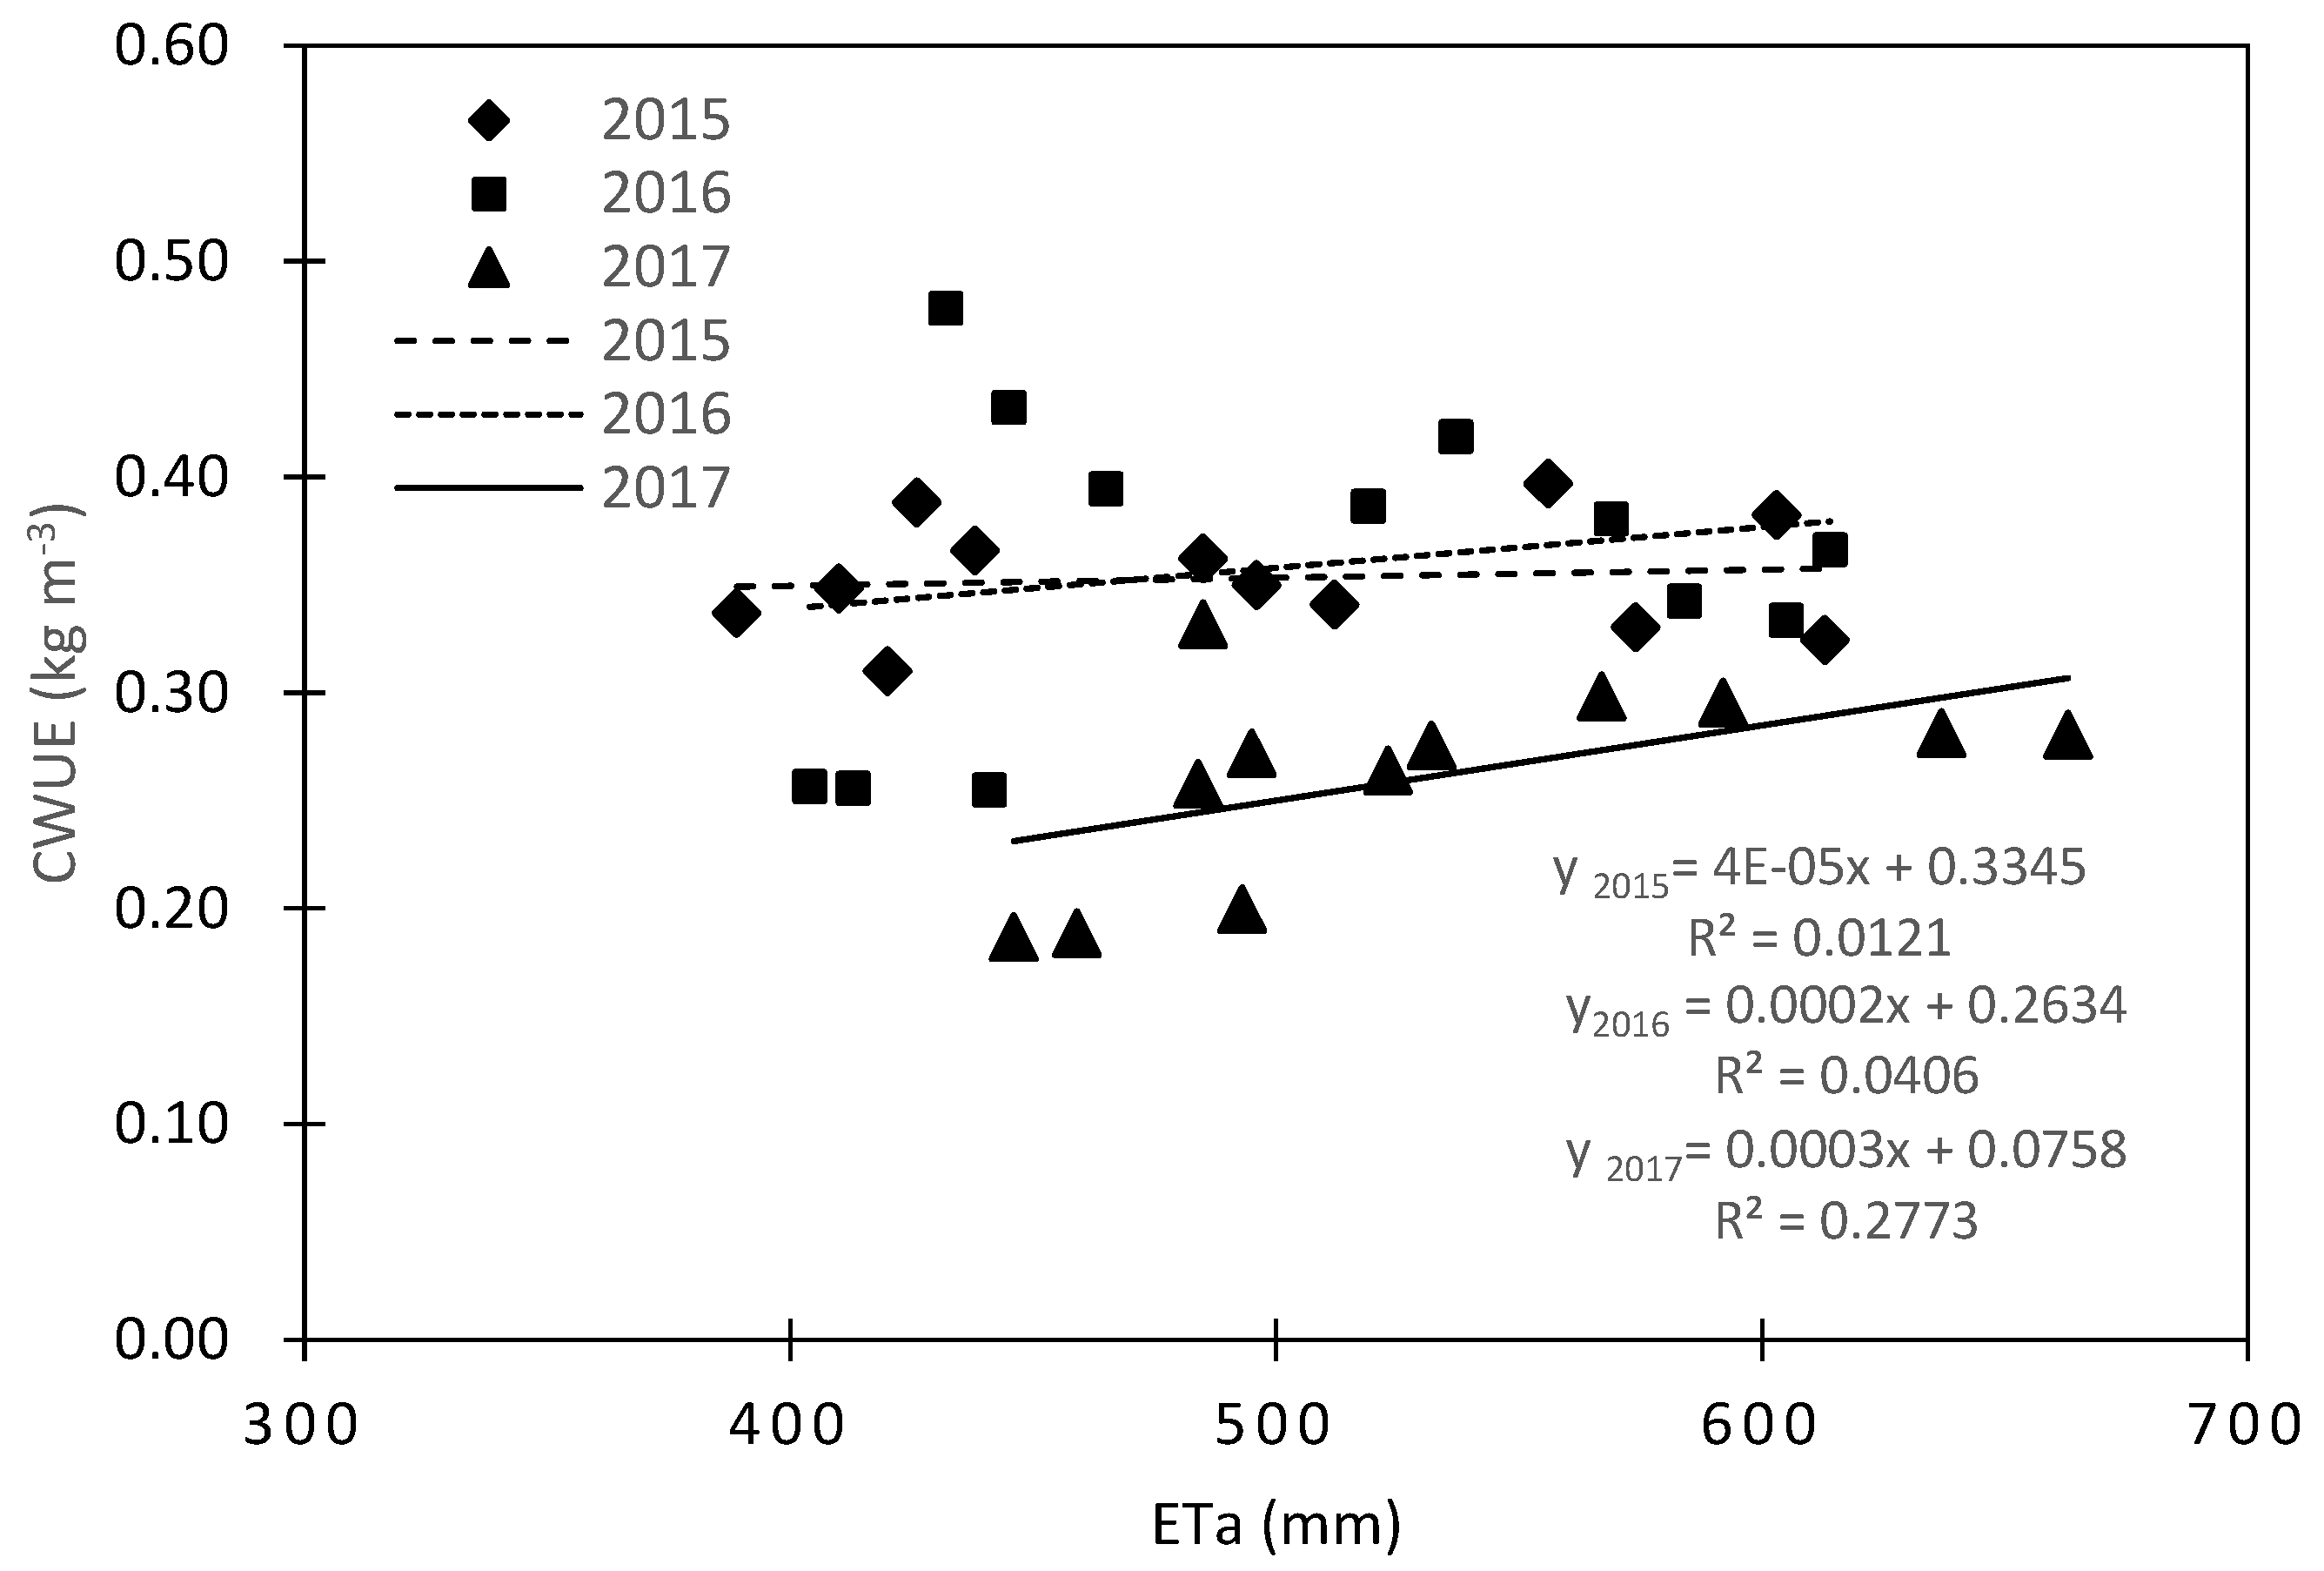
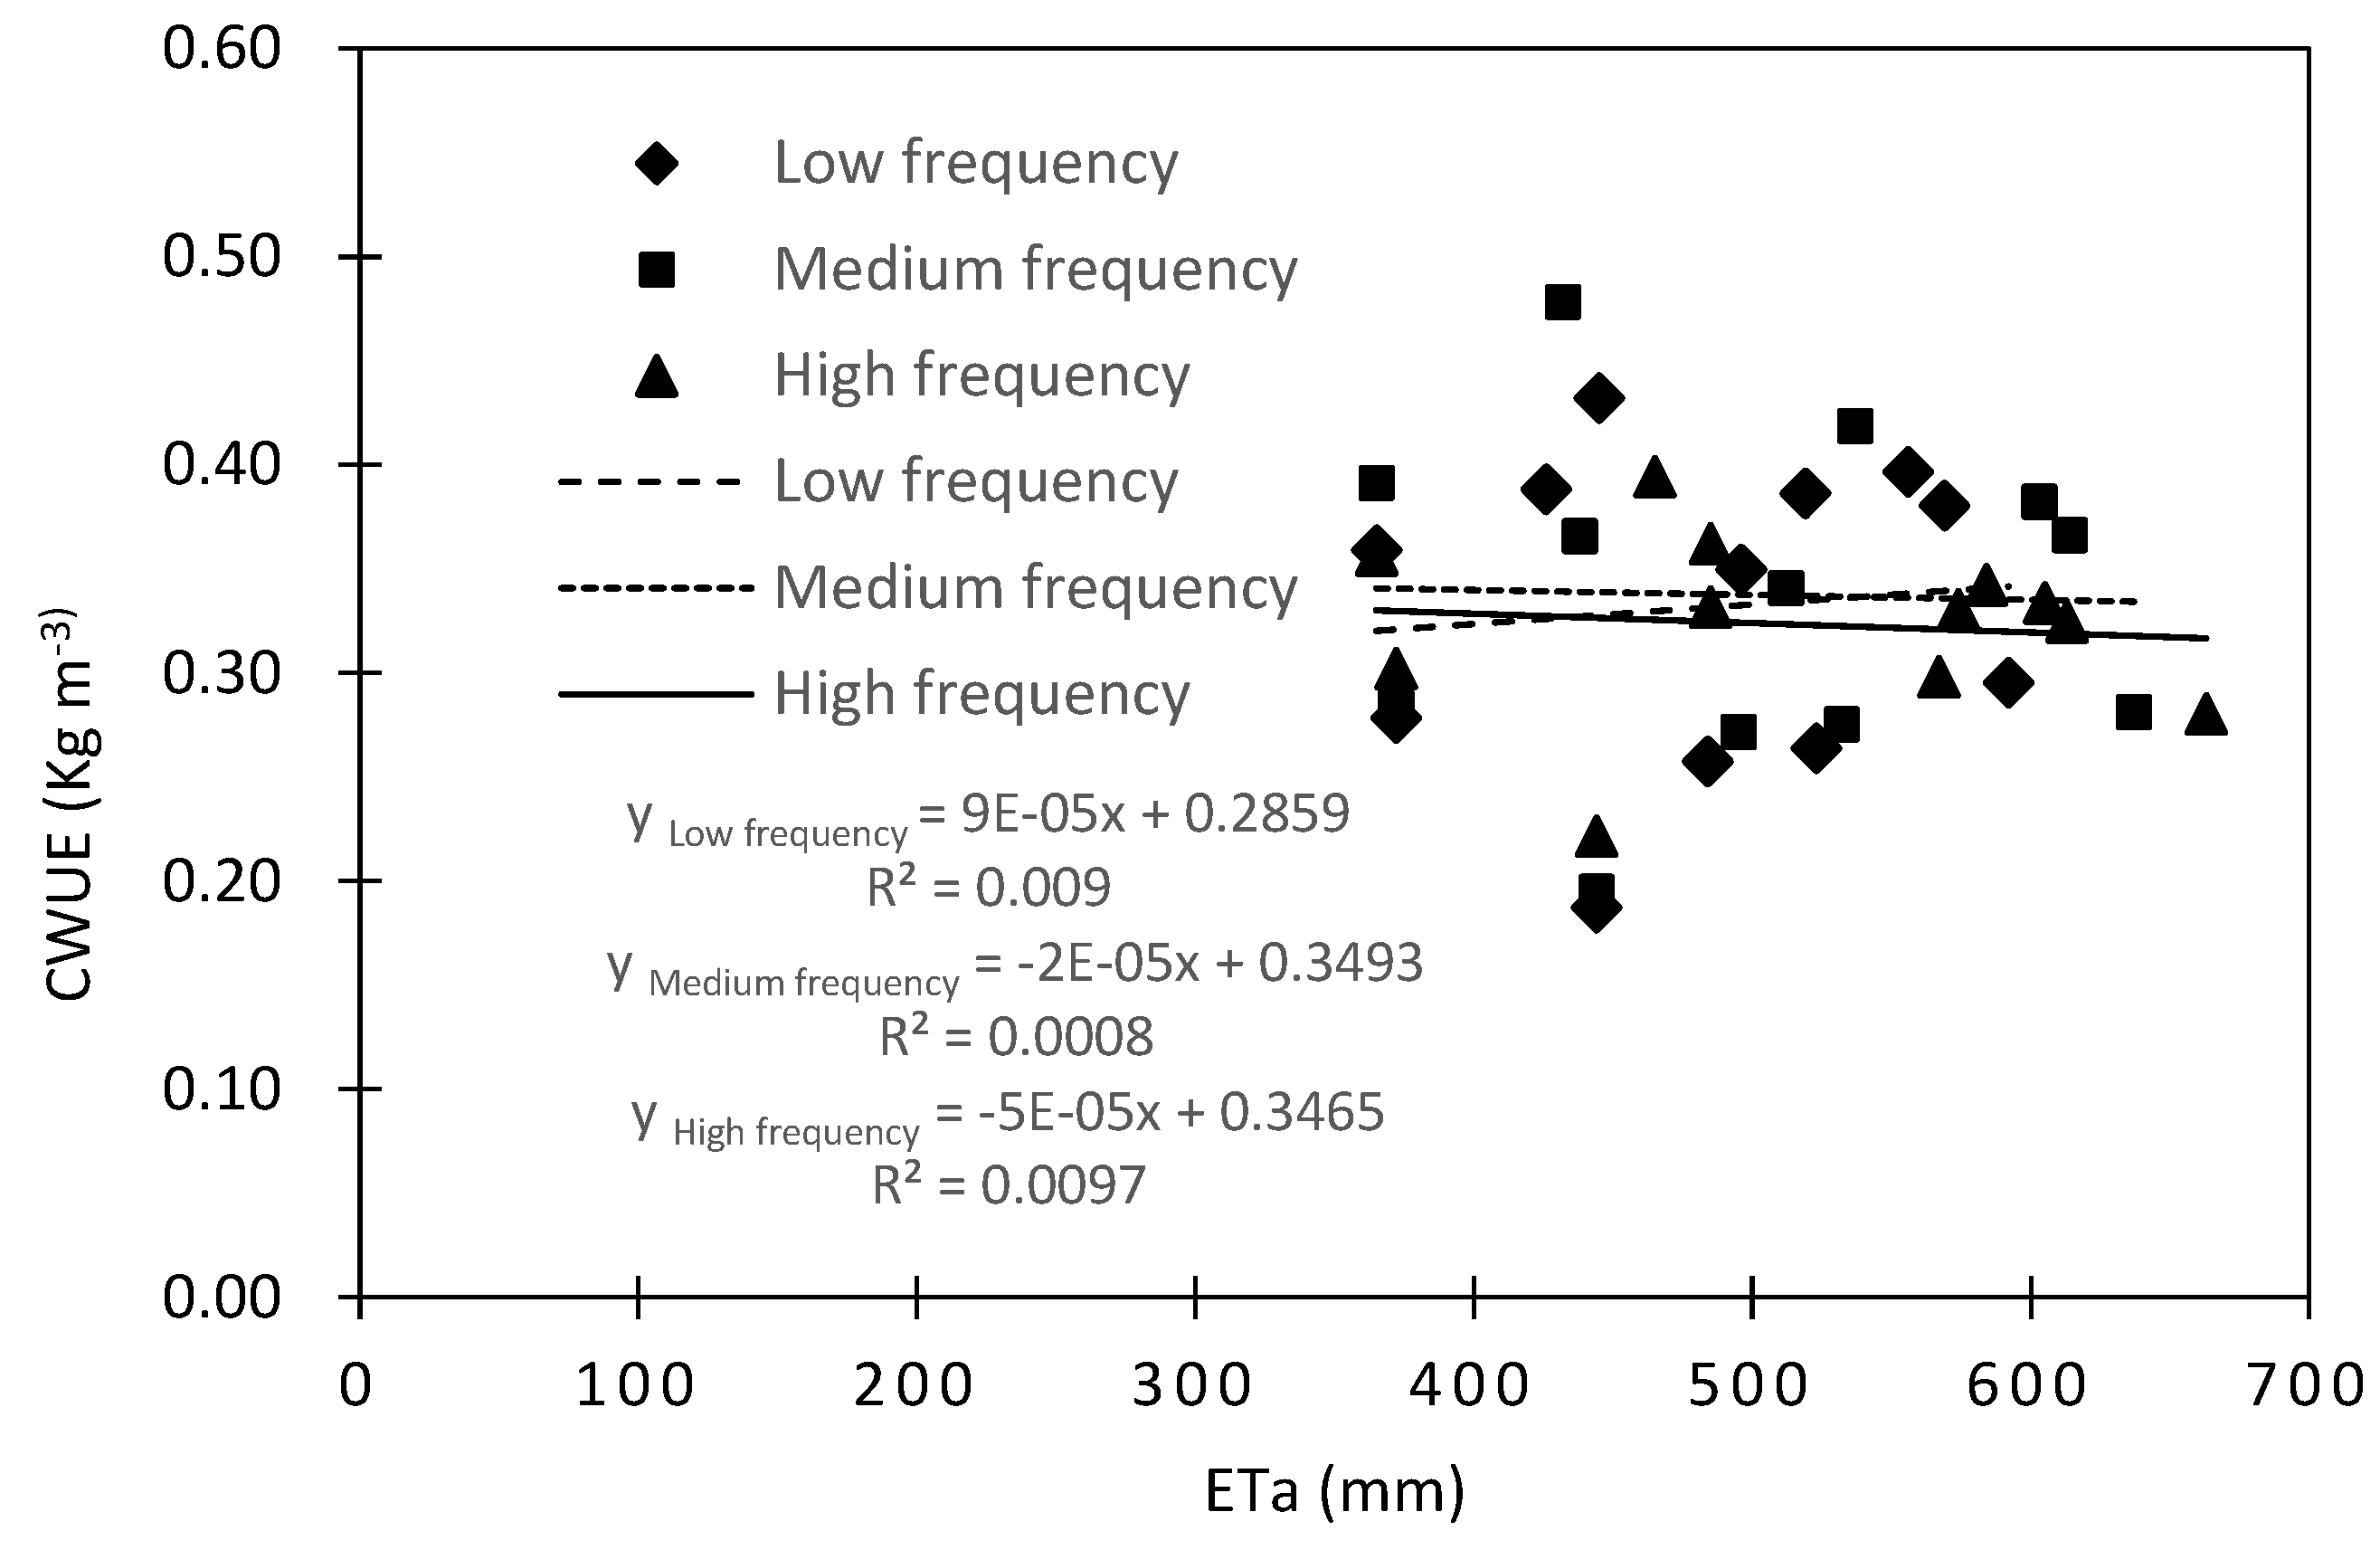
3.6. The Relationship between CWUE and ETa

Flue-tobacco CWUE varied from 0.13 to 0.40 kg m−3, 0.25 to 0.48 kg m−3, and from 0.19 to 0.33 kg m−3 in 2015, 2016, and 2017, respectively (Figure 9). The average CWUE was 0.35 kg m−3, 0.36 kg m−3, and 0.26 kg m−3 in 2015, 2016, and 2017, respectively. The CWUE in the driest year, 2017, was lower than CWUE in the wet years 2015 and 2016. CWUE in 2017 was 8% to 46% lower than CWUE in 2015, and 13% to 43% lower than CWUE in 2016. The average CWUE was 0.33 kg m−3, 0.33 kg m−3, and 0.31 kg m−3 under high, medium, and low irrigation frequencies, respectively (Figure 10). The CWUE ranged from 0.19 to 0.43 kg m−3, from 0.19 to 0.48 kg m−3, and from 0.20 to 0.39 kg m−3 under high, medium, and low irrigation frequencies, respectively (Figure 10). The determination coefficients R2 of CWUE and yield were 0.75, 0.67, and 0.54 under high, medium, and low irrigation frequencies, respectively (Figure 11). The CWUE in the driest year 2017 was significantly lower than the CWUE in the years of 2015 and 2016, and there was no significant difference in CWUE under different irrigation frequency.

4. Summary and Conclusions

Field experiments were conducted for flue-tobacco at the Nanjing Vegetable and Flower Research Institute, Middle of China during the 2015, 2016, and 2017 growing seasons. The experiments were conducted to evaluate the effects of irrigation amount and irrigation frequency on flue-cured tobacco water consumption, yield, and water use efficiency. The 100% IRT treatment irrigation amount ranged from 213 mm to 290 mm. The highest irrigation amount was in the driest year (2017), and the corresponding ETa ranged from 446 to 663 mm. Based on the three years of experimental data, there was no significant difference in the effect of irrigation frequency on the yield of flue-cured tobacco.
The yield of flue-cured tobacco increased first and then decreased with the increase of ETa. The flue-cured tobacco yield ranged from 1302 to 2306 kg ha−1, 1036 to 2249 kg ha−1, and 832 to 1859 kg ha−1 in 2015, 2016, and 2017, respectively. The flue-cured tobacco yield had a quadratic relationship with irrigation amount. In line with Kang’s results [9], ETa was greatest under the highest irrigation levels, and the relationship between yield and ETa was also a quadratic function, while the yield showed an increase and then decrease with the increase of ETa. Therefore, the appropriate low irrigation amount may make it possible to increase CWUE and reduce water consumption [32]. The annual yield of RFT treatment was significantly different (p > 0.05), which was mainly due to the uneven distribution of rainfall and ETa. CWUE increased with an increase in ETa. CWUE in 2017 (the driest year) was significantly lower than that in 2016 (medium dry year), and 2015 (the wettest year), and there was no significant difference under different irrigation frequencies. The results of this study can provide a reference for flue-cured tobacco research and production in the same climatic conditions in central China.

Author Contributions

J.G.; did the initial designed and did the fieldwork collected and analyzed data, wrote the manuscript, , Q.M.; did the fieldwork, collected data, and contributed reagents/materials, X.Y.; did the fieldwork and contributed analysis tools, C.G.; conducted the simulations and did the fieldwork, F.D. is the co-supervisor, Y.Y. is the co-supervisor, X.S.; helped in desiging the project and funding management, and reviewed the manuscript.

Funding

This research was funded by the Fundamental Research Funds for the Central Universities (2016B42414), Science and Technology project by Guizhou tobacco of China National Tobacco Corporation (201709), Technology Development and Transformations Promotion Project by Guizhou Tobacco Company, Qianxinan branch (2015No.41, 201502).

Acknowledgments

We thank the staff of Nanjing vegetable and flower research institute support in the field experiment and helping in completing the project.

Conflicts of Interest

The authors declare no conflict of interest.

References

  1. Li, V.C.; Tang, S. China’s New Road for Tobacco Control: Tobacco Crop Substitution. Am. J. Public Health 2018, 108, 1316–1317. [Google Scholar] [CrossRef] [PubMed]
  2. Piao, S.; Ciais, P.; Huang, Y.; Shen, Z.; Peng, S.; Li, J.; Zhou, L.; Liu, H.; Ma, Y.; Ding, Y. The impacts of climate change on water resources and agriculture in China. Nature 2010, 467, 43–51. [Google Scholar] [CrossRef] [PubMed]
  3. Liu, J.; Yang, W. Water sustainability for China and beyond. Science 2012, 337, 649–650. [Google Scholar] [CrossRef] [PubMed]
  4. Ayars, J.; Phene, C.; Hutmacher, R.; Davis, K.; Schoneman, R.; Vail, S.; Mead, R. Subsurface drip irrigation of row crops: A review of 15 years of research at the Water Management Research Laboratory. Agric. Water Manag. 1999, 42, 1–27. [Google Scholar] [CrossRef]
  5. Camp, C. Subsurface drip irrigation: A review. Trans. ASAE 1998, 41, 1353–1367. [Google Scholar] [CrossRef]
  6. Wang, Y.; Cai, H.; Zhang, X.; Yang, T. Progress in Strategy and Measure on Optimized Irrigation of Tobacco in China. Chin. Tob. Sci. 2007, 28, 6–9, 39. [Google Scholar] [CrossRef]
  7. Nilahyane, A.; Islam, M.A.; Mesbah, A.O.; Garcia y Garcia, A. Effect of Irrigation and Nitrogen Fertilization Strategies on Silage Corn Grown in Semi-Arid Conditions. Agronomy 2018, 8, 208. [Google Scholar] [CrossRef]
  8. Gago, J.; Douthe, C.; Florez-Sarasa, I.; Escalona, J.M.; Galmes, J.; Fernie, A.R.; Flexas, J.; Medrano, H. Opportunities for improving leaf water use efficiency under climate change conditions. Plant Sci. 2014, 226, 108–119. [Google Scholar] [CrossRef] [PubMed]
  9. Kang, S.; Zhang, L.; Liang, Y.; Dawes, W. Simulation of winter wheat yield and water use efficiency in the Loess Plateau of China using WAVES. Agric. Syst. 2003, 78, 355–367. [Google Scholar] [CrossRef]
  10. RoyChoudhury, A.; Roy, C.; Sengupta, D.N. Transgenic tobacco plants overexpressing the heterologous lea gene Rab16A from rice during high salt and water deficit display enhanced tolerance to salinity stress. Plant Cell Rep. 2007, 26, 1839–1859. [Google Scholar] [CrossRef] [PubMed]
  11. Chen, Y.; Marek, G.; Marek, T.; Brauer, D.; Srinivasan, R. Assessing the efficacy of the SWAT auto-irrigation function to simulate irrigation, evapotranspiration, and crop response to management strategies of the Texas High Plains. Water 2017, 9, 509. [Google Scholar] [CrossRef]
  12. Moore, J.M.; Sumner, P.E. Irrigating Tobacco; The University of Georgia: Athens, Georgia, 2010. [Google Scholar]
  13. Wang, F.-X.; Kang, Y.; Liu, S.-P. Effects of drip irrigation frequency on soil wetting pattern and potato growth in North. China Plain. Agric. Water Manag. 2006, 79, 248–264. [Google Scholar] [CrossRef]
  14. Xiang, Y.; Zou, H.; Zhang, F.; Qiang, S.; Wu, Y.; Yan, S.; Wang, H.; Wu, L.; Fan, J.; Wang, X. Effect of Irrigation Level and Irrigation Frequency on the Growth of Mini Chinese Cabbage and Residual Soil Nitrate Nitrogen. Sustainability 2019, 11, 111. [Google Scholar] [CrossRef]
  15. Hunsaker, D.; Clemmens, A.; Fangmeier, D. Cotton response to high frequency surface irrigation. Agric. Water Manag. 1998, 37, 55–74. [Google Scholar] [CrossRef]
  16. Cao, Q.; Wang, S.; Gao, L.; Ren, H.; Chen, Q.; Zhao, J.; Wang, Q.; Sui, X.; Zhang, Z. Effects of alternative furrow irrigation on growth and water use efficiency of cucumber in solar greenhouse. Trans. Chin. Soc. Agric. Eng. 2010, 26, 47–53. [Google Scholar]
  17. El-Hendawy, S.; Hokam, E.; Schmidhalter, U. Drip irrigation frequency: The effects and their interaction with nitrogen fertilization on sandy soil water distribution, maize yield and water use efficiency under Egyptian conditions. J. Agron. Crop Sci. 2008, 194, 180–192. [Google Scholar] [CrossRef]
  18. Zegada-Lizarazu, W.; Garcia-Apaza, E.; Ephrath, J.; Berliner, P. Above and below ground development of Acacia saligna shrubs grown under different irrigation frequencies in an arid environment. Plant Soil 2007, 297, 157–169. [Google Scholar] [CrossRef]
  19. Raviv, M.; Wallach, R.; Silber, A.; Medina, S.; Krasnovsky, A. The effect of hydraulic characteristics of volcanic materials on yield of roses grown in soilless culture. J. Am. Soc. Hortic. Sci. 1999, 124, 205–209. [Google Scholar] [CrossRef]
  20. Uçan, K.; Kıllı, F.; Gençoğlan, C.; Merdun, H. Effect of irrigation frequency and amount on water use efficiency and yield of sesame (Sesamum indicum L.) under field conditions. Field Crops Res. 2007, 101, 249–258. [Google Scholar]
  21. El-Hendawy, S.E.; Schmidhalter, U. Optimal coupling combinations between irrigation frequency and rate for drip-irrigated maize grown on sandy soil. Agric. Water Manag. 2010, 97, 439–448. [Google Scholar] [CrossRef]
  22. Howell, T.A. Enhancing water use efficiency in irrigated agriculture. Agron. J. 2001, 93, 281–289. [Google Scholar] [CrossRef]
  23. Anonymous. Meteorological Information Center of China. Available online: https://data.cma.cn (accessed on 9 September 2017).
  24. Hou, M.; Shao, X.; Li, Y. Effects of water and N-15-labelled fertilizer coupling on the growth, N uptake, quality and yield, of flue-cured tobaccos: A two-year lysimeter experiment. Res. Crop 2013, 14, 950–959. [Google Scholar]
  25. Douglas, E.; Beltrán-Przekurat, A.; Niyogi, D.; Pielke Sr, R.; Vörösmarty, C. The impact of agricultural intensification and irrigation on land–atmosphere interactions and Indian monsoon precipitation—A mesoscale modeling perspective. Glob. Planet. Chang. 2009, 67, 117–128. [Google Scholar] [CrossRef]
  26. DeAngelis, A.; Dominguez, F.; Fan, Y.; Robock, A.; Kustu, M.D.; Robinson, D. Evidence of enhanced precipitation due to irrigation over the Great Plains of the United States. J. Geophys. Res. Atmos. 2010. [Google Scholar] [CrossRef]
  27. Aka, A.; Servat, E.; Paturel, J.; Kouamé, B.; Lubès, H.; Masson, J. Analysis of the temporal variability of runoff in Ivory Coast.: Statistical approach and phenomena characterization. Hydrol. Sci. J. 1996, 41, 959–970. [Google Scholar] [CrossRef]
  28. Doorenbos, J.; Kassam, A. Yield Response to Water; Irrigation and Drainage Paper 33; FAO: Rome, Italy, 1979; p. 176. [Google Scholar]
  29. Payero, J.O.; Tarkalson, D.D.; Irmak, S.; Davison, D.; Petersen, J.L. Effect of irrigation amounts applied with subsurface drip irrigation on corn evapotranspiration, yield, water use efficiency, and dry matter production in a semiarid climate. Agric. Water Manag. 2008, 95, 895–908. [Google Scholar] [CrossRef] [Green Version]
  30. Djaman, K.; Neill, O.M.; Owen, C.; Smeal, D.; West, M.; Begay, D.; Allen, S.; Koudahe, K.; Irmak, S.; Lombard, K. Long-Term Winter Wheat (Triticum aestivum L.) Seasonal Irrigation Amount, Evapotranspiration, Yield, and Water Productivity under Semiarid Climate. Agronomy 2018, 8, 96. [Google Scholar] [CrossRef]
  31. Djaman, K.; Neill, O.M.; Owen, C.; Smeal, D.; Koudahe, K.; West, M.; Allen, S.; Lombard, K.; Irmak, S. Crop. Evapotranspiration, Irrigation Water Requirement and Water Productivity of Maize from Meteorological Data under Semiarid Climate. Agronomy 2018, 10, 405. [Google Scholar] [CrossRef]
  32. Elias, F.; María, A.S. Deficit irrigation for reducing agricultural water use. J. Exp. Bot. 2006, 58, 147–159. [Google Scholar] [Green Version]
Figure 1. Daily rainfall (mm) during the 2015 (a), 2016 (b), and 2017 (c) growing seasons at the experimental site.
Agronomy 09 00624 g001aAgronomy 09 00624 g001b
Figure 2. Flue-tobacco actual evapotranspiration (ETa; mm) response to seasonal irrigation amount for the combined years of 2015, 2016, and 2017.
Agronomy 09 00624 g002
Figure 3. Relationship between flue-cured tobacco yield (kg ha−1) and evapotranspiration (ETa; mm) in 2015, 2016, and 2017 during flue-cured tobacco growing season.
Agronomy 09 00624 g003
Figure 4. Flue-tobacco yield (kg ha−1) response to evapotranspiration (ETa; mm) under low, medium, and high irrigation frequency treatments under various irrigation levels.
Agronomy 09 00624 g004
Figure 5. Relationship between flue-tobacco yield (kg ha−1) and irrigation amount (mm) for 2015, 2016, and 2017 growing seasons.
Agronomy 09 00624 g005
Figure 6. Tobacco yield (kg ha−1) response to seasonal irrigation amount (mm) under low, medium, and high irrigation treatments under different irrigation levels.
Agronomy 09 00624 g006
Figure 7. Tobacco yield (kg ha−1) response to seasonal irrigation amount (mm) for the combined years of 2015, 2016, and 2017.
Agronomy 09 00624 g007
Figure 8. Relationship between irrigation water use efficiency (IWUE; kg m−3) and Irrigation amount (mm) in 2015, 2016, and 2017 and pooled data.
Agronomy 09 00624 g008
Figure 9. Relationship between water use efficiency (CWUE; kg m−3) and evapotranspiration (ETa, mm) in 2015, 2016, and 2017 and pooled data.
Agronomy 09 00624 g009
Figure 10. Relationship between water use efficiency (CWUE; kg m−3) and evapotranspiration (ETa, mm) under high, medium, and low irrigation frequencies and pooled data.
Agronomy 09 00624 g010
Figure 11. Relationship between yield (kg ha−1) and water use efficiency (CWUE; kg m−3) under high, medium, and low irrigation frequencies and pooled data.
Agronomy 09 00624 g011
Table 1. Physical and chemical characteristics of experimental soil.
YearField Capatity (%)Bulk Density (g cm−3)Total Nitrogen (g kg−1)Total Phosphorus (g kg−1)Organic Matter (g kg−1)pH
201521.21.321.310.3619.196.98
201621.71.331.320.3417.116.99
201720.41.331.320.3518.036.70
Table 2. Agronomic management practices, including transplanting date, hybrid type, and application date for each experimental year.
Management201520162017
Transplanting date1 May 20152 May 20164 May 2017
End of Harvest date2 Aug 20152 Aug 2016 2 Aug 2017
Growth duration93 days92 days90 days
HybridK326K326K326
Pesticide applicationsType: Pyrethroid
Date: 30 days after planting and 45 days after planting
Bud emergence date under different irrigation frequencies
Low irrigation frequencyDate: 52 to 57 days after transplant
Medium irrigation frequencyDate: 57 to 63 days after transplant
High irrigation frequencyDate: 64 to 70 days after transplant
Table 3. Seasonal irrigation amounts (mm) applied for the low, medium, and high irrigation frequency treatments under different irrigation levels in 2015, 2016, and 2017.
Irrigation Rate201520152015201620162016201720172017
LowMediumHighLowMediumHighLowMediumHigh
100%IRT213224234243254267227267290
85%IRT140168189196201221198235240
70%IRT113118130126134145169190213
RFT000000000
Table 4. Monthly weather variables measured at the experimental site from 2015 to 2017.
YearMonthTmmax (°C)Tmmin (°C)RHmax (%)RHmin (%)Wsmax (m/s)Wsmin (m/s)Rainfall (mm)
2015May26171001422074
June282110019220345
July302310036180231
August322410033200133
2016May24161001332081
June282010028260136
July332610032290274
August34251001735073
2017May28181001632072
June292110022290105
July35271002635072
August322510030350148
Monthly average values were calculated using daily measured values. Tmax, Tmin: daily maximum and minimum air temperature; RHmax and RHmin: daily maximum and minimum relative humidity; WSmax and WSmin: maximum and minimum wind speed at 3 m height; Rainfall: monthly total rainfall.
Table 5. Tobacco actual evapotranspiration (ETa; mm) response to seasonal water supply under high, medium, and low irrigation frequency treatments under various irrigation levels/mm.
EtaLow FrequencyMedium FrequencyHigh Frequency
201520162017201520162017201520162017
100%IRT556569592603614637613605663
85%IRT496519523512537532574584567
70%IRT426445484438432495485465485
RFT365372444365372444365372444
Table 6. Flue-tobacco yield (kg ha−1) for the low, medium, and high irrigation frequency treatments under various irrigation rates in 2015, 2016, and 2017.
Irrigation Low FrequencyMedium FrequencyHigh Frequency
Rate 201520162017201520162017201520162017
100%IRT220621651749230622491791198920181859
85%IRT173520051380174522481465189619991691
70%IRT165419231247160220661345175618341609
RFT131110368321428105686513021124984

