1. Introduction
Nanotechnology has revolutionized the conventional food science and food industry. Nanotechnologically enhanced processes of protecting, processing, packaging, and storing food have become commonplace in our food systems [
1]. The use of nanotechnological solutions may influence the bioavailability and nutritious value of the produced food [
2]. Based on numerous published reports, it can be assumed that the biological properties (including toxicological impact) of nanomaterials are largely dependent on their specific physicochemical parameters [
3,
4,
5]. Research conducted in the agricultural sector and the continuous advances made in nanotechnology are likely to facilitate and bring about the next stage in the development of high-quality crops, animal products, chemical pesticides, and precision farming techniques. Nanotechnology furthers agricultural sciences and helps to reduce environmental pollution by limiting the production pesticides and chemical fertilizers. Nanoparticle treatment results in alterations of the availability and absorption of mineral nutrients by plants [
6]. The use of nanoparticles offers a viable alternative to the currently prevalent methods of plant protection [
7]. Examples of nano-fertilizers have also been described, which, compared to traditional fertilizers, minimize nutrient losses [
8]. The use of nanoparticles in fertilizers facilitates absorption, accelerates plant growth, and increases yields [
9,
10].
Virgin and cold-pressed oils contain mainly triacylglycerols (approximately 95%) and a relatively small content of diacylglycerols, monoacylglycerols, and free fatty acids, including compound groups such as phospholipids, tocopherols and tocotrienols, free and esterified sterols, hydrocarbons (squalene), triterpene alcohols, carotenoids, chlorophylls and other pigments, which constitute highly valued nutritional ingredients [
11,
12,
13]. The inclusion of carotenoids in human diet reduces the content of lipid peroxides in blood plasma, which helps to prevent diseases caused by ROS (reactive oxygen species). Among other benefits, carotenoids reduce the risk of cardiac infraction, stroke, myocardial ischemia, cataract, age-related macular degeneration, Alzheimer’s disease, cancer, and other age-related degenerative diseases [
14].
Eating food containing oxidized lipids may facilitate the formation of reactive oxygen species and free radicals, which in turn may lead to the oxidation of biological membranes and increased mutagenic, genotoxic, and angiotoxic potential. The same can also contribute to the development of cardiovascular disorders [
15]. The process of oxidation is influenced by numerous factors including the availability of oxygen, temperature, heavy metals and metal ions (Ca
2+ and Fe
3+), exposure to light and various chemical factors facilitating the initiation of oxidizing processes [
16,
17]. The above factors may facilitate the formation of free radicals which results in the emergence of peroxide radicals, hydroperoxides, and subsequent chain reactions leading to the presence of secondary oxidation products such as aldehydes, ketones and more single chain unsaturated lipids and triglycerides that can contribute to the oxidative stress in the cells and especially in the chloroplasts [
18].
In the presence of light, chlorophylls and their derivatives are the most active promoters of oxidation processes in olive oil and virgin oils, and therefore significantly influence their oxidative susceptibility [
19]. The effects of exposing olive oil and virgin oils to light at temperatures ranging from 2 °C to 40 °C have been analyzed in detail [
20]. The authors demonstrated the great impact of the intensity of fluorescent light on the rate of oxidation.
Since no reports have been found on the effect of application of metal nanocolloids (Ag and Cu) on oleaginous plants or on the products obtained from processing seeds, the presented study aimed to analyze rapeseed virgin pressed oils and evaluate their quality by measuring the following parameters: (1) content of pigments, i.e., chlorophyll a and b, carotenoids, and an assessment of the oil color; (2) acid number (AN), peroxide number (PN), and oxidative stability; (3) metal content (Ag, Cu, Fe, and Mn) in the oils; and (4) qualitative analysis using the technique of ATR-FTIR spectroscopy.
2. Materials and Methods
2.1. Origin of Plants and Nanoparticles
The test material consisted of a variety of spring oilseed rape (Brassica napus L. var. arvensis) “Feliks” cultivar, from the agricultural station Hodowla Roślin Strzelce Sp. z o.o. Group IHAR.
Nanomaterials used in laboratory and field tests included two commercially available agents supplied in 1.0 dm3 bottles containing silver nanocolloid and copper nanocolloid concentrated at ≥0.1% silver (ITP-1KAg PO) and ≥0.1% copper (ITP-1KCu PO), produced by ITP-SYSTEM Sp. z o.o. in Dąbrowa Górnicza.
2.2. Preparation of Nanocolloid Solutions
The nanosilver and nanocopper colloidal solutions were applied using a 50 mL commercial suspension made up to 1000 mL with sterile distilled water (SDW). In this way, nanocolloid suspensions with concentrations of about 0.01% of silver nanoparticles and 0.005% of cooper nanoparticles were obtained.
2.3. Scanning Electron Microscopy (SEM)
The size and morphology of silver and copper nanocolloids were determined using SEM. After washing in double distilled water and ultrasonication, samples were placed on circular aluminum stubs, skin-dried and transferred into the chamber of a Quanta 3D FEG (FEI) scanning electron microscope. Micrographs were taken with an ETD detector, at the accelerating voltage of 30 kV. The AgNC and CuNC diameter was measured with Nis-Elements Advanced Research software. Particle 104 distribution was derived from a histogram for 300 particles.
2.4. Rape Cultivation in a Field Experiment
The field experiment (split-plot method, in three replicates) was conducted in a two-year cycle during 2016–2017, on average grade, sandy grain soil. At the beginning of experiment, the soil’s abundance in nutrients was: K2O 19.3 mg·100 g−1 soil; P2O5 19.0 mg·100 g−1 soil; Mg 6.4 mg·100 g−1 soil; B 0.61 mg·1 kg−1 soil; Mn 198.1 mg·1 kg−1 soil; Cu 1.51 mg·1 kg−1 soil; Zn 12.58 mg·1 kg−1 soil; Fe 925 mg·1 kg−1 soil; and Mo 0.022 mg·1 kg−1 soil. Mineral fertilization was 35 kg P and 66.5 kg K·ha−1 used in spring before sowing and before vegetation start in the subsequent years of cultivation.
Before sowing, the seeds were divided into three groups: non-soaked in the prepared nanocolloidal solutions, soaked in silver nanocolloid solution, and soaked in copper nanocolloid solution. The 30 m2 plots were established at the experimental farm of the University of life sciences in Lublin located in Czesłowice, Lubelskie Voivodship, eastern Poland.
Two groups of rapeseeds were soaked (processed) for 1 h in the prepared colloidal solutions of nanosilver or nanocopper (ITP-2KAg PO and ITP-1KCu PO), skin-dried (in natural conditions, agitated every 3 h) in a thin, 1 cm layer inside plastic 20-L containers to prepare them for sowing. The control sample comprised non-processed seeds. The prepared material (seeds) was subsequently divided into five experimental variant groups:
Variant I: Non-pelleted seeds sown in the soil and subsequently sprayed during the florescence stage (61–66 BBCH) with the colloidal silver solution—(O)AgNC dosed at 50 cm3·L−1.
Variant II: Non-pelleted seeds sown in the ground and subsequently sprayed during the florescence stage (61–66 BBCH) with the colloidal nanocopper solution (O)CuNC concentrated at 50 cm3·L−1.
Variant III: Non-pelleted seeds soaked in the colloidal nanocopper solution (N/O)CuNC dosed at 50 cm3·dm−3 before sowing, and subsequently sprayed during the florescence stage (61–66 BBCH) with the colloidal nanocopper solution (N/O)CuNC dosed at 50 cm3·L−1.
Variant IV: Non-pelleted seeds soaked in the colloidal nanosilver solution (N/O)AgNC dosed at 50 cm3·dm-3 before sowing, and subsequently sprayed during the florescence stage (61–66 BBCH) with the colloidal nanosilver solution (N/O)AgNC dosed at 50 cm3·L−1.
Variant V: Control sample, non-pelleted seeds that were not soaked in a nanocolloidal solution or sprayed with a nanocopper or nanosilver solution during cultivation.
The adopted dosage of nanocolloids in the field experiment was 50 cm3·L−1. The dosage was selected to minimize the risk of potential adverse effects on the natural environment.
2.5. Oil Pressing
Rapeseed oil was pressed using an expeller with a replaceable nozzle of 8 mm in diameter connected to a continuous sieve system from Farmet DUO. Before operation, the expeller was heated up to 50 °C. Once the press was engaged and stable pressing temperature was reached, the process proper could commence. The temperature was stabilized at approximately 60 °C by pre-pressing oil from roughly 1 kg of seeds. The pressing temperature was measured using an AD 20TH digital thermometer from Amarell-ama-digit. After pressing, the oil was stored in 200 cm3 dark glass bottles at 5 °C to allow natural separation over six days, and subsequently decanted and submitted for further analyses.
2.6. Measurement of the Acid Number (AN)
The measurement of the acid number (AN) was conducted in accordance with the applicable PN-EN ISO 660:2005 [
21] standard. The method entails neutralization of free fatty acids present in the sample with a KOH solution. The results were expressed in mg KOH·g
−1 and estimated as a triplicate average.
2.7. Measurement of the Peroxide Number (PN)
The measurement of the peroxide number (PN) was conducted in accordance with the applicable PN-EN ISO 3960:2012 [
22] standard. It entailed the quantitative determination of iodine released from potassium iodide under the influence of peroxides present in the analyzed fat. The results were expressed as mmolO·kg
−1 and estimated as a triplicate average.
2.8. Measurement of Oxidative Stability
Oxidative stability was measured with the use of a Rancimat 670 device (Metrohm AG, Herisau, Switzerland). Oil samples (2.5 g) were measured out into reaction dishes and heated at 120 °C in a 20 dm
3·h
−1 jet of hot air, in accordance with the applicable PN-EN ISO 6886:2009 [
23] standard. The time required to reach the conductivity inflection point was registered as induction time (IT) and expressed in hours. Normal time was determined on the basis of the induction time using the validation index calculated for the induction time relative to sample temperature. Normal time was calculated using StabNet software controlling the Rancimat device.
2.9. Measurement of Pigment Content in Oil
The measurement of chlorophyll
a, chlorophyll
b, and carotenoid concentrations in the pressed oil samples were performed with the spectrophotometric method using a bi-compound Jasco V-630 spectrophotometer with a UV-VIS radiation beam. The method of establishing the pigment content entailed 20-fold dilution of the oil samples in acetone, after which their absorption spectra were measured within the range of 350–750 nm. The results were expressed in μg·mL
−1 and estimated as triplicate average in accordance with the Lichtenthaler and Buschmann method [
24].
2.10. Measurement of Oil Color
The colorimetric measurements were performed using a CR-221 Chroma meter (Minolta, Osaka, Japan) with 45° perimeter illumination and 0° viewing angle measurement geometry. A pulsed xenon lamp (D
65—6504K) was used as the light source. The measuring area diameter amounted to 3 mm. Measurements were conducted in CIE Lab color measuring mode (CIE L* a* b*) [
25]. The three coordinates of the CIE Lab color evaluation system represent L* for brightness (0 for black and 100 for white), a* for red–green scale chromaticity (negative values for green and positive values for magenta) and b* for blue–yellow scale chromaticity (negative values for blue and positive values for yellow). The instrument was calibrated for a white ceramic plate (CIE L* = 99.25, a* = 0.60, b* = 1.87). Before the analysis, samples were allowed to equilibrate for 2 h at room temperature. The standard 10 mm polypropylene cuvettes were filled with 4 cm
3 of the samples. The cuvettes were covered with cardboard from three sides (whiteness *****), except the side directed towards the measuring head, to provide a white background. The measurements were carried out in a darkened room to exclude interference from external light sources. To ensure reproducibility of the instrument measurement, L* a* b* color coordinates were recorded in at least triplicate for each sample and averaged. Background measurements were made under identical conditions using a cuvette filled with distilled water. The following color parameters were calculated from the obtained CIE Lab coordinates: h (hue angle), Chroma (C*), and distance from the background (ΔH), where:
Indices 1 and 2 refer to sample and background, respectively.
2.11. Measurement of Metal Content
Oils of 500 ± 1 mg portions were poured with 5 mL of concentrated HNO
3 (Sigma Aldrich, Steinheim, Germany) and wet-ashed. Samples were mineralized in Teflon vials (DAP 100 type) using the Microwave Digestion System (Berghof Speedwave, Eningen, Germany) with optical temperature and pressure monitoring of each individual sample during acid digestion. Mineralization was performed in the following steps: (1) 15 min raising temperature from room to 140 °C; (2) 5 min at 140 °C; (3) 5 min raising temperature from 140 °C to 170 °C; (4) 15 min at 170 °C; and (4) cooling to room temperature (variable time). The pressure level during mineralization did not exceed 12 bar. After this process, clear solution of elements was cooled to room temperature, transferred to a 50-mL volumetric flask and poured with demineralized water (ELGA Pure Lab Classic) to the indicated level. To determine concentrations of particular elements, Inductively Coupled Plasma Optical Emission Spectrometer (ICP-OES; Thermo Fisher Scientific iCAP Series 6500, Fremont, CA, USA) equipped with a charge injection device (CID) detector and controlled with iTEVA software was used. Standard parameters, as previously published by Sujak et al. [
26], were set. Multi-element stock solutions (Inorganic Ventures) were used as standards.
Analyses were run on all oil samples and additionally on a blank sample (5% HNO3). To control the accuracy of the method under existing working conditions, a certified reference material, TraceCERT—Periodic table mix 1 for ICP (Fluka Analytical, Sigma Aldrich Steinheim, Germany), was used. To calculate the recovery percentage, three randomly selected samples were supplied with known amounts of the analytical standard. The analytical procedure was checked using Quality Control Standard 28 (IV-28) from Inorganic Ventures.
2.12. Measurement of ATR-FTIR Spectra
The measurements of the infrared spectra for the analyzed oils were conducted using a Vertex 70 FTIR spectrometer (by Varian). The device’s ATR (attenuated total reflection) extension utilizes a ZnSe crystal of the appropriate geometry (cut at 45°) to allow twentyfold internal bounce of the absorbed bean. During the test, 16 measurement scans were registered; the spectra were subsequently averaged by software. Before the measurement, the ZnSe crystal was cleaned using ultra-clean solvents by Sigma-Aldrich. Prior to the measurement (1 h) and during the entire analysis, a neutral N2 atmosphere was maintained inside the measurement chamber. Spectral measurements were taken within the range of 4000–500 cm−1 at the resolution of 2 cm−1. Spectral analysis and result processing was conducted using Grams/AI software by ThermoGalactic Industries (Salem, MA, USA). All spectra were measured at 23 °C.
2.13. Statistical Analysis
The obtained results were analyzed statistically. For all variables, the mean values and standard deviations were calculated, and the post hoc Tukey’s test (HSD) as well as correlation matrices were performed. The analysis was conducted at the significance level of p < 0.05. The results are presented as n = 9 means ± SD. The calculations were performed using Statistica 10 software from Statsoft.
2.14. Hierarchical Cluster Analysis (HCA)
Cluster Analysis (CA) is a method for dividing a group of objects into classes, so that similar objects are in the same class. We assumed that the groups are not known before the mathematical analysis and no assumptions were made about the distribution of the variables. Therefore, CA was used to identify objects located closely together in the variable space.
Hierarchical Cluster Analysis (HCA) is a cluster analysis method that seeks to build a hierarchy of clusters. We can use any valid metric as a measure of similarity between pairs of observations. It means that the samples in the same clusters show many similarities, whereas samples in different clusters are dissimilar [
27].
In the present study, we applied HCA to Euclidean distance between considered FTIR spectra of oils samples. To establish the distance matrix for samples under cluster analysis, absorbencies were selected as a measure for the cluster analysis in FTIR. The hierarchical cluster analysis and dendrogram were performed with Stastistica 13 software.
2.15. Similarity Evaluation
To obtain the cosine between the orientation of two IR spectra, where
xi and
yi are the
i-th elements in two different fingerprints,
x and
y, respectively, we can using the congruence or correlation coefficients in the following formulas, respectively [
28,
29]:
where
,
and
num denotes the number of FTIR data. For standardized fingerprints, both coefficients give the same results.
2.16. Principal Component Analysis (PCA)
The PCA was based on the data array of the fingerprints of the FTIR spectra of each analyzed sample. The first several scores of the PCA results were used to make a projection plot that provided a visual determination of the similarity between the respective fingerprints of FTIR spectra. Origin Pro software (Origin Lab, Northampton, MA, USA) was used for the purposes of PCA in this study.
3. Results
The size of nanoparticles in the nanocolloid solutions used for the study was measured with the use of scanning electron microscopy (
Figure 1). The estimated sizes were 13.3 ± 3.6 and 38.3 ± 10.9 nm for AgNC (
Figure 1A) and CuNC (
Figure 1B), respectively. To ensure a high level of dispersion of the analyzed nanoparticles, the colloid samples were treated with ultrasound prior to the measurement. In the case of silver nanoparticles, the visualization showed nanoparticles with a clear granular structure, without visible areas containing nanoparticle agglomerates. Despite using similar methods, in the case of copper nanoparticles, complete deagglomeration of the sample was not achieved. The same suggests that the nanoparticle size obtained in the SEM experiment may have been somewhat overestimated due to charges and coating on particle surfaces [
30].
Table 1 presents the carotenoids and chlorophyll
a and
b content in the oil pressed from rapeseeds harvested from plants grown after pre-soaking the seeds before sowing and spraying the plants with the use of nanosilver and nanocopper colloid solutions (AgNC and CuNC). The pigment content in the analyzed samples from both years of the field experiment (2016 and 2017) was higher than that observed in the control. In 2016, chlorophyll
a (chl
a) content in the oil from the control sample was 7.72 μg·mL
−1, chlorophyll
b (chl
b) was 3.36 μg·mL
−1, and carotenoids (car) was 80.45 μg·mL
−1. Spraying the plants with (O) AgNC and (O) CuNC nanocolloids resulted in a significant increase in the content of both chl
a and chl
b relative to the control. The respective increase was, respectively, 13.0% and 43.75% after the application of silver nanocolloid. After spraying the plants with copper nanocolloid (O) CuNC, the respective values increased by 21.24% and 37.79%. In the case of carotenoid content after single application, i.e., only spraying the plants with the nanocolloids, a significant decrease of the values, by 7.29% and 9.58%, was observed relative to the control. For plants grown from seeds soaked and sprayed with (N/O) AgNC nanocolloid, the total chlorophyll
a and
b content in oil was 13.36 μg·mL
−1, which was statistically significantly higher relative to the control—by 11.14% in the case of chlorophyll
a and 42.3% in the case of chlorophyll
b. The carotenoid content in the analyzed oil was 2.67% lower than in the control. A similar correlation was observed in the case of copper nanocolloid applied in the (N/O) CuNC variant. The total chlorophyll content in the oil under this variant was 15.10 μg·mL
−1 and both chlorophyll levels were higher after application of nanocolloid at the concentration of 0.005% or 0.01% as compared to the control. The increase was statistically significant—21.11% (for chl
a) and 71.13% (for chl
b).
Application of 0.01% silver nanoparticles and the 0.005% of cooper nanoparticles to the seeds and growing plants was positively (R2 = 0.53) and strongly (R2 = 0.76) correlated, at the significance level of p < 0.05, with the content of chlorophyll a and b in rapeseed oil.
In 2017, the pigment content was also relatively high at the levels of, respectively, 7.85 μg·mL
−1 (chl
a), 3.24 μg·mL
−1 (chl
b), and 78.59 μg·mL
−1 (car). After soaking the seeds and spraying the plants in the (N/O) AgNC sample, the total chlorophyll level was 11.86 μg·mL
−1. This value was statistically significant relative to the control only in the case of chl
b, where the increase of 35.50% was observed, and carotenoids, which increased by 10.30%. After the application in (N/O)CuNC, we observed a significant increase with respect to all the analyzed parameters by, respectively, 26.11% (chl
a), 34.25% (chl
b), and 2% (car) (
Table 1.).
Application of nano-colloids to the seeds and growing plants was positively (R2 = 0.67) correlated, only with the content of chlorophyll b in oils at the significance level of p < 0.05.
The L*, a* and b* color parameters for oil pressed from rapeseeds grown during 2016–2017 are presented in
Table 2. Oil samples from 2016 were relatively dark as indicated by the low value of L* (relative sample brightness)—from 5.28 in the oil under the (N/O) AgNC variant to 7.96 in the control. The application of Ag and Cu nanocolloids contributed to the reduction of the L* parameter in all variants of the experiment, although statistical differences were found only after twofold (N/O) AgNC application, both relative to the control and other experimental variants. Positive a* values (between 3.96 in (N/O) AgNC oil and 4.67 in (O) CuNC oil) indicate admixture of the red tint in the general yellow color of oils (positive values of parameter b*: between 6.45 and 11.07). A statistically significant reduction in the a* parameter relative to the control was observed in (N/O) AgNC (twofold application of Ag nanocolloid). No statistical differences were found between the experimental variants. In the case of parameter b*, a statistically significant decrease in its value was observed in all cases after the application of nano-Ag and -Cu, as compared to the control. In the case of the (N/O) AgNC experimental variant, a statistically significant decrease in parameter b* was observed compared to other variants of the nanocolloid application. No statistical differences between oils were found in the case of hue angle h (values between 1.02 and 1.17). A statistically significant decrease of chroma C* was observed for all variants treated with nanocolloid as compared to the control. The largest decrease of this parameter was observed in (N/O) AgNC (37.05%) and (O) AgNC (14.65%) experimental variants. This indicates that the colors became less pure. The highest distance from background ΔH in the case of control oil (14.87) indicates that it has the most intensive color, which statistically significantly differs from the color of other oils. This value for oil obtained from seeds under the (N/O) AgNC experimental variant was lower than the value obtained in the control by 22.19% (11.57), and in the case of the (N/O) CuNC by 22.39% (11.54).
L* values for the samples from 2017 indicated fairly dark colors (from 2.12 for (O) CuNC to 8.39 for control). The control oil was slightly brighter compared to the control from the previous year (no statistical differences). Interestingly, the application of nanocolloids resulted in a greater reduction of L* compared to the control than in the previous year (maximally 6.27 L* units in the case of (N/O) CuNC oil, 2.68 in the previous year for the (N/O) AgNC sample). The a* parameter ranged between 3.26 for (N/O) CuNC oil and 4.40 for the control, whereas the values of b* ranged from 0.84 for (N/O) AgNC to 8.74 for the control oil. A statistically significant decrease of these parameters in the analyzed oils was observed for all variants of the experiment, as compared to the control sample.
Although no statistical differences were found, one can observe a decrease of the hue angle value.
Similar to 2016, ΔH indicates that the 2017 control oil had the most intense color and statistically significantly differed in color from oils obtained after the double application of either nanocolloid.
The adopted primary factors describing the oil’s stability included the acid number (AN), peroxide number (PN), and oxidative stability (
Table 3). In 2016, the control oxidative stability was 5.72 h for the induction time, and 25.48 h for normal time. The analysis of oil pressed from material obtained after the soaking and spraying treatment of (N/O) AgNC plants revealed a higher stability of the oil relative to the control. The induction time was 5.68 h and the normal time 26.46 h, i.e., respectively, 20.34% and 4.0% higher than in the control. After the application of the copper nanocolloid in the (N/O) CuNC variant, the induction time was 5.70 h and the normal time 29.32 h, i.e., respectively, 21.19% and 17.07% higher. The rapeseed oil in the (O) AgNC variant (one-fold application of nanocolloids) had the induction time of 4.82 h, which indicated a 2.12% increase of stability, but reduction of normal time to 25.46 h. In the (O) CuNC variant, the oil induction time increased by 6.99% relative to the control and the normal time statistically significantly increased by 7.22%.
Application of nanoparticles was strongly positively (R2 = 0.91) correlated, at the significance level of p < 0.05, with the induction time and the normal time in the analyzed oil samples.
The AN value for the control oil was 1.90 mg KOH·g
−1, and after the application of nanocolloids, the respective values were within the range of 1.92 to 2.89 mg KOH·g
−1 (
Table 3.). There were slight discrepancies in AN values for samples treated with AgNC and CuNC relative to the control. The obtained values were higher than in the control sample by between 1.58% (N/O) CuNC and 52.11% (N/O) AgNC, the latter showing threshold statistical significance.
The peroxide number (PN) values in rapeseed oil obtained from samples treated with nanocolloids were similar and higher than the value obtained for the control sample, i.e., 3.16 mmolO·kg−1. After spraying with nanocolloids, the same was statistically significantly increased by 49.4% for (O) AgNC, 37.9% for (O) CuNC, and 38.92% for (N/O) AgNC. It appears that increase in PN number is a stress response.
The AN values recorded for virgin oil pressed from the 2017 control sample showed higher oxidative stability when compared to the previous year. The obtained value of 5.52 h was 17% higher than that from 2016. In the case of nanocolloid application, the oil’s oxidative stability was increased, but not to a statistically significant degree, after the treatment of both seeds and plants with the use of either nanopreparation. For (N/O) AgNC and (N/O) CuNC the value was respectively 1.5% and 2.5% higher compared to the control. The obtained normal time values were higher compared to the control (28.8 h) in most experimental variants. They were within the range from 27.40 h to 29.9 h, which constituted an increase by between 0.74% for (O) CuNC and 9.93% for (N/O) AgNC.
AN for the control sample oil was 1.95 mg KOH·g
−1, and after the nanocolloid treatment, the value was within the range from 1.92 to 2.79 mg KOH·h
−1 (
Table 3). After the application of nanosolutions, the acid number of the analyzed oil increased. However, the only statistically significant change was observed after double application of silver nanocolloid (N/O) AgNC where the value increased by 100% relative to the control.
The concentration of nanoparticles was strongly positively (R2 = 0.77) correlated, at the significance level of p < 0.05, with the acid number (AN) in the analyzed oil samples.
The peroxide number of the control sample was 2.10 mmol O2·kg−1. After nanocolloid treatment, a statistically significant increase thereof was observed in all experimental variants, ranging from 52.4% for (N/O) CuNC to 115% for (N/O) AgNC.
The metals with prooxidative characteristics in the process of oil autooxidation include, e.g., iron, copper, and manganese. In 2016, the content of silver in the studied oil samples increased, regardless of the nanocolloid treatment, although the increase was not statistically significant (
Table 4). In most cases, the copper content in the oil decreased. Statistically significant changes were observed after soaking seeds and spraying plants with (N/O) CuNC where the copper content decreased by as much as 98% (0.01 µg·g
−1) compared to the control (0.55 µg·g
−1). Application of silver nanocolloid resulted in Fe content decreasing by 0.02% in the one-fold sprayed sample, and in the case of double application (soaking and spraying) it increased by 9.5% relative to the control. The content of manganese (Mn) slightly increased in both experimental variants, respectively, by 3% and 17% relative to the control. After the application of the nanocopper solution, in both experimental variants (O) CuNC and (N/O) CuNC, the values increased compared to the control, respectively, by 6.0% and 6.26%.
In 2017, the content of silver in the analyzed oils increased relative to the control (
Table 4). The highest increase was observed after one-fold nanocolloid application—172% (3.10 µg·g
−1) compared to the control (1.14 µg·g
−1). In the case of double application of (N/O) AgNC, the value was 2.86 µg·g
−1, i.e., 152% higher than in the control. Increased silver content in oil was also observed after both single and double application of the copper nanocolloid (86% and 74%, respectively, for (O) CuNC and (N/O) CuNC).
Fe content after single and double treatment with silver nanocolloid increased by 4.85% and 9.44%, respectively, relative to the control. Similar effect was observed for Mn content (statistically significant increase by 19.12% and 46.0%, respectively).
A slight increase in Cu content in all variants except double application of the silver nanocolloid (N/O) AgNC was observed where it decreased to 0.55 µg·g−1, i.e., by 4.0% relative to the control. After both single and double application of the nanocopper solution, the Fe content increased by 8.0% and 11.5%. In the case of Mn, a statistically significant increase of 120.5% and 130.8%, respectively, relative to the control was observed.
Figure 2 presents the ATR-FTIR spectra for the studied samples of oil produced in 2016 (gray broken line) and 2017 (black solid line).
Tables S1 and S2 present all the characteristic bands observed in the oil samples selected for the study. The respective spectra were assigned to vibrations corresponding to particular functional groups.
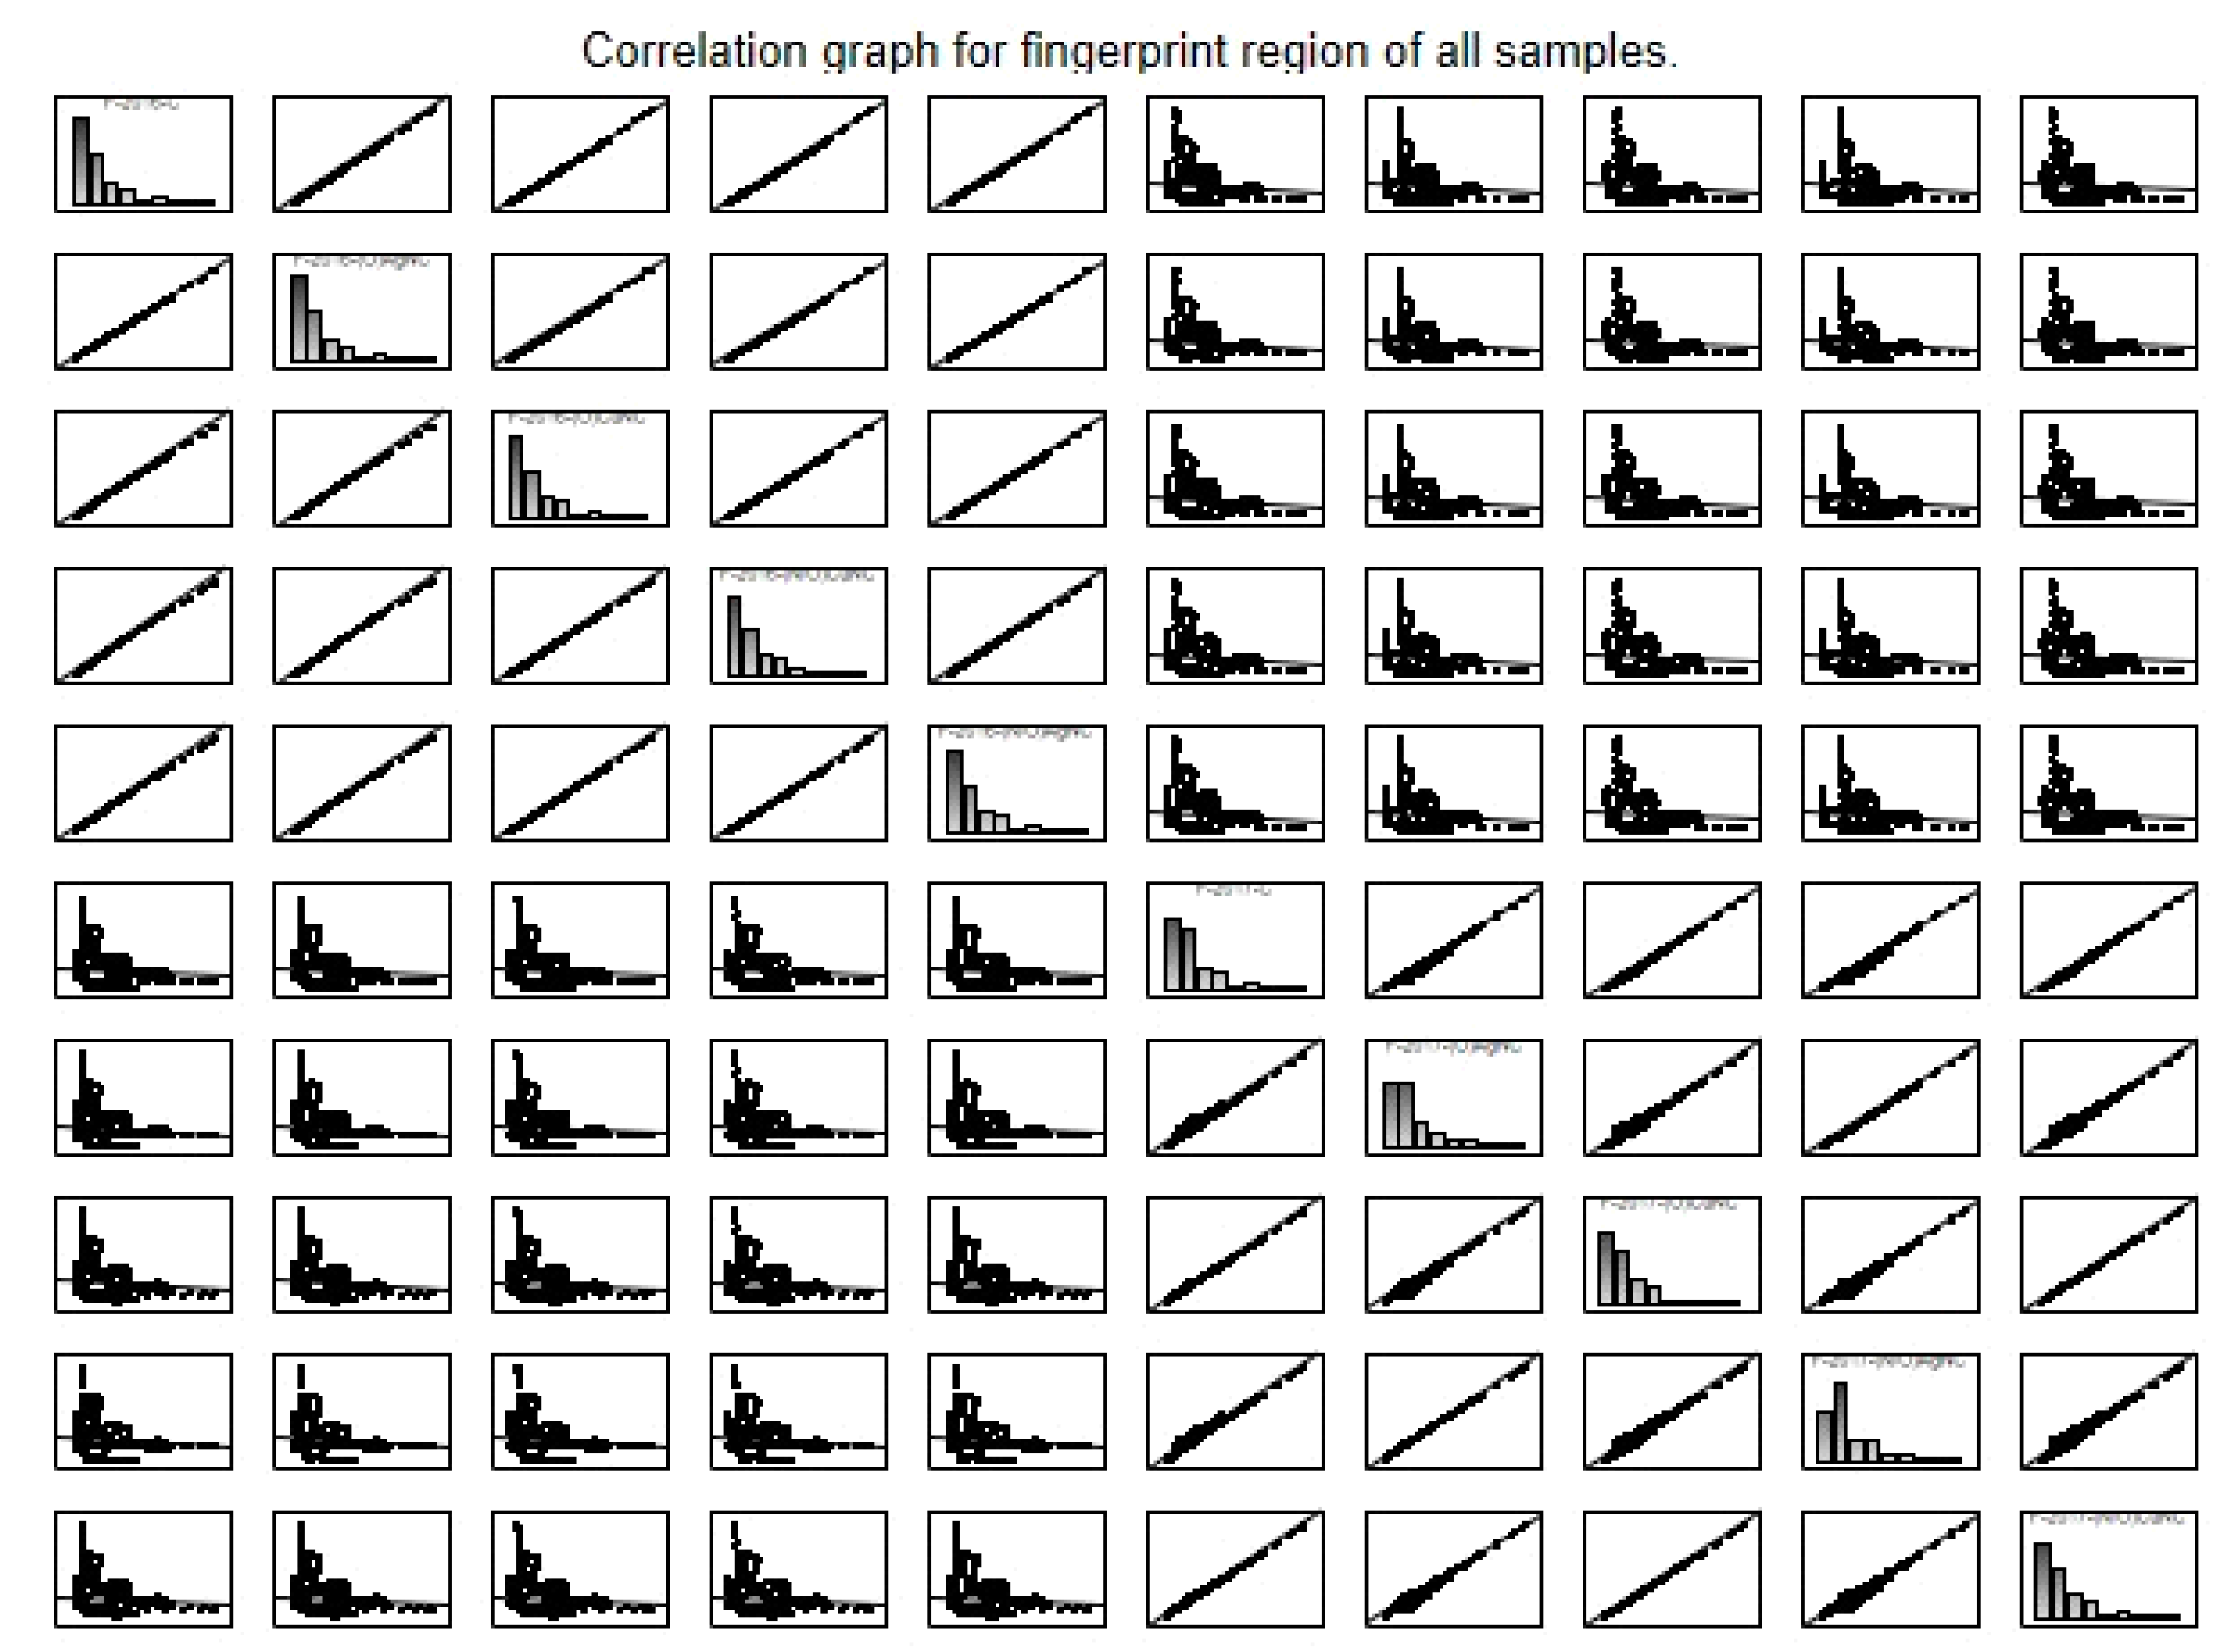
HCA was performed to observe similarities or dissimilarities between the oil samples. The dissimilarity of different clusters was defined by Euclidean distance and calculated by single linkage method. The results obtained were presented in the dendrogram structure, showing the different groups.
Figure 3 presents the plot obtained from the 10 oil samples. Considering the cut-off of 0.7 dissimilarity units, we can distinguish three clusters. The first, biggest cluster, aggregated on the far left arm of the dendrogram. This cluster was formed in five oils from 2017. The second cluster was composed of oil samples from 2016. Two samples, namely control and fertilized with nanocopper, were aggregated in third cluster on the right arm of the dendrogram. Hierarchical cluster analysis shows that the samples from all variations closely depend on the species and the type of fertilization.
The similarity analysis of the IR spectra of the 10 oils samples is provided in
Table 5. As shown in
Table 5 (visualization in
Figure 4), the FTIR spectra of oils from 2017 with different nanometals showed over 0.98 similarity, which indicated that the oils in these samples were generally similar. This confirmed the results obtained in the HCA. However, the similarity values for oils from 2017 and 2016 samples were very low. Samples F-2017-(O) CuNC and F-2017-(N/O) CuNC had the lowest absolute similarity value (0.07). These results indicate that significant differences in samples compositions existed between the respective years.
To more precisely discriminate the relationship between the investigated objects, the 1850–700 cm
−1 band was selected as the fingerprint characteristic spectra and PCA was chosen at the main method of analysis [
31]. As shown in
Figure 5, a three-dimensional scatter plot with the principal components PC1, PC2 and PC3 was obtained from the FTIR spectra of different oil samples after PCA. To receive more information about the essential differences of oil compounds using the PCA model, loading factors were abstracted, and the loading factors atlas was drawn at a range of wave numbers between 1850 cm
−1 and 700 cm
−1 (
Figure 6). PC1, PC2 and PC3 are main factors in the PCA model with a high contribution rate of PC1 which amounts to 87%. It means that PC1, PC2 and PC3 are sufficient for the illustration of the discrepancies in the composition of different oil samples. Peaks with the lowest contribution rate to PC1 included peak with maximum at c.a.–1400 cm
−1 and 1670 cm
−1 (
Figure 6A). These peaks were closely related to the characteristic absorptions originated from methyl groups in aliphatic chains of the examined oils [
32]. Peaks with the lowest contribution rate to PC2 included –1160 cm
−1 (
Figure 6B). This peak was strongly associated with vibrations of the methylene group. In this case, deformational vibrations in this group appear at the wavenumbers of 1160 cm
−1 and 1158–1163 cm
−1. Peaks with a larger contribution rate to PC3 include peaks corresponding to the lowest contribution to the rate of PC1 (
Figure 6C). These results indicate that the differences between considered oils are mainly reflected in the different shape of the bands located between 1780 cm
−1 and 1670 cm
−1. This result agrees with that of the FTIR analysis. The use of FTIR combined with PCA can more objectively assess the quality of the investigated samples.
The first principal component was the most important ingredient, and its variance contribution ratio was 87%; the second principal component showed a variance contribution rate of 12.1%, and the third principal component of 0.8%. The first three main components provided 99.9% contribution ratio in total, with only 0.01% of the information being lost. This indicates that the first three principal components expressed 99.9% of all information.
Samples F-2016-C and F-2016-(O)AgNC (Group II) were closely related in the three-dimensional graph (
Figure 5.) and were clearly classified as a separate group. Although the remaining samples from 2016 belonged to a different group, these three were still classified as a region close to Group III, presumably due to the method of fertilization. In addition, the IR spectral characteristics of samples from Group I revealed significant differences from the other five samples and had the greatest distance with the same in the scatter plot (
Figure 5).
This result correlates with that of the hierarchical cluster analysis and the similar analysis of FTIR fingerprint of oils. As we know, the scatter plot does not classify objects at every distance level as accurately as the clustering graph, but it can clearly reflect the relationships between the investigated objects. Therefore, the use of complementary analytical methods provides researchers with important information about the quality of oils.
4. Discussion
The effect of nanoparticles on plants is a relatively new area of research. The effects of nanoparticle interactions with plants can range from small changes in the soil environment to changes in the morphology of physiology and plant genetics. Although the mechanism of interaction of nanoparticles with plants is not fully understood, it is assumed that, depending on their properties, they can form complexes with transport proteins or root exudates, as a result of which they can be transferred to the plant system [
33]. Apart from uptake of nanoparticles through roots, foliar uptake is also possible as they are able to penetrate leaf surfaces through stomata [
34].
The effect impact of nanomaterials on plants is quite complex. Even the same type of nanoparticles can interact differently with biological systems (registered effects can be positive, negative or neutral) and species-dependent. The effect can be also dose-dependent which means that the same nanomaterials which can be toxic at high concentrations can bring up positive effects at low when their concentration is low [
35]. Of importance are also the species of plants treated with nanoparticles. Beneficial effects of some kinds of nanoparticles on certain plant species are manifested in increasing the seed germination, increasing yield or in plant disease control [
36,
37].
On the other hand, crops subjected to nanoparticles can exhibit adaptive processes in response to stress, which include endocytosis of nanoparticles, modification of genes involved in cell division, and reduced photosynthesis, fruit yields, nutrition quality and nitrogen binding, among others [
38].
There is no information in the literature on the impact of nanoparticles on the quality of plant products such as oil obtained from seeds. For this reason, it is difficult to provide mechanisms responsible for changes in the physico-chemical properties of oils.
Carotenoid and chlorophyll pigments are present in all plant oils and their content depends on the cultivar and maturity of the raw material, as well as the production and refinement methods applied [
39]. As observed by Ciecierska and Obiedziński [
40], virgin oils obtained without the use of chemical refinement methods may be valuable food products provided that they do not contain harmful chemical or microbiological impurities, including mycotoxins, metals accelerating the oxidation processes (iron, copper), or chlorophyll pigments which are usually removed in the course of chemical refinement. Excessive content of chlorophyll negatively affect the quality (smell) and oxidative stability of oil [
41,
42] due to its prooxidative properties, it also darkens the color of the product [
43]. Apart from chlorophyll pigments, rapeseeds also contain considerable amounts of carotenoids. The presence of carotenoids in oil is important due to their antioxidant provitamin properties [
44].
The content of pigments (chl
a, chl
b, and carotenoids) in the virgin oil obtained from rape seeds harvested during the field experiment in both 2016 and 2017 was, in most cases, statistically significantly higher relative to the control. The content of these pigments compared to oil pressed from traditionally cultivated seeds (using standard plant protection agents) tends to be higher. In cold pressed oils, e.g., from winter rapeseeds harvested from a traditional cultivation, the content of chlorophyll
a and
b as well as carotenoids was significantly lower, specifically 1.23 μg·mL
-1 (chl
a), 2.02 μg·mL
−1 (chl
b), and 8.41 μg·mL
−1 (carotenoids) [
45].
Ghorbanpour and Hatami [
35] showed that the application of silver nanoparticles on
P graveolus caused changes in the content of photosynthetic pigments depending on the dose of nanoparticles. Small doses had a stimulating effect on the synthesis of pigments and large ones caused its inhibition. An increase in chlorophyll content under the influence of nanoparticles has also been observed [
46] for
Brassica juncea.
As previously published [
35], such an effect can be produced when plants activate their defense mechanisms by changing antioxidant compounds to combat the stress.
The changes in the content of pigments can be additionally confirmed by the analysis of color of the samples. It indicates that oils from plants treated with nanocolloid are darker in color (lower L*) but have similar shade of yellow (no difference in h although positive h values indicate the addition of green in the general yellow color). A decrease in the amount of admixture responsible for the red color is also observed as indicated by the decrease in a* and b* parameters (indicating lowering of carotenoid pigments). Chroma C* indicates the color saturation, i.e., the proportions at which the dominant color is mixed with white, black or gray, and is therefore a measure of the purity and intensity of color in subjective terms. The more saturated the color is, the more it is perceived as more vivid and bright. The measurements show that all the oils treated with nanocolloids became less vivid, which can be caused by the increase in chlorophyll content.
For the difference between two colors in the three-dimensional L* a* b* space, ∆H is the Euclidean distance between two points, in this case measured against the background. ∆H = 1 is the smallest color difference the human eye can see. As seen from the data, it is difficult to see the difference with a bare eye.
Samples from the second year showed a higher level of darkness compared to the previous year. It is very difficult to explain this phenomenon both for 2016 and 2017 as it cannot be directly connected to the presence of photosynthetic pigments since the examined oils contain similar amounts of chlorophylls (green color) and carotenoids (yellow and red color) (see
Table 1).
Generally lower a* and b* values were observed in the second experimental year, which indicates lower yellowness of the samples and a smaller contribution of the red/magenta shade in a general yellow color.
Although no statistical differences were found, one can observe a decrease of the hue angle value. This indicates that the basic yellow color is clearer than that observed in 2016.
Oxidative stability is a measure of oil quality, particularly with regard to virgin oils containing natural antioxidants (e.g., carotenoids), as well as undesirable prooxidative substances (e.g., chlorophylls and metals) that are normally eliminated in the refinement process [
47]. Rancimat tests indicated that cold pressed rapeseed oil was characterized by induction times within the range of 4.05–4.5 h [
48,
49]. The conducted experiment revealed that oils pressed from spring rapeseeds in the variants using nanocolloids were characterized by higher oxidative stability compared to the control (4.72 h). Seed treatment using nanocolloids followed by spraying the plants with the same during the growth stage contributed, in most cases, to increased oxidative stability of the analyzed virgin oil in both years of the experiment, up to 5.70 h (N/O) CuNC in 2016 and 5.66 h (N/O) CuNC in 2017.
The process of oxidation is affected by a number of factors, including atmospheric oxygen, heat, heavy metals, or light exposure, all of which facilitate initiation of the oxidation process. The presence of trace metals in oils may be of natural origin or due to the processes employed in the course of cultivation and seed processing. Their presence is dependent on, e.g., seed processing itself (including stages such as bleaching, hardening, refinement, or deodorization), corrosion of the processing equipment, packaging procedures, and residual traces of fungicides used during cultivation [
50].
The presence of heavy metals in oils may negatively affect their smell and taste. Catalytic oxidation of oil with molecular oxygen by metal ions (particularly copper) leads to so-called oil rancidity [
51]. Metals such as iron, copper, chromium, zinc, and cobalt present in rapeseed oil undergo further reactions under the influence of visible light [
52].
In our study, in both the first year and second year of cultivation, we observed elevated silver content in the analyzed oil under both experimental variants [(O) AgNC and (N/O) AgNC]. Moreover, the oils showed an increase in iron and manganese content, proportional to the amount of the nanosilver solution used.
Other factors, apart from high chlorophyll content, negatively affecting oil durability may include the presence of free fatty acids, as measured by the acid number (AN), and peroxides, measured by the peroxide number (PN) and treated as the indication of the oil’s oxidation (rancidity). These values indicate the initiation of triglyceride hydrolysis and oxidation both in the seeds and the oil. In the oils pressed for the experiment, said values were elevated as compared to the control but did not exceed allowable levels [
53]. The highest AN value was recorded for the oil obtained from plants subjected to twofold treatment with silver nanocolloid (N/O) AgNC 2.89 mgKOH·g
−1 in 2016 and 2.65 mgKOH·g
−1 in 2017. In the case of PN, the highest values were observed in oils obtained from plants subjected to one silver nanocolloid treatment (O) AgNC 4.72 mmolO·kg
−1 in 2016 and two copper nanocolloid treatments (N/O) AgNC 4.53 mmolO·kg
−1 in 2017. The registered values were higher from those reported in other studies on cold-pressed oils [
54,
55,
56].
It should be noted that all infrared spectra (ATR-FTIR) registered for the oils, in both the first and second year of the experiment, revealed very intensive and clear spectra attributable to specific vibrations of particular functional groups present both in typical food ingredients as well in potential materials characteristic of biodiesel fuel. The vast majority of both edible oils and potential fuel oil materials consist primarily of various triglyceride fractions, while the main differences between them are mostly due to the degree and from non-saturation of acyl groups present therein as well as, most importantly, the length of their chains [
57]. There have been many reports pertaining to the association of the spectral bands of both plant and animal oils [
32,
58,
59] with specific vibrations of molecules or groupings thereof. However, many bands remain difficult to conclusively associate with specific functional groups.
The analyzed oil samples from both years of the experiment revealed relatively similar infrared spectra. It should be noted, however, that depending on the selected method of fertilization using different nanocolloids, certain differences do appear. Firstly, there were observable differences in terms of band intensity (not shown due to the fact that the spectra were normalized in the peak associated with vibrations of the carbonyl C=O group). Secondly, the registered spectra showed slight differences in terms of band location.
One should also mention the vibrations in the region from 900 to 650 cm
−1, which correspond to the characteristic deformation vibrations of the –HC=CH– groups (
cis-conformation, out-of-plane) and wagging vibrations of the same (δ(–(CH
2)n– and –HC=CH– (
cis-)) [
32,
57].
Next, as we pass to vibrations in higher wavenumber ranges differences are visible in =C–H stretching vibrations (
tarns-transformation) with the maximum at approximately 3060–3066 cm
−1 (
Tables S1 and S2) originating from the vibrations of triglyceride fractions [
57,
60] (low intensity in
Figure 2). In turn, for the =C-H stretching vibrations in the
cis-configuration, very characteristic and intensive vibrations were present with the maximum at approximately 3005–3008 cm
−1 (
Figure 2 and
Tables S1 and S2). Vibrations with the maxima at approximately 2952/5, 2922/4 and 2852/3 cm
−1 originated from the stretching vibrations of –C-H in –CH
3, CH
2 groups belonging to the aliphatic groups in triglycerides [
32,
33,
56,
57,
59].
The spectra of the analyzed oil samples (from different experimental periods) after the application of different spraying/fertilization regimens with colloids containing nanostructures (
Figure 2) show clear differences in the shape of the spectra in the region of 1780–1670 cm
−1.
Apart from the visible differences in terms of bands with the maximum at approximately 1710–1715 cm
-1, it is also worth noting the possibly most important emergence of a very clear band with the maximum at approximately 840 cm
−1 (
Figure 2B,D) which may originate from the metal-oxygen (Cu–O) stretching vibrations. The band was observed only for samples treated (in various configurations) with the nanocopper colloid. Its intensity was comparable in both variants, which confirms similar content of metal particles capable of reacting with groups containing oxygen present in the analyzed systems. The position of this band may depend on the degree of hydrogen bonding in the Cu–O–H system [
61]. The same confirms the presence of copper nanoparticles in the oil. The band with the maximum at approximately 1100 cm
−1 combined with the band at approximately 840 cm
−1 may also constitute an enhancement of the symmetric stretching vibrations of the COO− group resulting for the interaction with Cu particles. In the case of samples treated with the nanocolloid containing Ag nanoparticles, this band was not present; however, in this case, we observed significantly greater changes in the bands at approximately 1160 and 1100 cm
−1 which may originate from the vibrations of C–O–Ag, enhancement of C–O vibrations which also evidences the effects of Ag nanoparticles on the analyzed oil samples.

 ,
, 


