Article

Moderate Drip Irrigation Level with Low Mepiquat Chloride Application Increases Cotton Lint Yield by Improving Leaf Photosynthetic Rate and Reproductive Organ Biomass Accumulation in Arid Region

1
Key Laboratory of Oasis Eco-Agriculture, Xinjiang Production and Construction Corps, Shihezi University, Shihezi, Xinjiang 832003, China
2
Cotton Institute, Xinjiang Academy Agricultural and Reclamation Science, Shihezi, Xinjiang 832003, China
*
Authors to whom correspondence should be addressed.
These authors contributed equally to this work.
Agronomy 2019, 9(12), 834; https://doi.org/10.3390/agronomy9120834
Submission received: 15 October 2019 / Revised: 22 November 2019 / Accepted: 28 November 2019 / Published: 2 December 2019
(This article belongs to the Special Issue Herbaceous Field Crops Cultivation)

Abstract

:
Due to the changing climate, frequent episodes of drought have threatened cotton lint yield by offsetting their physiological and biochemical functioning. An efficient use of irrigation water can help to produce more crops per drop in cotton production systems. We assume that an optimal drip irrigation with low mepiquat chloride application could increase water productivity (WP) and maintain lint yields by enhancing leaf functional characteristics. A 2-year field experiment determines the response of irrigation regimes (600 (W1), 540 (W2), 480 (W3), 420 (W4) 360 (W5) m3 ha−1) on cotton growth, photosynthesis, fiber quality, biomass accumulation and yield. Mepiquat chloride was sprayed in different concentration at various growth phases (see material section). Result showed that W1 increased leaf area index (LAI) by 5.3–36.0%, net photosynthetic rate (Pn) by 3.4–23.2%, chlorophyll content (Chl) by 1.3–12.0% than other treatments. Improvements in these attributes led to higher lint yield. However, no differences were observed between W1 and W2 in terms of lint and seed cotton yield, but W2 increased WP by 3.7% in both years. Compared with other counterparts, W2 had the largest LAI (4.3–32.1%) at the full boll stage and prolonged reproductive organ biomass (ROB) accumulation by 30–35 d during the fast accumulation period (FAP). LAI, the average (VT) and maximum (VM) biomass accumulation rates of ROB were positively correlated with lint yield. In conclusion, the drip irrigation level of 540–600 m3 ha−1 with reduced MC application is a good strategy to achieve higher WP and lint yield by improving leaf photosynthetic traits and more reproductive organ biomass accumulation.

1. Introduction

Cotton (Gossypium hirsutum L.) is an important fiber crop and oil seed crop worldwide [1]. China produces an average lint yield of 1200 kg ha−1, which is higher than India, Pakistan and USA [2]. With the increasing population comes an increased demand for fiber, and changes in climatic conditions are threating cotton productivity [3]. Crop intensification to produce more food, fiber and feed requires more water, but water resources are limited. Although, cotton is considered drought-resistant crop and its productivity is negatively affected by drought stress. This can lead to reduced growth by negatively influencing plant physiological, biochemical and molecular events [2]. Drought stress can cause 50% to 73% reductions in cotton yields [4]. Limited water availability has threatened irrigated cotton production. Oh the other hand, sufficient fertilizer and irrigation supply results in luxury vegetative growth and increase insect pest incidence which lead to yield penalty [5]. In this context, there is a need to develop water conservation strategy to achieve more crops per drop [6].
Photosynthesis is the prerequisite for lint yield formation. The crops photosynthetic ability can be improved by regulating plant function and irrigation conditions, which in turn affect lint yield [7,8]. Deficit water affects biomass distribution and facilitates assimilate transfer to reproductive organs [9]. A short period of mild drought may stimulate the compensatory effect of photosynthesis [10]. These compensations favor the translocation of assimilate to reproductive organs and the improvement of WP (water productivity) without sacrificing yield [11]. Hence, these compensatory effects represent a self-regulatory mechanism that helps crop to adapt stressful environment by efficient utilization of limited water resources [1].
Xinjiang is the major cotton-growing provinces in China, contributing 67% of the total national lint production [12]. However, low water availability has imposed a great challenge to cotton production in this area. Currently, mulch drip irrigation is widely adopted to increase cotton lint yield and WP in Xinjiang [13,14]. To conserve water and produce high yields under irrigation systems, cotton growers have adopted the concept of regulated deficit irrigation (RDI) [10,13,15]. RDI can increase WP rapidly, this reduces leaf area and leading to lower photosynthesis rate [15,16], it was not conducive to biomass accumulation, resulting in failure to increase production [17,18]. Therefore, understanding the changes in photosynthetic characteristics and dry matter accumulation are needed to achieve optimal lint yield and WP under mulch drip irrigation system.
The main purpose of mulch drip irrigation technology is to conserve soil water and achieve high crop yield, but yield and productivity do not always increase with increased irrigation quota [19,20]. Hence, a reasonable control of drip irrigation quotas is essential to identify the optimal combination of water conservation and high yield. Mepiquat chloride (MC) (N,N-dimethylpiperidinium chloride) is a growth regulator used worldwide to control plant geometry. MC can be absorbed by leaves and is distributed throughout plants [21]. MC applications induce reductions in leaf expansion, stems, petiole length, and node number and enhance the maturity of cotton crops, with variable yield responses [22,23,24]. Therefore, it is hypothesized that moderately reduced irrigation quotas in conjunction with a low application rate of MC in the field can improve WP and maintain lint yields by utilizing the compensatory effects of photosynthesis under deficient drip irrigation. The objectives of this research were to explore the effects of various drip irrigation quotas on the photosynthesis capability, biomass accumulation, yield and WP using different concentration of MC under mulch drip irrigation systems. It also determines the quantitative relationships among these factors.

2. Materials and Methods

2.1. Experimental Site and Cultivar

Field experiments were conducted in 2016 and 2017 at the experimental farm of Shihezi University (45°19′ N latitude, 86°03′ E longitude). A Xinluzao 45 (Gossypium hirsutum L.) cultivar was used in this study. This cultivar was developed by the Xinjiang Academy of Agricultural and Reclamation Science and is officially registered and released by the Xinjiang Crop Cultivar Registration Committee. The total growth period from emergence to initial boll opening (BO) is 122 days. The soil was a purple clay loam with a pH of 7.65 and contained 15.3 g kg−1 organic matter, 1.1 g kg−1 total N, 54.9 mg kg−1 available N, 23.0 mg kg−1 available P and 194 mg kg−1 available K within the 0–20 cm soil layer. The evapotranspiration, temperature and precipitation data from April to October are shown in Figure 1.

2.2. Experimental Design

A randomized complete block design with four replications was used in this study. Generally, a total irrigation amount of 4800–5000 m3 ha−1 is required to achieve more than 6000 kg ha−1 of seed cotton yield in northern Xinjiang region [10,18]. Five drip irrigation treatments were targeted i.e., W1 (600 m3 ha−1 of water each time with the total amount of irrigation 4800 m3 ha−1; control), W2 (540 m3 ha−1 of water each time with the total amount of irrigation 4320 m3 ha−1), W3 (480 m3 ha−1 of water each time with the total amount of irrigation 3840 m3 ha−1), W4 (420 m3 ha−1 of water each time, with the total amount of irrigation 3360 m3 ha−1), and W5 (360 m3 ha−1 of water each time with the total amount of irrigation 2880 m3 ha−1). The drip irrigation rates were controlled by water meter and switch ball valve. The irrigation was applied in the same dates for all the treatments, and the duration was approximately 10–14 h (07:30 AM–21:30 PM).

2.3. Field Management

Prior to sowing, the experimental field was covered with a plastic film. Two drip irrigation lines (Beijing Luckrain Inc., China) were installed under each plastic film. The drip irrigation line had an inner diameter of 2.5 cm with emitter distance of 50 cm, and a flow rate of 2.7 L h−1. Cotton seeds were sown on both sides of the drip irrigation belt at a distance of 13.5 cm on 21 and 23 April in 2016 and 2017, respectively. The plots were randomly arranged with the total area of 56 m2 (7.0 × 8.0 m2). After two weeks, seedlings were thinned to maintain the desired planting density. The row spacing was maintained as 12 cm with a planting density of 18,000 plants ha−1 which was commonly practiced in this region. Fertilizer was applied with water by 8 times (first via drip irrigation for half an hour, then via fertigation). Thereafter, the field was fertilized with 4500 kg ha−1 of oil residue (with 13% N, 2% P2O5 and 16% K2O) as a basal fertilizer. In addition, 72 kg ha−1 of urea (comprising 46% N) and 225 kg ha−1 of triple superphosphate (comprising 45% P2O5) were applied throughout the growth period. The amount and time of the drip irrigation was controlled to maintain to distribute equal amount of fertilizer for each treatment. MC was applied to control vegetative growth. MC solution at 208 g hm−2 concentration was sprayed 5 times in the W1 treatment. A 6 g hm−2 MC solution was sprayed from cotyledon stage to the two-leaf stage and 11 g hm−2 was sprayed at the 5–7-leaf stage. Moreover, 26 g hm−2, 45 g hm−2, 120 g hm−2 was sprayed 2 days before the first irrigation, 2 days before the second irrigation and 5–7 days after topping, respectively. The first and second spray was similar to W1 treatment. However, an MC solution at a concentration of 137 g hm−2 was sprayed on W2, W3, W4 and W5 treatments. To hasten the crop maturity, a defoliant at 450 g ha−1 tribenuron combined with 1350 mL ha−1 ethephon was used in both years. Artificial topping was carried out on 3 and 8 July in 2016 and 2017, respectively. Other management practices such as insect and weed control were conducted according to the local agronomic practices.

2.4. Net Photosynthetic Rate

Net photosynthetic rate (Pn) was assessed from functional leaf at the full squaring (FS), initial flowering (IF), full flowering (FF), full boll setting (FB), late boll setting (LFB) and BO stages between 10:00 a.m. and 12:00 p.m. on sunny day using an open-type photosynthesis system (LI-6400, LI-COR, Lincoln, NE, USA) equipped with a red/blue light source chamber. The machine was configured at light intensity of 1800 μmol m−2 s−1, temperature, 32 °C and at 20% relative humidity. Four plants in each plot were selected for measurement.

2.5. Water Productivity (WP)

The WP was determined according to [6],
WP = Y/I
WP, Y and I represent the water productivity (kg m−3), seed cotton yield (kg ha−1) and the amount of drip irrigation (m−3) during the whole cotton growth period, respectively.

2.6. Chlorophyll Content

To measure chlorophyll content leaves were removed and the petiole was wrapped in wet gauze. A 0.1 g leaf sample was used to determine the Chl content. Leaves were placed in a 25 mL test tube and the pigment was extracted with 13 mL of 80% acetone. Tubes were wrapped with a black cloth and placed in dark conditions. Tubes were shaken at regular intervals and incubated for 72 h until the leaves become white color. The optical density (OD) value was measured at 470 nm, 663 nm, and 645 nm wavelength using a UV-2041 spectrophotometer (Shimadzu, Kyoto, Japan).

2.7. Biomass Accumulation

Four successive plants at the FS, IF, FF, FB, LFB and BO stages from each plot of the fourth replicates were carefully uprooted, divided into vegetative organs (roots, stem, leaves and branches) and reproductive organs (buds, flowers, boll shells and bolls). Samples were enveloped separately and placed into an electric fan-amended oven at 105 °C for 30 min then dried at 80 °C to a constant weight. The leaf area was measured using an LI-3000 area meter (LI-COR, Lincoln, NE, USA). Leaf area index (LAI) was calculated by multiplying the total leaf area of single plant (m2 plant−1) × plant density (plants m−2). The declining rate of LAI, Pn and Chl content at the FB and BO stages was determined as follows:
Declining Rate (%) = −(VBO − VFB)/VBO
Of which, VBO and VFB represent the LAI, Pn and Chl content parameters at the FB and BO stages, respectively.
A logistic formula was used to describe the progress of biomass accumulation [25]:
Y = K 1 + a e b t
Of which, t (day) indicates days after emergence (DAE), Y (g) indicates the biomass at t, K (g) is the maximum biomass, and a and b are the constants to be found.
t 0 = lna b
t 1 = 1 b ln 2 + 3 a
t 2 = 1 b ln 2 3 a
At t = t0, the biomass accumulation reaches a maximum speed defined as follows:
V M = b k 4
The period at which 58% of the biomass accumulated is defined as the biomass fast accumulation period (FAP), which begins at t1 and terminates at t2. During the FAP, Y is linearly correlated with t and the average speed, defined as follows:
V T = Y 2 Y 1 t 2 t 1

2.8. Yield, Yield Contributors and Fiber Quality

Seed cotton from each plot was hand-picked (on 3 and 15 October in 2016; 30 September and 15 October in 2017). Seed cotton was sun dried and weighed. One hundred fully opened bolls were sampled to calculate individual boll weight and lint percentage lint percentage. Boll number were determined by counting bolls (>2 cm in diameter) of each plant on 15 September and 20 September in 2016 and 2017, respectively.
To assess fiber quality attributes (length, strength, micronaire, and uniformity) lint samples were sent to the Chinese Academy of Agricultural Sciences for high-volume instrumentation analysis.

2.9. Data Analysis

SPSS 19.0 software (SPSS Institute Inc., Chicago, IL, USA) was used for analysis of variance. Means were tested by Duncan multiple comparison at a level of 0.05. Sigma Plot 12.5 (Aspire Software Intl., Ashburn, VA, USA) was used for data processing and figures as well as linear regression.

3. Results

3.1. Leaf Area Index

The LAI decreased with the decreasing drip irrigation level (except the FB stage) in both years (Figure 2). Under W1, the LAI was 5.6 at the LFB stage, 3.6 to 5.3 at the FB stage under for W5, W4, W3 and W2 treatments. At the FB stage, the LAI was 3.1–5.9% higher in W2 compared with W1. Moreover, W1, W2, W3, W4 and W5 decreased the LAI by 5.7%, 14.6%, 18.6%, 18.6% and 18.7%, respectively, at all growth stages.

3.2. Chlorophyll Content

Cotton leaf Chl content was significantly influenced by irrigation levels at different growth stages (Figure 3). with the decreased in the irrigation level Chl content was significantly decreased at various growth stages. W1 and W2 had higher leaf Chl contents at FB stage and then decreased later in season. W2–W5 decreased the Chl by 0.4–5.2% at the FS stage, −0.11–9.7% at the FF stage, 7–16.6% at the FB stage, 1.0–6.3% at the LFB stage and 3.4–21.7% at the BO stage.

3.3. Net Photosynthetic Rate

The Pn rate was substantially influenced by irrigation levels. With the crop development the Pn rate was increased and then decreased (Figure 4). The rate of Pn was lowered with the decreased of irrigation level during the whole growth stages. W1 and W2 resulted in higher net Pn compared with other counterparts. Across the years, the Pn was higher in 2016 compared with 2017.

3.4. Cotton Plant Biomass Accumulation

Cotton plant biomass (CPB) accumulation was increased rapidly and then decreased with decreasing drip irrigation (Figure 5). W1 resulted in 7.84%, 13.13%, 22.17%, and 28.09% at the FB stage; 8.24%, 15.80%, 27.82%, and 33.91% at the LFB stage; and 9.72%, 15.60%, 27.54%, and 34.09% higher biomass at the BO stage averaged across both years. Vegetative organ biomass (VOB) accumulation increased sharply before the FF stage and then decreased with decreasing drip irrigation (Figure 5). W1 increased the VOB by 6.97–32.97% at the FB stage and 5.86–34.20% at the LFB stage than other treatment. Reproductive organ biomass (ROB) accumulation decreased with decreasing drip irrigation (Figure 5). W1 had higher ROB by 15.32% and 11.04% at the LFB stage and 17.21% and 18.74% at the BO stage, respectively.

3.5. Characteristics of Biomass Accumulation

The simulation of biomass as a function of DAE was assessed via equation (2). The logistic function of the biomass accumulation was followed by a sigmoidal growth pattern. All the coefficients of determination were significant, although the equation coefficients differed among the treatments (Table 1). Calculations by Equations (3)–(8) based on Table 1 revealed the beginning and end day of the FAP for CPB accumulation during both years. W1 and W2 begins and ends at 68 and 119 DAE and 69 and 113 DAE, respectively, in 2016 and 64 and 124 DAE and 77 and 115 DAE, respectively, in 2017, with greater average and maximum rates of biomass over other treatments.
Differences in CPB accumulation were noticed among the treatments in both years (Table 1). W1 had the greatest average (356.8 kg ha−1 day−1 VT) and maximum (406.9 kg ha−1 day−1 VM) biomass accumulation rates followed by W2 (349.0 kg ha−1 day−1 VT, 398.1 kg ha−1 day−1 VM) and W3 (331.0 kg ha−1 day−1 VT, 377.7 kg ha−1 day−1 VM). The FAP of the CPB accumulation under W2 and W3 initiated at the same time (65.7 DAE), and they terminated 5 days and 7 days sooner than that under W1. W5 had a shorter duration of CPB at FAP which showed lowest average (258.2 kg ha−1 day−1 VT) and maximum (294.5 kg ha−1 day−1 VM) biomass accumulation rates.
The VOB accumulation was also affected by the irrigation quota during both years (Table 1). The VT and VM increased with increasing drip irrigation in both years. VOB accumulation at FAP under W2 and W3 begun and terminated almost at the same time, which was 1–3 days delayed than W1. W2 had longer VOB duration at FAP (25.3 days) with both average (VT 285.3 kg ha−1 day−1) and maximum (VM 325.4 kg ha−1 day−1) biomass formation rates.
The drip irrigation quotas significantly altered cotton plant ROB organ biomass formation in both years (Table 1). Under, the FAP of W2 ROB accumulation at FAP began at 89 DAE and terminated at 122 DAE, both of which 1 day delayed than W1. Moreover, W2 and W3 had similar FAP time. W1 had higher both average and maximum biomass accumulation rates at FAP followed by W2.

3.6. Yield, Water Productivity and Fiber Quality

Cotton yield and yield components were significantly influenced by irrigation levels (Table 2). Among irrigation levels W1 produced the highest seed cotton and lint yield in both years compared with other treatments. Compared with W1, W2 slightly influenced the cotton yield in 2016 and 2017. W2 resulted in 5.3–7.7% lower seed cotton yield and a 5.0–5.7% lower lint yield. Compared with W1, individual boll weight was decreased by 1.6%, 2.4%, 4.1%, and 5.3% W2, W3, W4, and W5 respectively. Similarly boll numbers per unit area decreased by 5.4%, 6.2%, 9.9%, and 18.4%, respectively. However the lint % increased. In addition, WP under W2, W3, W4, and W5 was 3.9%, 13.0%, 23.6%, and 29.8% greater than over W1. The differences were minor between both years.
Fiber quality parameters were substantially influenced by irrigation levels (Table 3). The fiber length and uniformity increased as the drip irrigation quota increased. Compared with W1, W2 and W3 had higher fiber lengths and fiber uniformity compared with other treatment. W4 and W5 treatment resulted in significantly lower fiber length and uniformity during both years. The uniformity was significantly greater in 2016 than in 2017, while the fiber length, specific strength, and micronaire values remained similar.

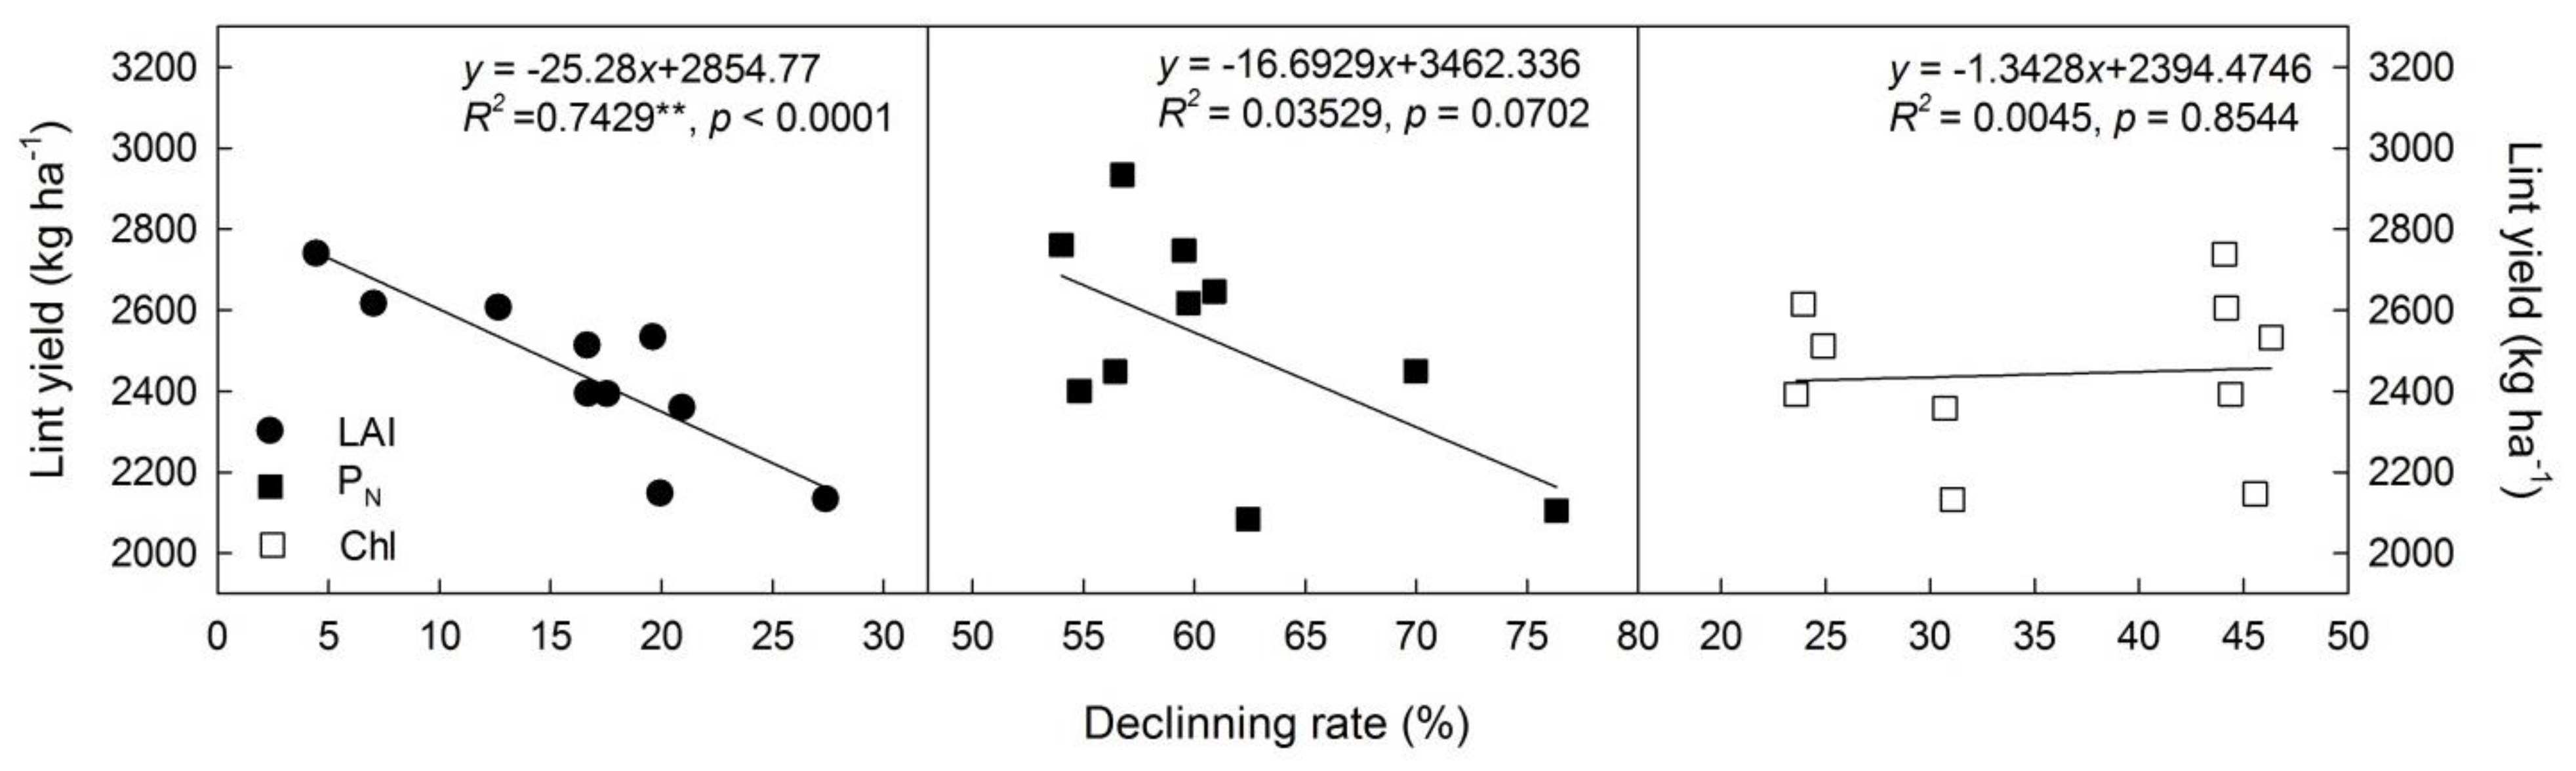
3.7. Correlation Analysis and Regression Analysis

The relationships between photosynthetic characteristic parameters (the LAI, Pn and Chl), biomass accumulation (CPB, VOB and ROB) and lint yield were analyzed at different growth stages in both years (Table 4). The correlation intensity between the photosynthetic characteristic and lint yield was determined i.e., Pn (0.915) > LAI (0.896) > Chl (0.840) at the FB stage as well as LAI (0.916) > Pn (0.901) > Chl (0.727) at the LFB stage. During the FB to BO stages, the CPB, VOB and ROB were highly significantly (p < 0.001) correlated with lint yield at especially at the LFB stage. In addition, the correlation association between LAI and ROB and lint yield was gradually increased from FS to BO stage.
The relationships from regression analysis showed a declining rate of photosynthetic characteristics traits (LAI, Pn and Chl) from FB to BO stages. The lint yield has been shown in Figure 6. Cotton biomass accumulation (CPB, VOB and ROB), simulation (T, VT, VM and tm) and lint yield (Figure 7) were described using linear functions during different growth stages in both years. The declined rate of Pn and Chl content during the FB to BO stages, the T of CPB, VOB and ROB accumulation and tm of VOB and ROB accumulation were not significantly linearly correlated to lint yield. A negative correlation was observed between the declining rate of LAI (R2 = 0.7429, p < 0.001) and lint yield. A positive correlation were noticed between VT (R2 = 0.7422, p < 0.001) and VM (R2 = 0.7424, p < 0.001) of CPB, VOB and ROB i.e., VT (R2 = 0.5791, p = 0.0106), VM (R2 = 0.5791, p = 0.0106), VT (R2 = 0.9354, p < 0.001), VM (R2 = 0.9354, p < 0.001) and lint yield. In addition, CPB tm was also correlated (R2 = 0.6702, p = 0.0038) with lint yield.

4. Discussion

Crop production is positively allied with photosynthesis capacity (i.e., photosynthetic area, Pn, and photosynthetic pigments) [26,27] and is significantly influenced by soil water content [28]. In this study, LAI, Pn and Chl content were positively correlated with lint yield from full boll to boll opening stages. The LAI was strongly correlated with lint yield during the later full boll to boll opening stages and the declining rate was negatively correlated with lint yield. This show that duration of LAI during late growth late stages and the leaf photosynthetic capacity important players for increasing cotton yield. These data are in line with [29] that the absorption of photosynthetically active radiation was not significantly affected by mild water deficit. Plants can respond to drought by reducing nonstomatal transpiration (soil evaporation) [30] and increasing stomatal resistance (reducing evaporation) and osmotic adjustment substances [31]. An optimistic growth i.e., Pn, root growth, the LAI, plant height and biomass accumulation maintain high values in under short term water deficit which in turn increase yield [10,32]. These physiological adjustments can be explained by the compensatory growth of cotton under moderate drought stress [33]. Hence, irrigation strategies can be used to alter leaf area expansion, the absorption of photosynthetically active radiation and carbohydrate production to enhance photosynthesis capacity, water conservation and consequently yield [27,29].
Photosynthesis is the basis of crop biomass accumulation and yield formation under drought conditions [34,35]. Chl affects electron transport and determines the photosynthesis capacity of crop plants as well plays a key role in the absorption, transmission and transformation of light energy [36]. In the present study, reductions in the Pn under water deficit conditions occurred due to Chl degradation [37]. This degradation may associate with low drip irrigation quota, increased stomatal resistance and low CO2 supply to the chloroplast [38].
Leaf area is more sensitive to moisture stress compared with Pn and Chl [29]. A moderate reduction in drip irrigation quota is beneficial for low Chl and can delay leaf senescence. In this study, W2 and W3 had a negative effect on photosynthetic apparatus in the chloroplasts. This might be due to the change in the photosynthetic pigments or protection of the photosynthetic apparatus from photoinhibitory damage in the leaves [39]. However, the Calvin Cycle enzyme (ribulose-1,5-bisphosphate carboxylate/oxygenase, Rubisco) activity was maintained due to higher Pn and Chl content for biomass accumulation. The difference in dry matter was the result of size and duration of the photosynthetic area. W1 delayed LAI which may be related to the exuberant development of leaves and the longer CPB accumulation time. W2 maintained a relatively high LAI (>5.0) and a sufficient photosynthetic area resulted in assimilate formation and water conservation [30,40]. This phenomenon might be due to the growth compensatory effects of plants under slightly reduced irrigation quotas [41,42]. Plants can adapt to mild drought through various physiological activities such as increasing leaf area to maintain a favorable water content [43]. An optimal LAI of cotton plants lead to the absorption of sufficient light energy. This absorption improves both the population structure and canopy photosynthesis, thereby improving the light energy utilization and consequently high yield [44,45]. Furthermore, under a low level of MC application under W2 treatment before the first and second irrigation events maintained a reasonable LAI and could create a reasonable population structure to guarantee a greater and more efficient photosynthetic system. An expansion of cotton leaves are considered more sensitive to drought than Pn [46]; this sensitivity could explain the significant decrease in photosynthetic area under W3, W4 and W5 during the late growth period. Although, a lower LAI is conducive to light absorption within a lower canopy, it also decrease light energy and reduces yield [47]. This might be due to the lower irrigation quotas which did not provide suitable leaf moisture conditions. This further reduced LAI, increased the degradation rate of Chl and increased leaf senescence [48]. These alterations may affect integrity of the photosynthesis and reduced the photosynthetic efficiency [49].
Biomass accumulation is the final product of plant photosynthesis and more distribution of biomass to the reproductive organs are essential for high cotton yield [50]. More biomass accumulations are important to maintain high crop yields [51]. A significant or extremely significant positive correlation between biomass accumulation (VOB, VOB and ROB) and lint yield in the present study. Based on regression analysis, CPB, VOB and ROB biomass accumulation in both VT and VM were positively correlated to lint yield. Conversely, reductions in crop yield caused by irrigation have been attributed to decreased biomass formation [52]. Biomass accumulation at FAP was associated with increased water uptake. An appropriate irrigation quota could increase both average and maximum rates of CPB and can lead to increased biomass accumulation and consequently high yield [3]. In this study, W2 and W3 shortened CPB accumulation duration and facilitated maximum rates of CPB at FAP. However, W2 had a longer duration of VOB accumulation. These conditions increased the distribution of assimilate to the reproductive organs. A moderate reduction in irrigation can maintain a high LAI to ensure high biomass accumulation [53]. This further transitioned more vegetative growth to reproductive growth and reduced evaporation during vegetative development [54]. Conversely, W4 and W5 significantly shortened the duration for biomass formation, thus reduced the maximum rates for VOB and ROB accumulation. This finding indicated that relatively low soil water contents are not good for growth and development of the aboveground parts during the vegetative growth stage. These adverse effects may involve physiological responses [55], leaf area expansion [48], root growth [56] resulting in a decreased plant VOB to reproductive biomass and ultimately reduced yield [11]. Luxury, vegetative growth can consume excessive amount of nutrients and increases competition between vegetative and reproductive growth and consequently fruit shedding [57]. Together, these data showed that reducing irrigation quotas are not conducive to cotton growth or yield formation.
An appropriate irrigation level is important for sustainable cotton production in arid regions. Different irrigation amount can lead to significant differences in crop growth and both the accumulation and redistribution of photosynthesis assimilate [49], which in turn affects crop yield, water use efficiency and fiber quality [9,58]. A 15% reduction in the total irrigation amount can save irrigation water and reduced yield losses. However, further reduction up to 25% conserve more irrigation water but can lead high yield penalty [20]. Interestingly, the yield under W2 was not significantly different from W1 and the WP also increased in the present study. These results are consistent with those of previous research [30,59] who also reported that a slight reduction in drip irrigation can cause physiologically relevant adaptations in cotton, such as improved photosynthesis capabilities (leaf area and Chl content per unit area) [29] and growth promotion of vegetative organs [60]. Another possible reason might be due to reduced application of MC under W2. The reduced use of MC in this treatment may facilitated vegetative growth [54] and increased the balance between vegetative and reproductive growth [61]. These phenomena were also beneficial for cotton plants in terms of maintaining a self-adjustment ability via the relationship between boll number and single boll weight [62]. Although, W4 and W5 presented relatively high WP but did not increase yield. W4 and W5 significantly reduced boll weight and bolls per unit area. This reduction in boll number under reduced irrigation further decreased lint yield. However, W2 slightly reduced individual boll weight and number of bolls per unit area. This increment in yield maight be associated with a moderate reduction in the drip irrigation quota [9].
Cotton fiber length, fiber uniformity, specific strength and micronaire value are the important fiber quality parameters. In this study, moderately reduced drip irrigation (W2 and W3) quotas did not significantly affect cotton fiber quality parameters. These data are consistent with the results of previous studies [59,63]. However, the extremely low drip irrigation quota (W5) significantly reduced fiber length and uniformity. The difference in fiber length may be due to moisture effects on fiber length which influence fiber elongation phase. The micronaire value is a measure of fiber fineness and maturity [64]. No significant differences in micronaire value or specific strength among the different treatments were observed. This might be related to the time interval of irrigation, which influenced cotton boll development.

5. Conclusions

In this study, irrigation quota and MC application had a significant effect on leaf photosynthetic performance and biomass accumulation, cotton yield, fiber quality and water productivity. Compared with W1, W2 had higher Pn and Chl content during all growth period. Moreover, W2 combined with reduced MC application resulted in greater LAI at the full boll stage, which ensured a sufficient photosynthetic area and prolonged ROB accumulation duration and yield formation. In conclusion, the drip irrigation level of 540–600 m3 ha−1 with reduced MC application is a good strategy to maintain higher WP and achieve high lint yield as well as better fiber quality.

Author Contributions

H.L. and F.W. conceived and designed the experiments; J.X. and X.H. performed the experiments; H.G. and H.M. analyzed the data; A.K. edited and revised the paper; H.G. wrote the paper.

Funding

This project was supported by the National Key R&D Program of China (2017YFD0201900), National Natural Science Foundation of China (31760355), and Program of Youth Science and Technology Innovation Leader of The Xinjiang Production and Construction Corps (2017CB005).

Conflicts of Interest

The authors declare no conflict of interest. The funders had no role in the design of the study; in data collection, analyses, or interpretation of data; in the writing of the manuscript, or in the decision to publish the results.

References

  1. Constable, G.A.; Bange, M.P. The yield potential of cotton (Gossypium hirsutum L.). Field Crops Res. 2015, 182, 98–106. [Google Scholar] [CrossRef]
  2. Khan, A.; Wang, L.; Ali, S.; Tung, S.A.; Hafeez, A.; Yang, G. Optimal planting density and sowing date can improve cotton yield by maintaining reproductive organ biomass and enhancing potassium uptake. Field Crops Res. 2017, 214, 164–174. [Google Scholar] [CrossRef]
  3. Feng, L.; Dai, J.; Tian, L.; Zhang, H.; Li, W.; Dong, H. Review of the technology for high-yielding and efficient cotton cultivation in the northwest inland cotton-growing region of China. Field Crops Res. 2017, 208, 18–26. [Google Scholar] [CrossRef]
  4. Berry, P.; Ramirezvillegas, J.; Bramley, H.; Mgonja, M.A.; Mohanty, S. Regional impacts of climate change on agriculture and the role of adaptation. In Plant Genetic Resources and Climate Change; Jackson, M., Ford-Lloyd, B., Parry, M., Eds.; CAB International: Wallingford, UK, 2014; pp. 78–97. [Google Scholar]
  5. Cathey, G.W.; Meredith, W.R. Cotton Response to Planting Date and Mepiquat Chloride. Agron. J. 1988, 80, 463–466. [Google Scholar] [CrossRef]
  6. Choudhury, B.U.; Bouman, B.A.M.; Singh, A.K. Yield and water productivity of rice–wheat on raised beds at New Delhi, India. Field Crops Res. 2007, 100, 229–239. [Google Scholar] [CrossRef]
  7. Long, S.P.; Zhu, X.G.; Naidu, S.L.; Ort, D.R. Can improvement in photosynthesis increase crop yields? Plant Cell Environ. 2006, 29, 315–330. [Google Scholar] [CrossRef]
  8. Zhu, X.; Long, S.; Ort, D. What is the maximum efficiency with which photosynthesis can convert solar energy into biomass? Curr. Opin. Biotechnol. 2008, 19, 153–159. [Google Scholar] [CrossRef]
  9. Basal, H.; Dagdelen, N.; Unay, A.; Yilmaz, E. Effects of deficit drip irrigation ratios on cotton (Gossypium hirsutumL.) yield and fibre quality. J. Agron. Crop. Sci. 2009, 195, 19–29. [Google Scholar] [CrossRef]
  10. Luo, H.H.; Zhang, Y.L.; Zhang, W.F. Effects of water stress and rewatering on photosynthesis, root activity, and yield of cotton with drip irrigation under mulch. Photosynthetica 2016, 54, 65–73. [Google Scholar] [CrossRef]
  11. Yan, M.; Zheng, J.; Zhang, J.; Shi, H.; Tian, L.; Guo, R.; Lin, T. Effects of regulated deficit irrigation on accumulation and distribution of biomass and nitrogen, and yield of island cotton. Chin. J. Eco Agric. 2015, 23, 841–850. [Google Scholar]
  12. Lu, X.R.; Jia, X.Y.; Niu, J.H. The present Situation and prospects of cotton industry development in China. Sci. Agric. Sin. 2018, 51, 26–36. [Google Scholar]
  13. Kang, S.Z.; Shi, W.J.; Zhang, J.H. An improved water-use efficiency for maize grown under regulated deficit irrigation. Field Crops Res. 2000, 67, 207–214. [Google Scholar] [CrossRef]
  14. Zhang, G.Q.; Liu, C.W.; Xiao, C.H.; Xie, R.Z.; Ming, B.; Hou, P.; Liu, G.Z.; Xu, W.J.; Shen, D.P.; Wang, K.R.; et al. Optimizing water use efficiency and economic return of super high yield spring maize under drip irrigation and plastic mulching in arid areas of China. Field Crops Res. 2017, 211, 137–146. [Google Scholar] [CrossRef]
  15. Tang, L.S.; Li, Y.; Zhang, J.H. Partial rootzone irrigation increases water use efficiency, maintains yield and enhances economic profit of cotton in arid area. Agric. Water Manag. 2010, 97, 1527–1533. [Google Scholar] [CrossRef]
  16. Zhang, Y.; Zhang, Y.; Wang, Z.; Wang, Z. Characteristics of canopy structure and contributions of non-leaf organs to yield in winter wheat under different irrigated conditions. Field Crops Res. 2011, 123, 187–195. [Google Scholar] [CrossRef]
  17. Yang, G.H. Research advance in the theory and technology of crop regulated deficit irrigation. J. Anhui Agric. Sci. 2008, 36, 2514–2516. [Google Scholar]
  18. Cai, H.J.; Kang, S.Z.; Zhang, Z.H.; Chai, H.M.; Hu, X.T.; Wang, J. Proper growth stages and deficit degree of crop regulated deficit irrigation. Trans. Chin. Soc. Agric. Eng. 2000, 16, 24–27. [Google Scholar]
  19. Qian, C.; Zhang, Y.; Sun, Z.; Zheng, J.; Wei, B.; Yang, L.; Feng, L.; Chen, F.; Zhe, Z.; Ning, Y. Morphological plasticity of root growth under mild water stress increases water use efficiency without reducing yield in maize. Biogeosciences 2017, 14, 1–24. [Google Scholar]
  20. Yang, C.J.; Luo, Y.; Sun, L.; Wu, N. Effect of Deficit Irrigation on the Growth, Water Use Characteristics and Yield of Cotton in Arid Northwest China. Pedosphere 2015, 25, 910–924. [Google Scholar] [CrossRef]
  21. Tung, S.A.; Huang, Y.; Ali, S.; Hafeez, A.; Shah, A.N.; Song, X.; Ma, X.; Luo, D.; Yang, G. Mepiquat chloride application does not favor leaf photosynthesis and carbohydrate metabolism as well as lint yield in late-planted cotton at high plant density. Field Crops Res. 2018, 221, 108–118. [Google Scholar] [CrossRef]
  22. Bogiani, J.C.; Rosolem, C.A. Sensibility of cotton cultivars to mepiquat chloride. Pesqui. Agropecu. Bras. 2009, 44, 1246–1253. [Google Scholar] [CrossRef]
  23. Cook, D.R.; Kennedy, C.W. Early flower bud loss and mepiquat chloride effects on cotton yield distribution. Crop Sci. 2000, 40, 1678–1684. [Google Scholar] [CrossRef]
  24. Mao, L.; Zhang, L.; Evers, J.B.; Werf, W.V.D.; Liu, S.; Zhang, S.; Wang, B.; Li, Z. Yield components and quality of intercropped cotton in response to mepiquat chloride and plant density. Field Crops Res. 2015, 179, 63–71. [Google Scholar] [CrossRef]
  25. Yang, G.Z.; Tang, H.Y.; Nie, Y.C.; Zhang, X.L. Responses of cotton growth, yield, and biomass to nitrogen split application ratio. Eur. J. Agron. 2011, 35, 164–170. [Google Scholar] [CrossRef]
  26. Gu, J.F.; Zhou, Z.X.; Li, Z.K.; Chen, Y.; Wang, Z.Q.; Zhang, H. Rice (Oryza sativa L.) with reduced chlorophyll content exhibit higher photosynthetic rate and efficiency, improved canopy light distribution, and greater yields than normally pigmented plants. Field Crops Res. 2017, 200, 58–70. [Google Scholar] [CrossRef]
  27. Yi, X.P.; Zhang, Y.L.; Yao, H.S.; Luo, H.H.; Gou, L.; Chow, W.S.; Zhang, W.F. Rapid recovery of photosynthetic rate following soil water deficit and re-watering in cotton plants (Gossypium herbaceum L.) is related to the stability of the photosystems. J. Plant Physiol. 2016, 194, 23–34. [Google Scholar] [CrossRef]
  28. Chaves, M.M.; Flexas, J.; Pinheiro, C. Photosynthesis under drought and salt stress: Regulation mechanisms from whole plant to cell. Ann. Bot. 2009, 103, 551. [Google Scholar] [CrossRef]
  29. Ennahli, S.; Earl, H.J. Physiological limitations to photosynthetic carbon assimilation in cotton under water stress. Crop Sci. 2005, 45, 2374–2382. [Google Scholar] [CrossRef]
  30. Shareef, M.; Gui, D.W.; Zeng, F.J.; Waqas, M.; Zhang, B.; Iqbal, H. Water productivity, growth, and physiological assessment of deficit irrigated cotton on hyperarid desert-oases in northwest China. Agric. Water Manag. 2018, 206, 1–10. [Google Scholar] [CrossRef]
  31. Xin, L.; Zheng, H.; Yang, Z.; Guo, J.; Liu, T.; Sun, L.; Xiao, Y.; Yang, J.; Yang, Q.; Guo, L. Physiological and proteomic analysis of maize seedling response to water deficiency stress. J. Plant Physiol. 2018, 228, 29–38. [Google Scholar] [CrossRef]
  32. Niu, J.; Zhang, S.; Liu, S.; Ma, H.; Chen, J.; Shen, Q.; Ge, C.; Zhang, X.; Pang, C.; Zhao, X. The compensation effects of physiology and yield in cotton after drought stress. J. Plant Physiol. 2018, 224, 30–48. [Google Scholar] [CrossRef] [PubMed]
  33. Kozlowski, T.T. Water Deficits and Plant Growth. Water Relat. Plants 1983, 342–389. [Google Scholar]
  34. Ullah, I.; Ashraf, M.; Zafar, Y. Genotypic variation for drought tolerance in cotton (Gossypium hirsutum L.): Leaf gas exchange and productivity. Flora 2008, 203, 105–115. [Google Scholar] [CrossRef]
  35. Luo, H.; Li, J.; Gou, L. Regulation of under-mulch-drip irrigation on production and distribution of photosynthetic assimilate and cotton yield under different soil moisture contents during cotton flowering and boll-setting stage. Sci. Agric. Sin. 2008, 41, 1955–1962. [Google Scholar]
  36. Santos, E.F.D.; Zanchim, B.J.; Campos, A.G.d.; Garrone, R.F.; Lavres Junior, J. Photosynthesis rate, chlorophyll content and initial development of physic nut without micronutrient fertilization. Rev. Bras. Cienc. Solo. 2013, 37, 1334–1342. [Google Scholar] [CrossRef]
  37. Horvat, T.; Poljak, M.; Lazarevic, B.; Svecnjak, Z.; Karazlja, T.; Marietta, H. Effect of foliar fertilizers on chlorophyll content index and yield of potato crop grown under water stress conditions. Növénytermelés 2010, 59, 215–218. [Google Scholar]
  38. Sobhkhizi, A.; Rayni, M.F.; Barzin, H.B.; Noori, M. Influence of drought stress on photosynthetic enzymes, chlorophyll, protein and relative water content in crop plants. Int. J. Biosci. 2014, 5, 89–100. [Google Scholar]
  39. Gilmore, A.M. Mechanistic aspects of xanthophyll cycle-dependent photoprotection in higher plant chloroplasts and leaves. Physiol. Plantarum 2010, 99, 197–209. [Google Scholar] [CrossRef]
  40. Koler, P.; Patil, B.C.; Chetti, M.B.; Hiremath, S.M. Influence of plant growth regulators on total dry matter, leaf area index and yield, yield components in hybrid cotton. Karnataka J. Agric. Sci. 2010, 23, 503–505. [Google Scholar]
  41. Shan, L.; Zhang, S.Q. Is possible to save large irrigation water? The situation and prospect of water-saving agriculture in China. Chin. J. Nature 2006, 2, 71–74. [Google Scholar]
  42. Zhao, L.Y.; Deng, X.P.; Shan, L. A review on types and mechanisms of compensation effect of crops under water deficit. J. Appl. Ecol. 2004, 15, 523–526. [Google Scholar]
  43. Nepomuceno, A.L.; Oosterhuis, D.M.; Stewart, J.M. Physiological responses of cotton leaves and roots to water deficit induced by polyethylene glycol. Environ. Exp. Bot. 1998, 40, 29–41. [Google Scholar] [CrossRef]
  44. Zhang, W.F.; Wang, Z.L.; Yu, S.J.; Li, S.K.; Cao, L.P.; Ren, L.T. Effect of under-mulch-drip irrigation on canopy apparent photosynthesis, canopy structure and yield formation in high-yield cotton of Xinjiang. Sci. Agric. Sin. 2002, 35, 632–637. [Google Scholar]
  45. Zhan, D.X.; Zhang, C.; Yang, Y.; Luo, H.H.; Zhang, Y.L.; Zhang, W.F. Water deficit alters cotton canopy structure and increases photosynthesis in the mid-canopy layer. Agron. J. 2015, 107, 1947–1957. [Google Scholar] [CrossRef]
  46. Constable, G.A.; Rawson, H.M. Distribution of 14C label from cotton leaves: Consequences of changed water and Nitrogen status. Funct. Plant Biol. 1982, 9, 735–747. [Google Scholar] [CrossRef]
  47. Su, B.Y.; Song, Y.X.; Song, C.; Cui, L.; Yong, T.W.; Yang, W.Y. Growth and photosynthetic responses of soybean seedlings to maize shading in relay intercropping system in Southwest China. Photosynthetica 2015, 52, 332–340. [Google Scholar] [CrossRef]
  48. Salah, H.; Tardieu, F. Control of leaf expansion rate of droughted maize plants under fluctuating evaporative demand (A superposition of hydraulic and chemical messages?). Plant Physiol. 1997, 114, 893–900. [Google Scholar] [CrossRef] [Green Version]
  49. Kaiser, W.M. Effects of water deficit on photosynthetic capacity. Physiol. Plantarum 2010, 71, 142–149. [Google Scholar] [CrossRef]
  50. Gao, X.L.; Sun, J.M.; Gao, J.F.; Feng, B.L.; Wang, P.K.; Chai, Y. Accumulation and transportation characteristics of dry matter after anthesis in different mung bean cultivars. Acta Agron. Sin. 2009, 35, 1715–1721. [Google Scholar] [CrossRef]
  51. Plénet, D.; Mollier, A.; Pellerin, S. Growth analysis of maize field crops under phosphorus deficiency. II. Radiation-use efficiency, biomass accumulation and yield components. Plant Soil 2000, 224, 259–272. [Google Scholar] [CrossRef]
  52. Fereres, E.; Soriano, M.A. Deficit irrigation for reducing agricultural water use. J. Exp. Bot. 2007, 58, 147–159. [Google Scholar] [CrossRef] [PubMed] [Green Version]
  53. Xu, R.B.; Sun, H.C.; Liu, L.T.; Zhang, Y.J.; Liu, Y.C.; Bai, Z.Y.; Li, C.D.; Sun, G.J. Effect of irrigation patterns on accumulation and distribution of dry matter, yield and water use efficiency of cotton in southern Hebei. Cotton Sci. 2018, 30, 386–394. [Google Scholar]
  54. Bell, J.M.; Schwartz, R.; McInnes, K.J.; Howell, T.; Morgan, C.L.S. Deficit irrigation effects on yield and yield components of grain sorghum. Agric. Water Manag. 2018, 203, 289–296. [Google Scholar] [CrossRef]
  55. Chastain, D.R.; Snider, J.L.; Collins, G.D.; Perry, C.D.; Whitaker, J.; Byrd, S.A. Water deficit in field-grown Gossypium hirsutum primarily limits net photosynthesis by decreasing stomatal conductance, increasing photorespiration, and increasing the ratio of dark respiration to gross photosynthesis. J. Plant Physiol. 2014, 171, 1576–1585. [Google Scholar] [CrossRef] [PubMed]
  56. Zhang, H.Z.; Khan, A.; Tan, D.K.Y.; Luo, H.H. Rational water and Nitrogen management improves root growth, increases yield and maintains water use efficiency of cotton under mulch drip irrigation. Front. Plant Sci. 2017, 8, 912. [Google Scholar] [CrossRef] [PubMed]
  57. Dai, J.L.; Dong, H.Z. Intensive cotton farming technologies in China: Achievements, challenges and countermeasures. Field Crops Res. 2014, 155, 99–110. [Google Scholar] [CrossRef] [Green Version]
  58. Balkcom, K.S.; Reeves, D.W.; Shaw, J.N.; Burmester, C.H.; Curtis, L.M. Cotton yield and fiber quality from irrigated tillage systems in the Tennessee valley. Agron. J. 2006, 98, 596. [Google Scholar] [CrossRef] [Green Version]
  59. Ünlü, M.; Kanber, R.; Koç, D.L.; Tekin, S.; Kapur, B. Effects of deficit irrigation on the yield and yield components of drip irrigated cotton in a mediterranean environment. Agric. Water Manag. 2011, 98, 597–605. [Google Scholar]
  60. Zhou, L.; Gan, Y.; Ou, X.B.; Wang, G.X. Progress in molecular and physiological mechanisms of water-saving by compensation for water deficit of crop and how they relate to crop production. Chin. J. Eco Agric. 2011, 19, 217–225. [Google Scholar] [CrossRef]
  61. Tung, S.A.; Huang, Y.; Hafeez, A.; Ali, S.; Khan, A.; Souliyanonh, B.; Song, X.H.; Liu, A.D.; Yang, G.Z. Mepiquat chloride effects on cotton yield and biomass accumulation under late sowing and high density. Field Crops Res. 2018, 215, 59–65. [Google Scholar] [CrossRef]
  62. Zhang, D.M.; Luo, Z.; Liu, S.H.; Li, W.J.; Wei, T.; Dong, H.Z. Effects of deficit irrigation and plant density on the growth, yield and fiber quality of irrigated cotton. Field Crops Res. 2016, 197, 1–9. [Google Scholar] [CrossRef]
  63. Hussein, F.; Janat, M.; Yakoub, A. Assessment of yield and water use efficiency of drip-irrigated cotton (Gossypium hirsutum L.) as affected by deficit irrigation. Turk. J. Agric. For. 2011, 35, 611–621. [Google Scholar]
  64. Bradow, J.M.; Davidonis, G.H. Quantitation of fiber quality and the cotton production-processing interface: A physiologist’s perspective. J. Cotton Sci. 2000, 1, 34–64. [Google Scholar]
Figure 1. Monthly average evapotranspiration, temperature and rainfall of Shihezi (2016–2017).
Agronomy 09 00834 g001
Figure 2. Effect of different drip irrigation quotas on leaf area index (LAI) of cotton at full squaring (FS), full flowering (FF), full boll (FB), later full boll (LFB) and boll opening stage (BO) in 2016 and 2017. Error bar shows standard error (SE) of means.
Agronomy 09 00834 g002
Figure 3. Effect of different drip irrigation quotas on chlorophyll (Chl) contents of cotton at full squaring (FS), full flowering (FF), full boll (FB), later full boll (LFB) and boll opening stage (BO) in 2016 and 2017. Error bar shows standard error (SE) of means.
Agronomy 09 00834 g003
Figure 4. Effect of different drip irrigation quotas on net photosynthetic rate (Pn) of cotton leaf at full squaring (FS), full flowering (FF), full boll (FB), later full boll (LFB) and boll opening stage (BO) in 2016 and 2017. Error bar shows standard error (SE) of means.
Agronomy 09 00834 g004
Figure 5. Response of cotton plant biomass (CPB), vegetative organs biomass (VOB), and reproductive organ biomass (ROB) at full squaring (FS), initial flowering (IF), full flowering (FF), full boll (FB), later full boll (LFB) and boll opening stage (BO) under drip irrigation quotas in 2016 and 2017. Error bar shows standard error (SE) of means.
Agronomy 09 00834 g005
Figure 6. Regression analysis between the declining rate of photosynthetic capacity values (LAI, Pn and Chl) during FB to BO stage and lint yield. R2 represents the coefficient of determination in linear regression. “**” means significance at the 0.01 level (both sides).
Agronomy 09 00834 g006
Figure 7. Regression analysis of the characteristic values (T, VT, VM and tm) of cotton biomass accumulation (CPB, VOB and ROB) and lint yield. T indicates the duration of FAP; VT and VM are the average and maximum biomass accumulation rates during the FAP, tm (DAE) means days after emergence (day) respectively. R2 represents the coefficient of determination in linear regression. “*” and “**” means significance at the 0.05, 0.01 level, respectively (both sides).
Agronomy 09 00834 g007
Table 1. Eigen parameters of cotton biomass accumulations for different drip irrigation quotas.
YearTreatmentRegression EquationspFast Accumulation PeriodFast Accumulation Point
t1 (DAE)t2 (DAE)T (day)VT (kg ha−1 day-1)VM (kg ha−1 day-1)tm (DAE)
2016Cotton plant biomass
W1Y = 33258.5934/(1 + 119.3122e−0.051359t)0.001167.5118.851.3374.4427.093.1
W2Y = 29446.6185/(1 + 231.5378e−0.05993t)0.001668.9112.844.0386.8441.290.9
W3Y = 25670.201/(1 + 403.4676e−0.067762t)0.002069.1108.038.9381.3434.988.5
W4Y = 22840.8431/(1 + 299.7992e−0.063716t)0.002668.8110.241.3319.0363.889.5
W5Y = 20179.7177/(1 + 237.2227e−0.062861t)0.005966.1108.041.9278.1317.187.0
Vegetative
organ biomass
W1Y = 13417.5274/(1 + 2823.3601e−0.114252t)0.000758.081.123.1336.0383.269.5
W2Y = 13262.6927/(1 + 1995.0725e−0.105198t)0.000759.784.825.0305.8348.872.2
W3Y = 11790.2110/(1 + 14040.0792e−0.131561t)0.001962.682.620.0340.0387.872.6
W4Y = 9872.6580/(1 + 11420.6305e−0.129823t)0.001961.882.120.3280.9320.472.0
W5Y = 8836.4909/(1 + 14624.8702e−0.136997t)0.000760.479.619.2265.4302.670.0
Reproductive organ biomass
W1Y = 17786.1982/(1 + 7812.2131e−0.083488t)0.001291.6123.131.6325.5371.2107.4
W2Y = 15248.9874/(1 + 9516.8349e−0.086831t)0.002490.3120.730.3290.2331.0105.5
W3Y = 14945.7964/(1 + 5473.7872e−0.080545t)0.003390.5123.232.7263.9301.0106.9
W4Y = 14135.8253/(1 + 3096.8490e−0.074301t)0.005390.5125.935.5230.2262.6108.2
W5Y = 12496.6137/(1 + 2551.9707e−0.073465t)0.010988.9124.735.9201.2229.5106.8
2017Cotton plant biomass
W1Y = 35207.8503/(1 + 60.9476e−0.043942t)0.001763.6123.559.9339.1386.893.5
W2Y = 30621.6718/(1 + 67.5922e−0.046357t)0.001762.5119.356.8311.2354.990.9
W3Y = 28700.9055/(1 + 60.3377e−0.044661t)0.001562.3121.359.0281.0320.591.8
W4Y = 22741.8283/(1 + 106.6472e−0.054536t)0.001361.5109.848.3271.9310.185.6
W5Y = 20470.5648/(1 + 88.5934e−0.053107t)0.002159.6109.249.6238.3271.884.4
Vegetative organ biomass
W1Y = 12345.7473/(1 + 701.2048e−0.108047t)0.000348.572.824.4292.4333.560.6
W2Y = 11733.5035/(1 + 613.4740e−0.102951t)0.002049.675.125.6264.8302.062.4
W3Y = 10606.1122/(1 + 356.4513e−0.096032t)0.002247.574.927.4223.3254.661.2
W4Y = 9074.6476/(1 + 718.0429e−0.106314t)0.001649.574.224.8211.5241.261.9
W5Y = 8327.4903/(1 + 370.5410e−0.097825t)0.001947.073.926.9178.6203.760.5
Reproductive organ biomass
W1Y = 18820.0391/(1 + 3123.6047e−0.076271t)0.000488.2122.834.5314.6358.9105.5
W2Y = 16606.3387/(1 + 2573.79391e−0.074759t)0.002787.4122.735.2272.1310.4105.0
W3Y = 15124.7130/(1 + 2981.4888e−0.077040t)0.001086.7120.934.2255.4291.3103.8
W4Y = 13679.9428/(1 + 2689.8974e−0.077117t)0.005685.3119.534.2231.2263.7102.4
W5Y = 9488.9482/(1 + 7536.0818e−0.09532t)0.005079.8107.527.6198.3226.193.7
DAE means days after emergence (day); t1 and t2 are the beginning and terminating day after the fast accumulation period; T indicates the duration of FAP, T = t1 − t2; VT and VM are the average and maximum biomass accumulation rates during the FAP, respectively.
Table 2. Cotton yield and WP under different drip irrigation quotas.
YearTreatmentSeed Yield (kg ha−1)Lint Yield (kg ha−1)Boll Weight (g)Bolls Per Unit Area (104 ha−1)Lint Percentage (%)Water Productivity (kg m−3)
2016W16607 ± 392 a2739 ± 194 a4.78 ± 0.12 a140.2 ± 11.4 a41.45 ± 1.43 b1.38 ± 0.08 b
W26099 ± 305 ab2581 ± 109 ab4.72 ± 0.07 ab129.2 ± 5.9 ab42.32 ± 1.83 ab1.41 ± 0.07 b
W35968 ± 286 ab2531 ± 212 ab4.69 ± 0.14 ab129.8 ± 9.0 ab42.41 ± 1.84 ab1.55 ± 0.07 ab
W45694 ± 340 b2393 ± 235 bc4.62 ± 0.19 bc123.1 ± 9.5 bc42.39 ± 1.82 ab1.68 ± 0.10 a
W55013 ± 260 c2147 ± 85 c4.55 ± 0.17 c110.2 ± 4.7 c42.84 ± 1.85 a1.74 ± 0.09 a
2017W16492 ± 466 a2615 ± 199 a4.76 ± 0.16 a135.9 ± 12.1 a40.28 ± 1.39 b1.35 ± 0.10 c
W26151 ± 341 ab2484 ± 96 ab4.67 ± 0.26 ab132.0 ± 10.7 ab40.39 ± 1.75 b1.42 ± 0.08 bc
W35874 ± 441 bc2397 ± 248 b4.62 ± 0.15 ab129.3 ± 11.1 ab40.63 ± 1.76 ab1.53 ± 0.11 b
W45689 ± 342 c2358 ± 233 b4.53 ± 0.09 b125.6 ± 7.5 b41.45 ± 1.79 a1.69 ± 0.10 a
W55184 ± 533 d2132 ± 165 c4.49 ± 0.11 b115.2 ± 14.4 c41.13 ± 1.78 ab1.80 ± 0.18 a
Yearns*nsns**ns
Year × Treatmentnsnsnsnsnsns
Means within a column of the same year followed by a different letter are significantly different (p < 0.05) according to the Duncan multiple range test. The same letters in the same column indicated no significant difference at 0.05 level in Duncan’s analysis in the same year. “*”, “**” means significance at the 0.05, 0.01 level, respectively. “ns” indicates non-significant.
Table 3. Change of the fiber quality attributes under different drip irrigation quotas.
YearTreatmentFiber Length (mm)Fiber Uniformity (%)Specific Strength (CN tex−1)Micronaire Value
2016W130.4 ± 0.38 a87.3 ± 0.35 a30.5 ± 1.5 a4.0 ± 0.11 a
W230.0 ± 0.06 ab87.0 ± 0.69 a30.7 ± 1.5 a4.2 ± 0.15 a
W329.9 ± 0.38 ab86.8 ± 0.33 a31.2 ± 1.2 a4.1 ± 0.10 a
W429.6 ± 0.33 b85.9 ± 0.31 b30.8 ± 0.7 a4.2 ± 0.17 a
W529.5 ± 0.35 b85.8 ± 0.15 b30.7 ± 1.3 a4.2 ± 0.15 a
2017W130.6 ± 0.48 a85.1 ± 0.78 a30.7 ± 0.20 a4.0 ± 0.31 a
W230.2 ± 0.53 ab84.7 ± 0.50 ab30.8 ± 0.10 a4.0 ± 0.14 a
W330.2 ± 0.10 ab84.6 ± 0.62 ab30.7 ± 0.72 a4.1 ± 0.07 a
W429.5 ± 0.21 bc84.4 ± 0.19 ab30.7 ± 0.40 a4.0 ± 0.31 a
W529.0 ± 0.84 c84.2 ± 0.47 b30.6 ± 0.62 a4.1 ± 0.26 a
Yearns**nsns
Year × Treatment*nsnsns
Means within a column of the same year followed by a different letter are significantly different (p < 0.05) according to the Duncan multiple range test. The same letters in the same column indicated no significant difference at 0.05 level in Duncan’s analysis in the same year. “*”, “**” means significance at the 0.05, 0.01 level, respectively. “ns” indicates non-significant.
Table 4. Correlation between physiological parameters and lint yield and at different growth stages.
Growth StagesLAIPnChlCPBVOBROB
FS0.637*0.5770.3240.722*0.748*0.291
FF0.918**0.907**0.5920.919**0.940**0.47
FB0.896**0.915**0.840**0.924**0.964**0.704*
LFB0.916**0.901**0.727*0.959**0.964**0.944**
BO0.946**0.806**0.4980.946**0.946**0.937**
“*” and “**” means significance at the 0.05, 0.01 level, respectively (both sides).

