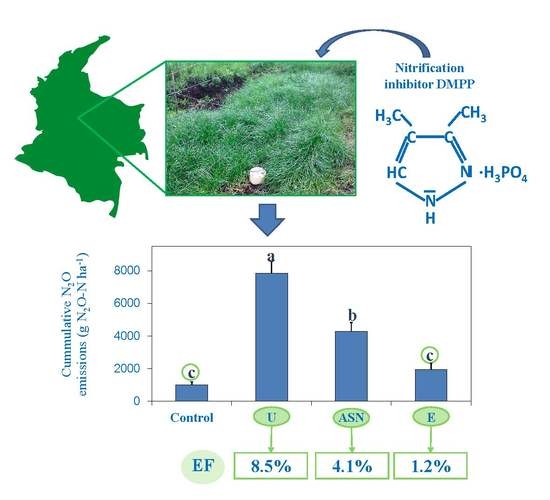
3,4-Dimethylpyrazole Phosphate (DMPP) Reduces N2O Emissions from a Tilled Grassland in the Bogotá Savanna

 , and
, and
Abstract
:
1. Introduction
2. Materials and Methods
2.1. Study Area
2.2. GHGs Emissions
2.3. Soil Mineral N and Soil Water Content
2.4. Ryegrass Yield and Quality, and Nitrogen Use Efficiency
2.5. Statistical Analysis
3. Results
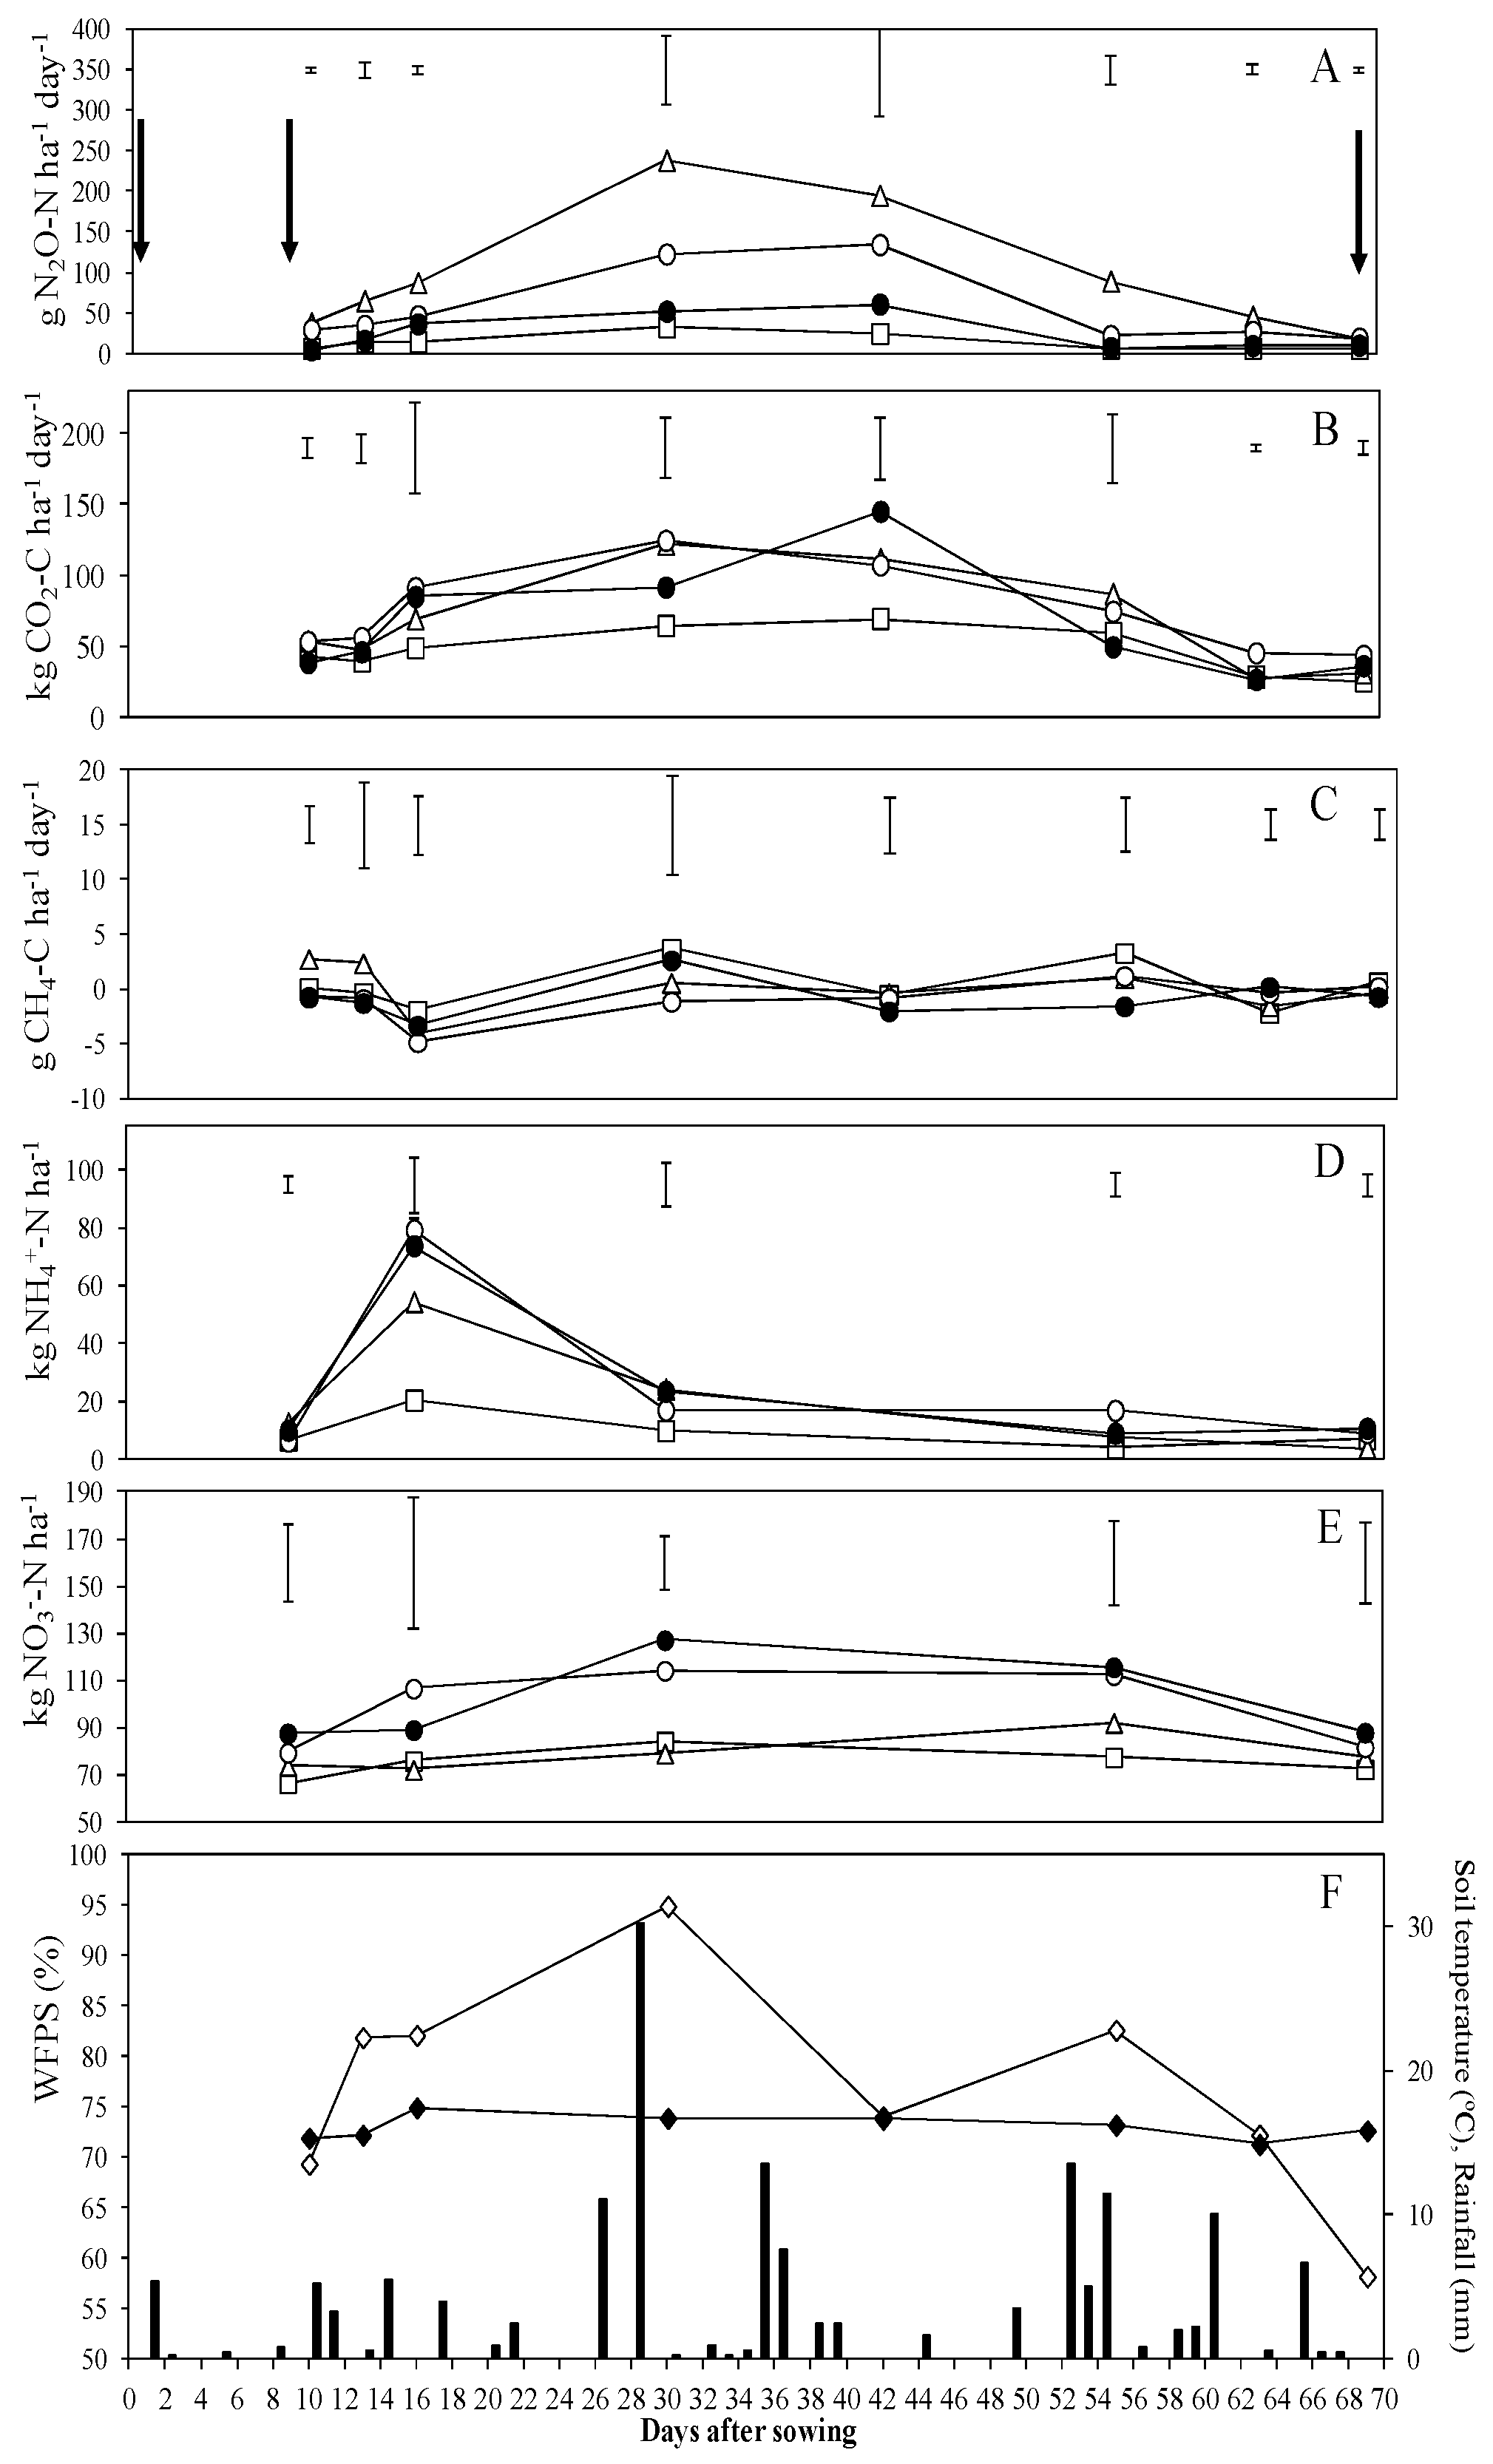
3.1. N2O Emissions
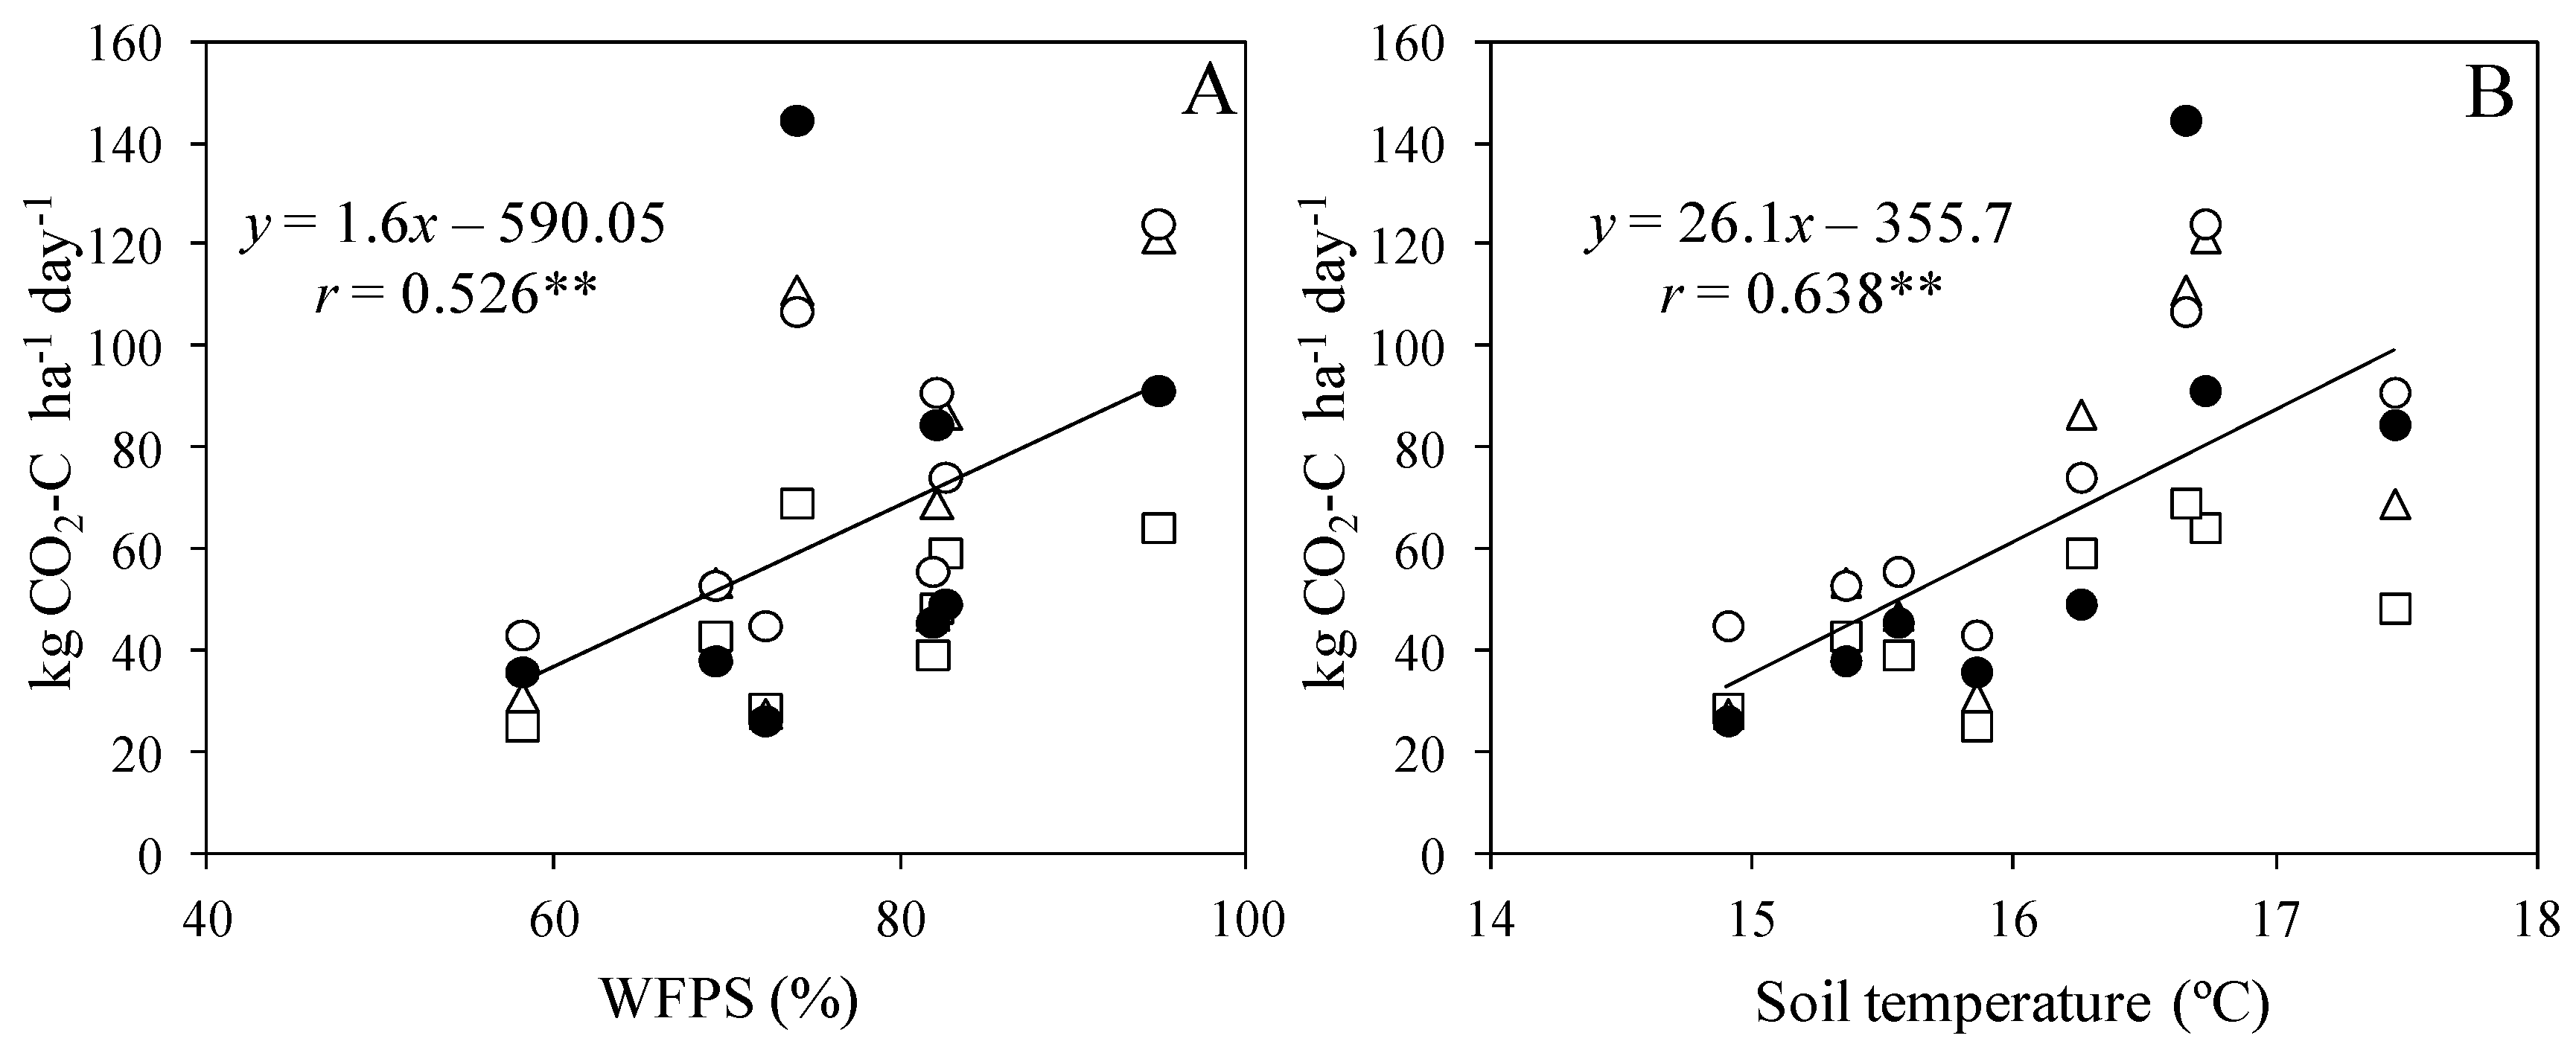
3.2. CO2 and CH4 Emissions
3.3. Ryegrass Yield and Quality
4. Discussion
4.1. N2O Emissions
4.2. CO2 and CH4 Emissions
4.3. Effect on Global GHGs Emissions
4.4. Effect on Yield and Quality
4.5. Efficiency of the N Fertilization Managements
5. Conclusions
Author Contributions
Acknowledgments
Conflicts of Interest
Abbreviations
References
- Smith, P.M.; Bustamante, H.; Ahammad, H.; Clark, H.; Dong, E.A.; Elsiddig, H.; Haberl, R.; Harper, J.; House, M.; Jafari, O.; et al. Agriculture, Forestry and Other Land Use (AFOLU). In Climate Change 2014: Mitigation of Climate Change; Contribution of Working Group III to the Fifth Assessment Report of the Intergovernmental Panel on Climate Change; Edenhofer, O., Pichs-Madruga, Y.R., Sokona, E., Farahani, S., Kadner, K., Seyboth, A., Adler, I., Baum, S., Brunner, P., Eickemeier, B., Eds.; Cambridge University Press: Cambridge, UK; New York, NY, USA, 2015. [Google Scholar]
- Balafoutis, A.T.; Koundouras, S.; Anastasiou, E.; Fountas, S.; Arvanitis, K. Life Cycle Assessment of Two Vineyards after the Application of Precision Viticulture Techniques: A Case Study. Sustainability 2017, 9, 1997. Available online: https://www.mdpi.com/2071-1050/9/11/1997 (accessed on 5 February 2019). [CrossRef]
- Ciais, P.; Sabine, C.; Bala, G.; Bopp, L.; Brovkin, V.; Canadell, J.; Chhabra, A.; DeFries, R.; Galloway, J.; Heimann, M.; et al. Carbon and Other Biogeochemical Cycles. In Climate Change 2013: The Physical Science Basis; Contribution of Working Group I to the Fifth Assessment Report of the Intergovernmental Panel on Climate Change; Stocker, T.F., Qin, D., Plattner, G.-K., Tignor, M., Allen, S.K., Boschung, J., Nauels, A., Xia, Y., Bex, V., Midgley, P.M., Eds.; Cambridge University Press: Cambridge, UK; New York, NY, USA, 2014. [Google Scholar]
- IDEAM—Institute of Hydrology, Meteorology and Environmental Studies; PNUD; MADS; DNP; CHANCELLERY. National and Departmental Inventory of Greenhouse Gases-Colombia, 3rd ed.; National Communication on Climate Change; IDEAM/PNUD/MADS/DNP/CHANCELLERY/FMAM: Bogotá, DC, USA, 2016. [Google Scholar]
- Balafoutis, A.; Beck, B.; Fountas, S.; Vangeyte, J.; Wal, T.; Soto, I.; Gómez Barrero, A.; Barnes, A.; Eory, V. Precision agriculture technologies positively contributing to GHG emissions mitigation, farm productivity and economics. Sustainability 2017, 9, 1339. Available online: https://www.mdpi.com/2071-1050/9/8/1339 (accessed on 5 February 2019). [CrossRef]
- Hallin, S.; Philippot, L.; Löffler, F.E.; Sanford, R.A.; Jones, C.M. Genomics and Ecology of Novel N2O-Reducing Microorganisms. Trends Microbiol. 2018, 26, 43–55. Available online: https://www.sciencedirect.com/science/article/pii/S0966842×17301737 (accessed on 15 January 2019). [CrossRef] [PubMed]
- Ruser, R.; Schulz, R. The effect of nitrification inhibitors on the nitrous oxide (N2O) release from agricultural soils—A review. J. Plant Nutr. Soil Sci. 2015, 178, 171–188. Available online: https://onlinelibrary.wiley.com/doi/full/10.1002/jpln.201400251 (accessed on 15 January 2019). [CrossRef]
- Le Mer, J.; Roger, P. Production, oxidation, emission y consumption of methane by soils: A review. Eur. J. Soil Biol. 2001, 37, 25–50. Available online: https://www.sciencedirect.com/science/article/pii/S1164556301010676 (accessed on 15 January 2019). [CrossRef]
- Asner, G.P.; Elmore, A.J.; Olyer, L.P.; Martin, R.E.; Harris, A.T. Grazing systems, ecosystem responses, and global change. Annu. Rev. Environ. Resour. 2004, 29, 261–299. Available online: https://www.annualreviews.org/doi/abs/10.1146/annurev.energy.29.062403.102142 (accessed on 15 January 2019). [CrossRef]
- Ball, B.C. Soil structure and greenhouse gas emissions: A synthesis of 20 years of experimentation. Eur. J. Soil Sci. 2013, 64, 357–373. Available online: https://onlinelibrary.wiley.com/doi/full/10.1111/ejss.12013 (accessed on 15 January 2019). [CrossRef]
- Boller, B.; Posselt, U.K.; Veronesi, F. (Eds.) Fodder Crops and Amenity Grasses; Springer: New York, NY, USA, 2010; pp. 395–437. [Google Scholar]
- Gałczyńska, M.; Gamrat, R.; Burczyk, P. Effect of nitrogen fertilization on N2O emission in different soil reactions and grown grass species. Appl. Ecol. Environ. Res. 2018, 16, 6761–6777. [Google Scholar] [CrossRef]
- DANE—National Administrative Department of Statistics. 3rd National Agricultural Census; GIT Communication Area DANE: Bogotá, DC, USA, 2016. [Google Scholar]
- Heffer, P.; Prud’homme, M. Global nitrogen fertilizer demand and supply: Trend, current level and outlook. In Solutions to Improve Nitrogen Use Efficiency for the World, Proceedings of the 2016 International Nitrogen Initiative Conference, Melbourne, Australia, 4–8 December 2016; The International Nitrogen Initiative: Nairobi, Kenya, 2016; Available online: http://www.ini2016.com/conference-proceedings-2 (accessed on 4 February 2019).
- Instituto Colombiano Agropecuario—ICA. Comercialización de Fertilizantes y Acondicionadores de Suelo Año 2016; Produmedios: Bogotá, DC, USA, 2017. [Google Scholar]
- Chadwick, D.R.; Cardenas, L.; Misselbrook, T.H.; Smith, K.A.; Rees, R.M.; Watson, C.J.; McGeough, K.L.; Williams, J.R.; Cloy, J.M.; Thorman, R.E.; et al. Optimizing chamber methods for measuring nitrous oxide emissions from plot-based agricultural experiments. Eur. J. Soil Sci. 2014, 65, 295–307. Available online: https://onlinelibrary.wiley.com/doi/full/10.1111/ejss.12117 (accessed on 15 January 2019). [CrossRef]
- Levy, P.E.; Cowan, N.; Van Oijen, M.; Famulari, D.; Drewer, J.; Skiba, U. Estimation of cumulative fluxes of nitrous oxide: Uncertainty in temporal upscaling and emission factors. Eur. J. Soil Sci. 2017, 68, 400–411. Available online: https://onlinelibrary.wiley.com/doi/full/10.1111/ejss.12432 (accessed on 15 January 2019). [CrossRef]
- IPCC. IPCC: Climate Change 2014: Synthesis Report; Contribution of Working Groups I, II and III to the Fifth Assessment Report of the Intergovernmental Panel on Climate Change; Core Writing Team, Pachauri, R.K., Meyer, L.A., Eds.; IPCC: Geneva, Switzerland, 2014; 151p. [Google Scholar]
- Cawse, P.A. The determination of nitrate in soil solutions by ultraviolet spectrophotometry. Analyst 1967, 92, 311–315. Available online: https://pubs.rsc.org/en/Content/ArticleLanding/1967/AN/AN9679200311#!divAbstract (accessed on 15 January 2019). [CrossRef]
- Linn, D.M.; Doran, J.W. Effect of water-filled pore space on carbon dioxide and nitrous oxide production in tilled and nontilled soils. Soil Sci. Soc. Am. J. 1984, 48, 1267–1272. Available online: https://pubag.nal.usda.gov/pubag/downloadPDF.xhtml?id=16745&content=PDF (accessed on 4 February 2019). [CrossRef]
- AOAC. Official Methods of Analysis Association of Official Analytical Chemist, 16th ed.; AOAC: Washington, DC, USA, 1990. [Google Scholar]
- Moore, G.; Sanford, P.; Wiley, T. Perennial Pastures for Western Australia; Department of Primary Industries and Regional Development: South Perth, Australia, 2006. [Google Scholar]
- Clayton, H.; McTaggart, I.P.; Parker, J.; Swan, L.; Smith, K.A. Nitrous oxide emissions from fertilized grassland: A 2-year study of the effects of N fertilizer form and environmental conditions. Biol. Fert. Soils 1997, 25, 252–260. Available online: https://link.springer.com/article/10.1007/s003740050311 (accessed on 15 January 2019). [CrossRef]
- Davidson, E.A. Fluxes of nitrous oxide y nitric oxide from terrestrial ecosystem. In Microbial Production and Consumption of Greenhouse Gases: Methane, Nitrogen Oxides, and Halomethanes; Rogers, J.E., Whitman, W.B., Eds.; American Society of Microbiology: Washington, DC, USA, 1991; pp. 219–235. [Google Scholar]
- Blackmer, A.M.; Bremner, J.M. Inhibitory effect of nitrate on reduction of N2O to N2 by soil microorganisms. Soil Biol. Biochem. 1978, 10, 187–191. Available online: https://www.sciencedirect.com/science/article/abs/pii/0038071778900950 (accessed on 15 January 2019). [CrossRef]
- Cho, C.M.; Sakdinan, L. Mass spectrometric investigation on denitrification. Can. J. Soil Sci. 1978, 58, 443–457. Available online: http://www.nrcresearchpress.com/doi/pdf/10.4141/cjss78-051 (accessed on 2 February 2019). [CrossRef]
- Ruser, R.; Flessa, H.; Russow, R.; Schmidt, G.; Buegger, F.; Munch, J.C. Emission of N2O, N2 and CO2 from soil fertilized with nitrate: Effect of compaction, soil moisture and rewetting. Soil Biol. Biochem. 2006, 38, 263–274. Available online: https://www.sciencedirect.com/science/article/pii/S0038071705001975 (accessed on 15 January 2019). [CrossRef]
- Misselbrook, T.H.; Cardenas, L.M.; Camp, V.; Thorman, R.E.; Williams, J.R.; Rollett, A.J.; Chambers, B.J. An assessment of nitrification inhibitors to reduce nitrous oxide emissions from UK agriculture. Environ. Res. Lett. 2014, 9, 115006. Available online: http://iopscience.iop.org/article/10.1088/1748-9326/9/11/115006 (accessed on 15 January 2019). [CrossRef]
- Bouwman, A.F.; Boumans, L.J.M.; Batjes, N.H. Emissions of N2O and NO from fertilized fields: Summary of available measurement data. Glob. Biogeochem. Cycles 2002, 16, 1–13. Available online: https://agupubs.onlinelibrary.wiley.com/doi/10.1029/2001GB001811 (accessed on 15 January 2019). [CrossRef]
- Huérfano, X.; Menéndez, S.; Bolaños-Benavides, M.M.; González-Moro, M.B.; Estavillo, J.M.; González-Murua, C. The nitrification inhibitor 3, 4-dimethylpyrazole phosphate decreases leaf nitrate content in lettuce while maintaining yield and N2O emissions in the Savanna of Bogotá. Plant Soil Environ. 2016, 62, 533–539. Available online: https://www.agriculturejournals.cz/publicFiles/105_2016-PSE.pdf (accessed on 15 January 2019). [CrossRef]
- Flessa, H.; Beese, F. Laboratory estimates of trace gas emissions following surface application and injection of cattle slurry. J. Environ. Qual. 2000, 29, 262–268. Available online: https://dl.sciencesocieties.org/publications/jeq/abstracts/29/1/JEQ0290010262 (accessed on 15 January 2019). [CrossRef]
- Merino, P.; Menéndez, S.; Pinto, M.; González-Murua, C.; Estavillo, J.M. 3, 4-Dimethylpyrazole phosphate reduces nitrous oxide emissions from grassland after slurry application. Soil Use Manag. 2005, 21, 53–57. Available online: https://onlinelibrary.wiley.com/doi/abs/10.1111/j.1475-2743.2005.tb00106.x (accessed on 5 February 2019). [CrossRef]
- Menéndez, S.; Barrena, I.; Setien, I.; González-Murua, C.; Estavillo, J.M. Efficiency of nitrification inhibitor DMPP to reduce nitrous oxide emissions under different temperature y moisture conditions. Soil Biol. Biochem. 2012, 53, 82–89. Available online: https://www.sciencedirect.com/science/article/pii/S0038071712001745 (accessed on 15 January 2019). [CrossRef]
- IPCC. Guidelines for National Greenhouse Gas Inventories; Prepared by the National Greenhouse Gas Inventories Programme; Eggleston, H.S., Buendia, L., Miwa, K., Ngara, T., Tanabe, K., Eds.; IGES: Tokyo, Japan, 2006. [Google Scholar]
- Kiese, R.; Butterbach-Bahl, K. N2O y CO2 emissions from three different tropical forest sites in the wet tropics of Queensly, Australia. Soil Biol. Biochem. 2002, 34, 975–987. Available online: https://www.sciencedirect.com/science/article/pii/S0038071702000317 (accessed on 15 January 2019). [CrossRef]
- Davidson, E.A.; Belk, E.; Boone, R. Soil water content y temperature as independent or confounded factors controlling soil respiration in a temperate mixed hardwood forest. Glob. Chang. Biol. 1998, 4, 217–227. Available online: https://onlinelibrary.wiley.com/doi/epdf/10.1046/j.1365-2486.1998.00128.x (accessed on 5 February 2019). [CrossRef]
- Frank, A.B.; Liebig, M.A.; Hanson, J.D. Soil carbon dioxide fluxes in northern semiarid grasslands. Soil Biol. Biochem. 2002, 34, 1235–1241. Available online: https://www.sciencedirect.com/science/article/pii/S0038071702000627 (accessed on 5 February 2019). [CrossRef]
- Doran, J.W.; Mielke, L.N.; Power, J.F. Microbial activity as regulated by soil water-filled pore space. In Proceedings of the Transactions 14th International Congress of Soil Science, Kyoto, Japan, 12–18 August 1990; Available online: https://pdfs.semanticscholar.org/e60e/fe717a845e830e103037418a58a65e46b9b4.pdf (accessed on 5 February 2019).
- Grisi, B.; Grace, C.; Brookes, P.C.; Benedetti, A.; Dell’abate, M.T. Temperature effects in organic matter and microbial biomass dynamics in temperate and tropical soils. Soil Biol. Biochem. 1998, 30, 1309–1315. Available online: https://www.sciencedirect.com/science/article/abs/pii/S0038071798000169 (accessed on 5 February 2019). [CrossRef]
- Huérfano, X.; Estavillo, J.M.; Fuertes-Mendizábal, T.; Torralbo, F.; González-Murua, C.; Menéndez, S. DMPSA and DMPP equally reduce N2O emissions from a maize-ryegrass forage rotation under Atlantic climate conditions. Atmos. Environ. 2018, 187, 255–265. Available online: https://www.sciencedirect.com/science/article/pii/S1352231018303753 (accessed on 5 February 2019). [CrossRef]
- Drewer, J.; Anderson, M.; Levy, P.E.; Scholtes, B.; Helfter, C.; Parker, J.; Rees, R.M.; Skiba, U.M. The impact of ploughing intensively managed temperate grasslands on N2O, CH4 and CO2 fluxes. Plant Soil 2016, 411, 193–208. Available online: https://link.springer.com/article/10.1007/s11104-016-3023-x (accessed on 5 February 2019). [CrossRef]
- Whalen, S.C.; Reeburgh, W.S. Moisture and temperature sensitivity of CH4 oxidation in boreal soils. Soil Biol. Biochem. 1996, 28, 1271–1281. Available online: https://cloudfront.escholarship.org/dist/prd/content/qt23j8z4gw/qt23j8z4gw.pdf (accessed on 5 February 2019). [CrossRef]
- Wilkins, P.W.; Allen, D.K.; Mytton, R.L. Differences in the nitrogen use efficiency of perennial ryegrass varieties under simulated rotational grazing and their effects on nitrogen recovery and herbage nitrogen content. Grass Forrage Sci. 2000, 55, 69–79. Available online: https://onlinelibrary.wiley.com/doi/full/10.1046/j.1365-2494.2000.00199.x (accessed on 15 January 2019). [CrossRef]
- Belastegui-Macadam, X.M.; Estavillo, J.M.; García-Mina, J.M.; González, A.; Bastias, E.; Gónzalez-Murua, C. Clover and ryegrass are tolerant species to ammonium nutrition. J. Plant Physiol. 2007, 164, 1583–1594. Available online: https://www.ncbi.nlm.nih.gov/pubmed/17485140 (accessed on 15 January 2019). [CrossRef] [PubMed]
- Pinto, M.; Merino, P.; Del Prado, A.; Estavillo, J.M.; Yamulki, S.; Gebauer, G.; Piertzak, S.; Lauf, J.; Oenema, O. Increased emissions of nitric oxide and nitrous oxide following tillage of a perennial pasture. Nutr. Cycl. Agroecosyst. 2004, 70, 13–22. Available online: https://link.springer.com/article/10.1023/B:FRES.0000049357.79307.23 (accessed on 15 January 2019). [CrossRef]
- Van Groenigen, J.W.; Velthof, G.L.; Oenema, O.; Van Groenigen, K.J.; Van Kessel, C. Towards an agronomic assessment of N2O emissions: A case study for arable crops. Eur. J. Soil Sci. 2010, 61, 903–913. Available online: https://onlinelibrary.wiley.com/doi/full/10.1111/j.1365-2389.2009.01217.x (accessed on 15 January 2019). [CrossRef]
- Ehrhardt, F.; Soussana, J.F.; Bellocchi, G.; Grace, P.; McAuliffe, R.; Recous, S.; Sándor, R.; Smith, P.; Snow, V.; de Antoni Migliorati, M.; et al. Assessing uncertainties in crop and pasture ensemble model simulations of productivity and N2O emissions. Glob. Chang. Biol. 2018, 24, 603–616. Available online: https://onlinelibrary.wiley.com/doi/full/10.1111/gcb.13965 (accessed on 15 January 2019). [CrossRef] [PubMed]


| Soil Texture | Soil Chemical Properties | |||||||||
|---|---|---|---|---|---|---|---|---|---|---|
| Sand (%) | Silt (%) | Clay (%) | pH | OC * (%) | N (%) | ECEC ** cmol (+) kg−1 | P (ppm) | Ca (ppm) | Mg (ppm) | K (ppm) |
| 36 | 47 | 17 | 5.7 | 9 | 0.74 | 21.6 | 85.3 | 1880 | 629 | 2254 |
| Treatment | CO2-C (kg ha−1) | CH4-C (g ha−1) | N2O-N (g ha−1) | GWP (Mg CO2 eq ha−1) | EF (%) | |
|---|---|---|---|---|---|---|
| Unfertilized | 2506 ± 635 a | 46 ± 29 a | 1019 ± 170 c | 9.7 ± 2.3 a | ||
| Urea | 3954 ± 1065 a | −20 ± 47 a | 7839 ± 732 a | 18.3 ± 4.0 a | 8.5 | (86%) |
| ASN | 4189 ± 1214 a | −77 ± 41 a | 4287 ± 541 b | 17.4 ± 4.4 a | 4.1 | (71%) |
| ASN+DMPP | 3530 ± 1079 a | −53 ± 65 a | 1958 ± 351 c | 13.9 ± 4.0 a | 1.2 | |
| ANOVA Components | F(3,12) = 0.537; p = 0.666 | F(3,12) = 1.277; p = 0.327 | F(3,12) = 37.628; p = 0.000 | F(3,12) = 1.079; p = 0.395 | ||
| Treatment | Yield (kg DM ha−1) | CP (% DM) | ADF (% DM) | NUE (kg DM/kg N Applied) | ANR (%) |
|---|---|---|---|---|---|
| Unfertilized | 1456 ± 76 c | 26 ± 0.23 b | 44 ± 0.65 a | ||
| Urea | 1956 ± 69 ab | 28 ± 0.24 a | 43 ± 1.93 a | 6.2 ± 0.98 a | 34 ± 3.45 a |
| ASN | 1836 ± 83 b | 25 ± 0.54 b | 43 ± 2.05 a | 4.7 ± 1.36 a | 17 ± 2.90 b |
| ASN+DMPP | 2057 ± 51 a | 26 ± 0.51 b | 47 ± 0.91 a | 7.5 ± 1.01 a | 33 ± 6.09 a |
| ANOVA components | F(3,12) = 13.667; p = 0.000 | F(3,12) = 6.538; p = 0.007 | F(3,12) = 1.225; p = 0.343 | F(2,9) = 1.275; p = 0.326 | F(2,9) = 4.064; p = 0.049 |
| Treatment | N-Yield-Scaled N2O Emission (g N2O-N kg N Uptake−1) | Yield-Scaled N2O Emission (g N2O-N kg DM Harvested−1) |
|---|---|---|
| Unfertilized | 17 ± 4 c | 0.7 ± 0.2 c |
| Urea | 89 ± 7 a | 4.0 ± 0.3 a |
| ASN | 57 ± 6 b | 2.3 ± 0.3 b |
| ASN+DMPP | 23 ± 4 c | 1.0 ± 0.1 c |
| ANOVA components | F(3,12) = 35.477; p = 0.000 | F(3,12) = 40.289; p = 0.000 |
© 2019 by the authors. Licensee MDPI, Basel, Switzerland. This article is an open access article distributed under the terms and conditions of the Creative Commons Attribution (CC BY) license (http://creativecommons.org/licenses/by/4.0/).
Share and Cite
Huérfano, X.; Menéndez, S.; Bolaños-Benavides, M.-M.; González-Murua, C.; Estavillo, J.-M. 3,4-Dimethylpyrazole Phosphate (DMPP) Reduces N2O Emissions from a Tilled Grassland in the Bogotá Savanna. Agronomy 2019, 9, 102. https://doi.org/10.3390/agronomy9020102
Huérfano X, Menéndez S, Bolaños-Benavides M-M, González-Murua C, Estavillo J-M. 3,4-Dimethylpyrazole Phosphate (DMPP) Reduces N2O Emissions from a Tilled Grassland in the Bogotá Savanna. Agronomy. 2019; 9(2):102. https://doi.org/10.3390/agronomy9020102
Chicago/Turabian StyleHuérfano, Ximena, Sergio Menéndez, Matha-Marina Bolaños-Benavides, Carmen González-Murua, and José-María Estavillo. 2019. "3,4-Dimethylpyrazole Phosphate (DMPP) Reduces N2O Emissions from a Tilled Grassland in the Bogotá Savanna" Agronomy 9, no. 2: 102. https://doi.org/10.3390/agronomy9020102