Kura Clover Living Mulch: Spring Management Effects on Nitrogen


1
Department of Soil, Water and Climate, University of Minnesota, St. Paul, MN 55108-6028, USA
2
United States Department of Agriculture, Agricultural Research Service, St. Paul, MN 55108-6028, USA
3
Department of Agronomy and Plant Genetics, University of Minnesota, St. Paul, MN 55108-6028, USA
*
Author to whom correspondence should be addressed.
Agronomy 2019, 9(2), 69; https://doi.org/10.3390/agronomy9020069
Submission received: 31 December 2018
/
Revised: 22 January 2019
/
Accepted: 1 February 2019
/
Published: 2 February 2019
(This article belongs to the Special Issue Innovations towards Organic and Agro-Ecological Food and Farming Systems)
Abstract
:Kura clover living mulch (KCLM) systems have the potential to provide ecosystem services in intensively managed cropping systems while supplying soil mineral nitrogen (N) to the growing cash crop. Living mulch management relies on strong spring suppression to reduce competition between vigorous kura clover and emerging row crop seedlings, but standard suppression management practices utilize widely different modes of action. The objective of this research was to gain insight into the impact of common KCLM management practices on early season N dynamics. Kura clover was mowed, and residue was either harvested or returned before rows were established via strip tillage or banded herbicide. Soil and gaseous N pools were monitored for 12 weeks post initial application of suppression management treatments. An enrichment factor (EF) approach was utilized to compare N pools under managed treatments relative to an unmanaged clover control. Strip tillage increased soil N by 300%, while banded herbicide row establishment increased soil N by 220% relative to the unmanaged control. Pre-plant clover harvest reduced short term soil NO3–N, but during later time intervals there was no relationship between residue management and soil N. We conclude that, for the dual goals of maintaining clover perenniality while providing greater soil N enrichment, strip tillage is superior to band herbicide for row establishment. Additionally, pre-plant clover harvest may open opportunities for dual harvests in a single growing season, increasing economic return while maintaining in-season N contributions from the living mulch.
Keywords:
kura clover; living mulch; inter-cropping; agronomics; nitrogen; mineralization; enrichment factor
1. Introduction
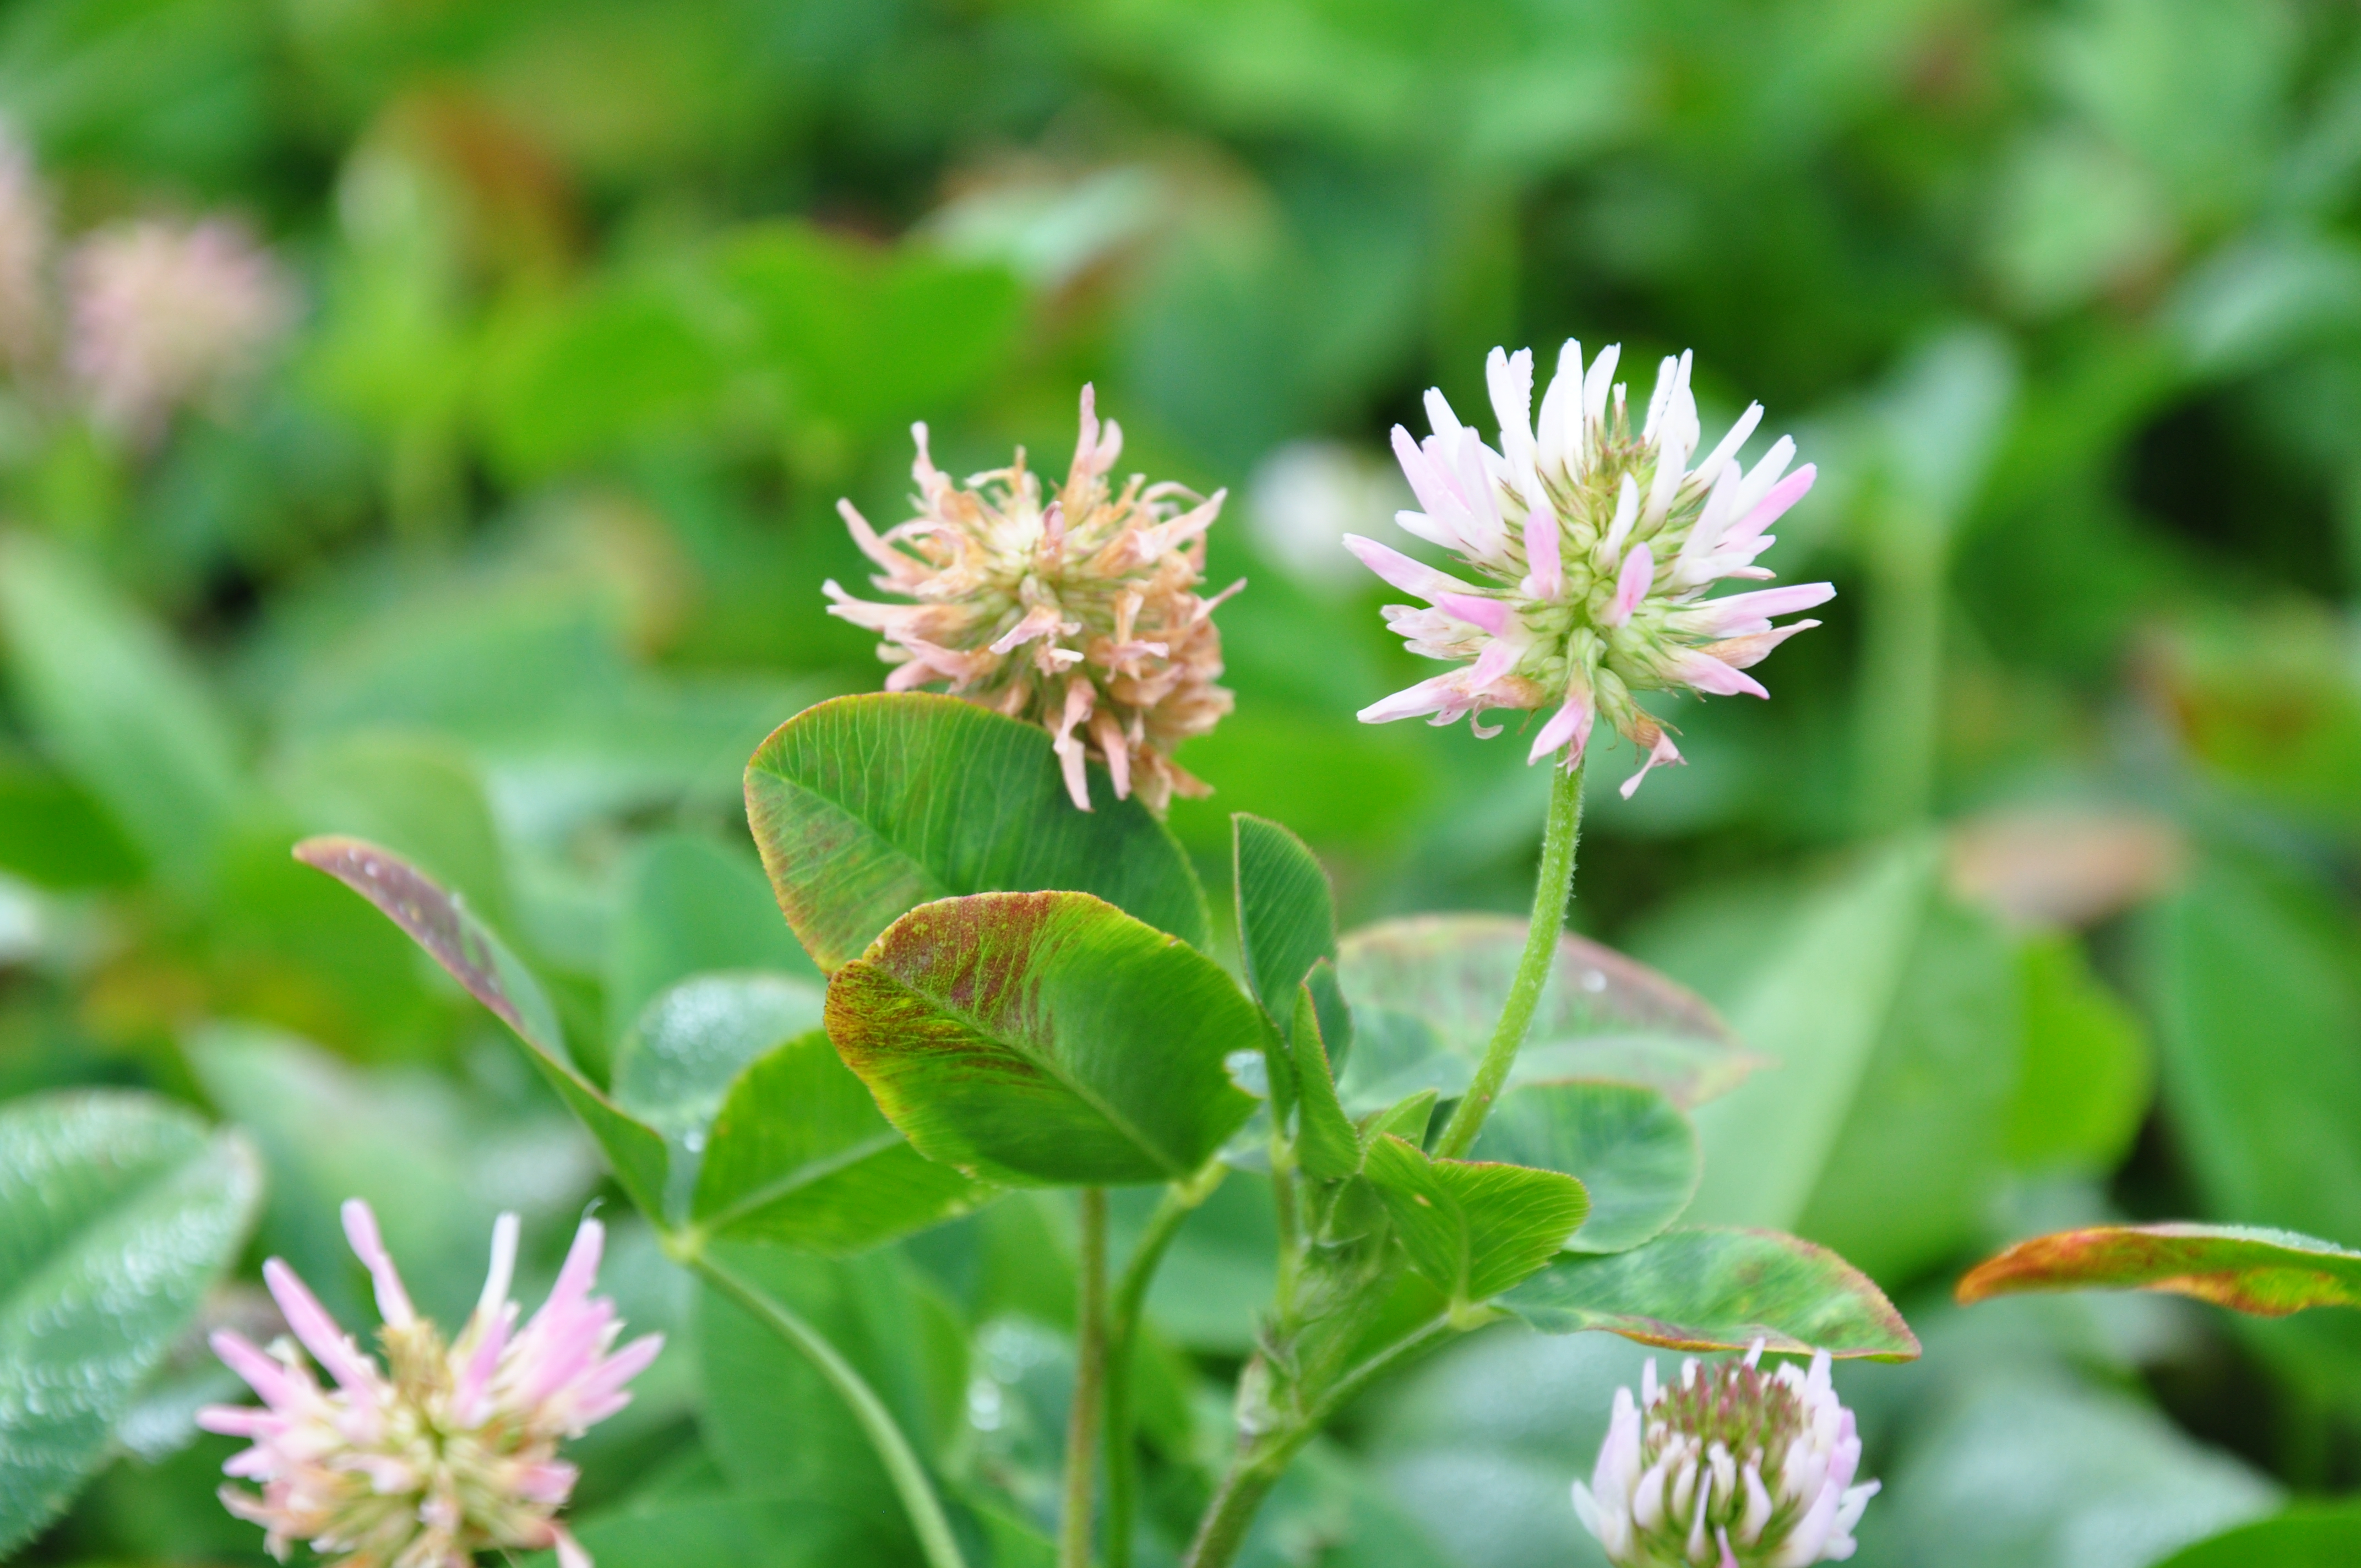
Kura clover (Trifolium ambiguum M. bieb.) is a rhizatomous persistent perennial legume forage crop native to the mountainous regions of eastern Europe [1]. Its dense root and rhizome system allows for frequent defoliation and vegetative repropagation in harsh environments [2]. This extreme persistence, along with its shade, drought, flood, and cold tolerance, low-growing habit, and nitrogen-rich biomass has prompted researchers to investigate its use as a living mulch in cropping systems of the Upper Midwestern U.S. [3,4].
Kura clover living mulch (KCLM) systems have been recognized for their soil and water conservation benefits, including reduced soil erosion [5], increased water infiltration (Baker, unpublished data), and reduced nitrate leaching [6] and residual N [7], compared to conventionally managed crop rotations. These environmental benefits, however, are often accompanied by reduced yields of the main cash crop [4,5,6,7,8,9,10]. Competition between the living mulch and emerging row crop seedlings is a primary factor for delayed crop development and yield loss [4,10,11]. This factor has led to the development of more aggressive suppression management practices during the critical spring establishment period [4,8].
Vigorous spring clover regrowth stores large amounts of organic N in protein-rich biomass early in the growing season. When spring growing conditions allow, clover may be harvested as forage [9], but most often, residue is returned via suppression management, and low C/N clover tissues are readily mineralized upon senescence and incorporation [8,12]. Clover suppression techniques often utilize combinations of pre-plant mowing [8,9], broadcast chemical suppression [5,6,10,11], strip-tillage [12,13], and/or chemical banding [4,7,14] before and after the planting date. These management techniques vary in the amount of clover disturbance, the degree of incorporation, and the spatial organization of disturbed residues.
Methods of clover suppression and residue incorporation impact the resulting soil environment, which plays an important role in the spatiotemporal mineral N supply from biomass decomposition [15,16]. Kura clover living mulch systems could be better utilized if management techniques were designed and chosen based on organic N cycling dynamics. Enhanced understanding of KCLM suppression management techniques may reveal agronomic benefits, such as a reduction in the fertilizer N requirement for the cash crop, while achieving soil and water conservation benefits.
This experiment branches from a two-year N management study for continuous corn in KCLM. Preliminary data from the first year of these experiments suggested increased soil N after herbicide suppression management, leading to our hypothesis that clover disturbance and suppression increases the reactive N supply in KCLM systems [17]. The objective of this study was to compare N availability and loss pathways from commonly used KCLM suppression management practices. Understanding nitrogen dynamics and clover recovery after spring clover suppression management could facilitate the design of more stable, resilient, and beneficial companion cropping systems for the Upper Midwestern corn belt.
2. Materials and Methods
2.1. Site Description and Experimental Design
A field study was conducted from 29 May through 22 August, 2018 to investigate spatiotemporal N dynamics in KCLM systems after spring agronomic management. Plots were located at the University of Minnesota Research and Outreach Center in Rosemount, MN (44.73° N, 93.09° W) on a Waukegan silt loam (fine-silty over sandy or sandy-skeletal, mixed, superactive, mesic Typic Hapludolls). Soils from an adjacent experiment were grid sampled to 0.3 m (n = 64) and contained an average of 20.5 g kg−1 organic carbon and 5.7 pH in KCl [17]. Endura kura clover was seeded at 11 kg ha−1 in 2006 and used as a living mulch for row crop production from 2008–2009, rhizomes were dug up with a potato digger for vegetative repropagation in 2010 [18], row crop production commenced in 2011–2014, and three hay cuttings and one seed harvest were taken from 2015–2017. In 2015, P and K were applied according to soil test values.
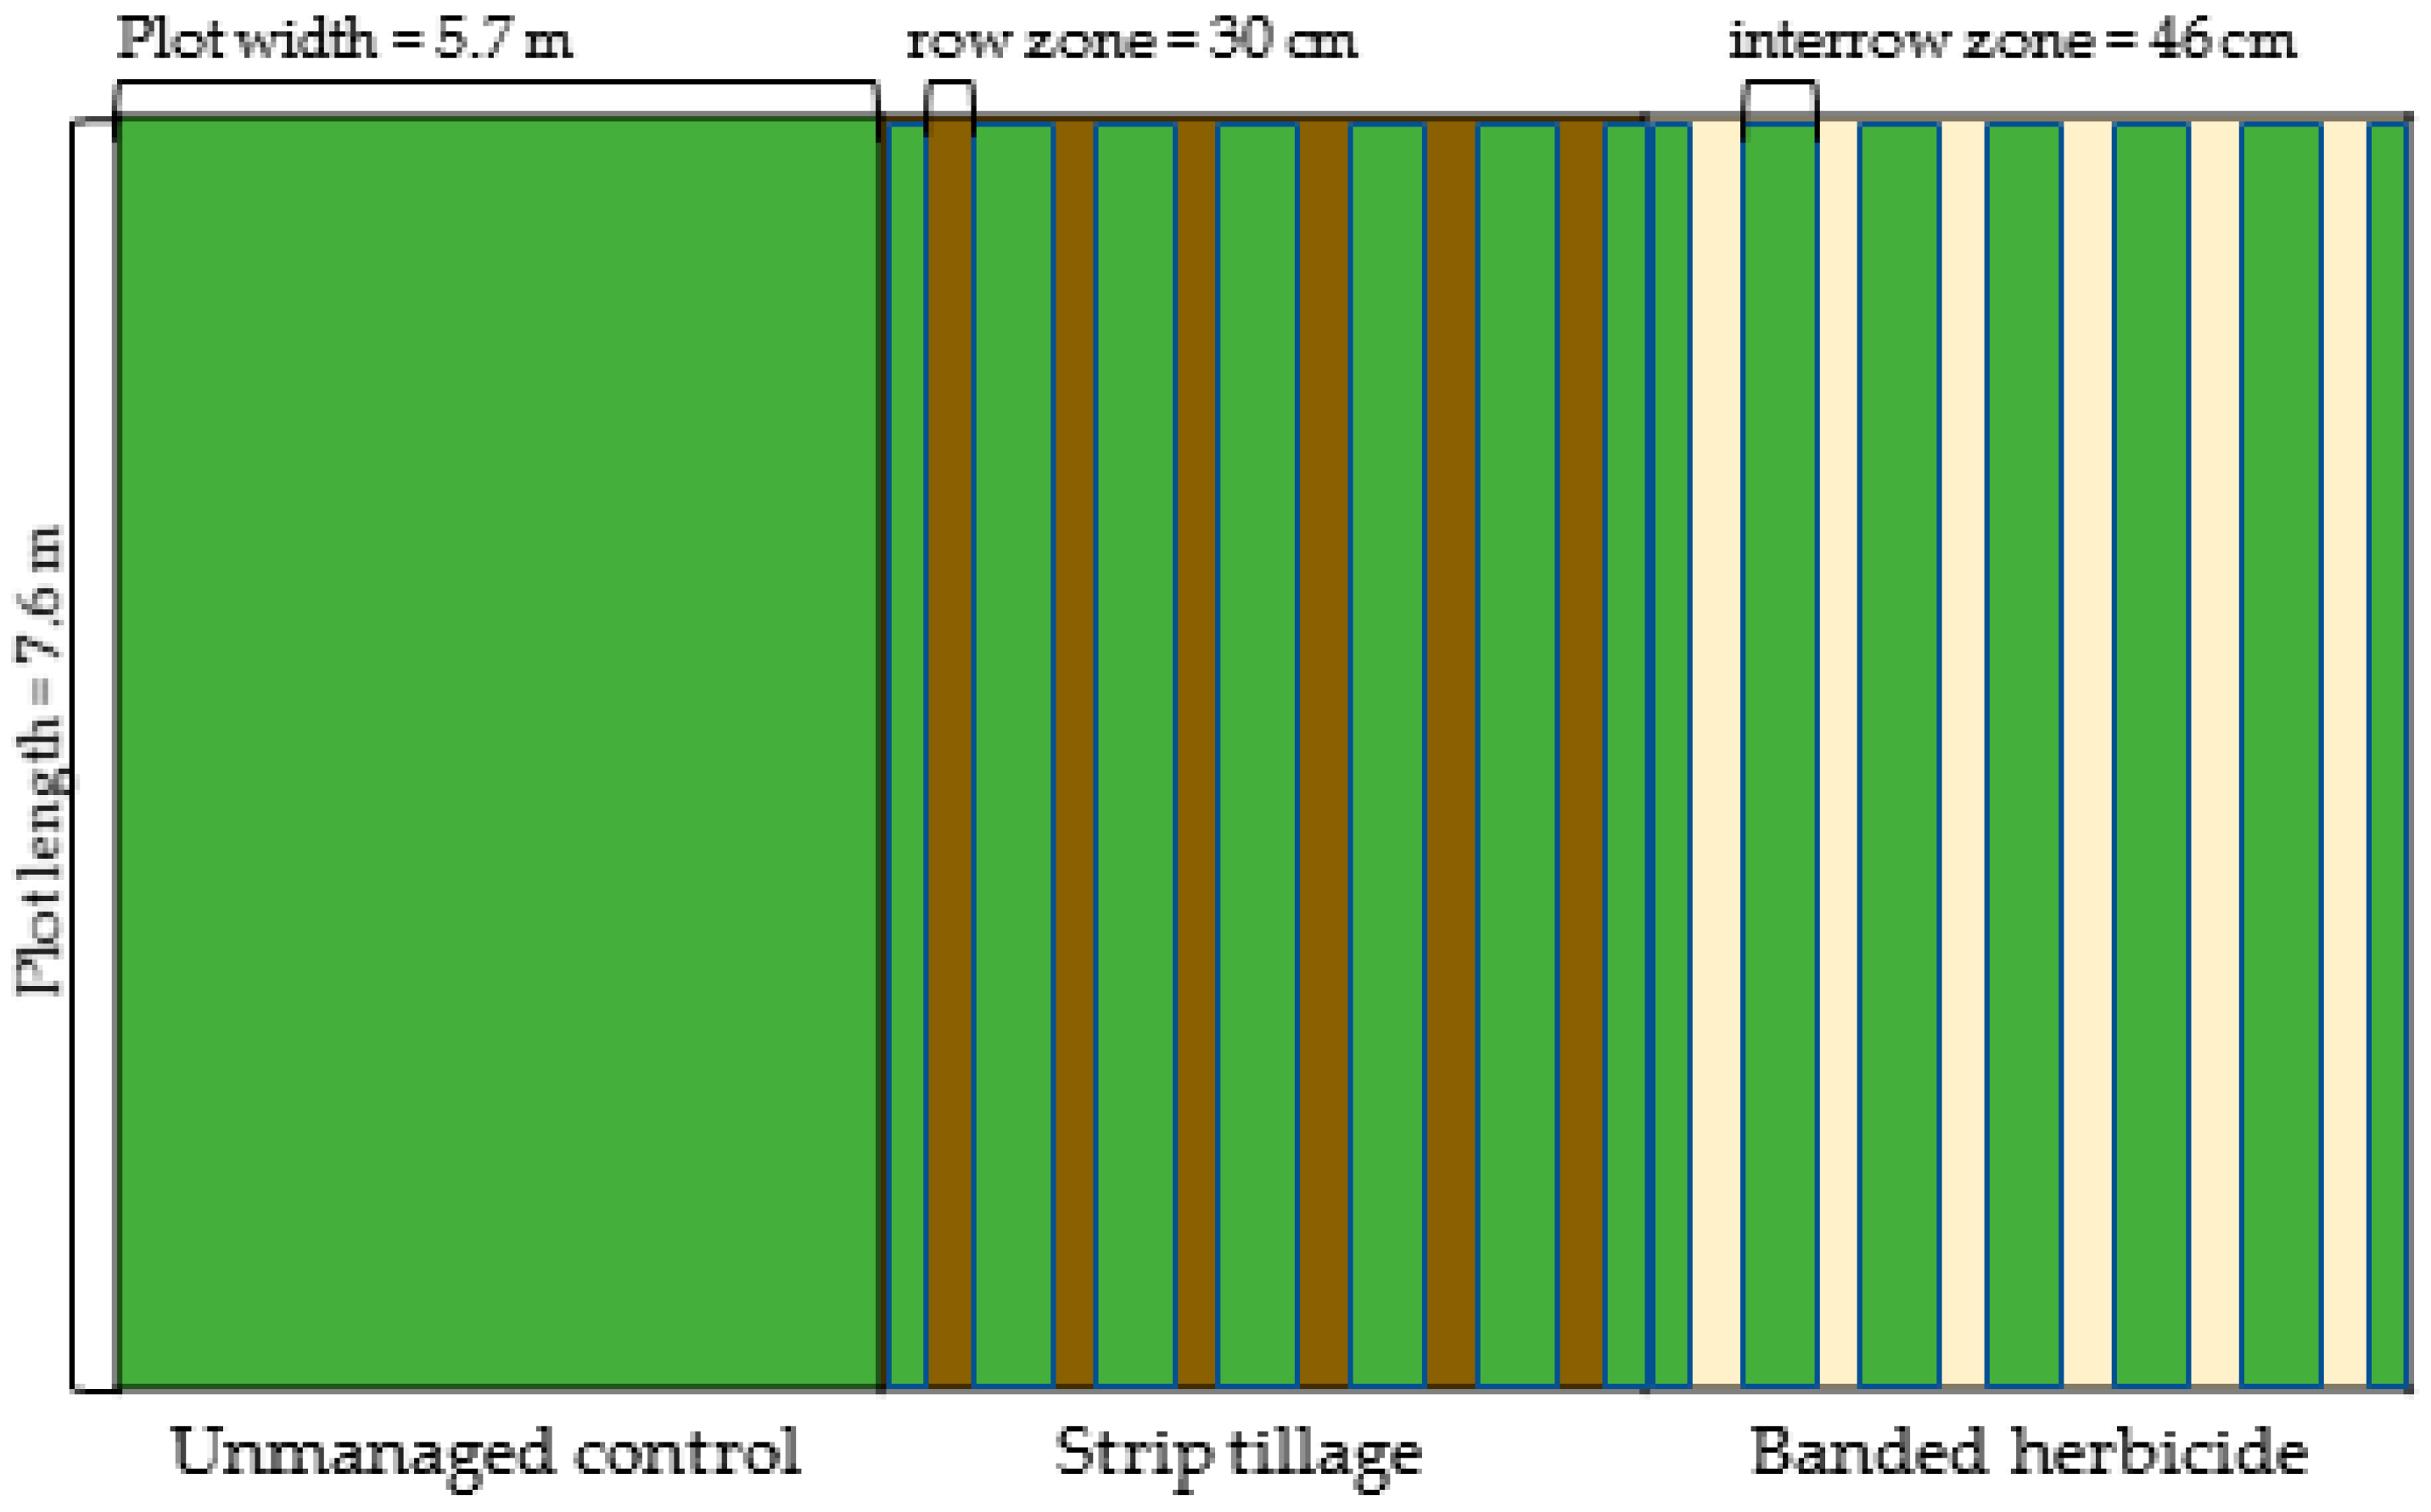
Two main clover management factors were examined: (i) seed-row establishment, with the row prepared either mechanically by rotary strip-tillage (‘T’), or chemically using a banded herbicide or ‘kill’ (‘K’) application, and (ii) residue management, with mowed residue removed from (‘Rm’) or returned to (‘Rt’) the plots, resulting in four residue-row treatment combinations, i.e., T/Rm, T/Rt, K/Rm, and K/Rt (Table 1). An additional unmanaged control treatment, which was not mowed and had no row establishment, was also examined. Plots were arranged in a randomized complete block design with three replications of the five treatments and were 4.7 m (6 rows) wide by 7.6 m. In addition, the four plots within each block receiving row and residue management were split by ‘row’ and ‘interrow’ zones after row management treatments were applied (Figure A1). Clover was mowed to 50 mm on 29 May, and on 31 May cut clover residue was raked and removed. Rows were established on 4 June. Kill treatments received N-(phosphonomethyl) glycine (glyphosate) at 9.35 L a.e. ha−1 applied with a walk-behind sprayer unit in 0.3-m bands spaced every 0.76 m. Strip-till treatments were tilled using a rotary zone tillage tool (Northwest Tillers, Yakima, WA, USA) which created 0.3-m wide strips on 0.76-m intervals. An additional 2.3 L a.e. ha−1 of glyphosate was broadcast on managed plots (all treatments except the control) on 22 June to inhibit clover regrowth [5,6,10].
Row-crops were not seeded into plots after row establishment so that the measured soil N pools could be isolated from soil N uptake by the main cash crop.
2.2. Soil N
Soils were collected bi-weekly from 17 May to 5 July and on 17 July, 6 August, and 22 August. Samples were taken at three depths (0–50, 50–150, and 150–300 mm) with a 20-mm i.d. coring device. Sample location was random in the unmanaged control and at the center of a randomly selected pair of row and interrow zones in managed plots. Samples were weighed and homogenized before 38 mL of 2 M KCl solution was added to a 10 g subsample of wet soil and shaken at 120 rpm for 1 h. Soil slurry was filtered through 11 µm filter paper and the extract was analyzed for NO3–N and NH4–N concentrations with the Greiss–Ilosvay with cadmium reduction and the sodium salicylate–nitroprusside methods, respectively, modified for flow-through injection analysis (Lachat, Loveland, CO, USA) [19]. Cadmium reduces NO3–N to NO2–N, which is detected by the Greiss–Ilosvay method, therefore reported values for NO3–N are the sum of NO2–N and NO3–N. A second subsample of 5 g wet soil was oven dried for at least 24 h and weighed to determine gravimetric water content. Core volume and adjusted dry sample mass were used to calculate bulk density which was used to convert soil N concentrations on a soil mass basis (e.g., mg N g−1) to a per hectare basis (e.g., kg N ha−1) by depth interval.
2.3. Soil-Atmosphere Gas Exchange
Nitrous oxide emissions were measured bi-weekly from 24 May–5 July using non-steady-state chambers [20]. Chamber bases measuring 0.7 m long × 0.36 m wide × 0.1 m deep were installed by trenching base dimensions with an electric chainsaw and pressing the acrylic base at least 50 mm into the ground. Bases were placed randomly within unmanaged control plots and randomly in managed treatments with the condition that the base spanned one row-width, containing equivalent ratios of row and interrow zones to field scale proportions. Bases in non-tilled treatments were installed 48 h before initial sampling to mitigate high gas flux from disturbance while bases in tilled treatments were installed immediately after tillage and hours before sampling to capture the effect of soil mixing on soil-to-atmosphere gas emissions, as done previously [21,22]. Chamber displacement by clover biomass was calculated using fresh clover moisture content determined via oven-drying and density obtained via water displacement so that fresh clover volume could be calculated from in-season dry biomass measurements. The chamber volume used in the flux calculations was adjusted by subtracting the wet clover volume from the total above ground chamber volume [23]. Biomass that exceeded chamber top height was folded into each top upon chamber placement [23]. Atmospheric N2O–N concentration was sampled from the top of the clover canopy from each control plot with a 12 mL polypropylene syringe. These samples represented the initial (time 0) measurement for all chambers within the corresponding block. Insulated and vented chamber tops were then placed and secured onto bases with binder clips. Gas samples were collected from each chamber at 20, 40, and 60 min after chamber top placement and the 12 mL samples were immediately transferred to glass vials sealed with butyl rubber septa. Samples were handled and analyzed according to [20] with a 5890A Gas Chromatography analyzer (Hewlett–Packard, Palo Alto, CA, USA) in conjunction with a 7000 Headspace Autosampler (Teledyne Tekmar, Mason, OH, USA). Gas fluxes were calculated using the restricted quadratic method, where quadratic regression is used unless the second derivative of the resulting quadratic regression function is greater than 0, in which case linear regression is used [24].
Ammonia (NH3–N) emissions were measured bi-weekly from 24 May to 5 July. Transparent chambers were assembled and modified based on a semi-open chamber design as described previously [25]. Twenty milliliters of 0.5 M H2SO4, containing 2% v/v glycerol solution and a 25 × 3 × 200 mm polyurethane foam strip were placed in a 125 mL bottle so that the foam was saturated in the acid solution. The bottle was then placed at the base of each chamber and the foam was suspended vertically with the bottom of the strip placed in the excess acid solution. After 3–4 d, the foam strips were removed from the chambers and placed into their respective bottles for transport to the lab. Fresh strips and solution were then installed into each chamber. Acid glycerol solution was added to the used strip and excess solution to reach the initial 20 mL volume before dilution with 30 mL of H2O. The total 50 mL solution was shaken for 0.5 h before filtration through 11 µm filter paper and the extract was analyzed for NH4–N concentration using the sodium salicylate–nitroprusside method modified for flow-through injection analysis [26] (Lachat, Loveland, CO, USA).
2.4. Clover Sampling
Aboveground biomass was collected on 17 May, 31 May, 13 June, 21 June, 28 June, and 26 July. A 0.5 m2 quadrat was placed in each plot, with the condition that it contained row and interrow zones in proportion to the field scale and was not previously sampled. Clover biomass was cut to 10 mm and collected from within each quadrat. Clover samples were dried at 60 °C for at least 3 days before dry mass was taken. Subsamples were pulverized and analyzed for total C and N concentrations using the Dumas dry combustion method with an elemental analyzer [27] (VarioMax, Elementar, Langenselbold, Germany).
2.5. Environmental Conditions
Soil moisture and temperature data were collected at the center of each zone in managed plots and randomly within the control. Sensors were installed vertically at the 76-mm depth and measurements were taken at 0.5-hr intervals. Single replicates from each zone in each treatment were monitored from 28 May–10 July. Daily minimum and maximum temperatures from each zone were used to calculate cumulative soil heat units with a minimum threshold value at 10 °C to account for limited microbial activity below this value [28,29].
Daily precipitation, minimum air temperature, and maximum air temperature were obtained from the National Weather Service Cooperative Observer Station no. 217107 for the time period beginning on 20 April and ending on 22 August. Daily maximum and minimum air temperatures were averaged to obtain single daily average air temperature values and cumulative precipitation was calculated beginning on 20 April. Daily average air temperature and cumulative precipitation in 2018 were compared graphically to the 1981–2010 historical average.
2.6. Data Analysis
Soil NO3–N, NH4–N, and the sum of NO3–N and NH4–N (total inorganic N; TIN) concentrations in soil from sampled depth intervals were summed across depth intervals. The summed concentrations were plotted against time and trapezoidally-integrated to represent cumulative soil N availability across the entire analysis period [30,31,32,33]. Individual N2O flux measurements were similarly time-integrated to determine cumulative emissions over the sampling period. Cumulative NH3–N emissions were determined by the summation of individual flux measurements, since these values represented the total cumulative flux between sampling dates.
Values of time-integrated NO3–N, NH4–N, TIN, and N2O–N and NH3–N emissions were analyzed using an enrichment factor (EF), which was calculated based on Equation (1):
where C represents the measured variable and b represents the experimental block. The EF approach was based on calculations commonly used in 15N isotope, contaminant, and mineral-ore analyses, where measured concentrations are compared to baseline or reference isotope, elemental, or mineral concentrations present in earth’s atmosphere, soils, or crust [34,35,36]. For this study, the EF represents the magnitude of the difference between N pools under KCLM management treatments relative to baseline values under unmanaged clover. Categories were defined for enrichment factor values, where, <100% represents depletion, 100 ≤ EFC < 200% represents slight enrichment, 200 ≤ EFC < 400% represents moderate enrichment, and EFC ≥ 400% represents high enrichment of the N pool variable in the managed treatment relative to the unmanaged clover.
EFC = [Ctreatment, b/Ccontrol, b] 100,
Statistical analysis utilized the MIXED procedure of SAS 9.4 at p ≤ 0.05 (SAS Institute, Cary, NC, USA). Scatter plots of predicted and residual values were evaluated for homogeneity of variance and normality [37] with the UNIVARIATE procedure of SAS; these requirements were met for all dependent variables. The data were organized into four groups that were subjected to separate statistical analyses, each during different time periods corresponding with management type, as follows (Supplementary Tables S1–S3).
Short-term soil N response to residue management: This analysis focused on the 6-d period between mowing (29 May) and application of row treatments (4 June), and aimed to evaluate the effects of the management ‘system’ (i.e., Rm, Rt, or control) on time-integrated NO3–N, NH4–N and TIN, and the effects of residue management (i.e., Rt or Rm) on the EFs corresponding to these soil N variables.
Zone-differentiated N response to residue and row management: This analysis examined the EF variables NO3–N, NH4–N, TIN, and NH3–N following row establishment (4 June) through the end of the experiment (22 August), and their relationship with residue management, row establishment (i.e., K or T), and zone (i.e., row or interrow).
Zone-weighted N response to residue and row management: This analysis addressed the effect of residue management and row establishment on the EF variables NO3–N, NH4–N, TIN, NH3–N, and N2O–N over the entire sampling period of the corresponding N variable. For this analysis, N variables observed in the row and interrow zones following row establishment were weighted by relative zone area before time-integration and calculation of the EFs. This analysis also examined clover biomass and biomass-N variables sampled on 28 June as affected by residue management and row establishment, since the majority of clover regrowth was expected to occur prior to row crop canopy closure.
Cumulative N gas emissions: This analysis evaluated the effect of the management system (i.e., K/Rt, K/Rm, T/Rt, T/Rm, or control) on N2O–N and NH3–N emissions occurring over the entire study period (24 May–5 July). For this analysis, NH3–N fluxes observed in the row and interrow zones in the managed plots were combined after weighting by relative zone area. This weighting procedure was not necessary for N2O–N because measurements were made across both zones with a single chamber.
3. Results
3.1. Environmental Conditions
3.2. Short-Term Soil N Response to Residue Management
Nitrate and TIN were significantly affected by the management system (Table 2). Time-integrated soil NO3–N concentration following mowing and residue management was 105% greater in the residue returned (Rt) system than the unmanaged control while the residue removed (Rm) system was not different from the Rt or control systems (Figure 2a). Soil TIN concentrations in the Rt and Rm treatments were 87 and 49% greater than the control, respectively (Figure 2b). The EFs for all three soil N variables did not differ between the Rt and Rm systems in the period following mowing and preceding row treatment application. Soil TIN concentrations over this sampling period can be found in the Appendix A (Figure A2).
3.3. Zone Differentiated N Response to Residue Management and Row Establishment
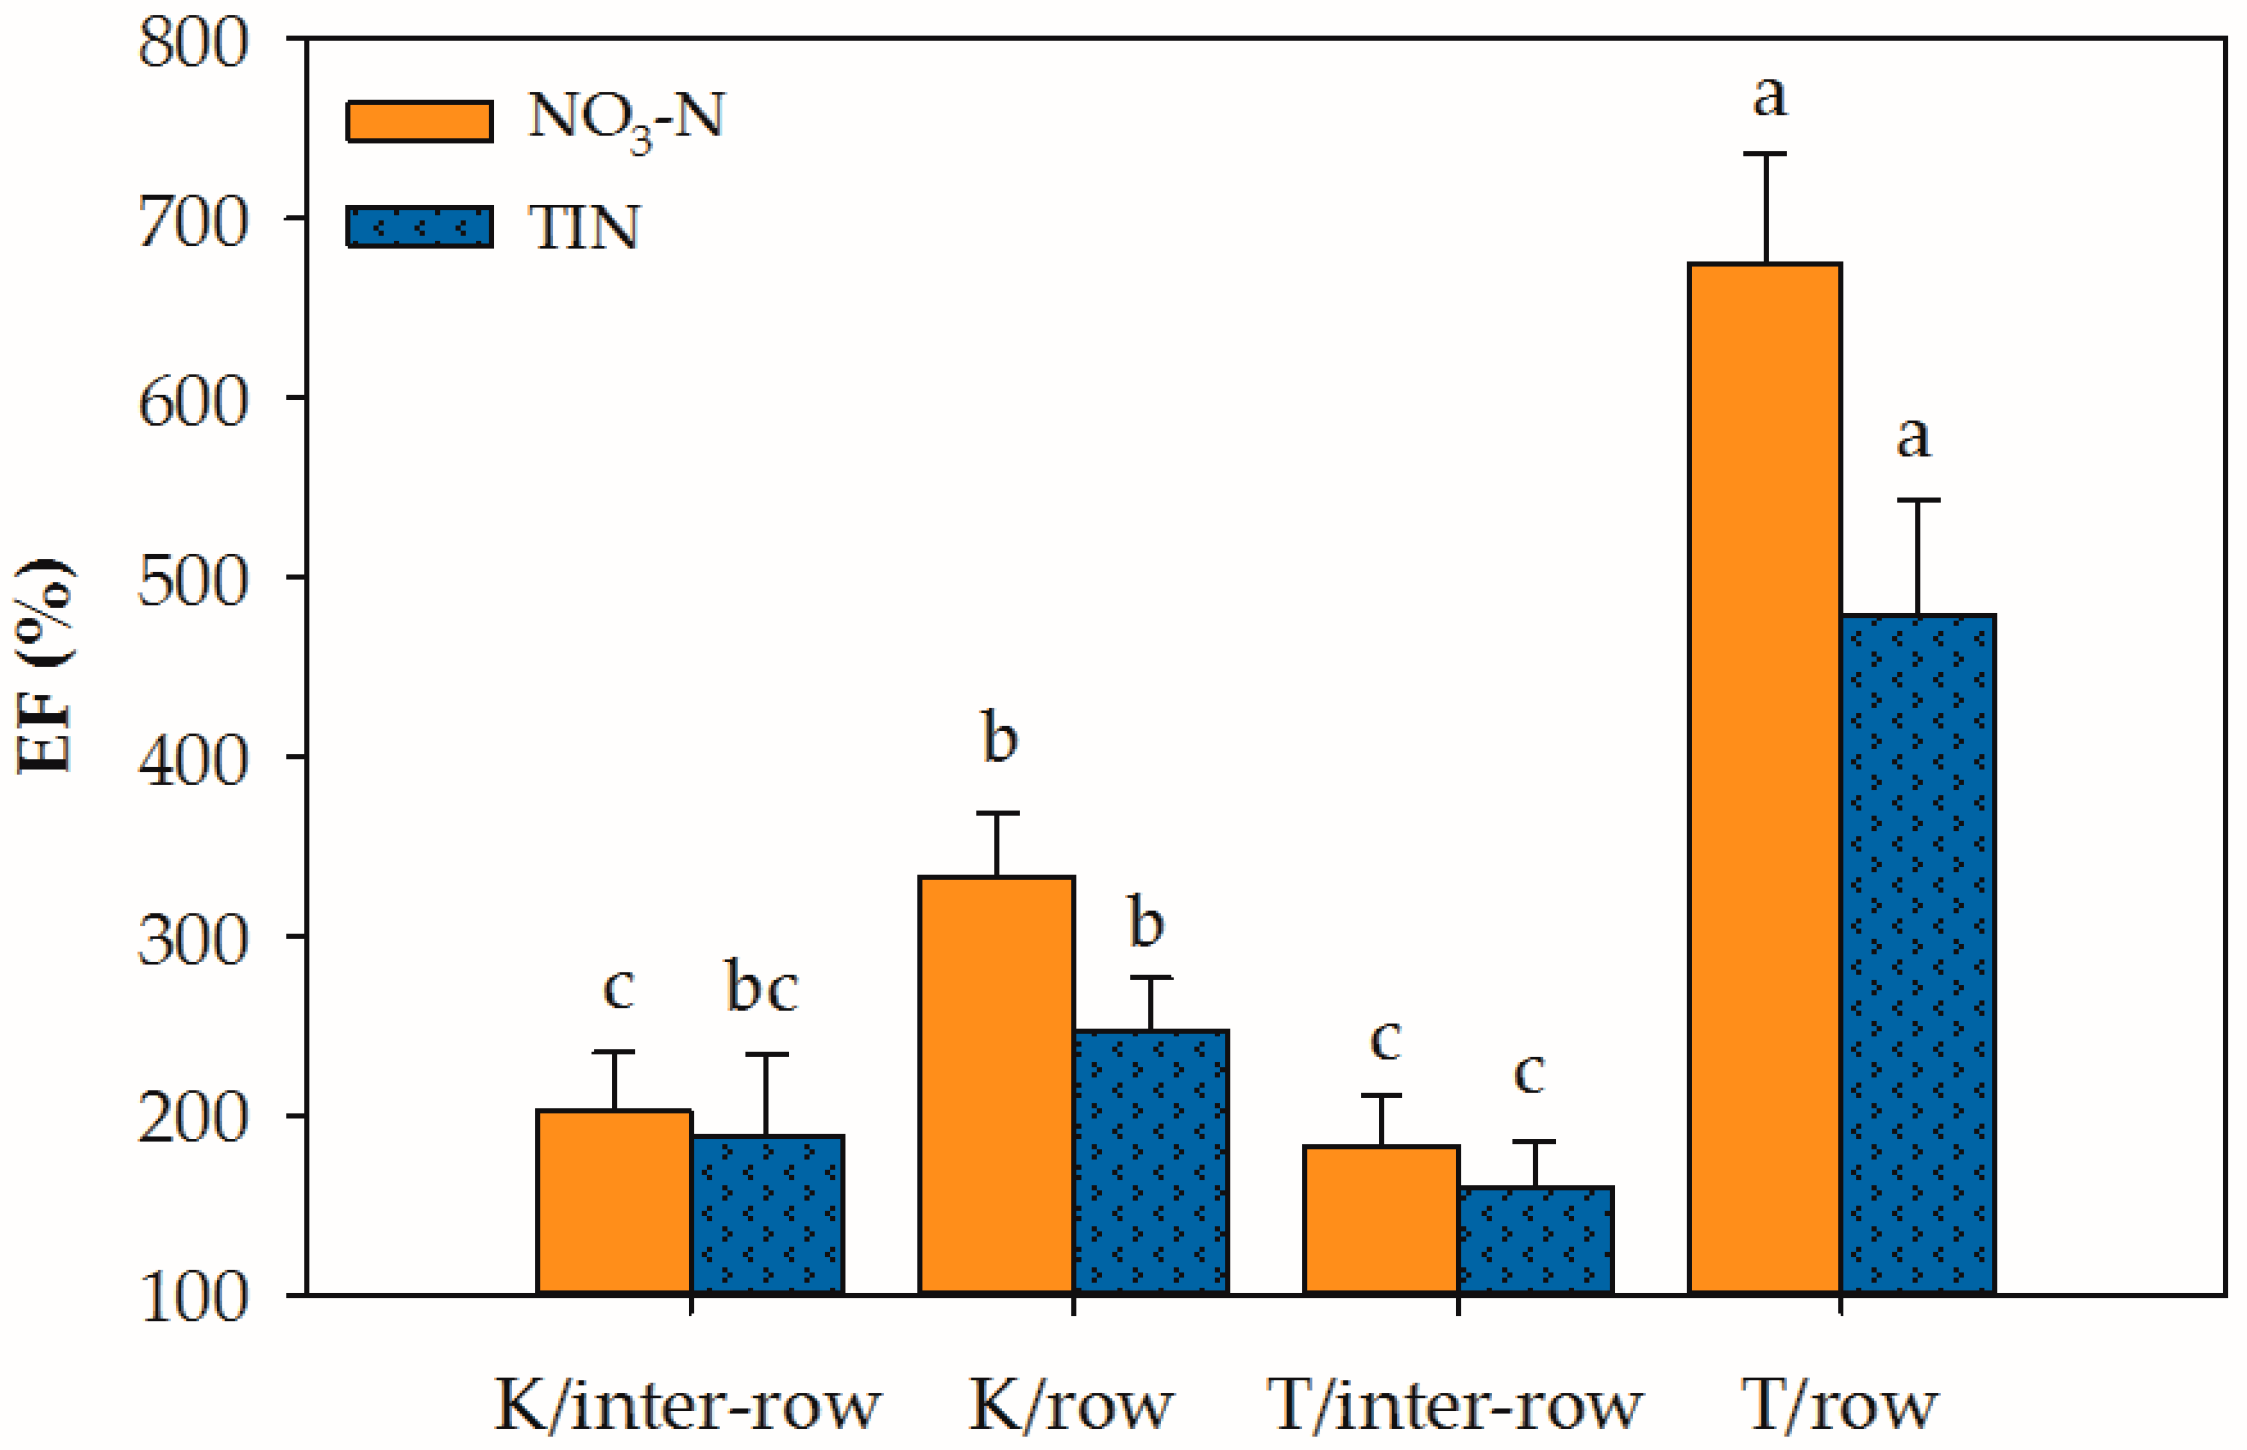
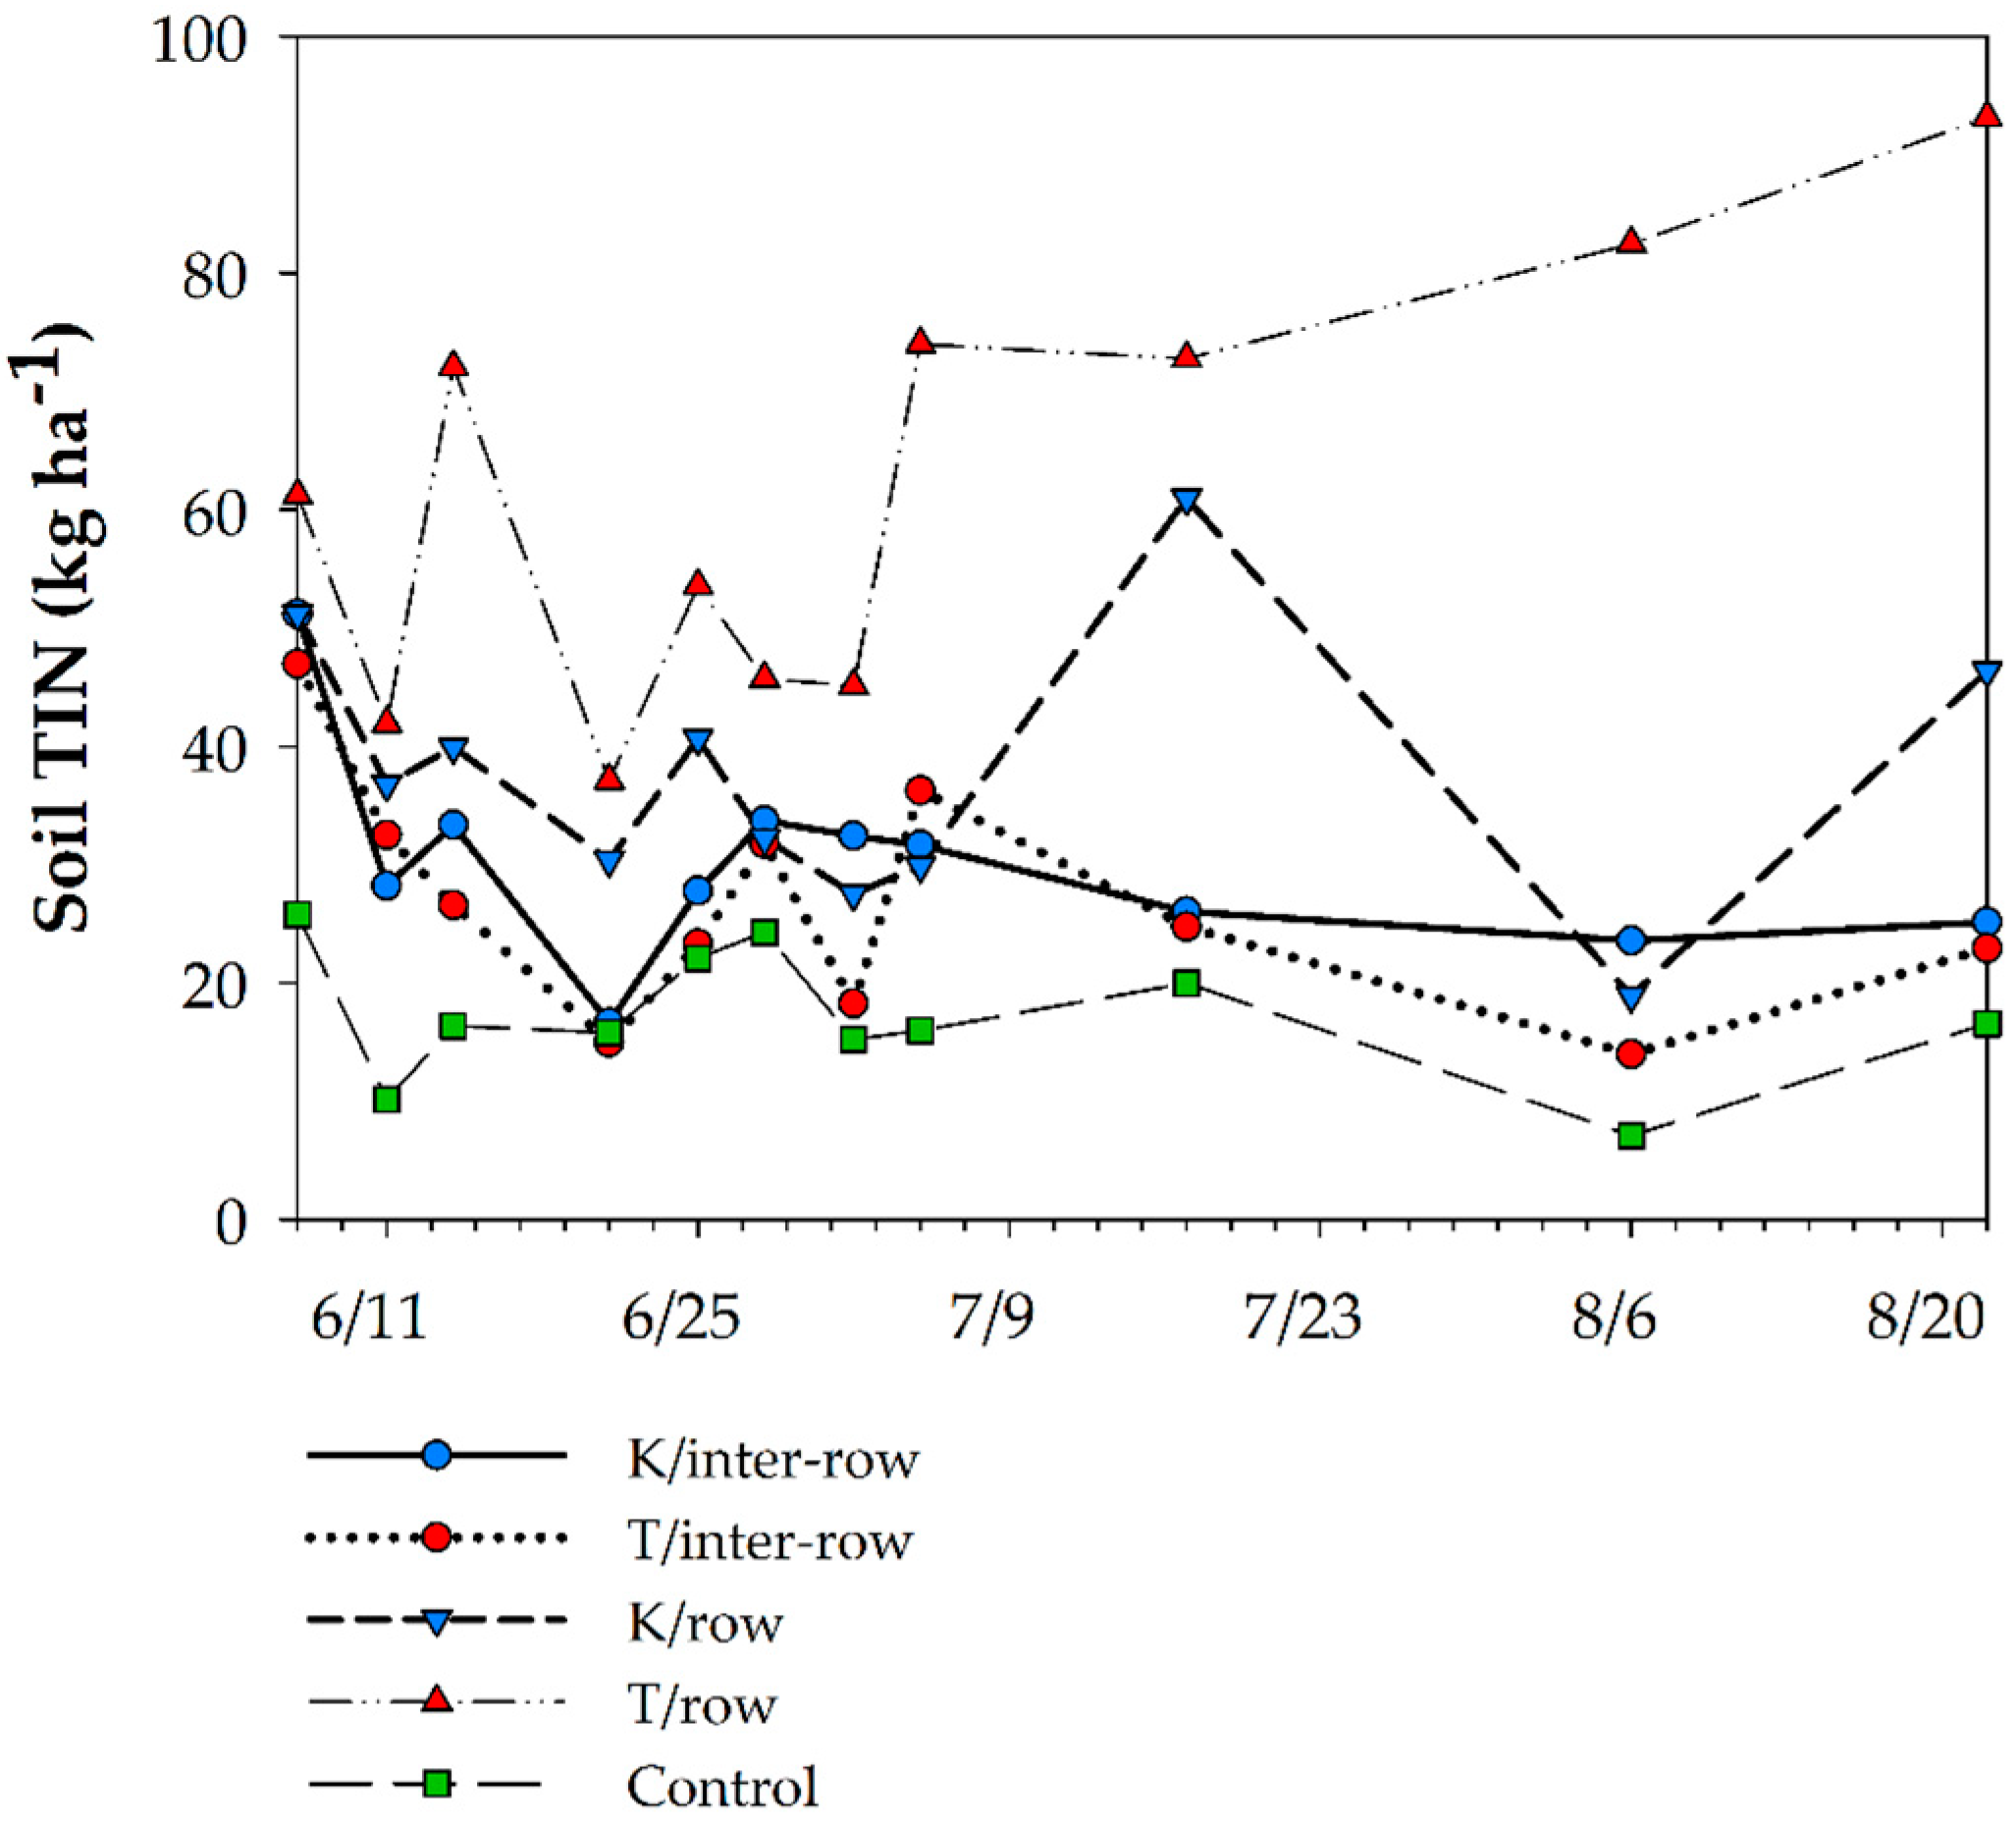
The row establishment by zone interaction was significant for NO3–N and TIN EFs following row establishment through the end of the study (Table 3). Nitrate and TIN in the row of the tilled (T) treatment were highly enriched compared to the unmanaged control, 675 and 479%, respectively, and were statistically greater than the row of the killed (K) treatment and the K and T interrow zones. The row in the K treatment was moderately enriched in NO3–N (333%) and was statistically greater than the interrow in the K and T treatments. Nitrate concentrations in the interrow of the K and T treatments were moderately (202%) and slightly enriched (183%), respectively, and were not different from each other. Soil TIN enrichment in the K interrow (188%) was not different from the K row (247%) or the T interrow (160%), but enrichment in the K row was greater than the T interrow (Figure 3). Soil TIN concentration over this sampling period can be found in the Appendix A (Figure A3).
Zone significantly affected NH3–N emissions, with greater enrichment in the row (170%) than the interrow (120%), corresponding with cumulative NH3–N emissions of 0.68 and 0.45 kg ha−1, respectively.
3.4. Zone Weighted N Response to Residue and Row Management
Row establishment significantly affected EFs for NO3–N and TIN following mowing through the end of the experiment (Table 4). The EF for NO3–N was greater in the T treatment (304%) than the K treatment (220%), corresponding with greater enrichment of TIN in the T treatment (229%) than the K treatment (179%). Biomass and biomass-N were not affected by row or residue management. Soil TIN concentration and clover biomass over this sampling period can be found in the Appendix A (Figure A4 and Figure A5).
3.5. Cumulative N Gas Emissions
Emission of N2O–N and NH3–N over the total study period (24 May–5 July) was not affected by management system (Table 5).
4. Discussion
Soil N concentration responded to mowing and residue management in the 6 d period between mowing and row establishment (Figure A2). The control treatment had less soil NO3–N than when residue was returned (Rt) and less soil TIN than when residue was returned or removed (Rm). In the context of utilizing kura clover as a living mulch to supply N for a cash crop, an absence of a residue management effect on the measured variables suggests that early surface residue removal does not influence soil N pools. Enrichment of soil NO3–N and TIN after row establishment was high in the T row, moderate in the K row, and slight in both T and K interrows. Likewise, zone-weighted EFs for soil NO3–N and TIN were significantly affected by row management, with greater enrichment in the T treatment than the K treatment.
Soil N not taken up by plants can be lost to environmentally damaging gaseous N pools; NH3–N, NOx–N, and N2O–N [38,39,40]. Volatilized NH3–N was slightly enriched in both the row and interrow after row establishment and significantly greater in the row than the interrow. This result may suggest that elevated soil N in the row increased NH3–N volatilization; however, NH4–N was not significantly affected by zone, indicating that NH3–N was volatilized directly from senescing clover residue. Bursts of NH3–N emissions after chemical or mechanical senescence of legume crops have been reported previously [41,42,43]. Despite enrichment in NH3–N volatilization in clover under living mulch management, the magnitude of emission was low in comparison to soil mineral N pools and annual NH3–N emission from local cropland [44]. This may be due to soil acidity (5.7 in the surface layer), since ammonia volatilization is a pH-dependent reaction in which NH4–N is hydrolyzed when high concentrations of OH− are present [45].
In a previous study, N2O–N emission during the spring management period in a corn-soybean (Glycine max L. (Merr.)) rotation was 98% greater in corn and 161% greater in soybean in a KCLM system compared to conventional management [12]. Findings from the present study further highlight the potential for elevated N2O–N emissions during living mulch management. Further research is needed to better understand the mechanisms and factors governing partial denitrification and N2O–N emissions in KCLM systems, including the partitioning of organic and inorganic N sources of N2O–N, and the feasibility of applying management practices to reduce N2O emissions, for example, the use of nitrification inhibitors [46].
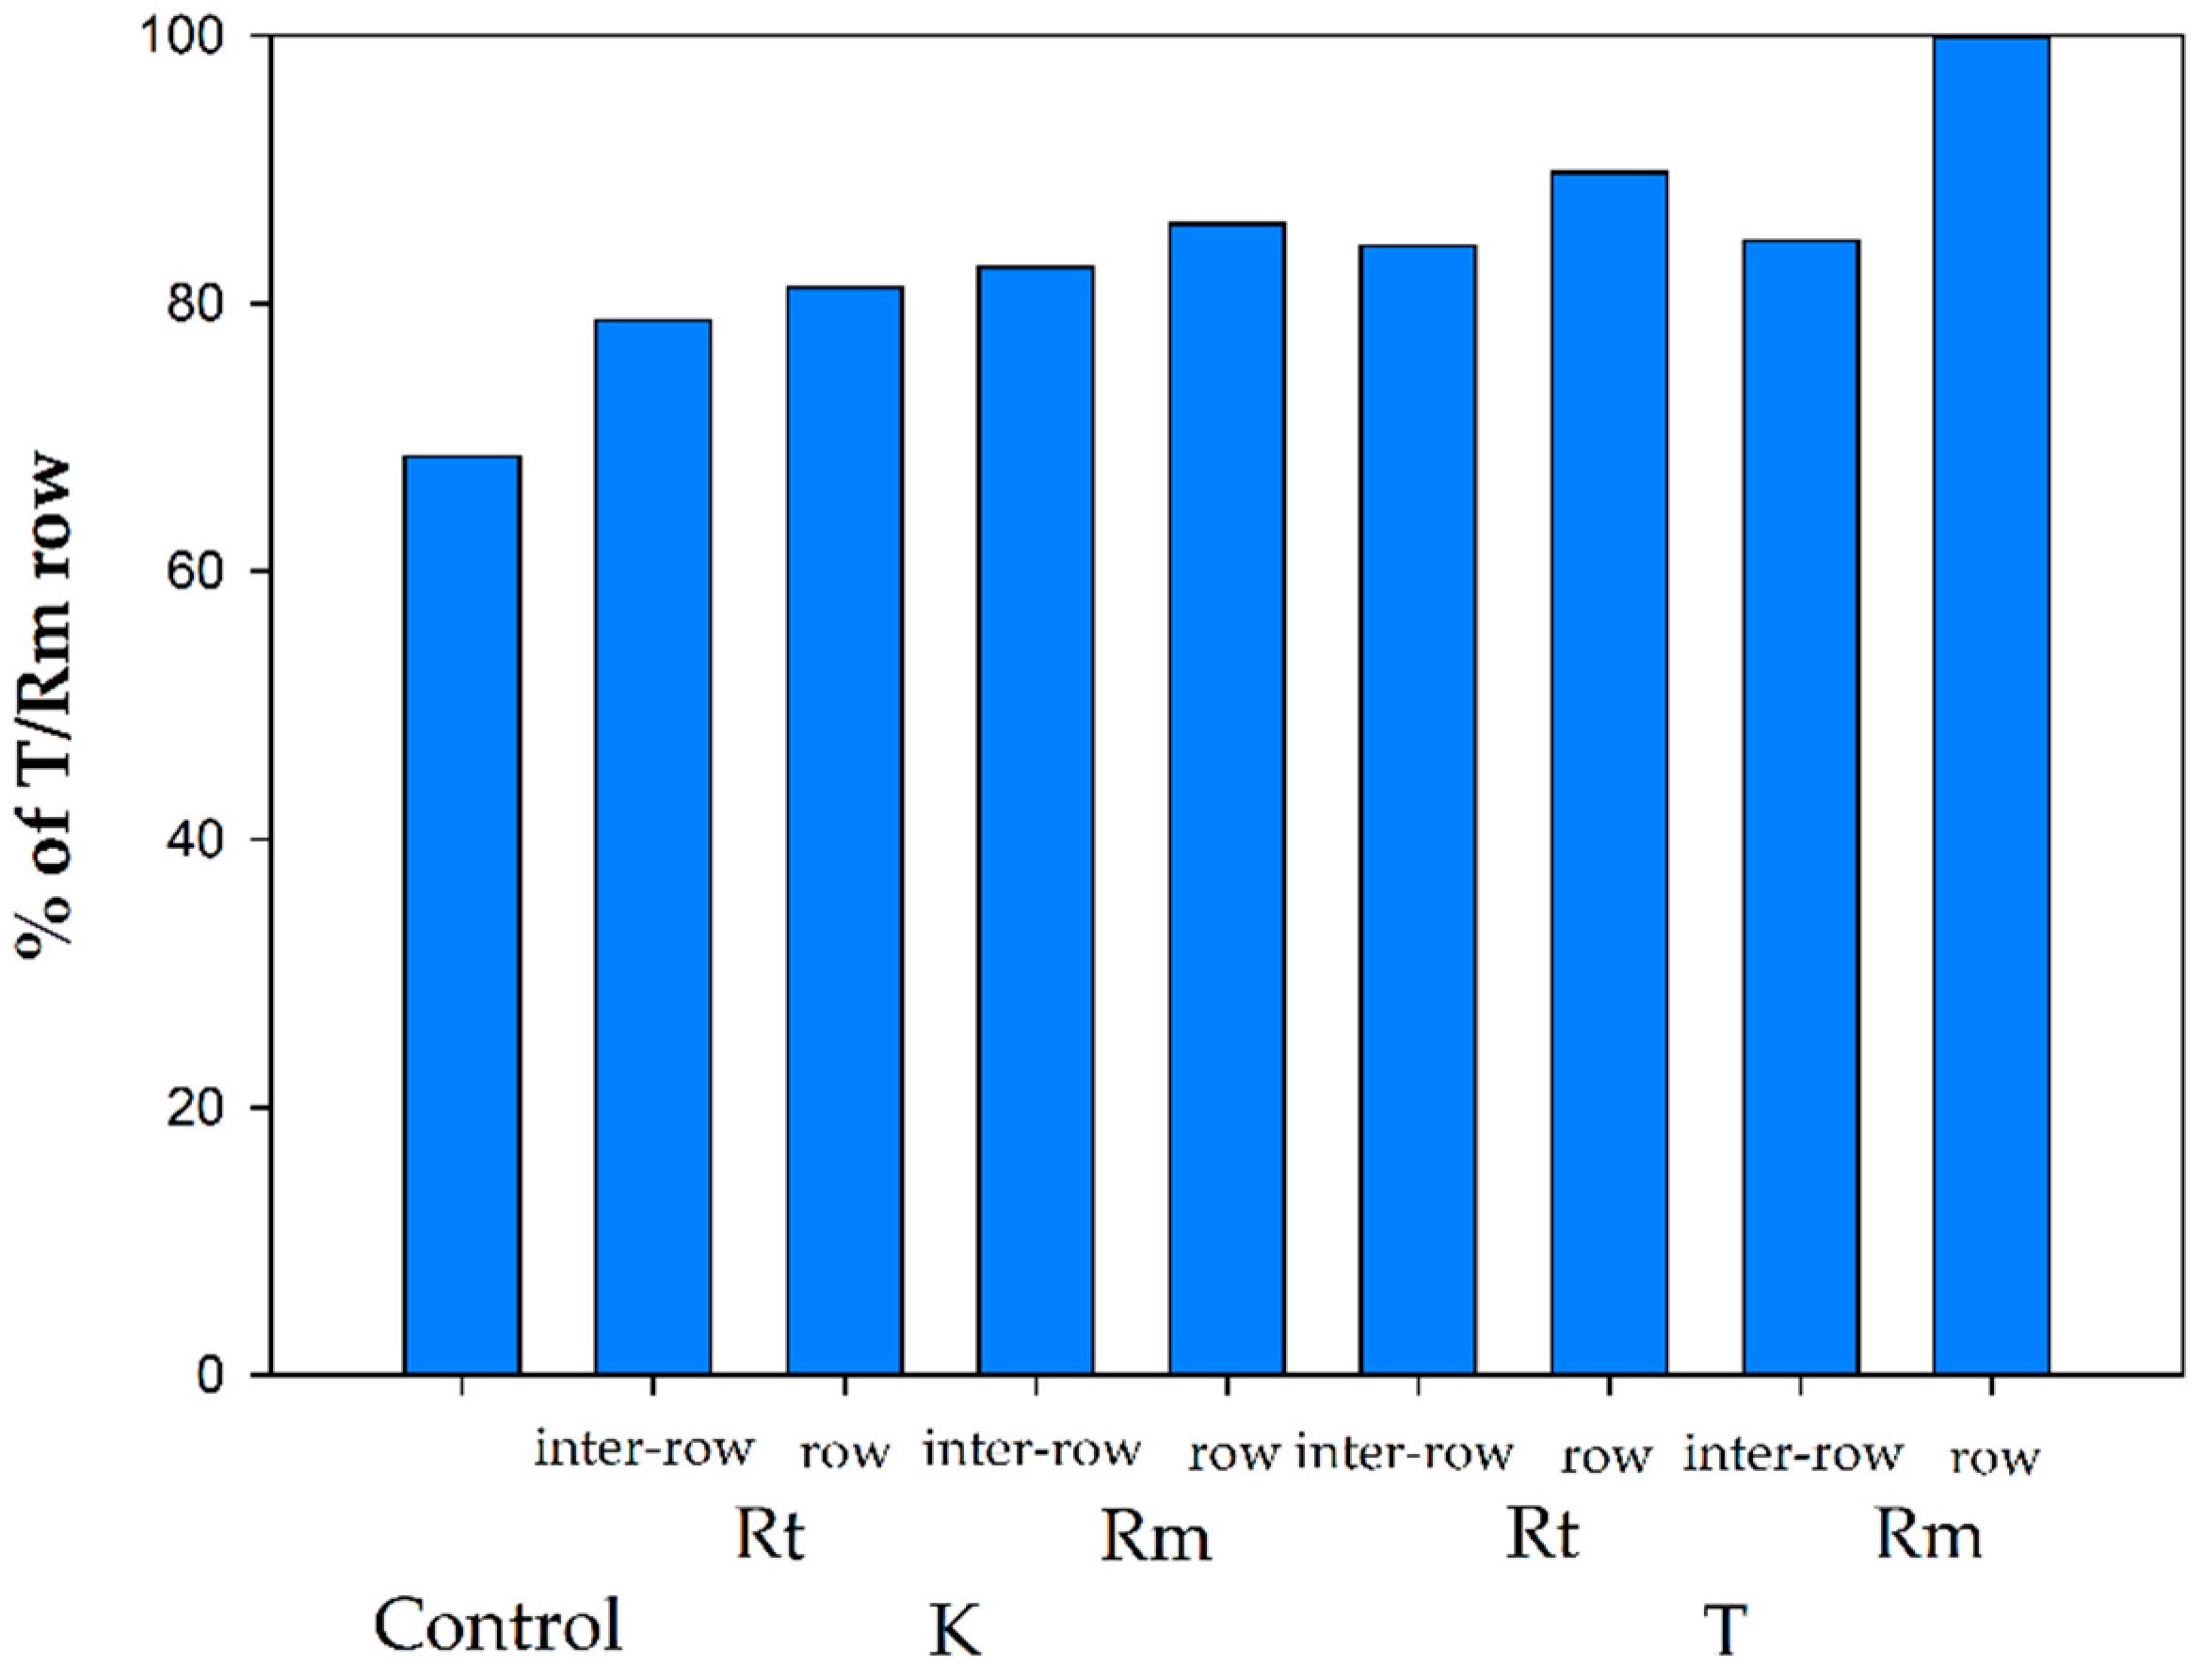
Greater enrichment of soil N with strip tillage row establishment suggests that soil N contribution from the living mulch is most influenced by biomass incorporation, where more intensive row establishment methods increase mineralizable biomass supply, soil-biomass contact, soil temperature, organic matter mineralization rate, nitrification rate, or a combination of these factors (Figure A6) [47,48]. Despite more intensive management in the tilled treatment, biomass and biomass-N did not differ among the Rt, Rm, K, or T treatments by mid-summer, indicating that clover regrowth is similar among residue and row management treatments (Figure A5).
These results suggest that zone tillage is preferable to banded herbicide for KCLM cropping systems to supply in-season N to the cash crop. Zone tillage increases soil temperature, soil contact with senescing biomass, and soil N contributions to growing cash crops [47]. Removal of cut kura clover residues did not reduce soil N pools, supporting a spring forage harvest before seeding the primary cash crop when conditions allow. Clover harvest prior to planting the cash crop would probably be most feasible as haylage rather than bales due to the risk of slow field drying prior to baling, along with greater harvest losses and the increased time commitment of haying during the spring planting season [49,50,51], although, harvest method will be most influenced by the equipment and storage capabilities of the individual producer. The option to utilize kura clover as a forage crop may also offer flexibility within crop rotations when unfavorable field conditions, poor market outlooks, or market opportunities arise near the planting date. These results open new possibilities for optimization of KCLM management practices that might produce multiple harvests in a single growing season, maintain clover perenniality, reduce reliance on fertilizer N, increase system resilience, and improve soil health.
Concepts presented here improve the current understanding of legume-row crop intercropping systems, but further research is necessary to fully quantify N dynamics in KCLM production systems. These findings should be useful for optimization of spring agronomic management practices for KCLM production systems. Future research should address variation in system performance as influenced by kura clover stand age, cropping history, and extreme weather conditions for the development of stable and resilient KCLM cropping systems.
Supplementary Materials
The following are available online at https://www.mdpi.com/2073-4395/9/2/69/s1. Table S1: Weighted gas emission, Table S2: Temperature degree days, Table S3: Adjacent soil properties.
Author Contributions
Conceptualization, J.R.A., R.T.V., J.M.B., and J.A.C.; Data curation, J.R.A.; Formal analysis, J.R.A.; Funding acquisition, J.M.B.; Methodology, J.R.A., R.T.V., J.M.B., and J.A.C.; Resources, R.T.V. and J.M.B.; Software, R.T.V.; Supervision, R.T.V. and J.M.B.; Validation, J.A.C.; Visualization, J.R.A.; Writing—original draft, J.R.A.; Writing—review and editing, J.R.A., R.T.V., J.M.B., and J.A.C.
Funding
This study was funded through the Minnesota Corn Research and Promotion Council, Grant number 4097-13SP.
Acknowledgments
The authors would like to thank Michael S. Dolan for laboratory consultation and analysis. Additional thanks to William Breiter, Cody Winker, Ryan Felton, Cassie Tieman, Tim Axberg, Wolfgang Blee, and Seyia Wakahara for their technical assistance with field and laboratory work.
Conflicts of Interest
The authors declare no conflict of interest.
Appendix A
Figure A1.
Plot layout and design within a single replication.

Figure A2.
Soil TIN concentration as a function of management system following residue management, where clover was returned (Rt) or removed (Rm) from the plot and preceding row establishment and with unmanaged clover (Control).
Figure A2.
Soil TIN concentration as a function of management system following residue management, where clover was returned (Rt) or removed (Rm) from the plot and preceding row establishment and with unmanaged clover (Control).
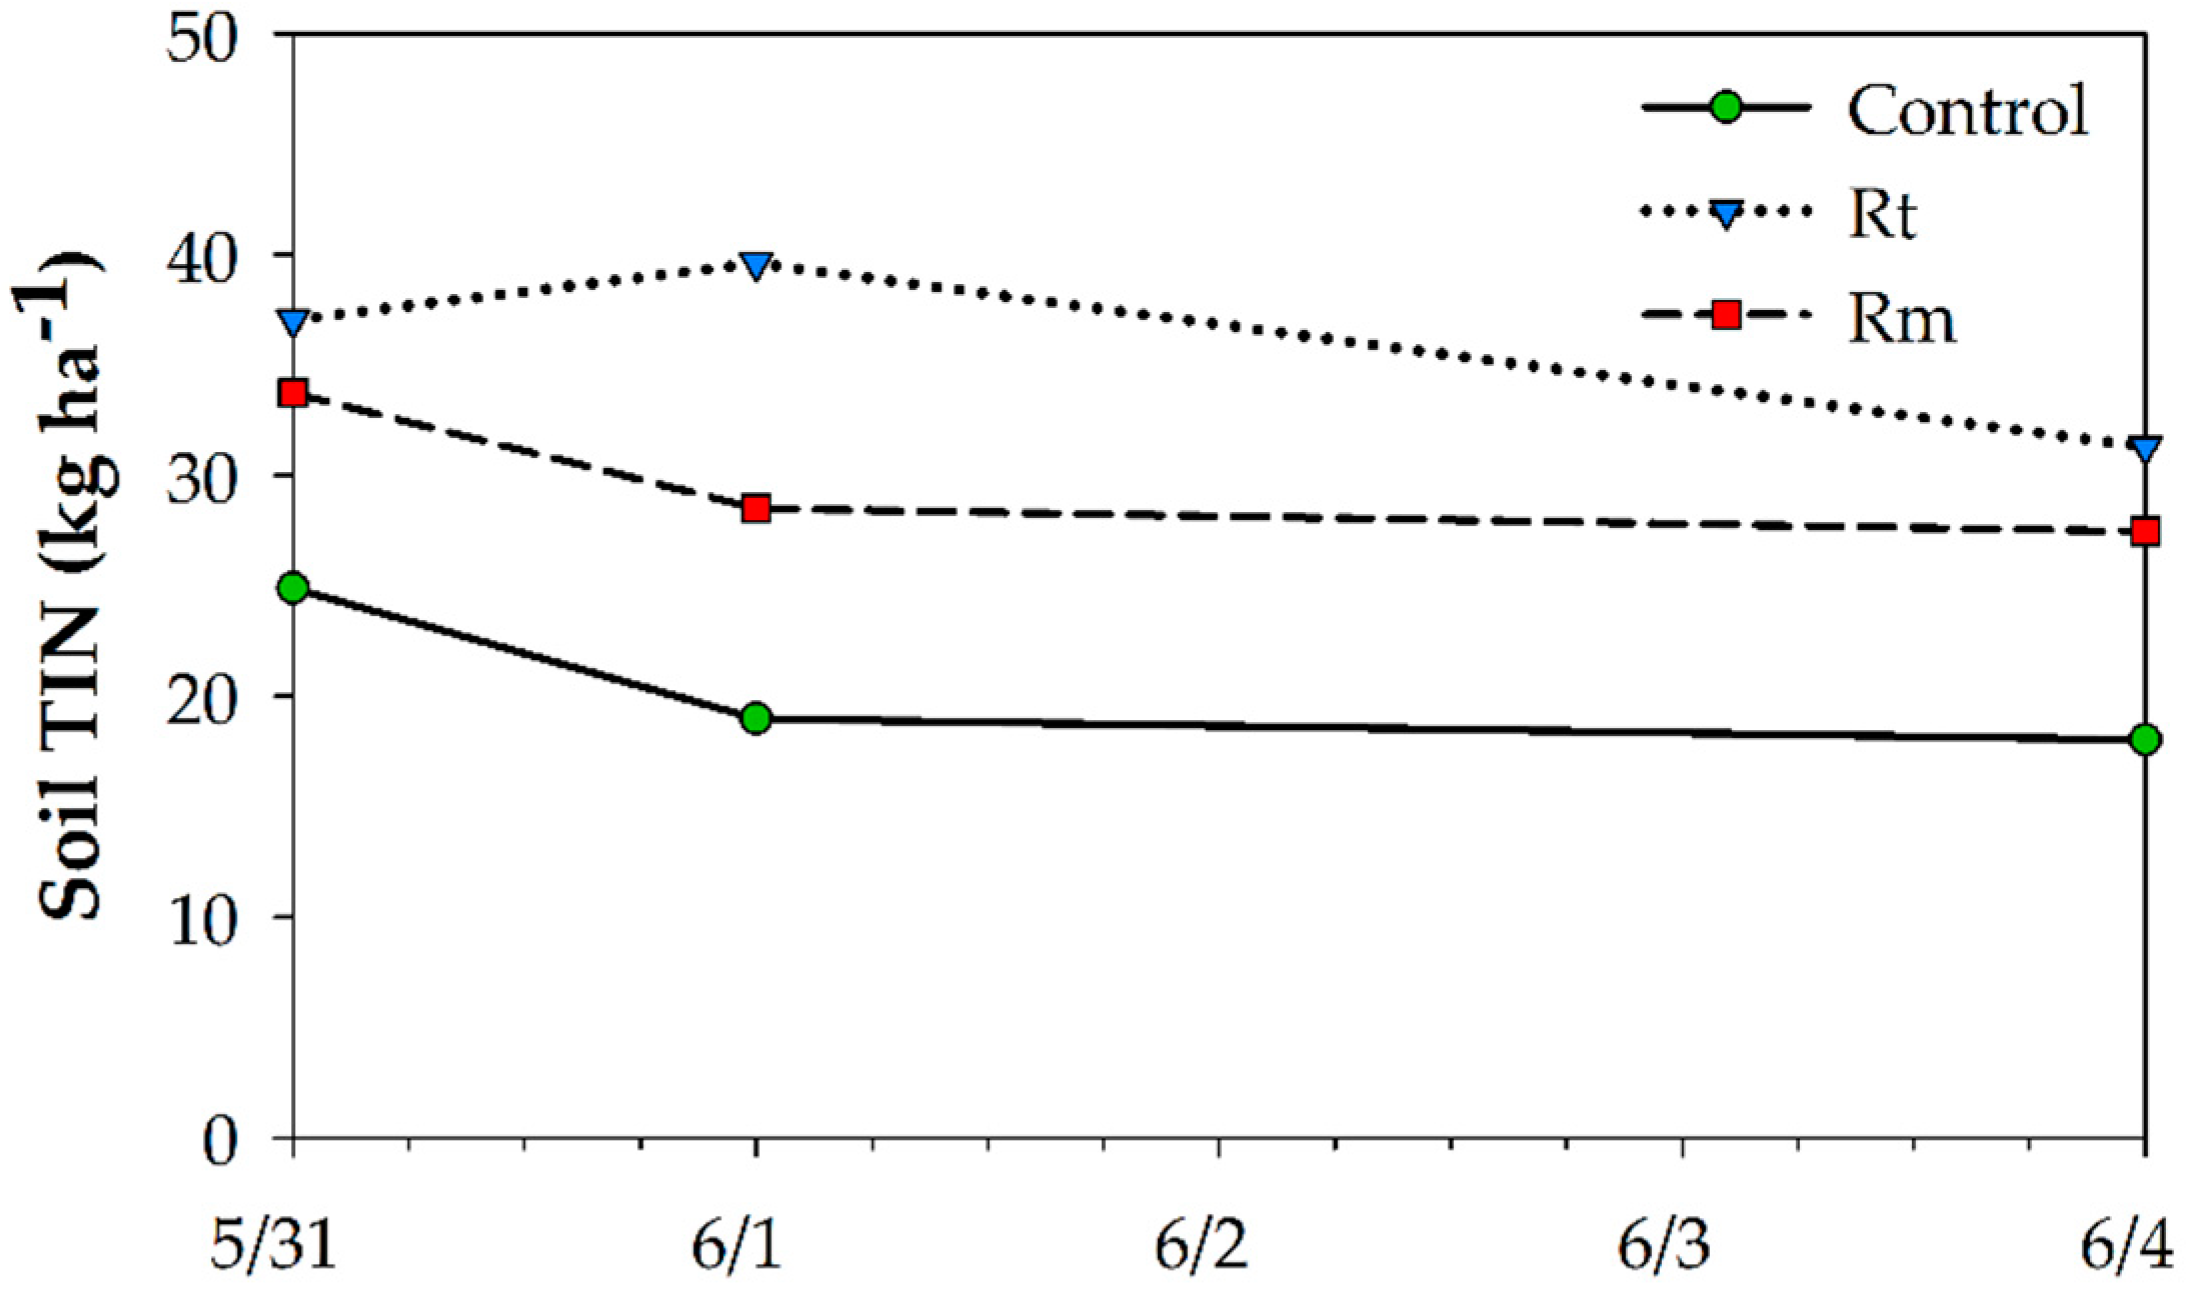
Figure A3.
Soil TIN concentration following row establishment as a function of banded herbicide (K) and zone tillage (T) row management and with unmanaged clover (Control).
Figure A3.
Soil TIN concentration following row establishment as a function of banded herbicide (K) and zone tillage (T) row management and with unmanaged clover (Control).

Figure A4.
Soil TIN concentration over the entire sampling period as a function of banded herbicide (K) and zone tillage (T) row management and with unmanaged clover (Control).
Figure A4.
Soil TIN concentration over the entire sampling period as a function of banded herbicide (K) and zone tillage (T) row management and with unmanaged clover (Control).
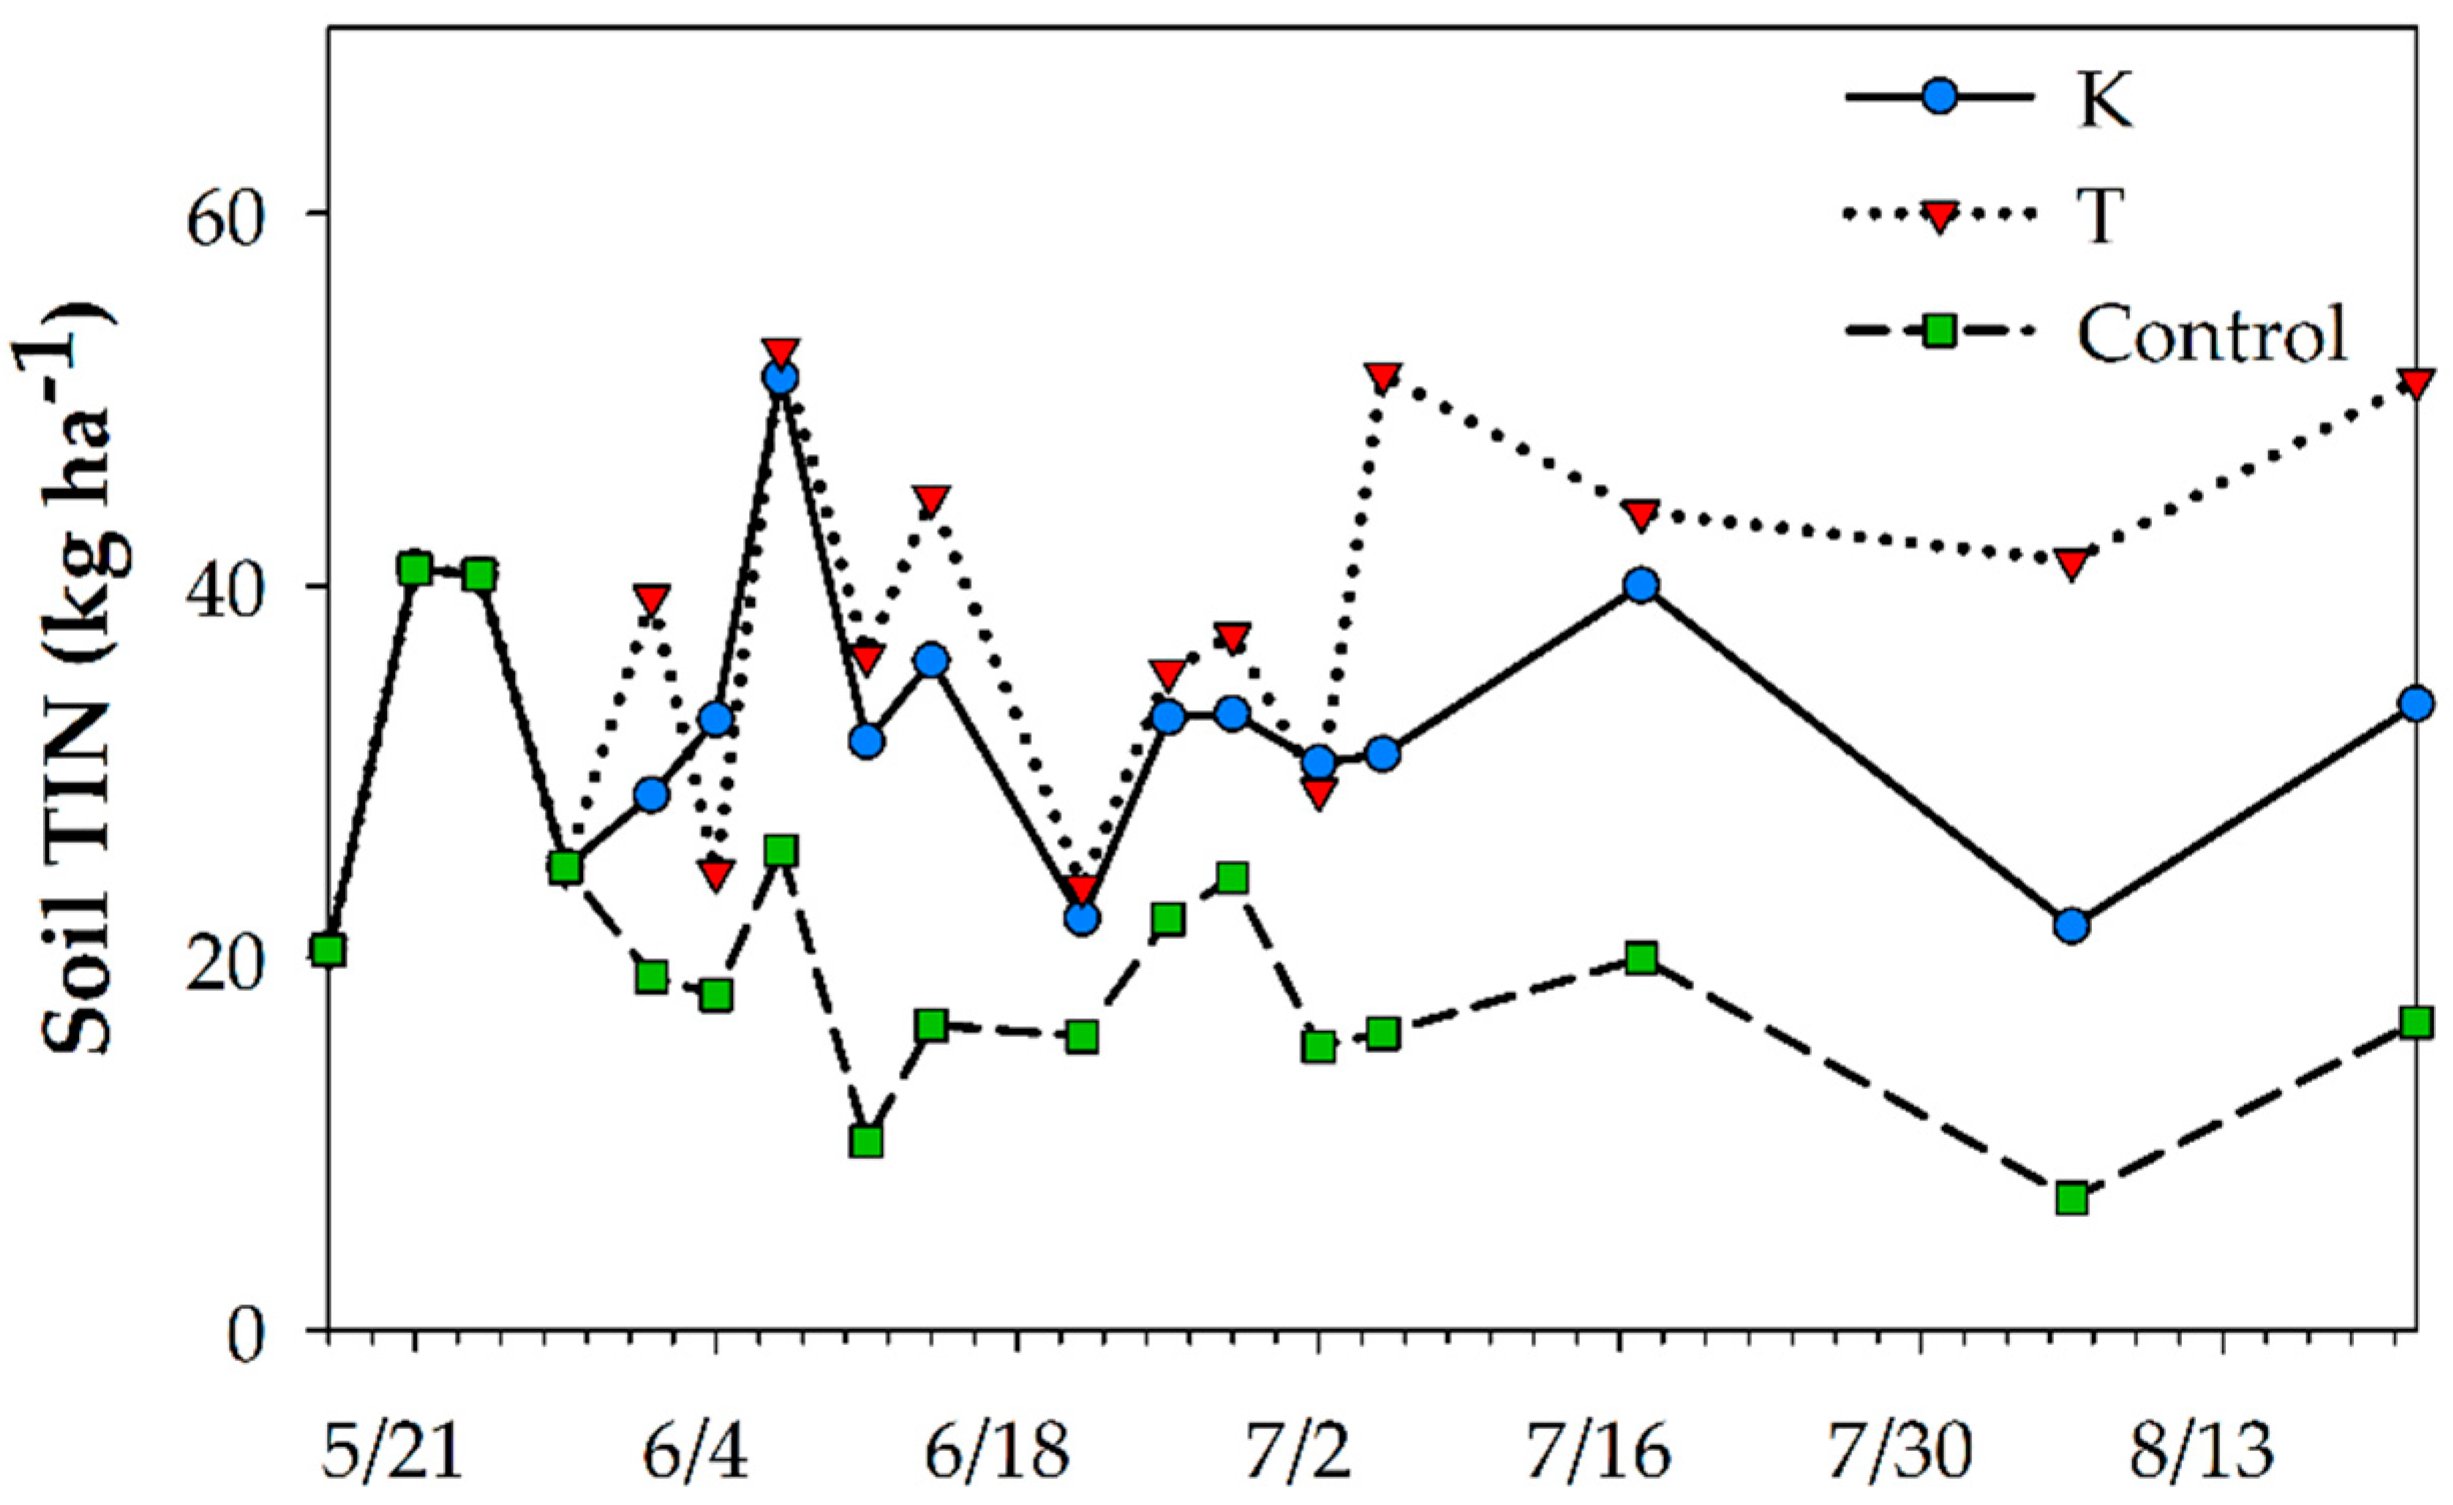
Figure A5.
Clover biomass and standard error over the entire sampling period as a function of banded herbicide (K) and zone tillage (T) row management and with unmanaged clover (Control).
Figure A5.
Clover biomass and standard error over the entire sampling period as a function of banded herbicide (K) and zone tillage (T) row management and with unmanaged clover (Control).
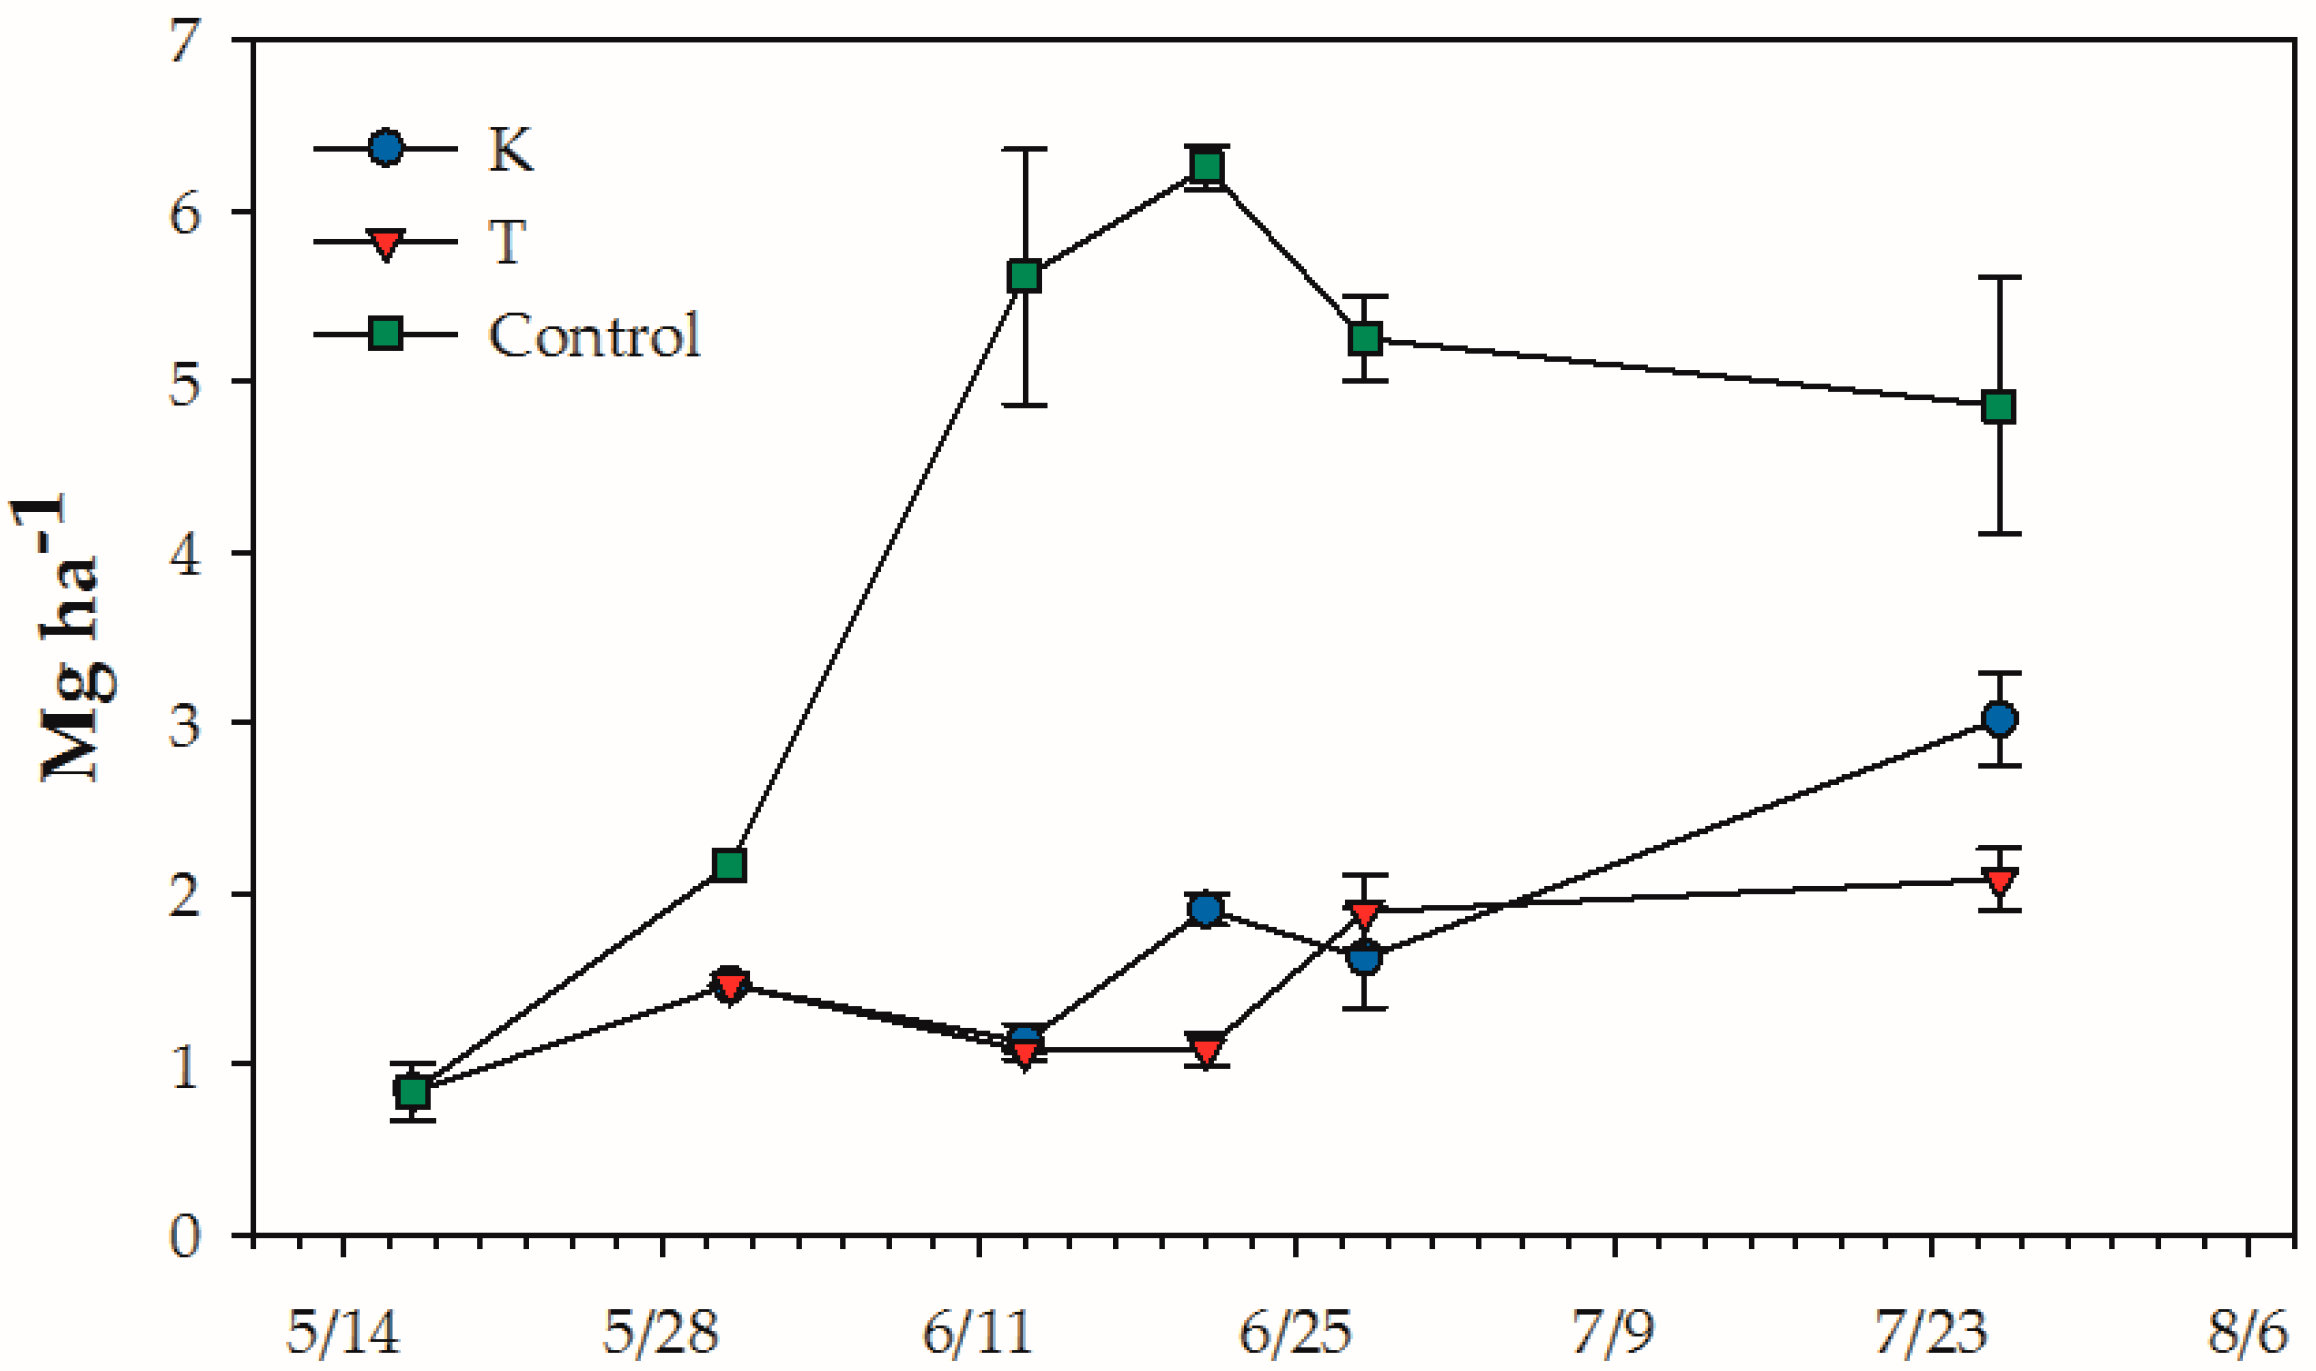
Figure A6.
Non-replicated soil temperature heat units for residue return (Rt) and removal (Rm) after mowing management and banded herbicide (K) or zone tillage (T) row establishment and with unmanaged clover (Control) as a percentage of the T/Rm row. Heat units were the sum of the average maximum and minimum daily temperature measurements minus 10 °C.
References
- Von Bieberstein, M. Flora Taurico-Caucasica Exhibens Stirpes Phaenogamas; Volume 2; Imperatorskii Khar’kovskii Universitet ptr: Kharkov, Ukraine, 1808. [Google Scholar]
- Peterson, P.R.; Sheaffer, C.C.; Jordan, R.M.; Christians, C.J. Responses of kura clover to sheep grazing and clipping: I.Yield and forage quality. Agron. J. 1994, 86, 655–660. [Google Scholar] [CrossRef]
- Speer, G.S.; Allinson, D.W. Kura Clover (Trifolium ambiguum): Legume for Forage and Soil Conservation. Econ. Bot. 1985, 39, 165–176. [Google Scholar] [CrossRef]
- Zemenchik, R.A.; Albrecht, K.A.; Boerboom, C.M.; Lauer, J.G. Corn production with kura clover as a living mulch. Agron. J. 2000, 92, 698–705. [Google Scholar] [CrossRef]
- Siller, A.R.S.; Albrecht, K.A.; Jokela, W.E. Soil erosion and nutrient runoff in corn silage production with Kura clover living mulch and winter rye. Agron. J. 2016, 108, 989–999. [Google Scholar] [CrossRef]
- Ochsner, T.E.; Schumacher, T.W.; Venterea, R.T.; Feyereisen, G.W.; Baker, J.M. Soil Water Dynamics and Nitrate Leaching Under Corn–Soybean Rotation, Continuous Corn, and Kura Clover. Vadose Zo. J. 2017. [Google Scholar] [CrossRef]
- Ochsner, T.E.; Albrecht, K.A.; Schumacher, T.W.; Baker, J.M.; Berkevich, R.J. Water balance and nitrate leaching under corn in kura clover living mulch. Agron. J. 2010, 102, 1169–1178. [Google Scholar] [CrossRef]
- Affeldt, R.P.; Albrecht, K.A.; Boerboom, C.M.; Bures, E.J. Integrating Herbicide-Resistant Corn Technology in a Kura Clover Living Mulch System. Agron. J. 2004, 96, 247–251. [Google Scholar] [CrossRef]
- Pedersen, P.; Bures, E.J.; Albrecht, K.A. Soybean production in a kura clover living mulch system. Agron. J. 2009, 101, 653–656. [Google Scholar] [CrossRef]
- Grabber, J.H.; Jokela, W.E.; Lauer, J.G. Soil nitrogen and forage yields of corn grown with clover or grass companion crops and manure. Agron. J. 2014, 106, 952–961. [Google Scholar] [CrossRef]
- Sawyer, J.E.; Pedersen, P.; Barker, D.W.; Ruiz Diaz, D.A.; Albrecht, K. Intercropping corn and kura clover: Response to nitrogen fertilization. Agron. J. 2010, 102, 568–574. [Google Scholar] [CrossRef]
- Turner, P.A.; Baker, J.M.; Griffis, T.J.; Venterea, R.T. Impact of Kura Clover Living Mulch on Nitrous Oxide Emissions in a Corn–Soybean System. J. Environ. Qual. 2016, 45, 1782. [Google Scholar] [CrossRef]
- Pearson, C.H.; Brummer, J.E.; Beahm, A.T.; Hansen, N.C. Kura clover living mulch for furrow-irrigated corn in the intermountain west. Agron. J. 2014, 106, 1324–1328. [Google Scholar] [CrossRef]
- Singer, J. Legume living mulches in corn and soybean. Iowa State Univ. Univ. Ext. 2005, PM 2006. [Google Scholar]
- Blackshaw, R.E.; Molnar, L.J.; Moyer, J.R. Sweet clover termination effects on weeds, soil water, soil nitrogen, and succeeding wheat yield. Agron. J. 2010, 102, 634–641. [Google Scholar] [CrossRef]
- Liebman, A.M.; Grossman, J.; Brown, M.; Wells, M.S.; Reberg-Horton, S.C.; Shi, W. Legume cover crops and tillage impact nitrogen dynamics in organic corn production. Agron. J. 2018, 110, 1046–1057. [Google Scholar] [CrossRef]
- Alexander, J.R.; Baker, J.M.; Venterea, R.T.; Coulter, J.A. High Yielding Corn with Reduced Nitrogen Inputs: Production in Kura Clover Living Mulch. In Proceedings of the ASA, CSSA, and CSA International Annual Meeting, Baltimore, MD, USA, 4–7 November 2018. [Google Scholar]
- Baker, J.M. Vegetative propagation of kura clover: A field-scale test. Can. J. Plant Sci. 2012, 92, 1245–1251. [Google Scholar] [CrossRef]
- Mulvaney, R.L. Nitrogen—Inorganic forms. In Methods of Soil Analysis; Sparks, D.L., Ed.; American Society of Agronomy: Madison, WI, USA, 1996; pp. 1123–1184. [Google Scholar]
- Venterea, R.T.; Coulter, J.A.; Dolan, M.S. Evaluation of Intensive “4R” Strategies for Decreasing Nitrous Oxide Emissions and Nitrogen Surplus in Rainfed Corn. J. Environ. Qual. 2016, 45, 1186. [Google Scholar] [CrossRef] [Green Version]
- Reicosky, D.C.; Archer, D.W. Moldboard plow tillage depth and short-term carbon dioxide release. Soil Tillage Res. 2007, 94, 109–121. [Google Scholar] [CrossRef]
- Reicosky, D.C.; Lindstrom, M.J. Fall tillage method: Effect on short-term carbon dioxide flux from soil. Agron. J. 1993, 85, 1237–1243. [Google Scholar] [CrossRef]
- Collier, S.M.; Dean, A.P.; Oates, L.G.; Ruark, M.D.; Jackson, R.D. Does Plant Biomass Manipulation in Static Chambers Affect Nitrous Oxide Emissions from Soils? J. Environ. Qual. 2016, 45, 751. [Google Scholar] [CrossRef] [Green Version]
- Parkin, T.B.; Venterea, R.T.; Hargreaves, S.K. Calculating the Detection Limits of Chamber-based Soil Greenhouse Gas Flux Measurements. J. Environ. Qual. 2012, 41, 705. [Google Scholar] [CrossRef] [PubMed] [Green Version]
- Shigaki, F.; Dell, C.J. Comparison of low-cost methods for measuring ammonia volatilization. Agron. J. 2015, 107, 1392–1400. [Google Scholar] [CrossRef]
- Mulvaney, R.L. Nitrogen—Inorganic Forms. In Methods of Soil Analysis Part 3: Chemical Methods; Sparks, D.L., Ed.; American Society of Agronomy: Madison, WI, USA, 1996; pp. 1123–1184. [Google Scholar]
- Bremner, J.M.; Mulvaney, C.S. Nitrogen—Total. In Methods of Soil Analysis; Sparks, D., Ed.; American Society of Agronomy: Madison, WI, USA, 1982; pp. 1085–1089. [Google Scholar]
- Pietikäinen, J.; Pettersson, M.; Bååth, E. Comparison of temperature effects on soil respiration and bacterial and fungal growth rates. FEMS Microbiol. Ecol. 2005, 52, 49–58. [Google Scholar] [CrossRef] [PubMed] [Green Version]
- Nicolardot, B.; Fauvet, G.; Cheneby, D. Carbon and nitrogen cycling through soil microbial biomass at various temperatures. Soil Biol. Biochem. 1994, 26, 253–261. [Google Scholar] [CrossRef]
- Maharjan, B.; Venterea, R.T. Nitrite intensity explains N management effects on N2O emissions in maize. Soil Biol. Biochem. 2013, 66, 229–238. [Google Scholar] [CrossRef]
- Engel, R.; Liang, D.L.; Wallander, R.; Bembenek, A. Influence of Urea Fertilizer Placement on Nitrous Oxide Production from a Silt Loam Soil. J. Environ. Qual. 2010, 39, 115. [Google Scholar] [CrossRef] [PubMed]
- Burton, D.L.; Li, X.; Grant, C.A. Influence of fertilizer nitrogen source and management practice on N2O emissions from two Black Chernozemic soils. Can. J. Soil Sci. 2008, 88, 219–227. [Google Scholar] [CrossRef]
- Venterea, R.T.; Clough, T.J.; Coulter, J.A.; Breuillin-Sessoms, F.; Wang, P.; Sadowsky, M.J. Ammonium sorption and ammonia inhibition of nitrite-oxidizing bacteria explain contrasting soil N2O production. Sci. Rep. 2015, 5, 1–15. [Google Scholar] [CrossRef]
- Loska, K.; Wiechuła, D.; Pelczar, J. Application of enrichment factor to assessment of zinc enrichment/depletion in farming soils. Commun. Soil Sci. Plant Anal. 2005, 36, 1117–1128. [Google Scholar] [CrossRef]
- Mariotti, A.; Germon, J.C.; Hubert, P.; Kaiser, P.; Letolle, R.; Tardieux, A.; Tardieux, P. Experimental Determination of Nitrogen Kinetic Isotope Fractionation: Some Principles; Illistration for the Denitrification and Nitrification Processes. Plant Soil 1981, 62, 413–430. [Google Scholar] [CrossRef]
- Brimhall, G.H.; Lewis, C.J.; Ague, J.J.; Dietrich, W.E.; Hampel, J.; Teague, T.; Rix, P. Metal enrichment in bauxites by deposition of chemically mature aeolian dust. Nature 1988, 336, 403–405. [Google Scholar] [CrossRef]
- Kutner, M.H.; Nachtsheim, C.J.; Neter, J. Applied Linear Regression Models; McGraw-Hill: New York, NY, USA, 2004. [Google Scholar]
- Cassman, K.G.; Dobermann, A.R.; Walters, D.T. Agroecosystems, Nitrogen-use Efficiency, and Nitrogen Management. Agron. Hortic. 2002, 31, 132–140. [Google Scholar] [CrossRef] [Green Version]
- Follett, R.F.; Hatfield, J.L. Nitrogen in the Environment: Sources, Problems, and Management. Sci. World J. 2001, 1, 920–926. [Google Scholar] [CrossRef] [PubMed]
- Bertram, T.H.; Heckel, A.; Richter, A.; Burrows, J.P.; Cohen, R.C. Satellite measurements of daily variations in soil NOx emissions. Geophys. Res. Lett. 2005, 32, 3–6. [Google Scholar] [CrossRef]
- Harper, L.A.; Hendrix, P.F.; Langdale, G.W.; Coleman, D.C. Clover management to provide optimum nitrogen and soil water conservation. Crop Sci. 1995, 35, 176–182. [Google Scholar] [CrossRef]
- Quemada, M.; Cabrera, M.L. Carbon and Nitrogen Mineralized from Leaves and Stems of Four Cover Crops. Soil Sci. Soc. Am. J. 1995, 59, 471–477. [Google Scholar] [CrossRef]
- Dabney, S.M.; Bouldin, D.R. Fluxes of Ammonia Over an Alfalfa Field. Agron. J. 1985, 77, 572–578. [Google Scholar] [CrossRef]
- US EPA. 2014 National Emissions Inventory, Version 2; Technical Support Document; US EPA: Washington, DC, USA, 2018.
- Kirchmann, H.; Witter, E. Ammonia volatilization during aerobic and anaerobic manure decomposition. Plant Soil 1989, 115, 35–41. [Google Scholar] [CrossRef]
- Duan, Y.-F.; Kong, X.-W.; Schramm, A.; Labouriau, R.; Eriksen, J.; Petersen, S.O. Microbial N Transformations and N2O Emission after Simulated Grassland Cultivation: Effects of the Nitrification Inhibitor 3,4-Dimethylpyrazole Phosphate (DMPP). Appl. Environ. Microbiol. 2017, 83. [Google Scholar] [CrossRef] [PubMed]
- Licht, M.A.; Al-kaisi, M. Strip-tillage effect on seedbed soil temperature and other soil physical properties. Soil Tillage Res. 2005, 80, 233–249. [Google Scholar] [CrossRef]
- Van Den Bossche, A.; De Bolle, S.; De Neve, S.; Hofman, G. Effect of tillage intensity on N mineralization of different crop residues in a temperate climate. Soil Tillage Res. 2009, 103, 316–324. [Google Scholar] [CrossRef]
- Pattey, E.; Savoie, P.; Dube, P.A. The effect of a hay tedder on the field drying rate. Can. Agric. Eng. 1988, 30, 43–50. [Google Scholar]
- Buckmaster, D.R. Value of alfalfa losses on dairy farms. Am. Soc. Agric. Biol. Eng. 1990, 33. [Google Scholar] [CrossRef]
- Rotz, C.A.; Pitt, R.E.; Muck, R.E.; Allen, M.S.; Buckmaster, D.R. Direct-cut harvest and storage of alfalfa on the dairy farm. Am. Soc. Agric. Biol. Eng. 1993, 36, 621–628. [Google Scholar] [CrossRef]
Figure 1.
Daily average air temperature and cumulative precipitation from 20 April–22 August in 2018 and the 1981–2010 average.
Figure 1.
Daily average air temperature and cumulative precipitation from 20 April–22 August in 2018 and the 1981–2010 average.

Figure 2.
Time-integration (left axis) and enrichment factor (EF) (right axis) means and standard error for soil nitrogen variables by management system. (a) Soil NO3–N; (b) Soil TIN. Columns with the same letter are not significantly different at p ≤ 0.05.
Figure 2.
Time-integration (left axis) and enrichment factor (EF) (right axis) means and standard error for soil nitrogen variables by management system. (a) Soil NO3–N; (b) Soil TIN. Columns with the same letter are not significantly different at p ≤ 0.05.
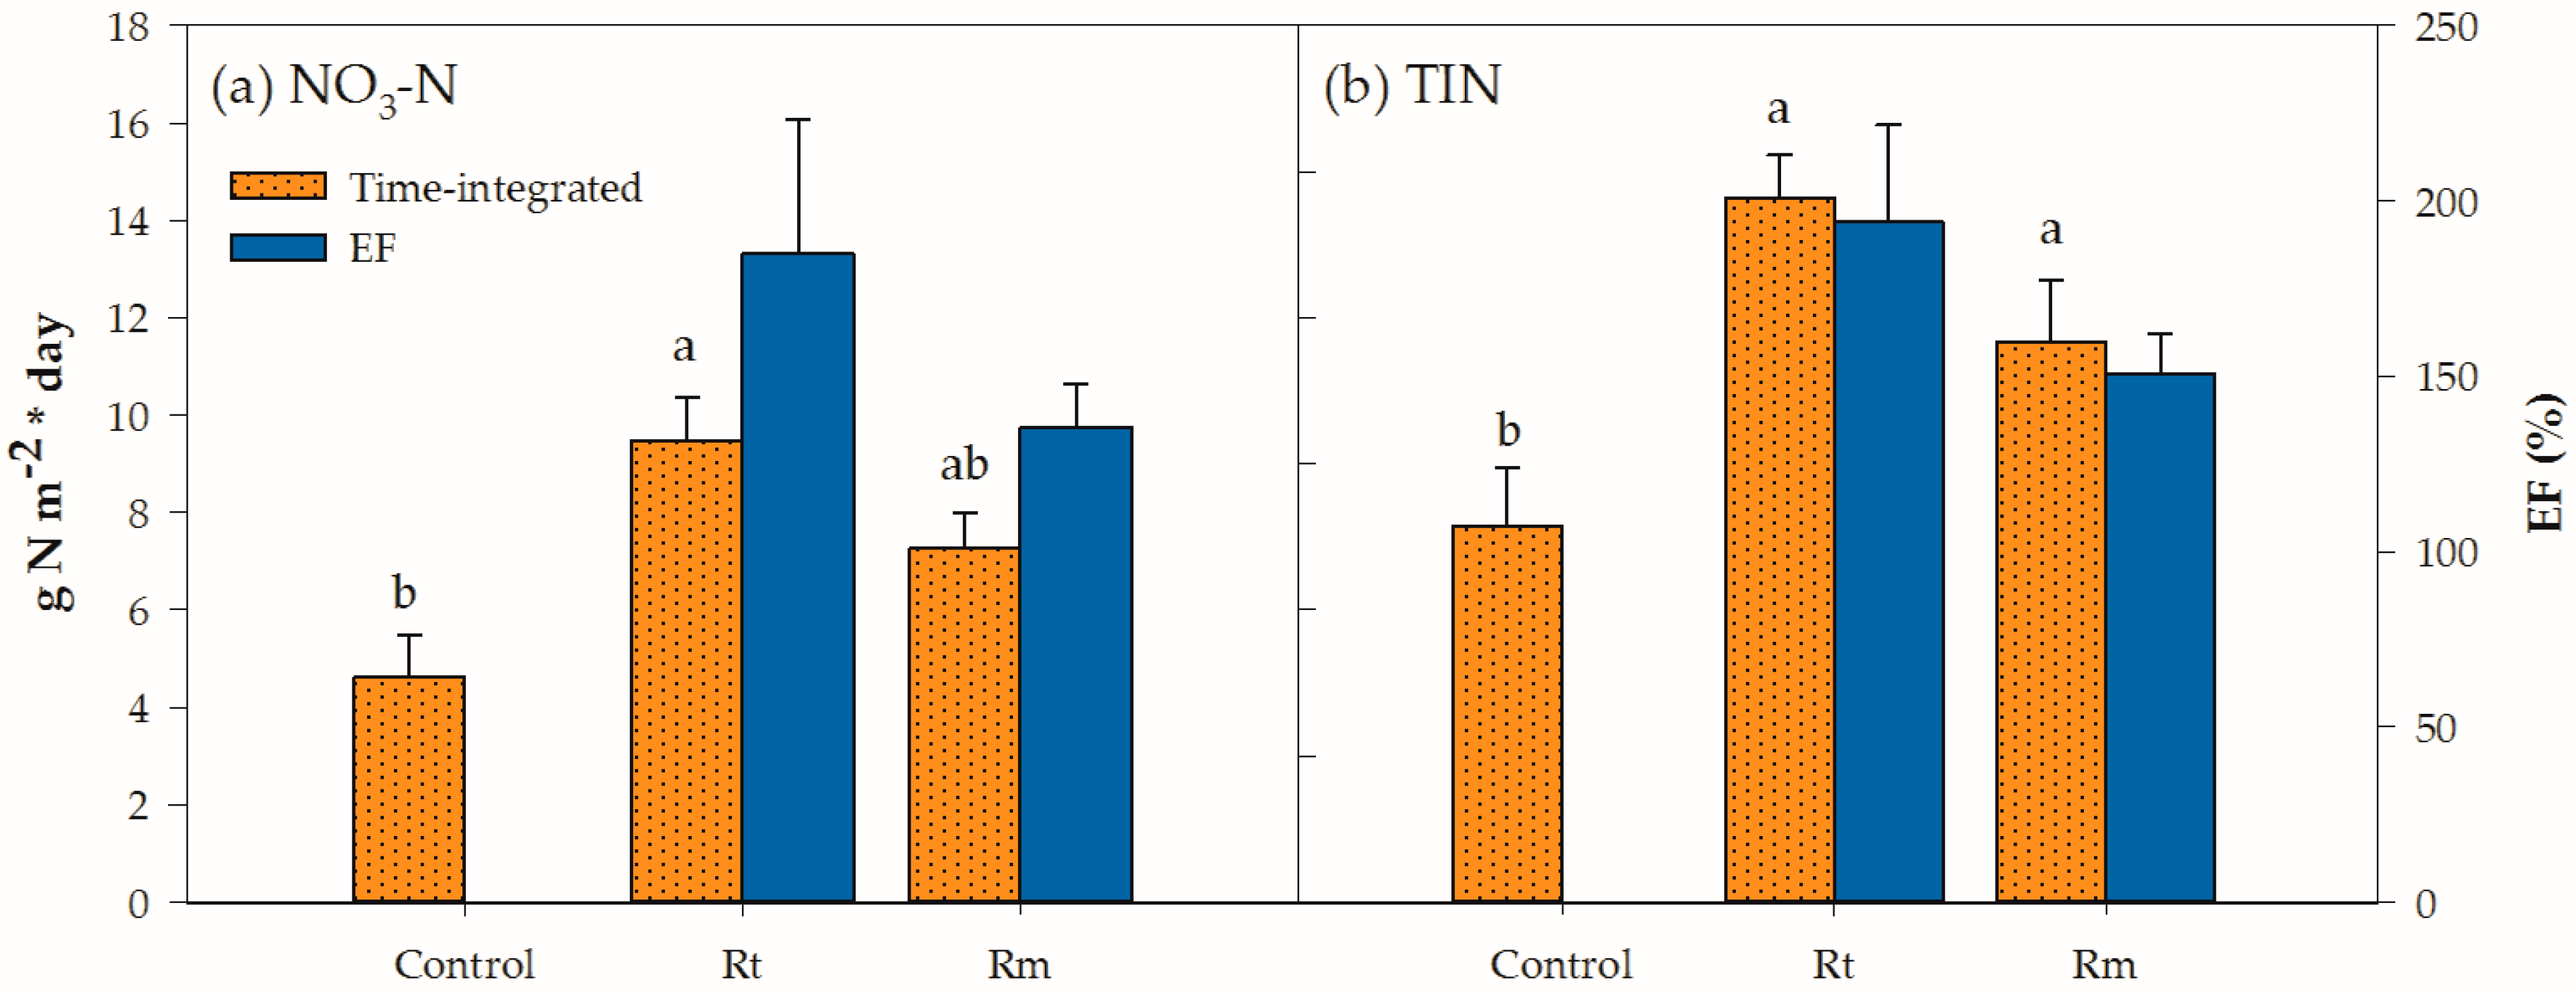
Figure 3.
Enrichment factor (EF) and standard error for soil NO3–N and soil inorganic N (TIN) following row establishment as a function of band herbicide (K) or zone till (T) row establishment and zone (row or interrow). Columns with the same letter are not significantly different at p ≤ 0.05.
Figure 3.
Enrichment factor (EF) and standard error for soil NO3–N and soil inorganic N (TIN) following row establishment as a function of band herbicide (K) or zone till (T) row establishment and zone (row or interrow). Columns with the same letter are not significantly different at p ≤ 0.05.

Table 1.
Chronological clover suppression management by management system.
| Treatment | Mowed | Residue | Row Management | Chemical Suppression |
|---|---|---|---|---|
| Date | 29 May | 31 May | 4 June | 22 June |
| Control | No | - | None | No |
| K/Rm | Yes | Removed | Band-kill | Yes |
| T/Rm | Zone-till | |||
| K/Rt | Returned | Band-kill | ||
| T/Rt | Zone-till |
Table 2.
Treatment means and significance of soil N pools post residue management prior to row establishment.
Table 2.
Treatment means and significance of soil N pools post residue management prior to row establishment.
| Factor | Time Integration | * EFs | ||||
|---|---|---|---|---|---|---|
| NO3–N | NH4–N | TIN | NO3–N | NH4–N | TIN | |
| ----g N m−2 * d---- | --------EF, %-------- | |||||
| System | ||||||
| ‡ Control | 4.6b† | 3.1 | 7.7b | |||
| § Rt | 9.5a | 5.0 | 14.5a | 222 | 161 | 194 |
| || Rm | 7.3ab | 4.3 | 11.5a | 162 | 135 | 151 |
| Significance | p-value | |||||
| 0.038 | 0.129 | 0.015 | 0.249 | 0.380 | 0.259 | |
† Within a column means followed by the same letter are not significantly different at p ≤ 0.05. * Enrichment factor of measured N variables. ‡ Unmanaged clover. § Residue returned after mowing. || Residue removed after mowing.
Table 3.
Treatment means and significance of N pools following row management.
| Fixed Effect | NO3–N | NH4–N | TIN | NH3–N |
|---|---|---|---|---|
| --------* EF, %-------- | ||||
| Row management (Rw) | ||||
| ‡ K | 268b† | 125 | 218b | 146 |
| § T | 429a | 103 | 320a | 144 |
| Residue management (Rs) | ||||
| │ Rt | 357 | 98 | 270 | 151 |
| || Rm | 340 | 130 | 268 | 138 |
| Zone (Z) | ||||
| Interrow | 193b | 140 | 175b | 120b |
| Row | 504a | 88 | 363a | 170a |
| Significance | p-value | |||
| Rw | 0.001 | 0.535 | 0.005 | 0.881 |
| Rs | 0.578 | 0.377 | 0.954 | 0.369 |
| Rw × Rs | 0.144 | 0.787 | 0.218 | 0.140 |
| Z | <0.001 | 0.161 | <0.001 | 0.006 |
| Rw × Z | <0.001 | 0.340 | <0.001 | 0.476 |
| Rs × Z | 0.452 | 0.384 | 0.378 | 0.280 |
| Rw × Rs × Z | 0.938 | 0.649 | 0.749 | 0.475 |
† Within a column for a given fixed effect, means followed by the same letter are not significantly different at p ≤ 0.05. * Enrichment factor of measured N variables. ‡ Banded herbicide row establishment. § Zone tillage row establishment. │ Residue returned after mowing. || Residue removed after mowing.
Table 4.
Treatment means and significance of soil and gaseous N pools over the entire sampling period. Clover biomass and biomass-N are from the 28 June sampling.
Table 4.
Treatment means and significance of soil and gaseous N pools over the entire sampling period. Clover biomass and biomass-N are from the 28 June sampling.
| Fixed Effect | N2O–N | NH3–N | NO3–N | NH4–N | TIN | Biomass | Biomass-N |
|---|---|---|---|---|---|---|---|
| --------* EF, %-------- | Mg ha−1 | kg N ha−1 | |||||
| Row management (Rw) | |||||||
| ‡ K | 423 | 144 | 220b† | 116 | 179b | 1.6 | 47.3 |
| § T | 376 | 151 | 304a | 110 | 229a | 1.9 | 45.3 |
| Residue management (Rs) | |||||||
| │ Rt | 349 | 156 | 268 | 105 | 205 | 1.9 | 47.7 |
| || Rm | 450 | 139 | 256 | 121 | 203 | 1.6 | 45.0 |
| Significance | p-value | ||||||
| Rw | 0.594 | 0.507 | 0.002 | 0.765 | 0.003 | 0.339 | 0.789 |
| Rs | 0.272 | 0.149 | 0.495 | 0.486 | 0.850 | 0.305 | 0.724 |
| Rw × Rs | 0.810 | 0.102 | 0.100 | 0.690 | 0.082 | 0.852 | 0.887 |
† Within a column for a given fixed effect, means followed by the same letter are not significantly different at p ≤ 0.05. * Enrichment factor of measured N variables. ‡ Banded herbicide row establishment. § Zone tillage row establishment. │ Residue returned after mowing. || Residue removed after mowing.
Table 5.
Treatment means and significance of N emission over the entire sampling period.
| Fixed Effect | N2O–N | NH3–N |
|---|---|---|
| kg ha–1 | ||
| System | ||
| † Control | 0.65 | 0.64 |
| ‡ K/ │Rt | 2.12 | 0.81 |
| K/ || Rm | 2.59 | 0.86 |
| § T/Rt | 1.76 | 0.97 |
| T/Rm | 2.09 | 0.75 |
| Significance | p-value | |
| System | 0.060 | 0.274 |
† Unmanaged clover. ‡ Banded herbicide row establishment. § Zone tillage row establishment. │ Residue returned after mowing. || Residue removed after mowing.
© 2019 by the authors. Licensee MDPI, Basel, Switzerland. This article is an open access article distributed under the terms and conditions of the Creative Commons Attribution (CC BY) license (http://creativecommons.org/licenses/by/4.0/).
Share and Cite
MDPI and ACS Style
Alexander, J.R.; Venterea, R.T.; Baker, J.M.; Coulter, J.A. Kura Clover Living Mulch: Spring Management Effects on Nitrogen. Agronomy 2019, 9, 69. https://doi.org/10.3390/agronomy9020069
AMA Style
Alexander JR, Venterea RT, Baker JM, Coulter JA. Kura Clover Living Mulch: Spring Management Effects on Nitrogen. Agronomy. 2019; 9(2):69. https://doi.org/10.3390/agronomy9020069
Chicago/Turabian StyleAlexander, Jonathan R., Rodney T. Venterea, John M. Baker, and Jeffrey A. Coulter. 2019. "Kura Clover Living Mulch: Spring Management Effects on Nitrogen" Agronomy 9, no. 2: 69. https://doi.org/10.3390/agronomy9020069
Note that from the first issue of 2016, this journal uses article numbers instead of page numbers. See further details here.