1. Introduction
Soybean [Glycine max (L.) Merrill] is one of the most important crops for protein and oil production in Kazakhstan, and the processed seed products are mainly used for the purpose of food and fodder. Soybean breeding programs and seed production have been conducted in Kazakhstan for over 40 years, where 16 cultivars have been developed and introduced into local agribusiness. The area under soybean crop is increasing annually and now accounts for more than 120,000 hectares. However, this is still not enough to provide sufficient raw materials for oil processing and livestock and poultry farms in Kazakhstan.
The soybean germplasm collection and breeding lines (750 accessions) have been assessed using the main breeding indicators for seed productivity, quality and length of the growing season. Seeds were evaluated for quality indicators including protein and oil content. However, the content of anti-nutritional compounds in seeds was not previously taken into consideration by domestic breeders. As a result, parents with high levels of anti-nutritional compounds were unwittingly used for hybridization, which has significantly affected the resulting quality of the processed soybean products. The presence of proteinase inhibitors in seeds is known to be one of the main obstacles in the development and expansion of commercial soybean products. Soybean seeds contain two classes of major proteinase inhibitors, Kunitz trypsin inhibitor (KTI) and Bowman-Birk proteinase inhibitor [
1,
2]. Trypsin is an essential digestive enzyme found in the vertebrate small intestine that catalyzes the degradation of proteins, enabling their absorption into the bloodstream. KTI contributes up to 80% of the total trypsin inhibitor activity in soybean seeds [
3].
Despite the moderate content of KTI in total soybean proteins, feeding of such seeds to livestock inhibits their growth and weight gain [
4] and causes pancreatic hypertrophy [
5]. For soybean seeds with high KTI, a preliminary heat treatment is required to inactivate the trypsin inhibitor enzyme before it can be fed to poultry and livestock. This heat treatment affectively destroys the undesirable anti-nutritional component, but also leads to an increase in the cost of the final product as well as decreased levels of available amino acids [
6].
Initially, a single gene,
Ti, encoding a high content of KTI in seeds of soybean,
G. max, was described [
7], where three dominant alleles,
Tia,
Tib, and
Tic, were reported for trypsin inhibitor A
2, and the allele
Tia was very common and widespread [
8]. The multiple alleles were further extended during the study of 1368 germplasm accessions of Korean wild soybean (
G. soja Sieb. & Zucc.), where the additional two rare dominant alleles,
Tibi7-1 and
Tibi5, were reported [
9]. The
Ti/ti locus was mapped to linkage group 9, with a genetic distance of 16.2 cM from the acid phosphatase locus,
Ap [
7], and 15.3 cM from the leucine aminopeptidase locus,
Lap1 [
10]. Later, a comprehensive molecular analysis revealed 10 genes encoding KTI in soybean, but only four of them,
Ti1, Ti2, Ti3, and
Ti4, were transcribed into mRNA [
11]. It was confirmed that only one gene,
Ti3 (GenBank ID: S45092.1), represents the major KTI, since its expression level is much more prevalent in soybean seeds compared to the other genes. The
Ti3 gene was reported to be transcribed at the seed maturation stage, producing most of the KTI protein found in soybean seeds [
12]. This KTI polypeptide represents a soybean storage protein with a molecular weight of 21–21.5 kDa, with specific activity for trypsin inhibition [
13,
14]. The sequence of
Ti3 was identical to the common allele
Tia discovered earlier [
11]. Two other genes,
Ti1 and
Ti2, displaying a lack of KTI activity, are mostly expressed at different stages of leaf, stem, and root development, and contribute a much smaller level of mRNA during embryogenesis and seed development [
11]. The remaining
Ti genes do not encode proteins with KTI activity and are assumed to be ‘Pseudogenes’.
A single recessive null-allele,
ti, resulted in the absence of KTI [
8], caused by three nucleotide differences within the
Ti3 coding region [
12]. The null-allele was initially originated from soybean germplasm accessions M91-212006, and the segregating analysis of progenies from mapping populations F
2 and F
3 was reported [
15]. It was suggested that the absence of a 21.5 kDa protein in the total spectrum of seed storage proteins was related to the null-allele
ti. Soybean germplasm accessions PI157440 and PI196168 were reported as additional sources of the null-allele
ti. The breeding lines, based on introgression of the null-allele
ti into commercial soybean cultivars using a conventional backcrossing program, revealed low KTI and improved seed quality for feeding chickens and young pigs [
8]. In a further study, the soybean accession PI542044 with pedigree origin from PI157440 and carrying the null-allele
ti was backcrossed with recurrent parents. The introgression of the
ti null-allele at BC
2F
2 and BC
3F
2 generations was controlled by Marker-assisted selection (MAS) with
ti allele-specific primers and linked SSR markers. Nine and six breeding lines with genetic backgrounds of JS97-52 and DS9712 / DS9814 recurrent parents, respectively, were obtained in Indian breeding programs [
16,
17]. The introgressed null-allele
ti was confirmed in the breeding lines and the KTI content was reduced by 69–84% [
16] and an additional seed yield improvement was reported [
17].
The aims of this research were: (1) to study a germplasm collection of soybean for the identification of genotypes with low KTI content in seeds; (2) to evaluate diagnostic genetic markers for the null-allele ti3 in parental forms and produce hybrid populations from crosses between the lowest KTI genotype identified and elite Kazakh soybean cultivars; (3) to employ marker-assisted selection for low KTI genotypes in hybrid populations for seed quality improvement in the Kazakh breeding program.
2. Materials and Methods
The soybean germplasm collection comprising 29 cultivars was selected and received from the Kazakh Scientific Research Institute of Agriculture and Plant Growing, Almaty region, Kazakhstan (Listed in Table 2). Two hybrid combinations, Lastochka × Ascasubi and Lastochka × Hilario, F
1, F
2, and F
3, generations, were produced from manual crosses using a method described recently in the patent [
18].
KTI activity was determined according to the method described by Kakade et al. [
19], using casein as a substrate and expressed in trypsin units inhibited per milligram of soybean meal.
Isolation of glycinin storage proteins was carried out in phosphate buffer (pH 6.9), with subsequent electrophoretic separation in accordance with the protocol published earlier [
20] in the presence of a molecular mass marker set ranging from 10 to 130 kDa (Thermo Fisher Scientific, Vilnius, Lithuania). Fixation and staining of the protein bands was carried out in 12.5% trichloroacetic acid. Quantitative measurement of the spectra components, their molecular mass, and relative mobility was carried out by means of the Quantum ST4 Gel documenting system (Vilber, Collégien, France), and the relative percentage of each band was calculated as a ratio of all components using the ‘Quantum Capt’ computer software supplemented to the equipment. Electrophoresis in a non-denaturing system was carried out according to the protocol published earlier [
21]. Proteins were extracted from 10 mg of flour using 62.5 mM Tris HCl (pH 8.1) buffer for 40 min. The protein probe was prepared by mixing 100 μl of supernatant with 100 μl of 62.5 mM Tris HCl (pH 6.9) buffer mixture containing 20% glycerin and bromophenol blue marker dye. Fixation and staining of the protein bands was performed as mentioned above.
Genomic DNA was extracted using the CTAB method [
22] from the first true leaves of individual seedlings grown in greenhouse conditions. Leaf tissue samples, about 200 mg each, were transferred to 2-ml test tubes with 800 µl of CTAB extraction buffer containing 1.0% polyvinylpyrrolidone (PVP40) and 0.2% β-mercaptoethanol, and homogenized using a stainless steel pestle. Extracted and precipitated DNA was re-dissolved in 400 μl of 1 M NaCl solution and treated with 2 µl (10 mg/mL) of RNase A (Thermo Scientific, Waltham, MA, USA) at 37 °C for 30 min. DNA was precipitated with cold 100% ethanol and washed with 70% ethanol. Isolated DNA was then dissolved in 100 µl of sterile water. The concentration and quality of DNA samples was determined at 260 and 280 nm using a spectrophotometer Jenway 6715 (Jenway, Staffordshire, UK). DNA samples were diluted with sterile water to a concentration of 100 ng/μl for use in further experiments.
PCR was performed in a total volume of 15 μL containing a cocktail with the following final concentrations: 1×PCR buffer, 2.5 mМ MgCI2, 200 µM each of dNTPs, 0.5 µM of each forward and reverse primers, BSA (2 mg/mL), and 0.5 U of Taq DNA polymerase (GeneLab, Astana, Kazakhstan). The PCR was conducted in a thermocycler (Bio-Rad, iCycler, Portland, ME, USA), where the amplification conditions were as follows: initial denaturation at 94 °C for 5 min, followed by 35 cycles of 94 °C for 20 s, 55 °C for 20 s, 72 °C for 30 s, and with a final extension of 10 min at 72 °C.
The amplification products were separated in polyacrylamide gel (8% acrylamide, 1×TBE buffer), and gels were stained with ethidium bromide for digital imaging by the Quantum ST4 Gel documenting system (Vilber, Collégien, France), as indicated above. The dimensional characteristics of PCR products were determined using the computer software ‘Quantum Capt’ (Vilber, Collégien, France) to determine the length and intensity of DNA fragments.
Three SSR markers tightly linked to the
Ti3 gene and distinguishing between alleles were selected based on published data [
23], and primer sequences are presented in
Table 1.
IBM SPSS Statistical software Desktop 25.0.0.0 (IBM, Armonk, NY, USA). was used to calculate and analyze means and standard error. Welch’s ANOVA test was applied for comparison of accessions with low and high KTI due to different standard deviations and heteroscedasticity. Observed and expected segregations were analyzed using Chi-square test. One-way ANOVA and post-hoc Tukey–Kramer test with the minimum significant difference were applied for calculation of significant difference among genotypes of parent and hybrids with different KTI.
3. Results
Biochemical analyses of soybean seeds in the germplasm collection were carried out for the purpose of characterizing the activity of anti-nutritional components by measuring the inhibition of trypsin by KTI. Our results show that two cultivars originating from Italy—Ascasubi and Hilario—with the lowest trypsin units inhibited, TUI (27.87 and 25.47 units/mg of dry ground seeds, respectively,
Table 2), were significantly different to other studied soybean accessions (
p < 0.001, using Welch’s ANOVA test). The best local soybean cultivars from Kazakhstan were Lastochka and Ivushka, with moderately high KTI and showing 54.16 and 54.87 units/mg of TUI, respectively, but these were still significantly higher than Hilario and Ascasubi. (
Table 2).
Electrophoresis of seed storage proteins from the studied soybean cultivars revealed the presence of a 21 kDa molecular component, corresponding to the Kunitz trypsin inhibitor, in all analyzed genotypes. Importantly, only two cultivars, Hilario and Ascasubi, with the lowest amounts of KTI, showed the absence of the 21 kDa molecular component.
Figure 1a shows the comparison of the KTI spectra in Hilario with three other cultivars as an example of the absence or presence of the KTI band. The relative percentage of KTI component in total seed storage proteins established by densitometry in the cultivar Triumph was only 1.03%, which was clearly absent in Hilario (
Figure 1b).
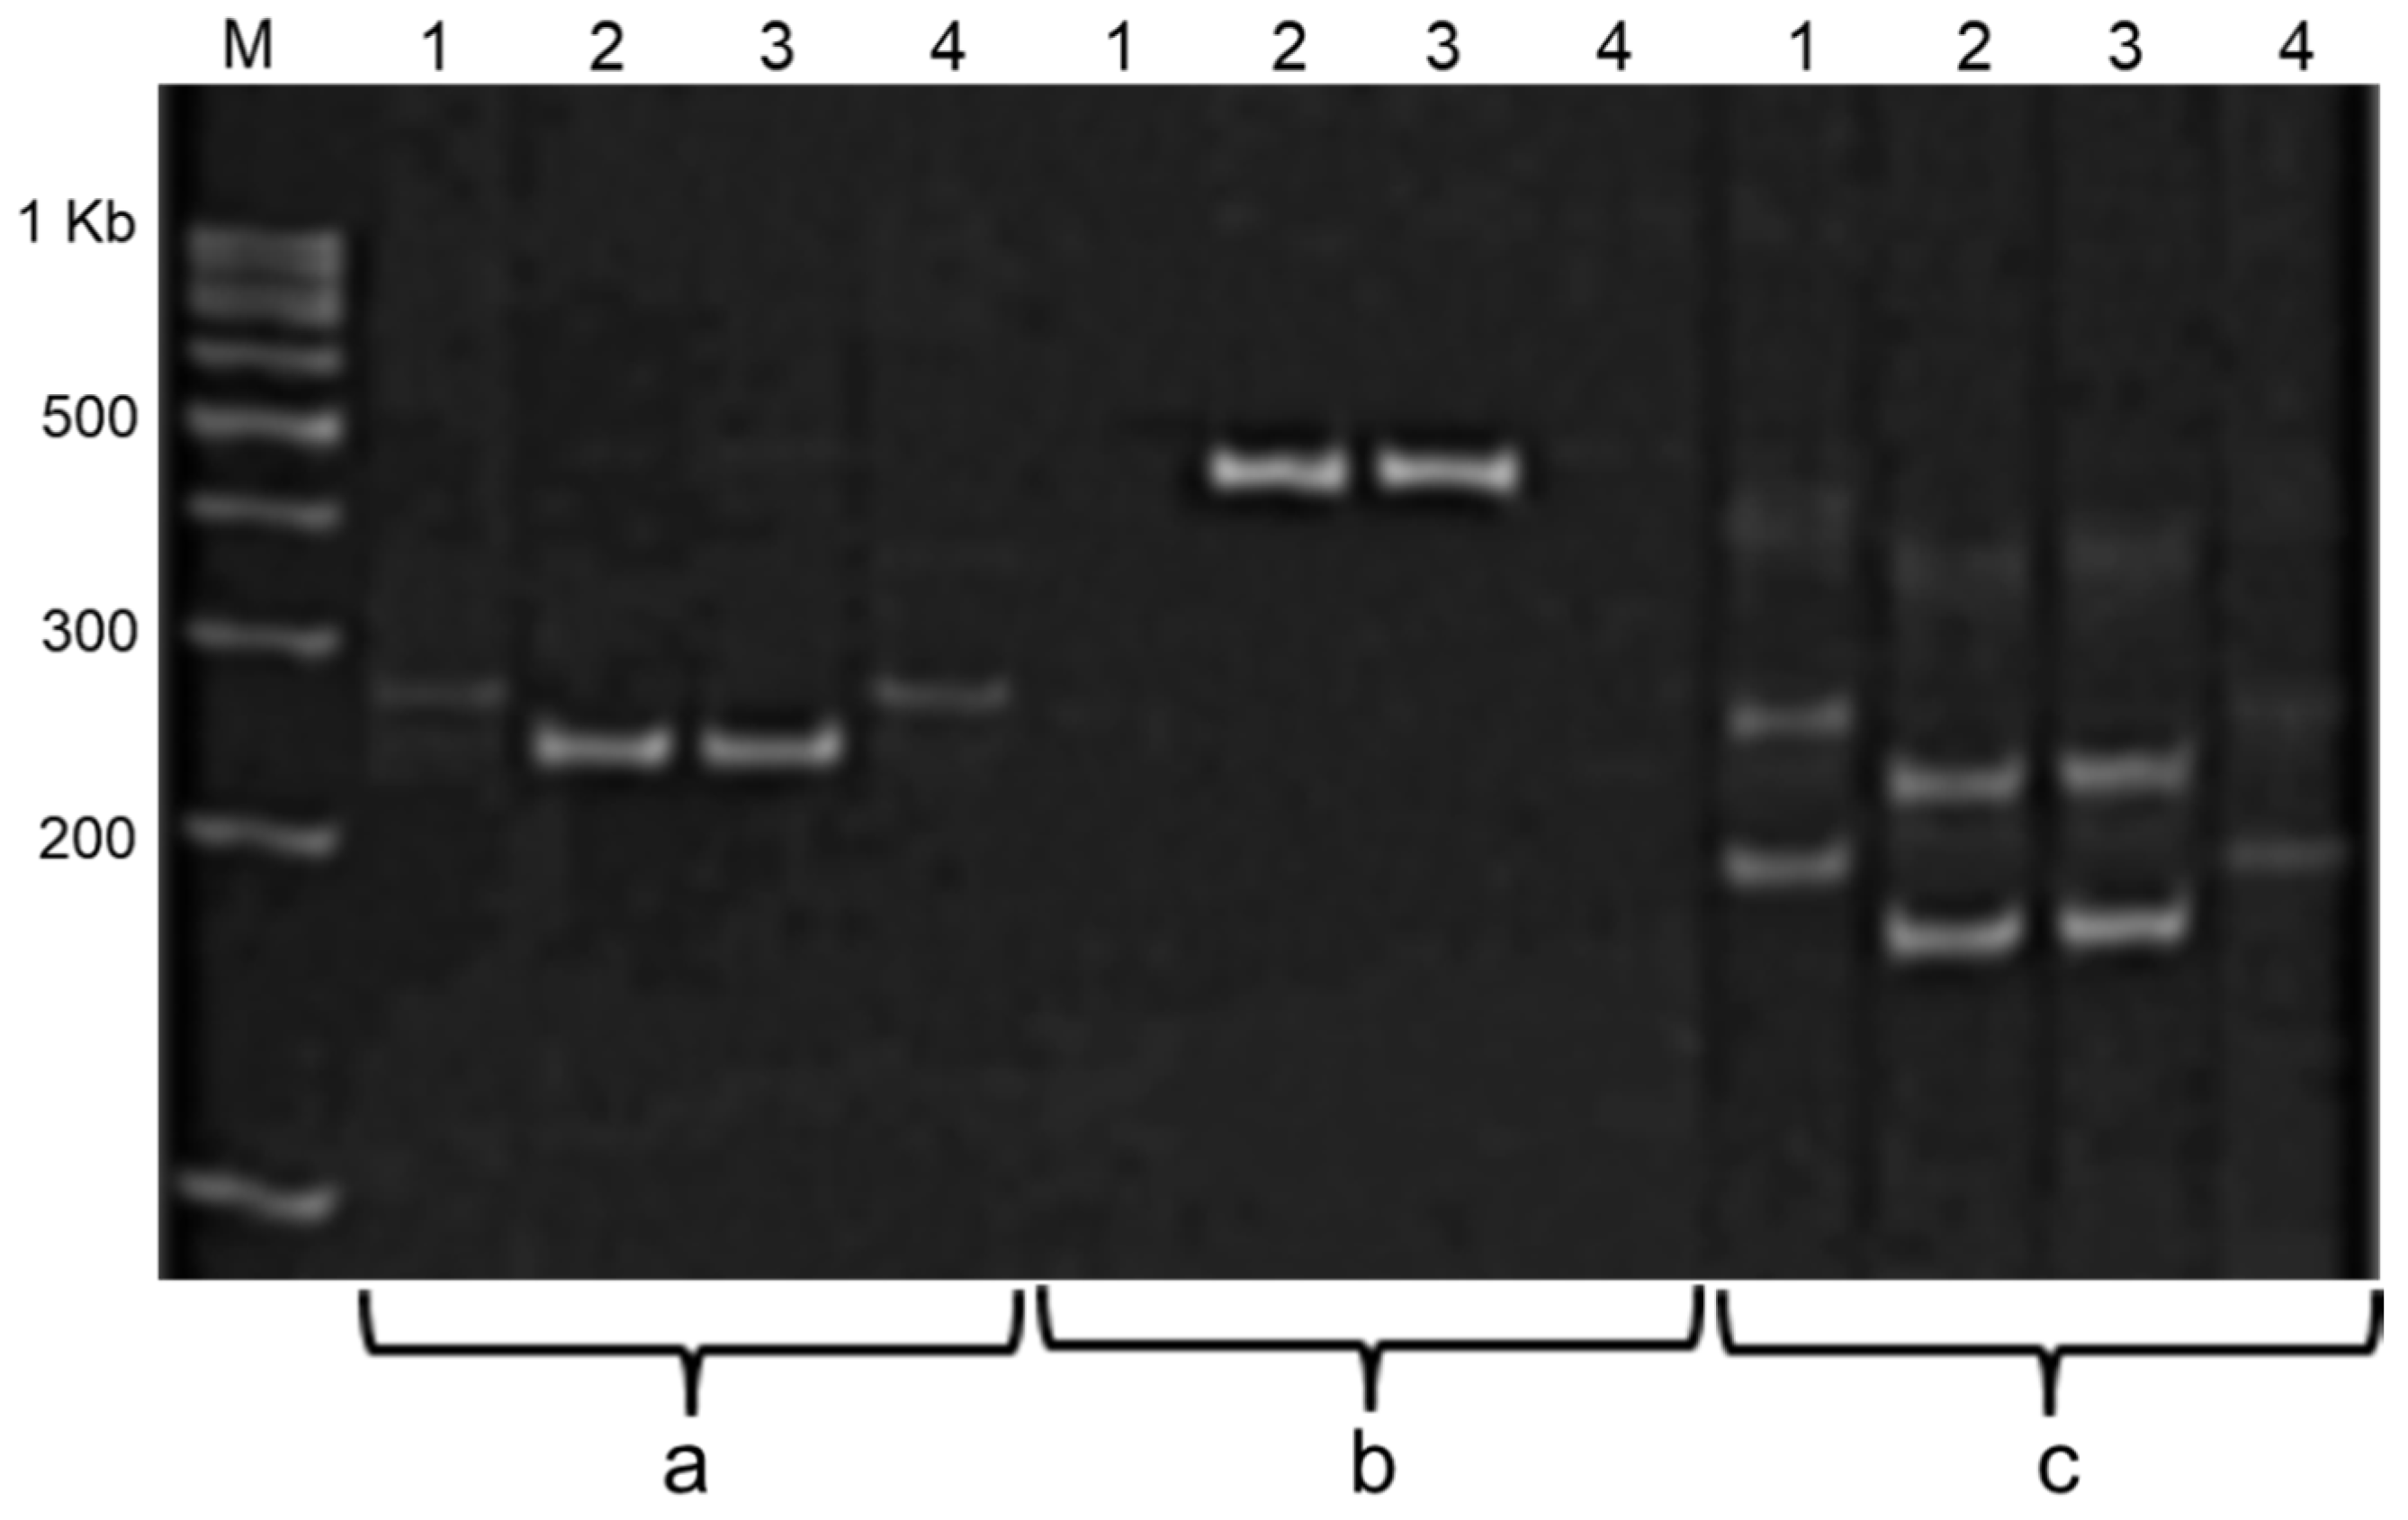
Molecular analysis of
Ti3 locus encoding KTI was carried out with three SSR markers. The markers
Satt228,
Satt409, and the gene-specific marker
Ti/ti are tightly linked to the
Ti3 locus, and they can be perfectly used as diagnostic markers for MAS of genotypes with the null-allele
ti3. Amplification products of these markers during PCR analysis with DNA from two soybean cultivars with low KTI (Hilario and Ascasubi) and one local cultivar Lastochka with high KTI are shown in
Figure 2. The presented data confirmed that both Italian cultivars (Hilario and Ascasubi) have null-allele
ti3 while Kazakh cultivar has dominant allele
Ti3 in the locus.
All markers clearly distinguish between soybean genotypes on the basis of the Ti3 alleles detected, but the Ti/ti-gene-specific marker does not allow for the identification of homo- and heterozygote genotypes with dominant alleles Ti3, which makes it difficult to apply this marker in segregating populations. In contrast, the SSR marker Satt228 was a much more suitable diagnostic marker for the further screening of plants in segregating populations, for the identification of homozygote progenies with null-allele ti3 and production of the best non-segregating breeding lines with low KTI in seeds.
The cultivars Hilario and Ascasubi were identified as the genotypes with the lowest amounts of KTI, and they were selected in the results of the biochemical and PCR analyses with the confirmed null-allele ti3. Hybrid populations were produced with the null-allele ti3 from Hilario and Ascasubi introgressed into the genetic background of local Kazakh cultivars.
In the hybrid combinations, Lastochka × Ascasubi and Lastochka × Hilario, PCR analysis of DNA from the F
1 plants and SSR marker
Satt228 confirmed the presence of the null-allele
ti3 in Ascasubi and Hilario (Data not shown). All F
1 plants were heterozygous for the
Ti3 locus with high KTI and were used for further production of the F
2 populations. Biochemical analysis for the spectrum of seed storage proteins using non-denaturing electrophoresis was applied for analyses of Kazakh varieties and F
2 segregating populations originating from the crosses, Lastochka × Ascasubi and Lastochka x Hilario. All local varieties and the parental plants from cultivars Ascasubi and Hilario, as well as segregants with null-alleles,
ti3/ti3, showed very clear presence/absence of bands in a simple discrimination pattern. This method can be used for the selection of genotypes with the null allele of the KTI locus in seeds. However, homo- and heterozygote genotypes with dominant alleles,
Ti3/Ti3 and
Ti3/ti3, could not be separated using polyacrylamide gel electrophoresis (
Figure 3).
In contrast, application of the SSR marker
Satt228 could identify all three types of genotypes at the
Ti3 locus. An example of genotyping of soybean plants using this SSR marker is presented in the second cross, Lastochka × Hilario. PCR analysis of the F
2 of hybrid plants in the presence of both parents confirmed that plants of cv. Lastochka have genotypes with the dominant alleles
Ti3/Ti3, while plants of cv. Hilario are homozygotes with the recessive null-allele
ti3/ti3. Among progenies of the F
2 hybrid population, all genotypes with the dominant and recessive alleles of the
Ti3 locus were identified (
Figure 4).
The comparison of segregation analyses using seed storage proteins and the molecular SSR marker
Satt228 revealed full consensus and confirmed the Mendelian monogenic-type inheritance in both studied F
2 populations of Lastochka × Ascasubi and Lastochka × Hilario (
Table 3).
MAS was applied for segregants with homozygote null-allele genotypes,
ti3/ti3, based on the results of screening using the SSR marker
Satt228 on F
2 hybrid progenies of Lastochka × Ascasubi and Lastochka × Hilario. The selected homozygote F
2 plants, both with recessive and dominant alleles at the
Ti3 locus, were grown and seeds from F
3 families were finally analyzed for KTI content based on TUI results (presented in
Table 4).
The presented results show consistent inheritance and very significant differences in KTI in homozygote F
3 families originating from recombinants in both hybrid combinations. In the first hybrid (Lastochka × Ascasubi), the F
3 family showed KTI content statistically similar to the parental form Ascasubi, while in the second hybrid combination (Lastochka × Hilario), statistically reduced KTI was found in the F
3 family (
Table 4).
4. Discussion
Soybean is a very widely used legume crop, but improvement of seed quality for lower KTI content is a very important and challenging task representing a critical step for soybean breeding. Therefore, the identification of soybean germplasm resources with low KTI and their introgression in hybridization programs promotes the development of promising soybean breeding lines with improved protein composition.
Among studied local Kazakh soybean cultivars, only two, Ivushka and Lastochka, were found to have more moderate levels of KTI. However, two Italian cultivars, Hilario and Ascasubi, were identified as having the lowest KTI, with significantly less than other studied soybean germplasms at 25.47 and 27.87 units of trypsin inhibited, respectively. Nevertheless, these cultivars with the lowest content of anti-nutritional factors are relatively old, having been developed in Italy in the early 1990s. Therefore, they are most valuable as donors of genetic resources to the modern soybean breeding program.
Biochemical screening of the germplasm collection for KTI and electrophoretic analysis of the seed protein composition allow for the evaluation of a range of soybean cultivars produced both locally and overseas, thus making it possible to select the most suitable parental forms for crossings and hybrid production. Homozygote progenies with the null-allele ti3/ti3 can be successfully identified and novel breeding lines can be produced from hybrid populations. However, this process must be improved and significantly sped up via the use of MAS in the initial steps of selections, using a suitable diagnostic marker strongly associated with the null-allele ti3 to produce new soybean cultivars with improved seed quality.
The presented results show the effective application of both biochemical and molecular markers for the null-allele
ti3 in the studied soybean germplasm collection, and in two segregating populations. Biochemical analysis of seed storage proteins using polyacrylamide gel electrophoresis is very accurate and can be used at the seed stage whilst also saving the viable part of the
ti3/ti3 line for multiplication. Therefore, it is important to enrich the initial pool of recombinant lines with the null allele of the
Ti3 locus because a large part of the lines can be removed at the early stage of the breeding process. The use of the diagnostic SSR marker
Satt228 is based on regular PCR and is very simple and quick. SSR markers are well known as being polymorphic, with codominant inheritance, and therefore can be widely used for genotype identification and selection of desired traits [
23]. However, the distance between the SSR marker and the gene of interest can vary depending on the type of population [
6,
24]. For example, the genetic distance between
Satt228 and
Ti3 varied between 0 and 3.7 cM in two different populations [
23]. Therefore, the number of recombinant genotypes in F
2 hybrids of Lastochka × Ascasubi and Lastochka × Hilario (
Table 3) is very small and can be estimated as 0–2.6 and 0–2.0 plants, respectively. Another codominant SSR marker
Satt409 could also be successfully used instead (
Figure 2), but it was mapped to a region more genetically distant from the
Ti3 locus at 4.5–21.9 cM [
23], meaning that there would be a greater chance of unwanted recombinants. Therefore, either native electrophoresis of storage proteins or SSR markers can support the reliable selection of new promising breeding lines, and the choice will depend on the cost or convenience as preferred by researchers. The applied MAS with
Satt228 was very effective in our experiments with both segregating populations, where homozygote genotypes
ti3/ti3 were identified, isolated, and propagated. The simple Mendelian-type inheritance of the
Ti3 locus has been confirmed [
12,
15] and helps to estimate the ratio for homozygotes with the null-allele
ti3. Finally, segregants with
ti3/ti3 genotypes were successfully verified for low KTI content and propagated for further yield analysis and development of prospective breeding lines. Our results were similar to those published earlier on the introgression of the null-allele
ti3 and MAS to select recombinant genotypes with low KTI content in an Indian soybean breeding program [
16,
17]. Hybridization and transference of the beneficial
ti3 null-alleles determining low KTI in seeds using MAS is very important to enhance the market value and overall soybean seed quality in Kazakhstan.


