Land–Use Changes Influencing C Sequestration and Quality in Topsoil and Subsoil


1
Department of Agricultural Technology, Faculty of Technology, Maha Sarakham University, Maha Sarakham 44150, Thailand
2
Soil Organic Matter Management Research Group, Khon Kaen University, Khon Kaen 40002, Thailand
3
Plant Science Section, Faculty of Agricultural Technology, Sakon Nakhon Rajabhat University, Sakon Nakhon 47000, Thailand
4
Department of Soil Science and Environment, Faculty of Agriculture, Khon Kaen University, Khon Kaen 40002, Thailand
*
Author to whom correspondence should be addressed.
Agronomy 2019, 9(9), 520; https://doi.org/10.3390/agronomy9090520
Submission received: 31 July 2019
/
Revised: 3 September 2019
/
Accepted: 3 September 2019
/
Published: 6 September 2019
(This article belongs to the Special Issue Effects of Agriculture Practices on Dynamics of Soil C and N under Current and Future Climate)
Abstract
:Soil capacity as a major carbon (C) sink is influenced by land use. Estimates of soil organic carbon (SOC) sequestration have mostly focused on topsoils [0–30 cm official Intergovernmental Panel on Climate Change (IPCC) soil depth]. We investigated SOC stocks and their quality as influenced by land-use changes. Soil samples were collected from five soil depths down to 100 cm of three adjacent fields each representing a different land use—forest, cassava, and rice paddy—in Northeast Thailand. Sequestration of SOC in topsoils under all land uses was higher, as indicated by SOC stocks (59.0–82.0 Mg ha−1) than subsoils (30–100 cm) (27.0–33.0 Mg ha−1). The soil profile (0–100 cm) of the forest had higher stocks of SOC and humic acid (115.0 and 6.8 Mg ha−1, respectively) than those of cultivated land uses [paddy (100.0 and 4.8 Mg ha−1, respectively) and cassava (87.0 and 2.3 Mg ha−1, respectively)], which accounted for an average 30% increase in SOC sequestration over those with only topsoil. Topsoils of the forest had higher humic acid content but narrower E4:E6 ratio [the ratio of absorbances at 465 nm (E4) and at 665 nm (E6)] of humic acids (2.8), indicating a higher degree of humification and stabilization than the cultivated soils (3.2–3.6). Subsoil C was higher quality, as indicated by the lower E4:E6 ratio of humic acids than topsoils in all land uses.
1. Introduction
Soil organic carbon (SOC) is the largest reservoir of C in active exchange with atmospheric carbon dioxide (CO2), thus changes in the SOC pool exert substantial impacts on global climate [1]. Land–use changes from forest to cultivated lands, particularly in the tropics, are responsible for 12–20% of greenhouse gas emissions induced by humans [2,3]. This land–use change is the second largest source of greenhouse gas emissions [2], particularly CO2 emissions [3]. The Food and Agriculture Organization (FAO) [4] reported that deforestation is occurring continuously at a high rate and accounts for 13 million ha each year. Conversion from forest to agricultural land involves burning of vegetation and surface litter and soil disturbance through plowing, which accelerates decomposition of both soil protected and non–protected SOC, which leads to changes in microbial communities and activities contributing to C loss. The C loss is not only in terms of CO2 emission but also involves rapid loss of C by leaching to subsoils [5,6].
Estimates of global SOC stocks have mostly been based on studies of the topsoil (0–30 cm). The 30 cm soil depth is the Intergovernmental Panel on Climate Change (IPCC) standard sampling depth [7]. Estimates of global SOC stocks in the surface 30 cm vary from 684 to 724 Pg [8] (equivalent to approximately 72.5 Mg ha−1). However, these estimates take only at the top 30 cm soil layer into account and do not include soil C that may be stored in deep soils (>30 cm) [9]. If the top meter is taken into account, the SOC stock can increase by as much as two–fold, reaching 1462 to 1548 Pg [8,10,11,12]. Therefore, soil may sequester a much larger quantity of C than is recognized by estimates based only on storage in topsoil.
SOC levels in topsoil and subsoil are impacted by changes in land use and vegetation cover, especially replacement of forest with crops. After conversion from forest to farmland, significant declines in SOC stocks [13,14,15] and changes in the pattern of SOC accumulation in topsoil (0–30 cm) and subsoil (30–100 cm) have been found. For instance, Wei et al. [15] reported that the largest decrease in SOC stock in topsoils (0–30 cm) was observed in temperate regions (52%) followed by tropical regions (41%) and boreal regions (31%) with an average global decline of about 34% when forests were changed to agricultural land uses. However, changes in the overall soil C stock vary in different soil layers in a soil profile, e.g., topsoil vs. subsoil, with more pronounced changes often reported in topsoils than subsoils when forest is converted to agricultural land use [10,16]. For example, Bonfatti et al. [10] reported that SOC stocks in subsoil (30–100 cm) were reduced by 23% upon conversion of forest (96 Mg C ha−1) to arable land (74 Mg C ha−1) in Southern Brazil. The reduction in the subsoil was lower than that in the topsoil (0–30 cm), which showed a decline of 25%. However, some studies have found opposite results; for instance, Don et al. [5], in their meta–analysis focusing on tropical soils, revealed that the decrease of SOC stocks (25%) in subsoil (below 20 cm soil depth) was higher than in the 0–20 cm layer (a decrease of 20%) when primary forest was converted to cropland. More recently, Strey et al. [17] found that SOC stock losses were higher in subsoils than topsoils when forest was converted to pasture. They attributed the decline in the subsoil C stock to activation of subsoil C decomposition due to soil disturbance and fresh inputs of dead roots from cleared forest vegetation.
Differences in rates of SOC loss from topsoil and subsoil in response to changes in land use may be related to differences in the texture of the soil in these layers, especially their clay content. Thus, an Ultisol, in which the topsoil has a very coarse texture with a higher clay concentration in the subsoil, may retain more SOC in the subsoil than the topsoil when forest is cleared to plant crops. Ultisol soils cover a large area (730 × 106 ha) of the world, accounting for 6% of total world land area [18]. This soil has coarse textured topsoil that becomes finer due to increased clay content in subsoils. The change in soil texture between topsoils and subsoils can potentially influence the capacity of these different soil layers for soil C sequestration. Finer texture with a larger proportion of clay can impede SOC decomposition by physical, chemical, and biological mechanisms [19,20]. Soil texture contributes to chemical stabilization of SOC by physicochemical adsorption of SOC on soil clay mineral surfaces [21]. Clay can also indirectly affect soil C storage by contributing to soil aggregate formation inside which organic materials are occluded, making them inaccessible to degrading organisms and their enzymes [19,22]. The above mechanisms (adsorption and aggregation) underlying SOC stabilization are regulated by the proportion of clay in a soil—more clayey soils have higher degrees of SOC stabilization than their more sandy counterparts. In a soil with coarser–textured topsoils and finer–textured subsoil, e.g., an Ultisol, it is possible that a greater amount of SOC may be lost from the coarser–textured topsoil to the finer–textured subsoil in the form of dissolved organic C (DOC). Thus, SOC in the Ultisol may accumulate in subsoil. Kunlanit [23] found that C leached from topsoil to subsoil is in a form of labile C, such as DOC with low molecular weight (<1 kDa). There have been a few investigations focused on C stocks under different land uses in Ultisol soil profiles. In Brazilian Ultisol, Vicente et al. [24] reported that rubber tree soil showed the highest SOC stock (219 Mg ha−1) at a depth of 0–100 cm followed by pasture (176 Mg C ha−1), secondary forest (168 Mg C ha−1), and five–year–old (160 Mg C ha−1) and three–year–old eucalyptus plantations (148 Mg C ha−1). They found that SOC accumulated in the subsoil layer (20–40 cm depth) in all land uses contributed to a higher SOC stock in this layer than other soil layers (0–10, 10–20, 40–60, 60–80, 80–100 cm).
Soil organic carbon has humic and non-humic substance constituents [25]. The humic substances are the major fraction (85%) of soil organic matter (SOM) and have a greater influence on soil fertility through regulation of most soil processes compared to the non–humic counterpart [25,26]. In order to study humic fraction, the E4:E6 ratio [the ratio of absorbances at 465 nm (E4) and at 665 nm (E6)] has been widely used [27]. The E4:E6 ratio is inversely related to the degree of condensation and aromaticity of the humic substances and to their degree of humification [25,28]. Changes in field management practices can alter the chemical properties of soil humic substances [21]. Progressive decreases in humic substance concentrations in soils that were converted from forest to arable land farming were found in many studies [6,29,30,31]. Such decrease is commonly attributed to microbial oxidation of the organic materials previously protected in soil aggregates but then destroyed by cultivation. Changes in C:N ratio after land–use change indicate variation in the degree of decomposition of SOM [32]. In general, cultivated soils have lower C:N ratios than forest soils due to lower C:N ratios of crop residue inputs and microbial decomposers [14]. Vertical patterns of soil C:N ratios in soil profiles have been shown to vary with ecosystems and land uses. In alpine grassland, there was no significant change in C:N ratio along the soil profile [33], while some work showed declines in soil C:N ratio with depth in soils that originated from outcrops in southwestern Washington [34], from glacial action in upstate New York [35], as well as in temperate and boreal forests in eastern Canada [36]. In Northeast Thailand, tropical agronomic crops such as cassava, sugarcane, and paddy rice occupy a large area that was formerly covered by forest. There have been only a few studies in this region that have addressed the impact of land–use change on stocks of SOC and humic substances in topsoil [37] and on SOC stocks in soil profiles [38,39]. Therefore, the present study was carried out to investigate comparative changes in soil potential for C sequestration between topsoils only and topsoils plus subsoils under different agricultural and forest land uses. In addition, this study investigated quality of C stock (sequestered C) with an emphasis on stabilized C (humic substances) in different layers and focusing on comparison of topsoils and subsoils under different land uses.
2. Materials and Methods
2.1. Study Site and Soil Sampling
The study site was located in Don Wan sub–district, Muang district in Maha Sarakham province, Northeast Thailand (16°02.301’ N, 103°18.692’ E; Figure 1). Three adjacent fields representing dominant land uses in the area were studied, including deciduous dipterocarp forest, cassava converted from forest five years ago, and paddy converted from forest >10 years ago. Both cassava and paddy land uses involved soil tillage, which was conventionally practiced in this region. The soils in forest and cassava fields were identified as the Chakkarat series (Oxyaquic Paleustults), while the soil in the paddy field belonged to the Ubon series (isohyperthermic Aquic Grossarenic Haplustalfs) [40]. The fields were located at different elevations, i.e., 200, 191, and 179 m above sea level for forest, cassava, and paddy lands, respectively.
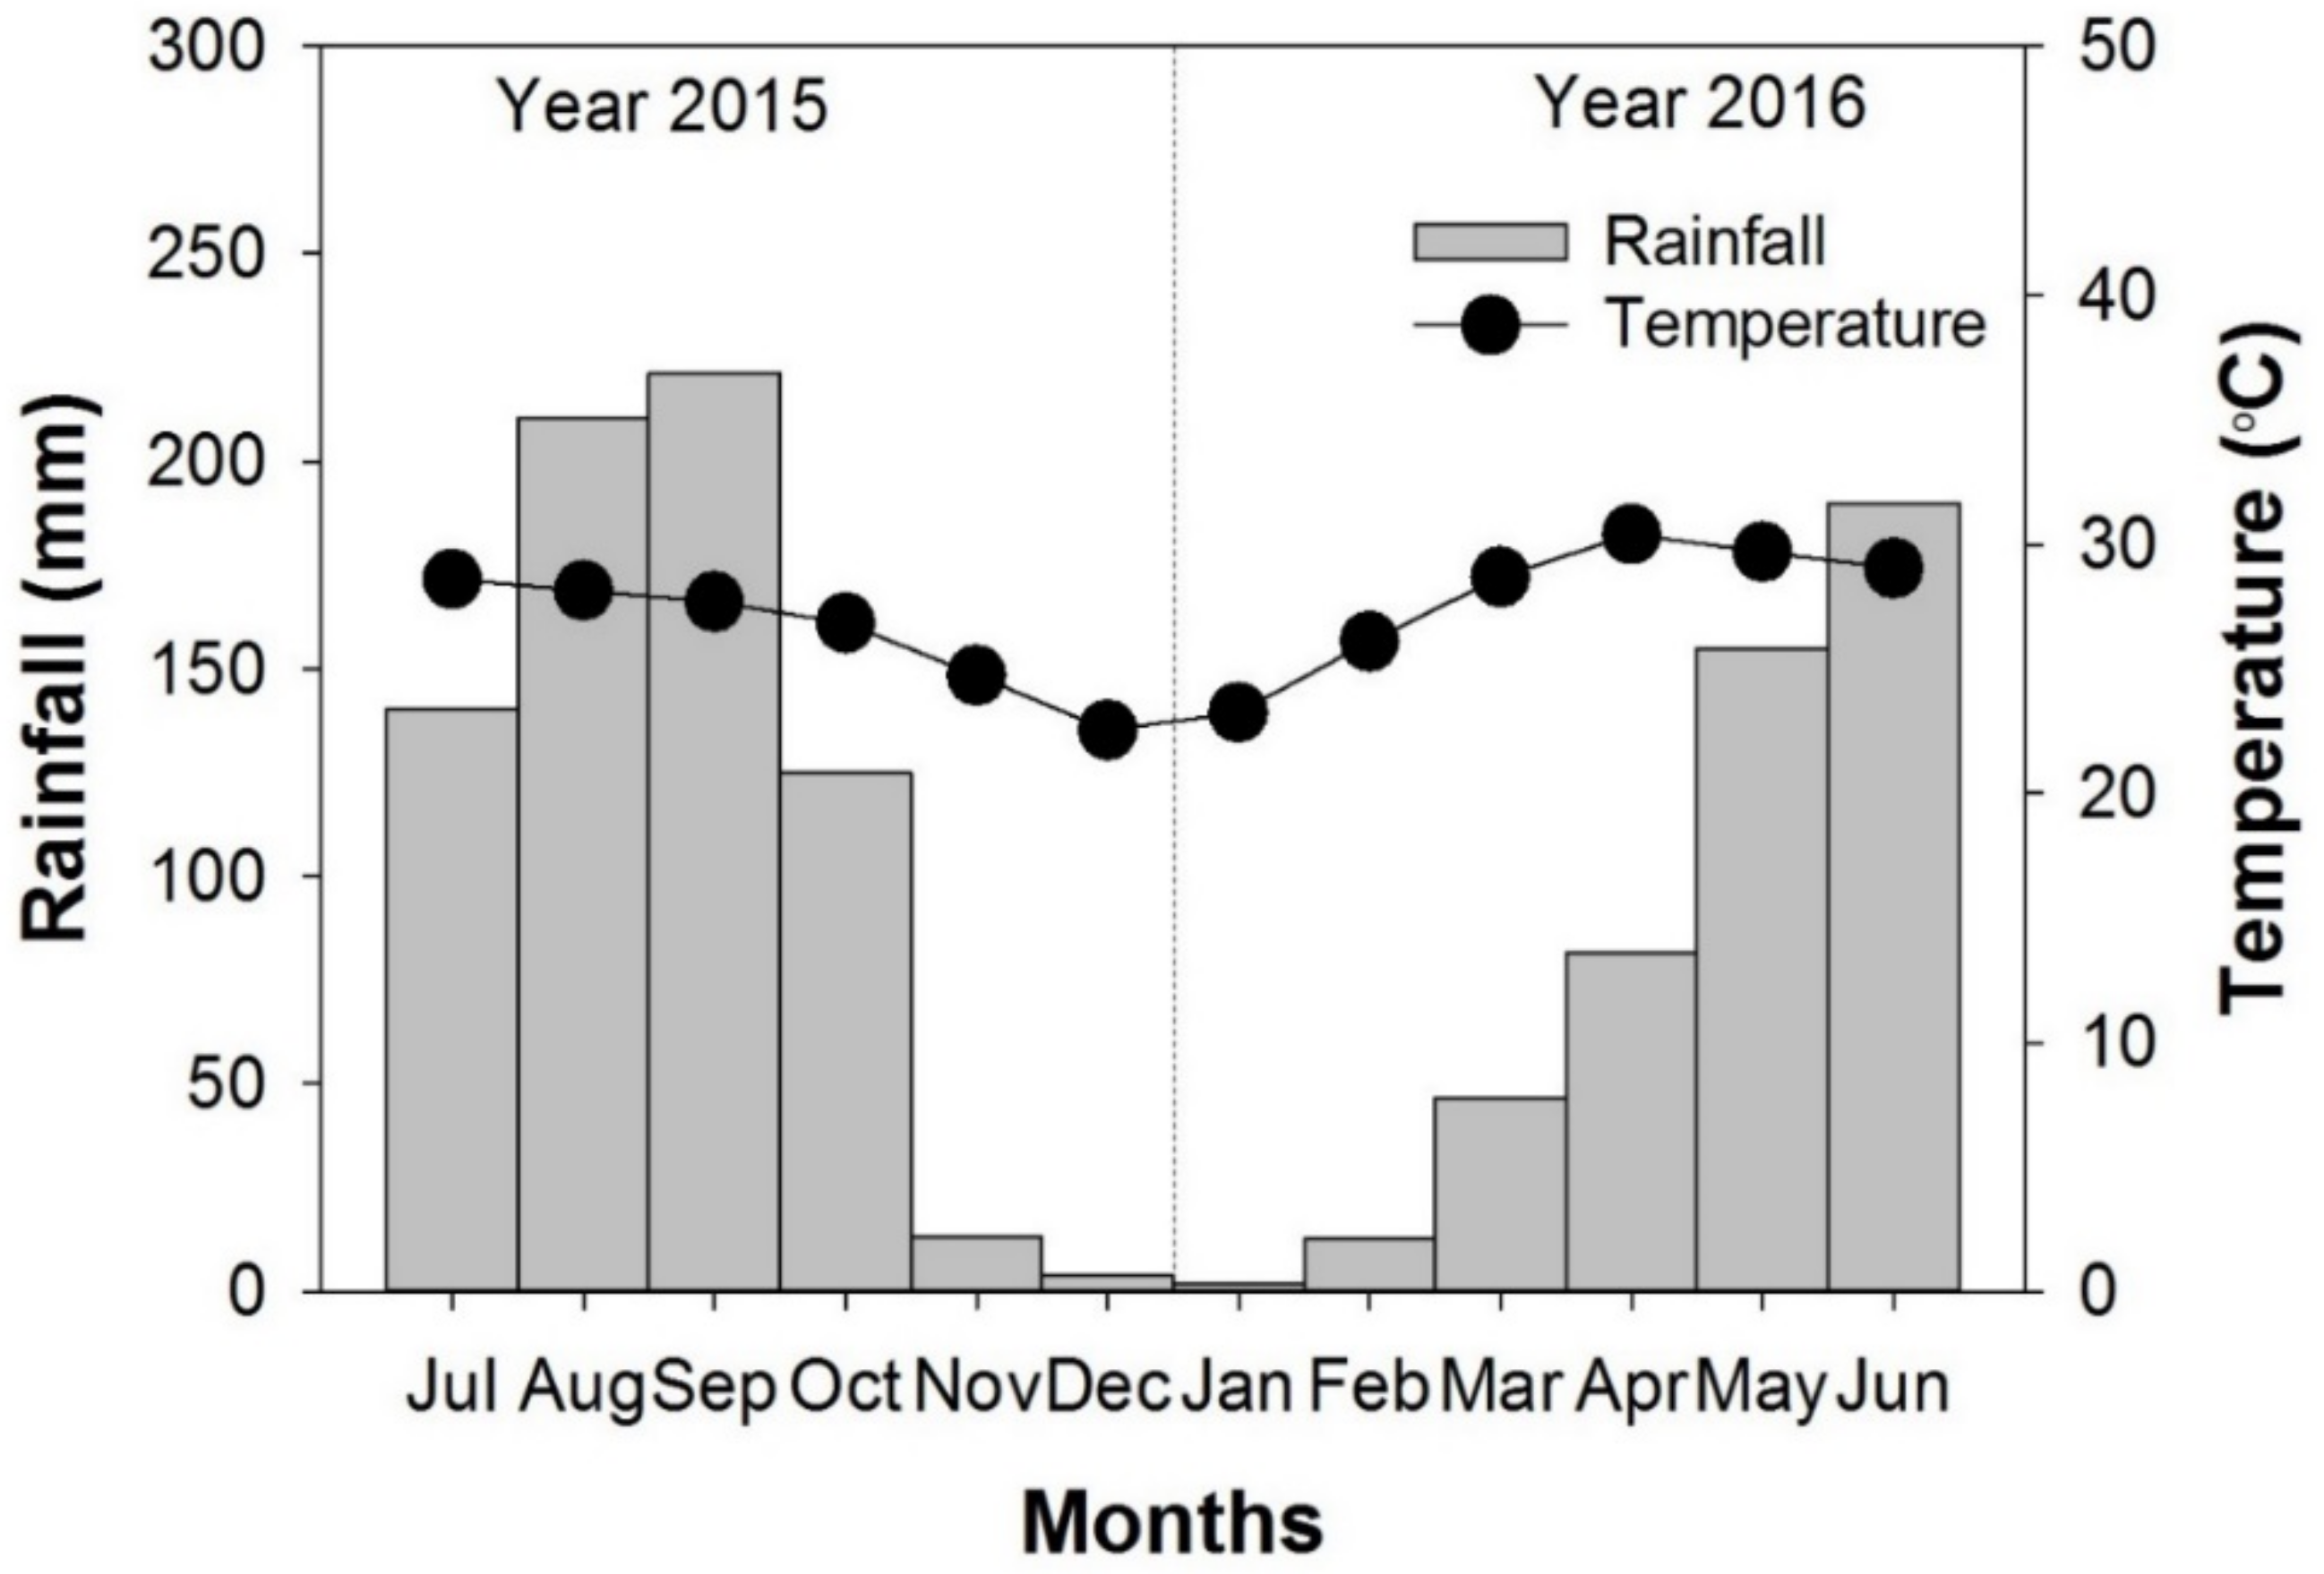
The climate at the study site is classified as savanna type (Köppen classification, [41]) with distinct wet (May–October) and dry (November–April) seasons. Average monthly precipitation and temperature over the soil sampling period (July 2015–June 2016) are shown in Figure 2 (the Northeastern Meteorological Center Maha Sarakham province, pers com) in which a typical double–bell shaped pattern was found with two peak rainfall periods in September and the following June. The dry period was during November to the following March. The average temperature during the study period was 26.8 °C, and the total rainfall was 1055 mm, which is comparable to the 30–year mean rainfall in the area of the study site of 1070 mm year−1. Soil samplings were conducted in the dry season after the crop harvest in March 2016. Random sampling was employed at 34, 27, and 37 sampling points in the areas of various land uses of forest (21 ha), cassava (5 ha), and paddy (13 ha), respectively (Figure 1). At each sampling point, samples from five soil depths (i.e., 0–15, 15–30, 30–60, 60–80, and 80–100 cm) were collected using an auger. Soil samples were air–dried and passed through a 2 mm sieve for further laboratory analyses.
2.2. Soil Physical Properties under Different Land Uses
Soil texture under paddy and cassava land uses were loamy sand at 0–80 cm depth, while at 80–100 cm, the textural classes were sand and sandy loam, respectively (Table 1). Soil texture under forest at 0–60 cm was loamy sand, but at 60–80 and 80–100 cm, they became finer, i.e., sandy loam and sandy clay loam, respectively. These lower soil layers with finer texture were illuvial B horizon where clay had accumulated. In paddy land, soil texture was loamy sand with 80% sand content without appreciable change in soil texture down to 80 cm depth, where it became coarser textured (sand). Soil bulk density at 0–15 cm under all land uses was lower than that of the sublayers down to 100 cm (Table 1). Soil incorporation of decayed fallen litter as well as remaining organic materials after crop harvests enhanced soil porosity for aeration and resulted in lower bulk density of the plough layer at 0–15 cm compared with the deeper soil layers. Soil moisture contents were higher in paddy soil than both cassava and forest soils throughout the soil profiles (Table 1). The paddy area was located at a lower elevation than the other two land uses and, at the sampling time in March, some intermittent rain had started (Figure 2), which may have raised the water table, resulting in higher soil moisture contents in the paddy compared to the other two land uses.
2.3. Soil Analysis
Soil particle size distribution was determined using the pipette method [42]. Bulk density was determined at the five studied soil layers by taking the topmost 5 cm of each layer and employing the core method using core size 5 cm in diameter and 5 cm in height [43], while soil moisture content was determined in the same soil samples as those of bulk density by the gravimetric method [44] through oven drying the soil in the soil cores. Total OC content was determined by potassium dichromate (K2Cr2O7) oxidation (Walkley and Black wet digestion) and subsequent determination of the unreduced dichromate by oxidation–reduction titration with ferrous sulfate (FeSO4) [45]. Total N contents were determined by micro Kjeldahl method [45]. Humic acid contents were determined using the International Humic Substance Society method (IHSS) [46,47]. There are two major steps for determination of humic acid. Soil samples were extracted with 0.1 M solution of NaOH at a soil: solution ratio of 1:5, and crude humic acid precipitate at pH 2 was purified. The UV–VIS analysis gave an E4:E6 ratio of humic acids, which was performed according to Chen et al. [48]. Soil bulk density (Table 1) was used to calculate C and humic acid stocks. Corrections were applied to the calculated soil C and humic acid stocks by comparing the soil mass [9,49] from the agricultural land use with the mass from the original forest land use, both at 1 m, according to Equation (1):
where Mf (g cm−3) is the mean soil bulk density of the forest soil at a given depth, and Mm (g cm−3) is the mean soil bulk density for each studied layer after forest conversion at the same depth. After correcting the equivalent soil layer, we calculated the stock of SOC (Sc) and humic acids (Ha) by Equation (2):
and:
Layer thickness (cm) = (Mf/Mm) × 100 cm
Sc (Mg ha−1) = C content (%) × bulk density (g cm−3) × layer thickness (cm)
Ha (Mg ha−1) = humic acid contents (%) × bulk density (g cm−3) × layer thickness (cm)
2.4. Statistical Analysis
One-way ANOVA was used to analyze various soil parameters under different land uses. The data were checked for normality and homogeneity of variances to meet the assumptions for ANOVA. Means comparisons among the different land uses and soil depths were carried out by least significant difference (LSD) and were considered significant and highly significant at p < 0.05 and p < 0.01, respectively. Relationships between SOC and humic acid stocks were performed using Spearman’s correlation analysis. Statistical analyses were performed using Statistix 8.0 software (Analytical Software, Tallahassee, FL, USA).
3. Results and Discussion
3.1. Carbon Sequestration in Topsoil and Subsoil
Forest soil had higher SOC stocks (115.0 Mg ha−1) in the soil profile down to 100 cm than paddy (100.0 Mg ha−1) and cassava (87.0 Mg ha−1) soils, although the differences were not significant (p > 0.05). Meanwhile, SOC stock in topsoil (0–30 cm) was significantly higher than subsoil (30–100 cm) in all land uses (p < 0.05) (Figure 3a). Carbon stocks in topsoils (0–30 cm depth) of the three different land uses ranged from 59.0 to 82.0 Mg ha−1 (Figure 3a) and accounted for 68–73% of total SOC stock in the whole soil profile. These carbon sequestration values were of the same magnitude as those found in the literature; for example, soil under pure Cedrus deodara forest had SOC stocks that amounted to 49.0 Mg ha−1 higher than those of agricultural land (29.0 Mg ha−1) throughout a 0–30 cm soil depth [50]. In subsoils (30–100 cm), carbon sequestration was approximately two– to three–fold less than that in the topsoils, as the SOC stocks of subsoils were in the range of 27.0–33.0 Mg ha−1 in the three land uses studied (Figure 3a). However, subsoil C represented an average of 30% of the total C sequestered in the soil profiles (29, 32, and 27% of total SOC under forest, cassava, and paddy, respectively) (Figure 3b). This finding that subsoil is an important storage site for SOC is supported by a recent study of C sequestration in an Oxisol in an Amazonian forest [51], which found that only 22% of C in the whole soil profile was in the topsoil, 52% was in the top meter, and 84% was down to 3 m. Based on this finding, the researchers recommended evaluating subsoil C sequestration even down to 3 m [51]. Our findings provide additional empirical support for the need to take subsoil into account as an important C sink that may make a major contribution to global C sequestration and thus exert an impact on climate change.
3.2. Carbon Loss Due to Land Use Change
The field planted to cassava suffered greater soil degradation than the paddy field, although both land uses had decreases in their SOC stocks relative to forest. The SOC stock of cassava decreased by 28.0 Mg ha−1 compared to the stock in the original forest. This decrease was in the range reported by Lal [52] of 30.0–40.0 Mg ha−1 loss in most croplands. Increased C sequestration under cassava land use might be achieved through employing restorative agricultural practices such as minimum tillage and growing of ground cover crops.
Conversion from forest to agricultural land uses resulted in a decrease of SOC stocks, most notably in the topmost layer (0–15 cm depth) in which cassava land use showed the lowest C stock, which was significantly lower than the forest (Figure 3c). Paddy land showed a trend toward a lower C stock than forest but remained higher than cassava. The SOC stocks, in both absolute and relative terms, under all land uses were significantly smaller in the lower four layers (15–30, 30–60, 60–80, and 80–100 cm) than in the topmost layer (Figure 3c,d). The bottommost layer (80–100 cm depth) joined the topmost one in having significantly different C stocks (absolute values) among land use types, i.e., the C stock under the forest was the highest, which was significantly higher than the paddy (p < 0.05). Cassava had an intermediate C stock in the bottommost later but was not significantly different from forest and paddy (Figure 3c).
Many studies have reported higher amounts of SOC in upper horizons than deeper horizons in both forest and cultivated soils [16,31,53,54]. Enhanced SOC accumulation in the topsoils have resulted from decomposition of organic materials from various sources: dead organisms (e.g., animals, insects), fallen leaf litter, and root exudates. Our study revealed that conversion of forest to cultivated lands (i.e., paddy and cassava) reduced SOC stocks of the whole soil profile (0–100 cm) by 13 and 24% relative to forest in paddy and cassava, respectively. An earlier investigation in Northeast Thailand by Tangtrakarnpong [55] found that SOC contents at 0–15 cm depth were reduced by 78 and 24% upon conversion of forest to cassava and paddy fields, respectively. Forest soil at 0–30 cm soil depth under dominant vegetation of Cedrus deodara in Pakistan had higher SOC stocks (49.0 Mg ha−1) than agricultural land (29.0 Mg ha−1). The SOC stock of the agricultural land was decreased by 41% of the original forest [50]. In addition, Don et al. [5] reported that conversion of primary forest to croplands led to a decrease in SOC stock in 0–32 cm soil depth by 20.0 Mg ha−1, equivalent to a relative decrease of 25%. Likewise, in Nepal, Dhakal et al. [56] found that conversion from forest to cultivated land decreased SOC stocks by 66% in the top 0–13 cm soil layer. More striking decreases of SOC stocks were found in Ethiopia due to forest conversion to cultivated lands, i.e., 58% in the topsoil (0–15 cm) [57] and 63% (0–10 cm) after a 30-years cultivation period [58]. These research results show that land use conversion from forest to cultivated land without appropriate soil management has led to loss of accumulated SOC in these soils relative to original SOC levels under forest. In cultivated land, removal of crop residues after harvest from soil is a major cause of loss of SOC from the soils. The meta–analysis by Xu et al. [59] found that corn stover removal reduced final SOC stocks by 8% in the upper 0–30 cm compared to the values when stover was retained. In land under forest, SOC accumulation in the soil profile was high due to consistent litter input without removal and little soil disturbance due to no soil tillage, which are characteristics of a natural ecosystem that differ from an agricultural system [60,61,62].
3.3. Chemical Composition of Carbon in Topsoils and Subsoils
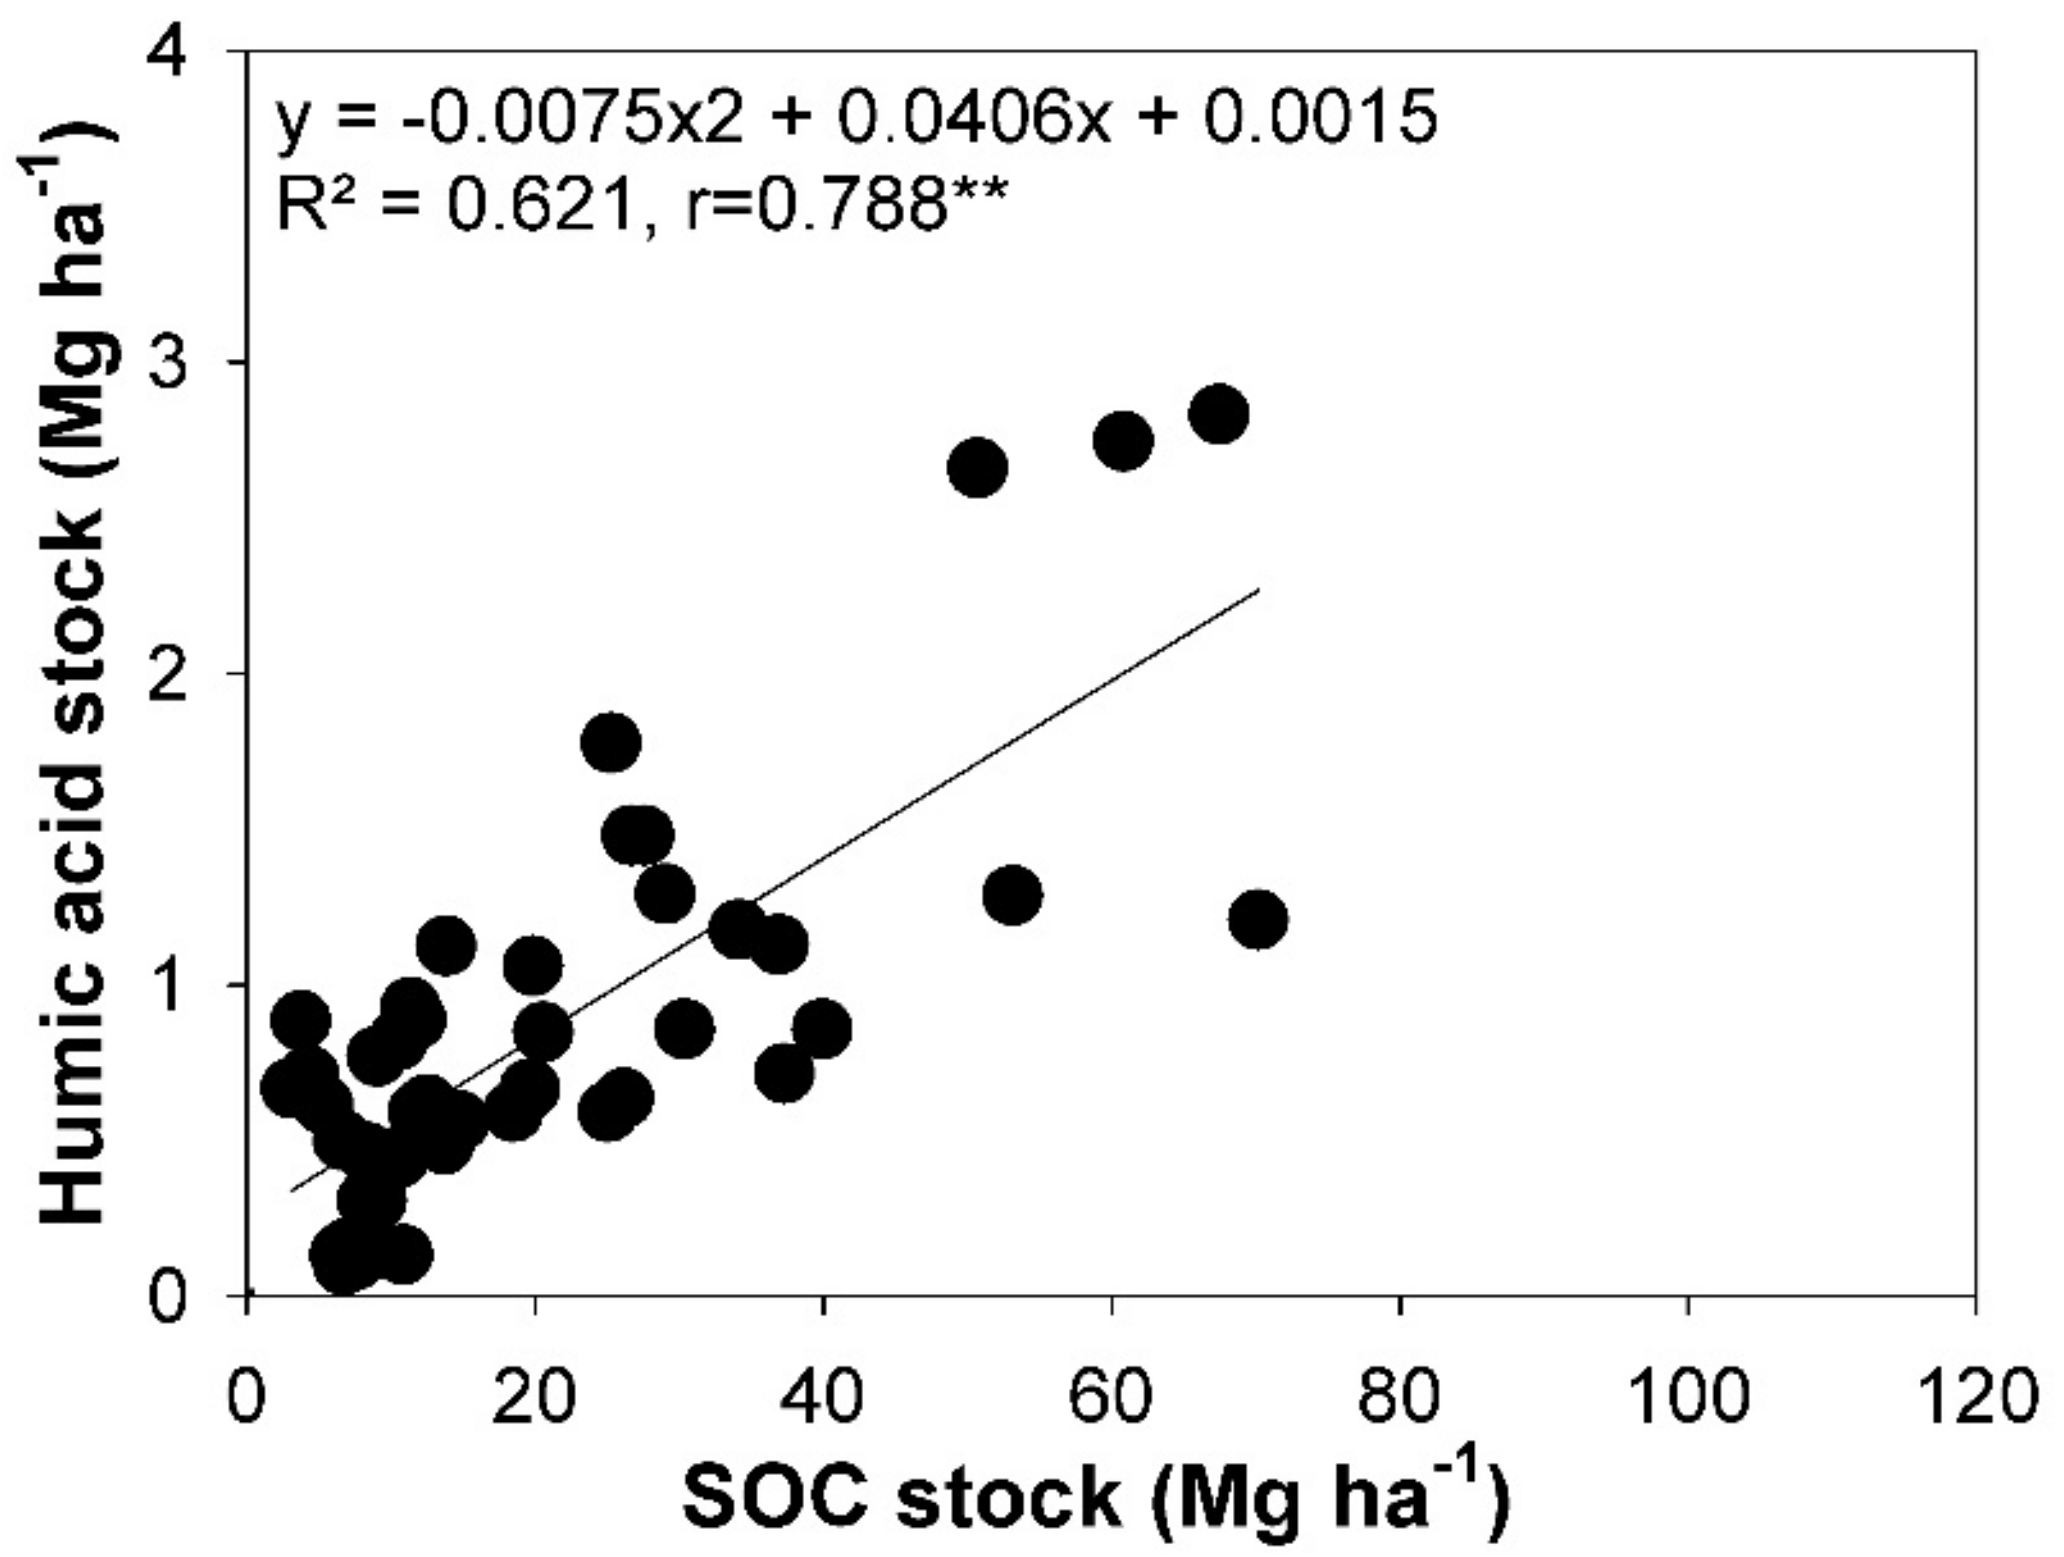
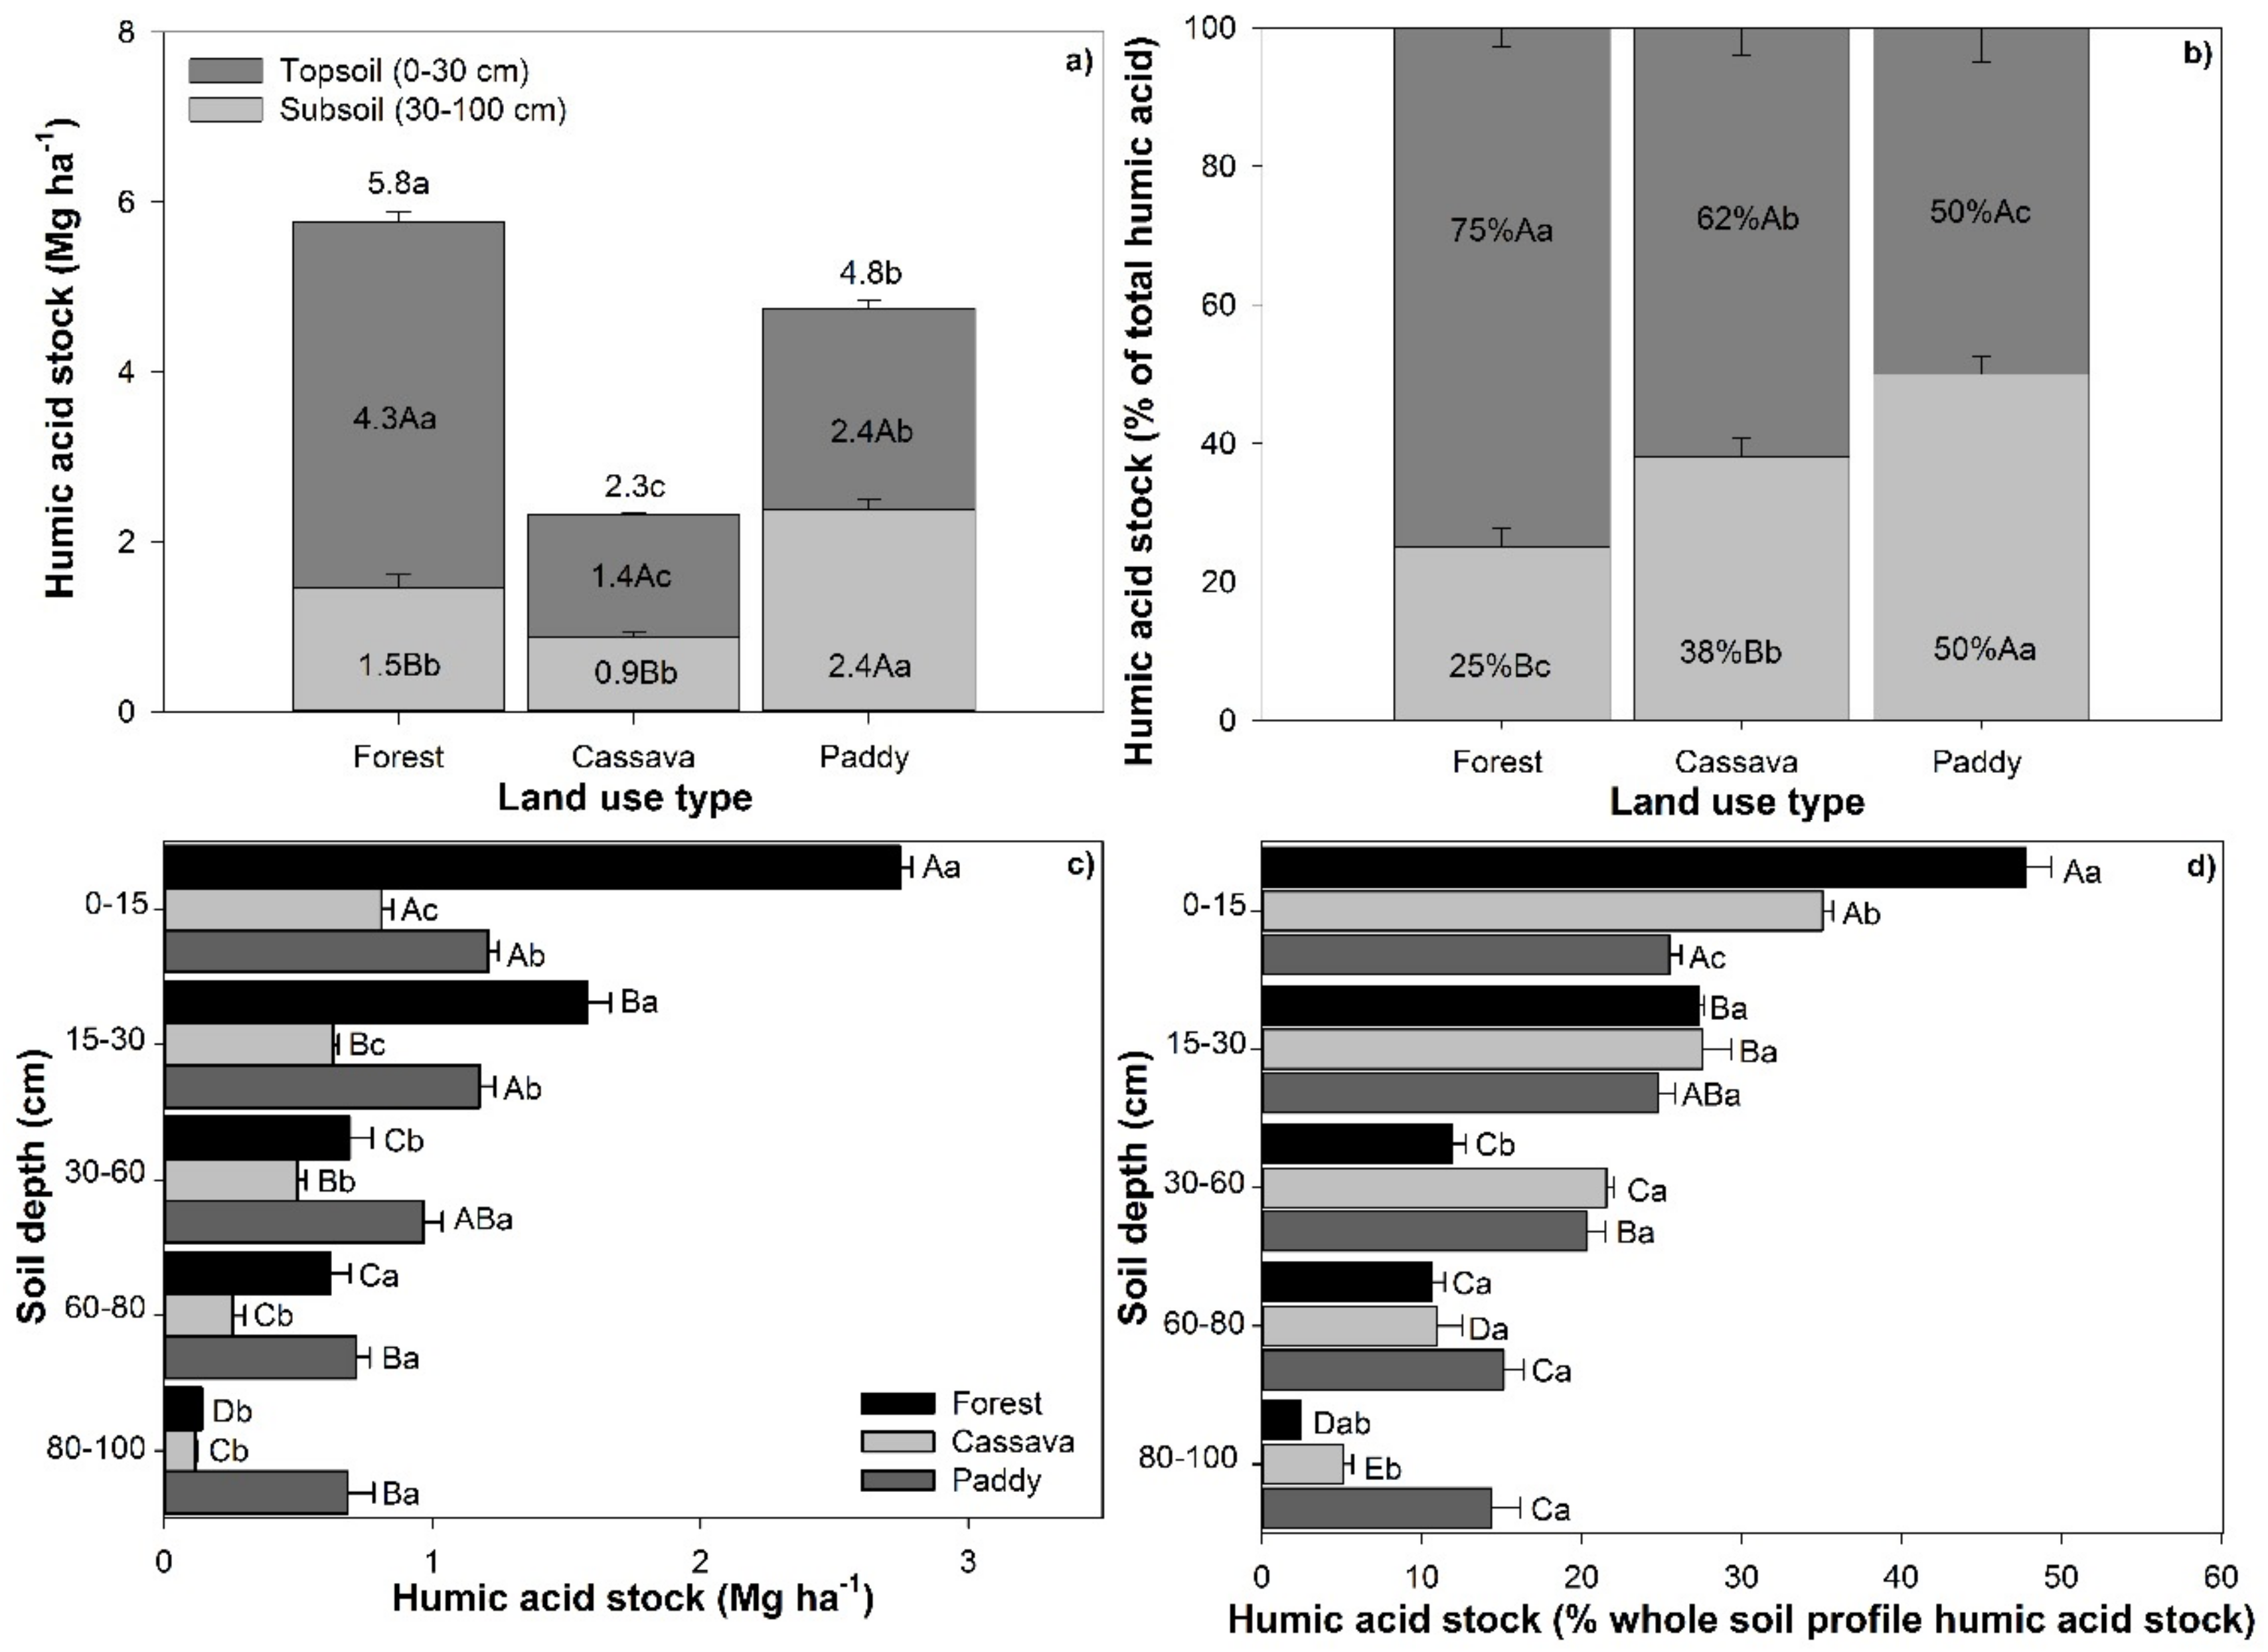
Humic acid stocks, ratios of E4:E6 of humic acids, and C:N were parameters used in this study to reflect chemical composition of SOC under different land uses. Forest topsoil (0–30 cm) had the significantly highest absolute amount of humic acid stocks (4.3 Mg ha−1), followed by paddy (2.4 Mg ha−1) and cassava (1.4 Mg ha−1) topsoils (p < 0.05) (Figure 4a). However, in the subsoil 30–100 cm layer, the paddy soil had significantly higher humic acid stocks (2.4 Mg ha−1) than the forest (1.5 Mg ha−1) and the cassava (0.9 Mg ha−1) (p < 0.05). Humic acid stocks of the whole soil profile (down to 100 cm depth) were significantly higher in the forest soil (5.8 Mg ha−1) than the paddy (4.8 Mg ha−1) and the cassava (2.3 Mg ha−1) soils (Figure 4a). Humic acid stocks in the whole soil profile (0–100 cm) under converted land uses (i.e., paddy and cassava) were reduced by 17–60%, and those in 0–30 cm depth were reduced by 44–67% compared to the forest soil. Comparable findings were reported in a study of humic acid stocks of converted land uses (i.e., citrus, conventional coconut) from native forest in Brazil in which humic acid contents at 0–30 cm soil depth were reduced by 45% in citrus and 28% in coconut [31]. Similarly, a study in Northeast Thailand by Tangtrakarnpong [55] showed that humic acid contents at 0–15 cm depth of a forest soil were higher than cultivated soils (i.e., rice, cassava, and sugarcane). Cassava resulted in a 78% decrease in humic acid content relative to that of the forest, while paddy had a 24% decrease. Humic acids were enhanced in the forest topsoils due to large amounts of fallen leaf litter and the undisturbed condition of the soil surface. These factors led to humic acids formation and accumulation in the upper soil layer. Moreover, humic acids are vital as cementing agents for aggregate formation, especially microaggregates [60], which contribute to stabilization and accumulation of SOC. This was highlighted in the current study, which found that the forest soil had high humic acid contents, leading to enhanced SOC accumulation, especially in the topsoils (0–30 cm). In addition, we also found a highly significant positive correlation between whole SOC and humic acid stocks (r = 0.788 **) in the soil profile (0–100 cm) (Figure 5).
Regarding the relative amount of humic acid stocks in the topsoils, (0–30 cm) in comparison to the subsoils, forest topsoil had the highest relative humic acid stock (75% of the whole soil profile humic acid stocks), followed by cassava (61%) and paddy (50%) (Figure 4b), whereas the forest subsoil (30–100 cm) had the lowest humic acid stock (25% of whole soil profile humic acid stock), while the paddy subsoil had the highest relative humic acid stock (50%). Cassava had intermediate humic acid stock (39%). Accumulation of humic acid in subsoils (30–100 cm) under paddy land use may have been due to downward movement of low molecular weight (MW) dissolved organic matter (DOM) derived from rice straw decomposition. Rice straw has been found to decompose rapidly in an early stage under submerged [63] and aerobic [64] conditions and generated significant amounts of dissolved organic C (DOC), which was leached to subsoil layers [65]. The DOC was used as microbial substrates and transformed into humic acids. Forest soils received lignin rich litter from forest trees—which were conducive to humic substance formation—as opposed to paddy, in which input was low lignin, high cellulose rice straw. Humic acid under forest tended to be persistent in the topsoils as compared to paddy [55].
When considering distribution of humic acid stocks in each soil depth within 0–100 cm, humic acid stocks in absolute and relative terms in all land uses were highest in 0–15 cm soil depth and gradually decreased with depth, as indicated by humic acid stocks of various layers down the soil profile (15–100 cm) (Figure 4c,d). Paddy soil had significantly higher absolute and relative amounts of humic acid in 80–100 cm than cassava and forest soils. We speculated that humic acids in paddy soil were of low MW and low degree of aromaticity. These low MW humic acids are easily leached from topsoils to subsoils during rainy seasons. It was found that, upon decomposition, rice straw produced a large amount of aliphatic C functional group constituents of labile C compounds [66]. These C compounds are soluble and less adsorbed to soil colloidal surfaces than the aromatic C compounds.
A narrow E4:E6 ratio of humic acids indicates more complex molecular structure and degree of polymerization of the humic acids than a wider ratio [27]. This characteristic of humic acids can indicate C stabilization and C cycling in terrestrial ecosystems. In comparing the quality of humic acids of different soil layers down the profile, it was found that humic acid E4:E6 ratios were higher in topsoils (0–30 cm) than subsoils (30–100 cm) (p <0.05) under all land uses (Table 2). On comparing E4:E6 ratios among different land uses, only the ratio in 15–30 cm under paddy was significantly higher (3.37) than those under forest (2.56) and cassava (2.85) topsoils (p < 0.05).
The ratio of soil C:N exhibited lower values with increasing soil depth (Table 3). The ratio of C:N in various soil layers tended to be higher in 0–60 cm layers than in 60–100 cm layers under all land uses. When considering the ratio at different depths throughout soil profiles of each land use type, only the C:N ratio under the forest exhibited significant differences among soil layers, i.e., it was significantly higher in 0–60 cm than in 60–100 cm (p < 0.01).
Humic acid E4:E6 ratios were found to be higher in cultivated soils than those in forest soil, which supported those reported in the literature such as Reddy et al. [67] and Martin et al. [68]. Humic acids in the forest topsoil, which contained inputs from newly fallen leaf litter, had a lower degree of humification, as indicated by the higher E4:E6 ratio of humic acids and a wider C:N ratio than the subsoils, which did not have fresh inputs of organic materials. These results were compatible with those of a study in temperate peat–marsh soils in Poland, which showed that the E4:E6 ratio of humic acids in topsoil (5–10 cm) was higher than in subsoils (50–70 cm) [69]. In agricultural soils, soil disturbances pertaining to cultivation, such as soil tillage, may have interrupted humification processes, since we found higher E4:E6 ratios of humic acids and C:N ratios in topsoils than subsoils under both cassava and paddy land uses. Accumulated SOC in paddy soil was not developed to an advanced stage along the humification process, as evidenced by a higher E4:E6 ratio of humic acids than those from the other two land uses (Table 2). Rice straw and stubble remaining in the fields after the rice harvest have high cellulose contents that, upon decomposition, released a large amount of low MW DOC, leading to a buildup of new labile SOC with a smaller degree of aromaticity. Kunlanit et al. [66] reported that decomposition of rice straw was rapid and produced high amounts of aliphatic C constituents. The cassava soil in this study had SOM, which had a higher degree of polymerization, as indicated by lower values of the E4:E6 ratio of humic acids than in the paddy soil. Cassava cultivation returns lower amounts of residues to soil and involves less soil disturbance by agricultural practices than paddy cultivation. In addition, land use change from forest to cassava cultivation in this study had taken place for shorter time (five years) than that of the paddy (over 10 years). These results were similar to those of Tangtrakarnpong [55], who studied the effects of land use change from forest to agricultural land in Northeast Thailand and found that paddy soil had a higher E4:E6 ratio of humic acids than cassava and forest lands.
Our results showed that the C:N ratios of the whole soil profiles for the three land uses were similar, although some other researchers have reported that C:N ratios of cultivated soils were lower than those of forest soil due to lower C:N ratios of crop residue inputs and microbial decomposers in the subsoils [14]. A few studies found that land–use changes from natural grassland to cropland did not alter soil C:N ratios [70,71]. In the current study, we found trends of C:N ratio decreasing with soil depth in all land uses. This was similar to the findings of Gao et al. [72], who also found that the C:N ratio declined as soil depth increased. The pattern of C:N ratios decreasing with soil depth paralleled that of the increased degree of humifcation indicated by the decreases in the E4:E6 ratios in all land uses. This pattern yielded a significant correlation (r = 0.423 *) (data not shown) between C:N ratio and E4:E6 ratio, which showed that the C:N ratios decreased with an increased degree of humification. The results of decreasing E4:E6 ratio and C:N ratio with soil depth serve to show that subsoils have more humified SOC than topsoils. These more humified SOCs are more stable, which should contribute to C sequestration in the long term.
This study found that conversion of natural forest to agricultural land led to lower soil fertility as a consequence of reducing SOC accumulation in the agricultural lands. Thus, restorative agricultural practices such as maximizing the return of crop residues and minimizing soil disturbances are recommended to achieve increased soil productivity and SOC sequestration.
4. Conclusions
Our results show that degraded course-textured agricultural soils in Northeast Thailand have considerable potential to be a sink for atmospheric C. The degraded soils under agricultural land uses have greater potential to sequester additional C than the soil under natural forest due to their decreased SOC stocks in their overall soil profiles (0–100 cm). The decreased SOC sequestration in agricultural soils frees up locations in the soil matrix that can stabilize newly formed humic substances. Although the largest share of SOC was found in the topsoil (0–30 cm), we found that the subsoil (30–100 cm) accounted for an average of 30% of the total amount of C in the whole profiles in all land uses (natural forest and agricultural land uses) in our study. Based on this finding, we suggest that estimates of the C sequestration potential of soils should be based on data on the amount of SOC in the soil profile down to 100 cm depth rather than only in the topsoil (0–30 cm), as is the current practice.
Our study also found that soils under different land uses varied in the quantity and the quality of SOC they contained. Cassava land use caused severe land degradation, as indicated by its reduced stocks of SOC and stabilized C (humic acid) compared to those of the original forest, whereas paddy land use did not bring about severe decreases in SOC and stabilized C stock relative to the original forest. However, the quality of paddy’s sequestered SOC was lower than that of the original forest, as seen in the low degree of SOC humification and, hence, its low degree of stabilization. Quality, in addition to quantity of SOC, indicates the potential of soil for C sequestration. The C in subsoils (30–100 cm) was found to be of higher quality than that in topsoil (0–30 cm) for SOC sequestration due to the former’s higher degree of humifcation, indicating higher C stabilization.
Therefore, this study conclusively showed that agricultural land uses have degraded SOC both in quantity and quality compared to the original natural forest. However, the cassava land use caused more severe degradation than the paddy land use. Restorative agricultural practices such as return of crop residues and minimization of soil disturbances are recommended to achieve increased soil productivity and SOC sequestration.
Author Contributions
B.K. conceived and designed the experiment as well as wrote the first draft of the paper. P.V. gave advice on design and data analysis and co–wrote the revised version of the paper. S.B. gave comments on the revised version of the paper. All authors have read and approved the final manuscript.
Funding
This research was financially supported by Mahasarakham University 2016, and the Soil Organic Matter Management Research Group, Khon Kaen University.
Acknowledgments
We thank the reviewers for the constructive comments given to our work. Editorial assistance as well as constructive comments to the later version of the manuscript provided by A. Terry Rambo is highly appreciated.
Conflicts of Interest
The authors declare that they have no conflict of interest.
References
- Torn, M.S.; Swanston, C.W.; Castanha, C.; Trumbore, S.E. Storage and turnover of organic matter in soil. In Biophysico–Chemical Processes Involving Natural Nonliving Organic Matter in Environmental Systems; John Wiley & Sons Inc.: Hoboken, NJ, USA, 2009; pp. 219–272. [Google Scholar]
- IPCC. IPCC Special Report on Land Use, Land–Use Change and Forestry; Cambridge University Press: Cambridge, UK, 2007; p. 375. [Google Scholar]
- Van der Werf, G.R.; Morton, D.C.; De Fries, R.S.; Olivier, J.G.J.; Kasibhatla, P.S.; Jackson, R.B.; Collatzg, G.J.; Randerson, J.T. CO2 emission from forest loss. Nat. Geosci. 2009, 2, 737–738. [Google Scholar] [CrossRef]
- FAO. FAO Forestry Paper; FAO: Rome, Italy, 2006; p. 147. [Google Scholar]
- Don, A.; Schumacher, J.; Freibauer, A. Impact of tropical land–use change on soil organic carbon stocks—a meta–analysis. Glob. Chang. Biol. 2011, 17, 1658–1670. [Google Scholar] [CrossRef]
- Barančíková, G.; Makovníková, J.; Halas, J. Effect of land use change on soil organic carbon. Agriculture 2016, 62, 10–18. [Google Scholar] [CrossRef]
- Aalde, H.; Gonzalez, P.; Gytarsky, M.; Krug, T.; Kurz, W.A.; Lasco, R.D.; Martino, D.L.; McConkey, B.G.; Ogle, S.; Paustian, K.; et al. Generic methodologies applicable to multiple land–use categories. In IPCC Guidelines for National Greenhouse Gas Inventories; Eggleston, S., Buendia, L., Miwa, K., Ngara, T., Tanabe, K., Eds.; Agriculture, Forestry and Other Land Use; IGES: Kanagawa, Japan, 2006; Volume 4. [Google Scholar]
- Batjes, N.H. Total carbon and nitrogen in the soils of the world. Eur. J. Soil Sci. 1996, 47, 151–163. [Google Scholar] [CrossRef]
- Rittl, T.F.; Oliveira, D.; Cerri, C.E.P. Soil carbon stock changes under different land uses in the Amazon. Geoderma Reg. 2017, 10, 138–143. [Google Scholar] [CrossRef]
- Bonfatti, B.R.; Hartemink, A.E.; Giasson, E.; Tornquist, C.G.; Adhikari, K. Digital mapping of soil carbon in a viticultural region of Southern Brazil. Geoderma 2016, 261, 204–221. [Google Scholar] [CrossRef]
- Callesen, I.; Harrison, R.; Stupak, I.; Hatten, J.; Raulund–Rasmussen, K.; Boyle, J.; Clarke, N.; Zabowski, D. Carbon storage and nutrient mobilization from soil minerals by deep roots and rhizospheres. Forest Ecol. Manag. 2016, 359, 322–331. [Google Scholar] [CrossRef]
- Lal, R. Digging deeper: A holistic perspective of factors affecting soil organic carbon sequestration in agroecosystems. Glob. Chang. Biol. 2018, 24, 3285–3301. [Google Scholar] [CrossRef]
- Guo, L.; Gifford, R. Soil carbon stocks and land use change: A meta analysis. Glob. Chang. Biol. 2002, 8, 345–360. [Google Scholar] [CrossRef]
- Murty, D.; Kirschbaum, M.U.; McMurtrie, R.E.; McGilvray, H. Does conversion of forest to agricultural land change soil carbon and nitrogen? A review of the literature. Glob. Chang. Biol. 2002, 8, 105–123. [Google Scholar] [CrossRef]
- Wei, X.; Shao, M.; Gale, W.; Li, L. Global pattern of soil carbon losses due to the conversion of forests to agricultural land. Sci. Rep. 2014, 4, 4062. [Google Scholar] [CrossRef]
- Gregory, A.S.; Dungait, J.A.J.; Watts, C.W.; Bol, R.; Dixon, E.R.; White, R.P.; Whitmore, A.P. Long-term management changes topsoil and subsoil organic carbon and nitrogen dynamics in a temperate agricultural system. Eur. J. Soil Sci. 2016, 67, 421–430. [Google Scholar] [CrossRef]
- Strey, S.; Boy, J.; Strey, R.; Weber, O.; Guggenberger, G. Response of soil organic carbon to land-use change in central Brazil: A large-scale comparison of Ferralsols and Acrisols. Plant Soil 2016, 408, 327–342. [Google Scholar] [CrossRef]
- Buringh, P. Organic carbon in soils of the world. In The Role of Terrestrial Vegetation in the Global Carbon Cycle: Measurement by Remote Sensing; Woodwell, G.M., Ed.; John Wiley and Sons: New York, NY, USA, 1984; pp. 91–109. [Google Scholar]
- Six, J.; Conant, R.T.; Paul, E.A.; Paustian, K. Stabilization mechanisms of soil organic matter: Implications for C saturation of soils. Plant Soil 2002, 241, 155–176. [Google Scholar] [CrossRef]
- Krull, E.S.; Baldock, J.A.; Skjemstad, J.O. Importance of mechanisms and processes of the stabilisation of soil organic matter for modelling carbon turnover. Funct. Plant Biol. 2003, 30, 207–222. [Google Scholar] [CrossRef]
- Feller, C.; Beare, M.H. Physical control of soil organic matter dynamics in the Tropics. Geoderma 1997, 79, 69–116. [Google Scholar] [CrossRef]
- Plante, A.F.; Conant, R.T.; Stewart, C.E.; Paustian, K.; Six, J. Impact of soil texture on the distribution of soil organic matter in physical and chemical fractions. Soil Sci. Soc. Am. J. 2006, 70, 287–296. [Google Scholar] [CrossRef]
- Kunlanit, B. Decomposition of Biochemically Contrasting Organic Residues Regulating Dissolved Organic Carbon Dynamics and Soil Organic Carbon Composition in a Sandy Soil; Graduate School, Khon Kaen University: Khon Kaen, Thailand, 2014; p. 166. [Google Scholar]
- Vicente, L.C.; Gama-Rodrigues, E.F.; Gama–Rodrigues, A.C. Soil carbon stocks of Ultisols under different land use in the Atlantic rainforest zone of Brazil. Geoderma Reg. 2016, 7, 330–337. [Google Scholar] [CrossRef]
- Stevenson, F.J. Humus Chemistry: Genesis, Composition, Reactions; John Wiley: New York, NY, USA, 1994; p. 512. [Google Scholar]
- Huang, P.M. Soil mineral-organic matter microorganisms interactions: Fundamentals and impacts. Adv. Agron. 2004, 82, 391–472. [Google Scholar]
- Aranda, V.; Ayora-Cañada, M.J.; Domínguez-Vidal, A.; Martín-García, J.M.; Calero, J.; Delgado, R.; Verdejo, T.; González-Vila, F.J. Effect of soil type and management (organic vs. conventional) on soil organic matter quality in olive groves in a semi-arid environment in Sierra Mágina Natural Park (S Spain). Geoderma 2011, 164, 54–63. [Google Scholar] [CrossRef]
- Senesi, N.; D’Orazio, V.; Ricca, G. Humic acids in the first generation of Eurosoils. Geoderma 2003, 116, 325–344. [Google Scholar] [CrossRef]
- Spaccini, R.; Piccolo, A.; Haberhauer, G.; Gerzabek, M. Transformation of organic matter from maize residues into labile and humic fractions of three European soils as revealed by 13C distribution and CPMAS-NMR spectra. Eur. J. Soil Sci. 2006, 51, 583–594. [Google Scholar] [CrossRef]
- González-Pérez, M.; Milori, D.M.B.P.; Colnago, L.A.; Martin-Neto, L.; Melo, W.J.A. Laser-induced fluorescence spectroscopic study of organic matter in a Brazilian Oxisol under different tillage systems. Geoderma 2007, 138, 20–24. [Google Scholar] [CrossRef]
- Guimaraes, D.V.; Isidoria, M.; Gonzaga, S.; da Silva, T.O.; da Silva, T.L.; da Silva Dias, N.; Silva Matias, M.I. Soil organic matter pools and carbon fractions in soil under different land uses. Soil Tillage Res. 2013, 126, 177–182. [Google Scholar] [CrossRef] [Green Version]
- Post, W.M.; Pastor, J.; Zinke, P.J.; Stangenberger, A.G. Global patterns of soil nitrogen storage. Nature 1985, 317, 613–616. [Google Scholar] [CrossRef]
- Yang, Y.H.; Fang, J.Y.; Guo, D.L.; Ji, C.J.; Ma, W.H. Vertical patterns of soil carbon, nitrogen and carbon: Nitrogen stoichiometry in Tibetan grasslands. Biogeosci. Discuss. 2010, 7, 1–24. [Google Scholar] [CrossRef]
- Lawrence, C.R.; Harden, J.W.; Xu, X.; Schulz, M.S.; Trumbore, S.E. Long–term controls on soil organic carbon with depth and time: A case study from the Cowlitz River Chronosequence, WA USA. Geoderma 2015, 247, 73–87. [Google Scholar] [CrossRef]
- Chandler, R.D. Soil Organic Carbon Distribution with Depth: Implications for Ecosystem Services. Master’s Thesis, Graduate School, Clemson University, Clemson, SC, USA, 2016; p. 48. [Google Scholar]
- Marty, C.; Houle, D.; Gagnon, C.; Courchesne, F. The relationships of soil total nitrogen concentrations, pools and C:N ratios with climate, vegetation types and nitrate deposition in temperate and boreal forests of eastern Canada. Catena 2017, 152, 163–172. [Google Scholar] [CrossRef]
- Tangtrakarnpong, S.; Vityakon, P. Land use and soil organic matter in Northeast Thailand: Microbial biomass, humic acid and mineral N. Symposium 5. In Transactions of the 17th World Congress of Soil Science; IUSS: Bangkok, Thailand, 2002; pp. 1–15. [Google Scholar]
- Lichaikul, N.; Chidthaisong, A.; Havey, N.W.; Wachrinra, C. Carbon stock and net CO2 emission in tropical upland soils under different land use. Kasetsart J. (Nat. Sci.) 2006, 40, 382–394. [Google Scholar]
- Bridhikitti, A. Soil and biomass carbon stocks in forest and agricultural lands in tropical climates. Songklanakarin J. Sci. Technol. 2017, 39, 697–707. [Google Scholar]
- Soil Survey Staff. Keys to Soil Taxonomy, 12th ed.; USDA–Natural Resources Conservation Service: Washington, DC, USA, 2014; p. 372.
- Chen, D.; Chen, H.W. Using the Köppen classification to quantify climate variation and change: An example for 1901–2010. Environ. Dev. 2013, 6, 69–79. [Google Scholar] [CrossRef]
- Dewis, J.; Freitas, F. Physical and Chemical Methods of Soil and Water Analysis; FAO Soils Bulletin 10; FAO: Rome, Italy, 1970; p. 275. [Google Scholar]
- Blake, G.R. Bulk Density in Methods of Soil Analysis; Black, C.A., Ed.; Agronomy, No. 9, Part 11; American Society of Agronomy: Madison, WI, USA, 1965; pp. 374–390. [Google Scholar]
- Black, C.A. Methods of Soil Analysis: Part I Physical and Mineralogical Properties; American Society of Agronomy: Madison, WI, USA, 1965. [Google Scholar]
- Rayment, G.E.; Higginson, F.R. Australian Soil and Land Survey Handbook, Australian Laboratory Handbook of Soil and Water Chemical Methods; Inkata Press: Melbourne, Australia, 1992; pp. 38–41. [Google Scholar]
- Swift, R.S. Organic matter characterization. In Methods of Soil Analysis. Part 3. Chemical Methods; Sparks, D.L., Page, A.L., Helmke, P.A., Loeppert, R.H., Soltanpour, P.N., Johnston, C.T., Sumner, M.E., Eds.; Soil Sci. Soc. Am. Book Series: 5; Soil Science Society of America, Inc.: Madison, WI, USA, 1996; pp. 1018–1020. [Google Scholar]
- Tan, K.H. Humic Matter in Soil and the Environment, Principles and Controversies; Marcel Dekker: Madison, WI, USA, 2003; pp. 1018–1020. [Google Scholar]
- Chen, Y.; Senesi, N.; Schnitzer, M. Information provided on humic substances by E4/E6 ratios. Soil Sci. Soc. Am. J. 1977, 41, 352–358. [Google Scholar] [CrossRef]
- Ellert, B.H.; Bettany, J.R. Calculation of organic matter and nutrients stored in soils under contrasting management regimes. Can. J. Soil Sci. 1995, 75, 529–538. [Google Scholar] [CrossRef] [Green Version]
- Ahmad, A.; Nizami, S.M. Carbon stocks of different land uses in the Kumrat valley, Hindu Kush Region of Pakistan. J. For. Res. 2015, 26, 57–64. [Google Scholar] [CrossRef]
- Strey, S.; Boy, J.; Strey, R.; Welpelo, A.; Schönenberg, R.; Schumann, C.; Guggenberger, G. Digging deeper: The value of deep soil carbon for potential REDD+ projects in tropical forest communities in Amazonia. Erdkunde 2017, 71, 231–239. [Google Scholar] [CrossRef]
- Lal, R. Carbon sequestration in soils of central Asia. Land Degrad. Dev. 2004, 15, 563–572. [Google Scholar] [CrossRef]
- Emiru, N.; Gebrekidan, H. Effect of land use changes and soil depth on soil organic matter, total nitrogen and available phosphorus contents of soils in Senbat watershed, Western Ethiopia. ARPN J. Agric. Biol. Sci. 2013, 8, 206–212. [Google Scholar]
- Han, X.; Gao, G.; Chang, R.; Li, Z.; Ma, Y.; Wang, S.; Wang, C.; Lü, Y.; Fu, B. Changes in soil organic and inorganic carbon stocks in deep profiles following cropland abandonment along a precipitation gradient across the Loess Plateau of China. Agric. Ecosyst. Environ. 2018, 258, 1–13. [Google Scholar] [CrossRef]
- Thantrakarnpong, S. Changes of Different Pools of Soil Organic Matter under Different Land Use Systems in Undulating Terrain of Northeast Thailand. Master’s Thesis, Graduate School, Khon Kaen University, Khon Kaen, Thailand, 2002; p. 171, (In Thai with English Abstract). [Google Scholar]
- Dhakal, S.; Koirala, M.; Sharma, E.; Subedi, N.J. Effect of land use change on soil organic carbon stock in Balkhu Khola watershed southwestern part of Kathmandu valley, central Nepal. World Acad. Sci. Eng. Technol. 2010, 66, 581–591. [Google Scholar]
- Gebremariam, M.; Kebede, F. Land use change effect on soil carbon stock, aboveground biomass, aggregate stability and soil crust: A case from Tahtay Adyabo, north western Tigray, northern Ethiopia. J. Drylands 2010, 2, 220–225. [Google Scholar]
- Solomon, D.; Fritzsche, F.; Tekalign, M.; Lehmann, J.; Zech, W. Soil organic matter composition in the subhumid Ethiopian highlands as influenced by deforestation and agricultural management. Soil Sci. Soc. Am. J. 2002, 66, 68–82. [Google Scholar] [CrossRef]
- Xu, H.; Sieverding, H.; Kwon, H.; Clay, D.; Stewart, C.; Johnson, J.M.F.; Qin, Z.; Karlen, D.L.; Wang, M. A global meta-analysis of soil organic carbon response to corn stover removal. GCB Bioenergy 2019. [Google Scholar] [CrossRef]
- Franzluebbers, A.J. Soil organic matter stratification ratio as an indicator of soil quality. Soil Tillage Res. 2002, 66, 95–106. [Google Scholar] [CrossRef]
- Lorenz, K.; Lal, R.; Shipitalo, M.J. Chemical stabilization of organic carbon pools in particle size fractions in no–till and meadow soils. Biol. Fertil. Soils 2008, 44, 1043–1051. [Google Scholar] [CrossRef]
- Meurer, K.H.E.; Haddaway, N.R.; Bolinder, M.A.; Kätterer, T. Tillage intensity affects total SOC stocks in boreo–temperate regions only in the topsoil—A systematic review using an ESM approach. Earth Sci. Rev. 2018, 177, 613–622. [Google Scholar] [CrossRef]
- Katoh, M.; Murase, J.; Sugimoto, A.; Kimura, M. Effect of rice straw amendment on dissolved organic and inorganic carbon and cationic nutrients in percolating water from a flooded paddy soil: A microcosm experiment using 13C–enriched rice straw. Org. Geochem. 2005, 362, 803–811. [Google Scholar] [CrossRef]
- Puttaso, A.; Vityakon, P.; Saenjan, P.; Trelo-Ges, V.; Cadisch, G. Relationship between residue quality, decomposition patterns, and soil organic matter accumulation in a tropical sandy soil after 13 years. Nutr. Cycl. Agroecosyst. 2011, 89, 159–174. [Google Scholar] [CrossRef]
- Kimura, M.; Miura, Y.; Watanabe, A.; Murase, J.; Kuwatsuka, S. Methane production and its fate in paddy fields. J. Soil Sci. Plant Nutr. 1992, 38, 665–672. [Google Scholar] [CrossRef]
- Kunlanit, B.; Vityakon, P.; Puttaso, A.; Cadisch, G.; Rasche, F. Mechanisms controlling soil organic carbon composition pertaining to microbial decomposition of biochemically contrasting organic residues: Evidence from midDRIFTS peak area analysis. Soil Biol. Biochem. 2014, 76, 100–108. [Google Scholar] [CrossRef]
- Reddy, H.; Nagaraja, M.S.; Punith Raj, T.S.; Police Patil, A.S.; Dhumgond, P. Elemental analysis, E4/E6 ratio and total acidity of soil humic and fulvic acids from different land use systems. Ann. Plant Soil Res. 2014, 16, 89–92. [Google Scholar]
- Martin, D.; Srivastava, P.C.; Ghosh, D.; Zech, W. Characteristics of humic substances in cultivated and natural forest soils of Sikkim. Geoderma 1998, 84, 345–362. [Google Scholar] [CrossRef]
- Szajdak, L.; Brandyk, T.; Szatylowicz, J. Chemical properties of different peat–marsh soils from the Biebrza River Valley. Agron. Res. 2007, 5, 165–174. [Google Scholar]
- Ding, F.; Hu, Y.L.; Li, L.J.; Li, A.; Shi, S.; Lian, P.Y.; Zeng, D.H. Changes in soil organic carbon and total nitrogen stocks after conversion of meadow to cropland in Northeast China. Plant Soil 2013, 373, 659–672. [Google Scholar] [CrossRef]
- Xu, X.; Li, D.; Cheng, X.; Ruan, H.; Luo, Y. Carbon: Nitrogen stoichiometry following afforestation: A global synthesis. Sci. Rep. 2016, 6, 19117. [Google Scholar] [CrossRef]
- Gao, Y.; He, N.; Yu, G.; Chen, W.; Wang, Q. Long–term effects of different land use types on C, N, and P stoichiometry and storage in subtropical ecosystems: A case study in China. Ecol. Eng. 2014, 67, 171–181. [Google Scholar] [CrossRef]
Figure 1.
Location of soil sampling sites in Maha Sarakham province in Northeast Thailand.
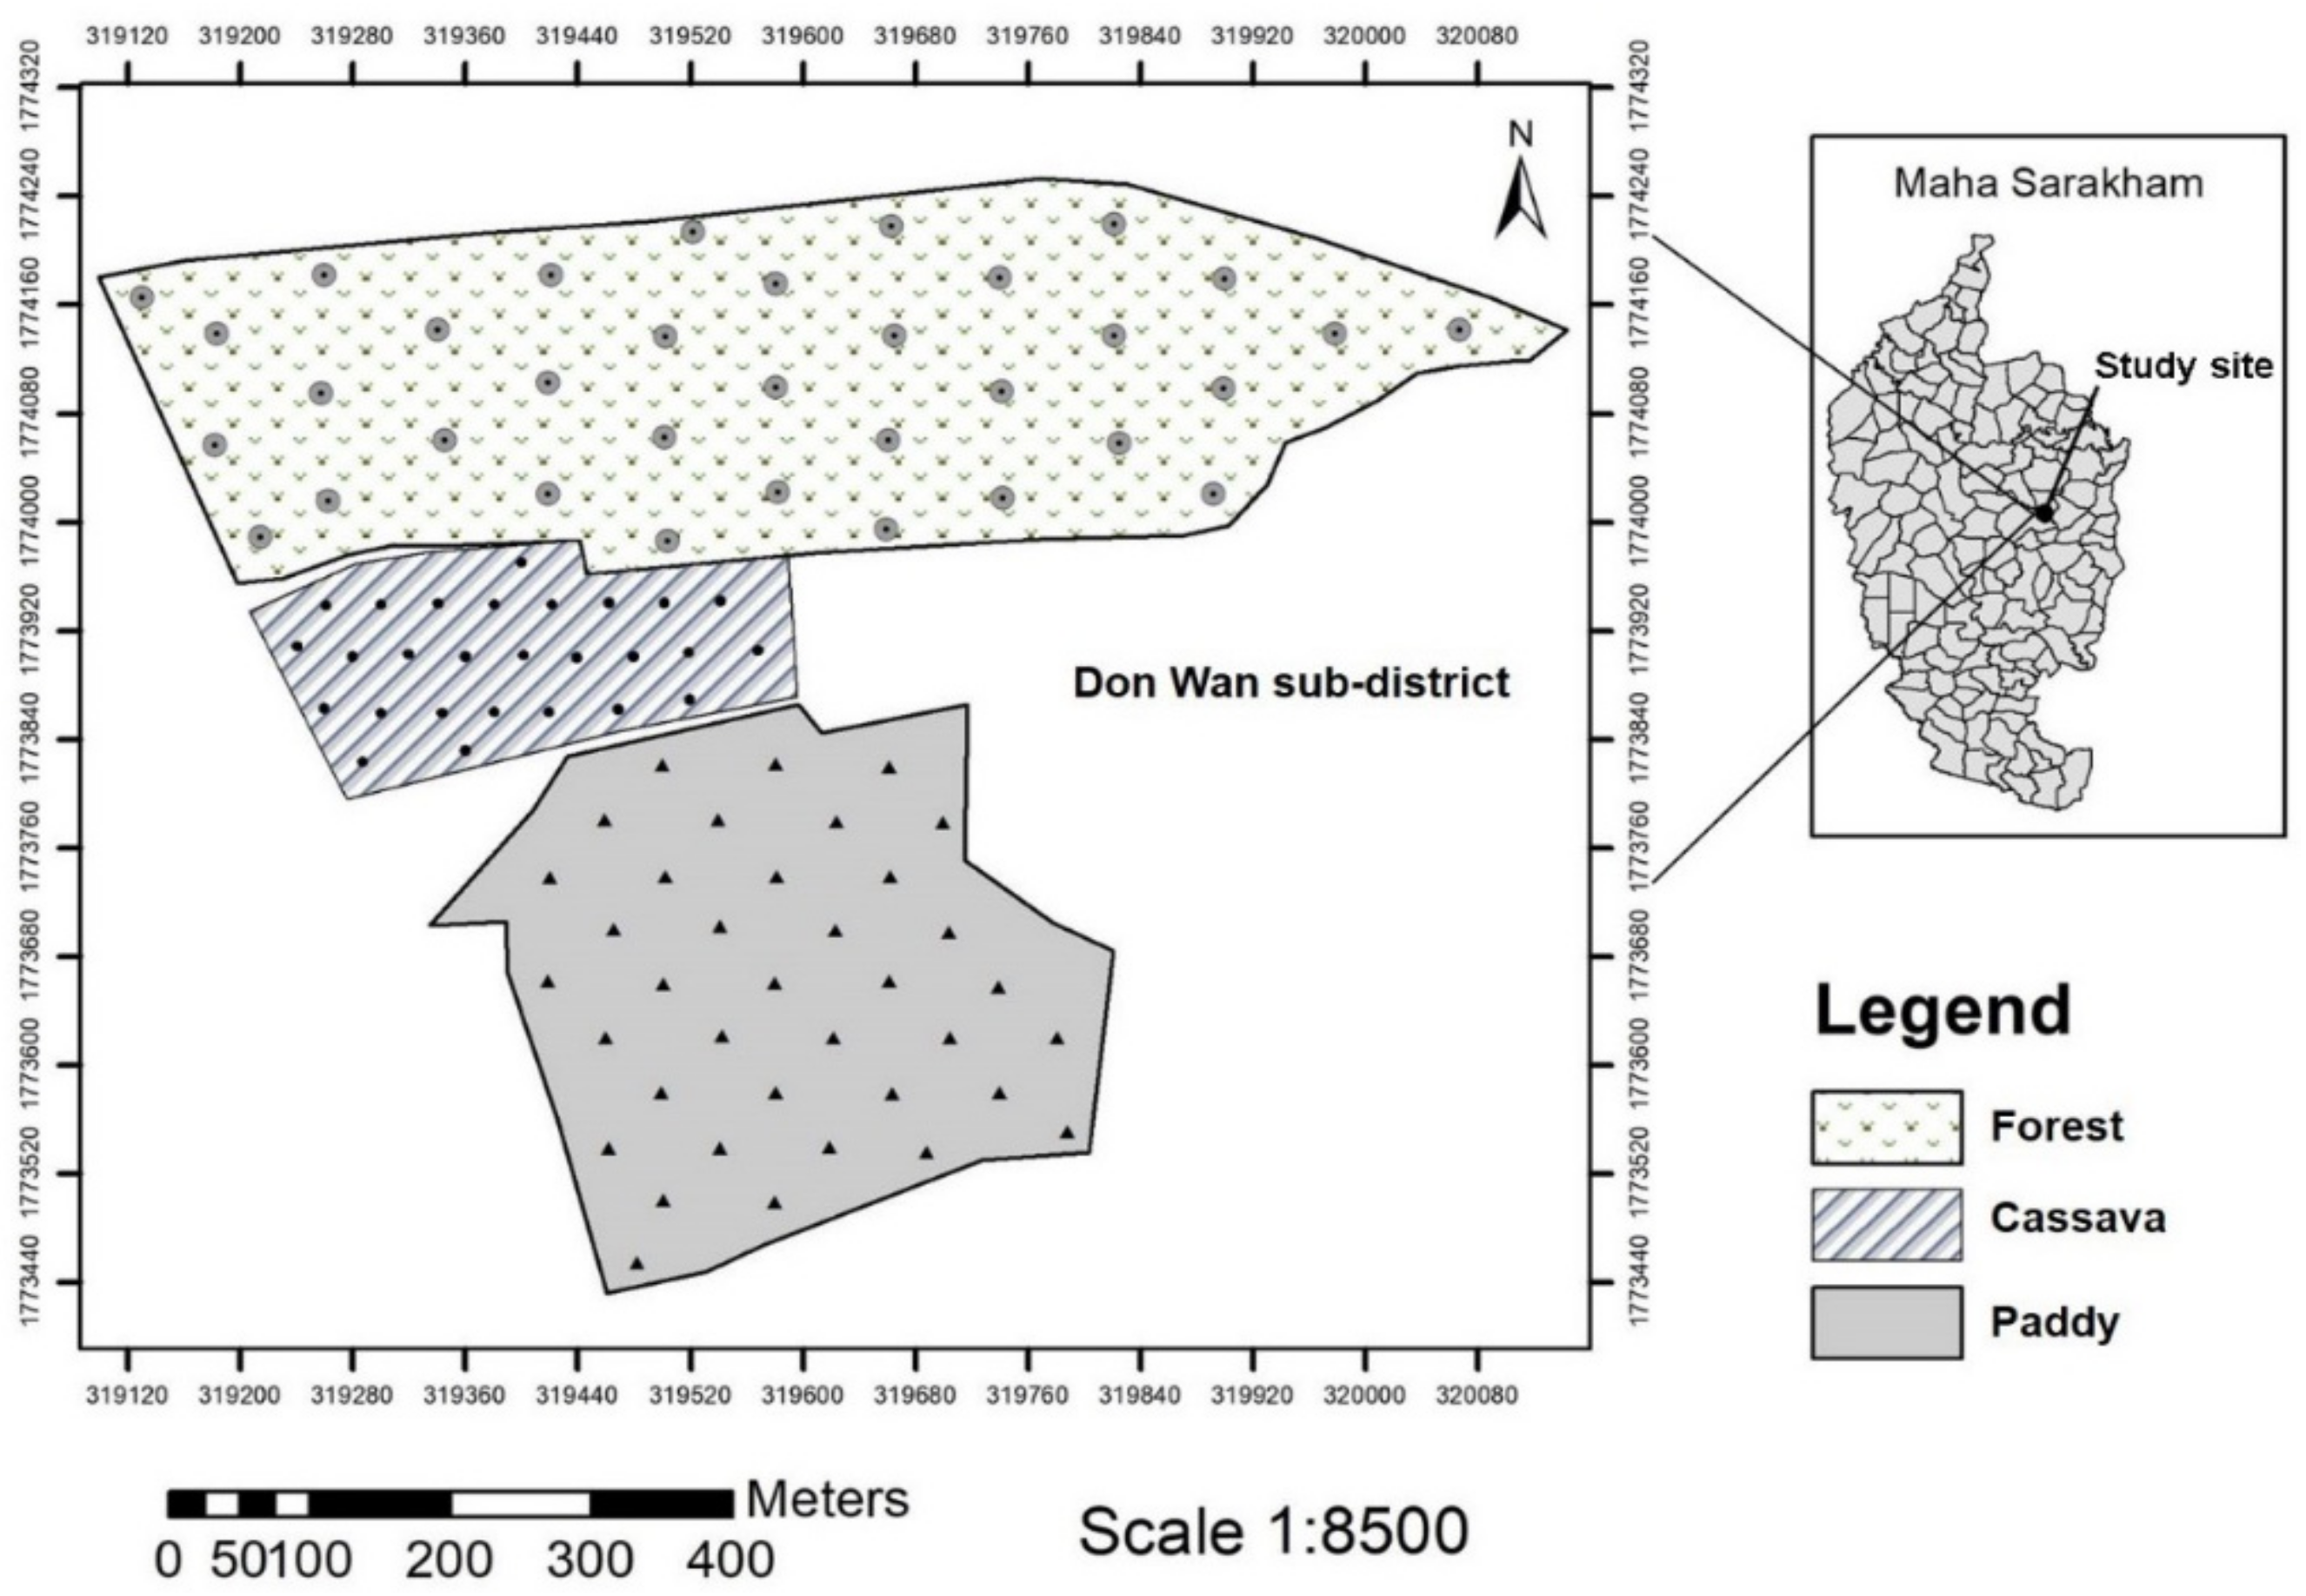
Figure 2.
Average rainfall (mm) and temperature (°C) of the study site during July 2015–June 2016.

Figure 3.
Land use changes affecting soil organic carbon (SOC) stocks in soil profile: (a) whole SOC stocks (Mg ha−1), (b) whole SOC stocks (percentage of total SOC), (c) distribution of SOC stocks (Mg ha−1), and (d) distribution of SOC stocks (percentage of total SOC). Uppercase letters accompanying bar graphs denote comparisons of SOC stocks among different soil depths in the same land use type, and lowercase letters denote comparisons of those of different land uses at each soil depth. Similar letters indicate no significant differences (p > 0.05), as analyzed by the least significant difference (LSD) method. Error bars represent standard error of the mean.
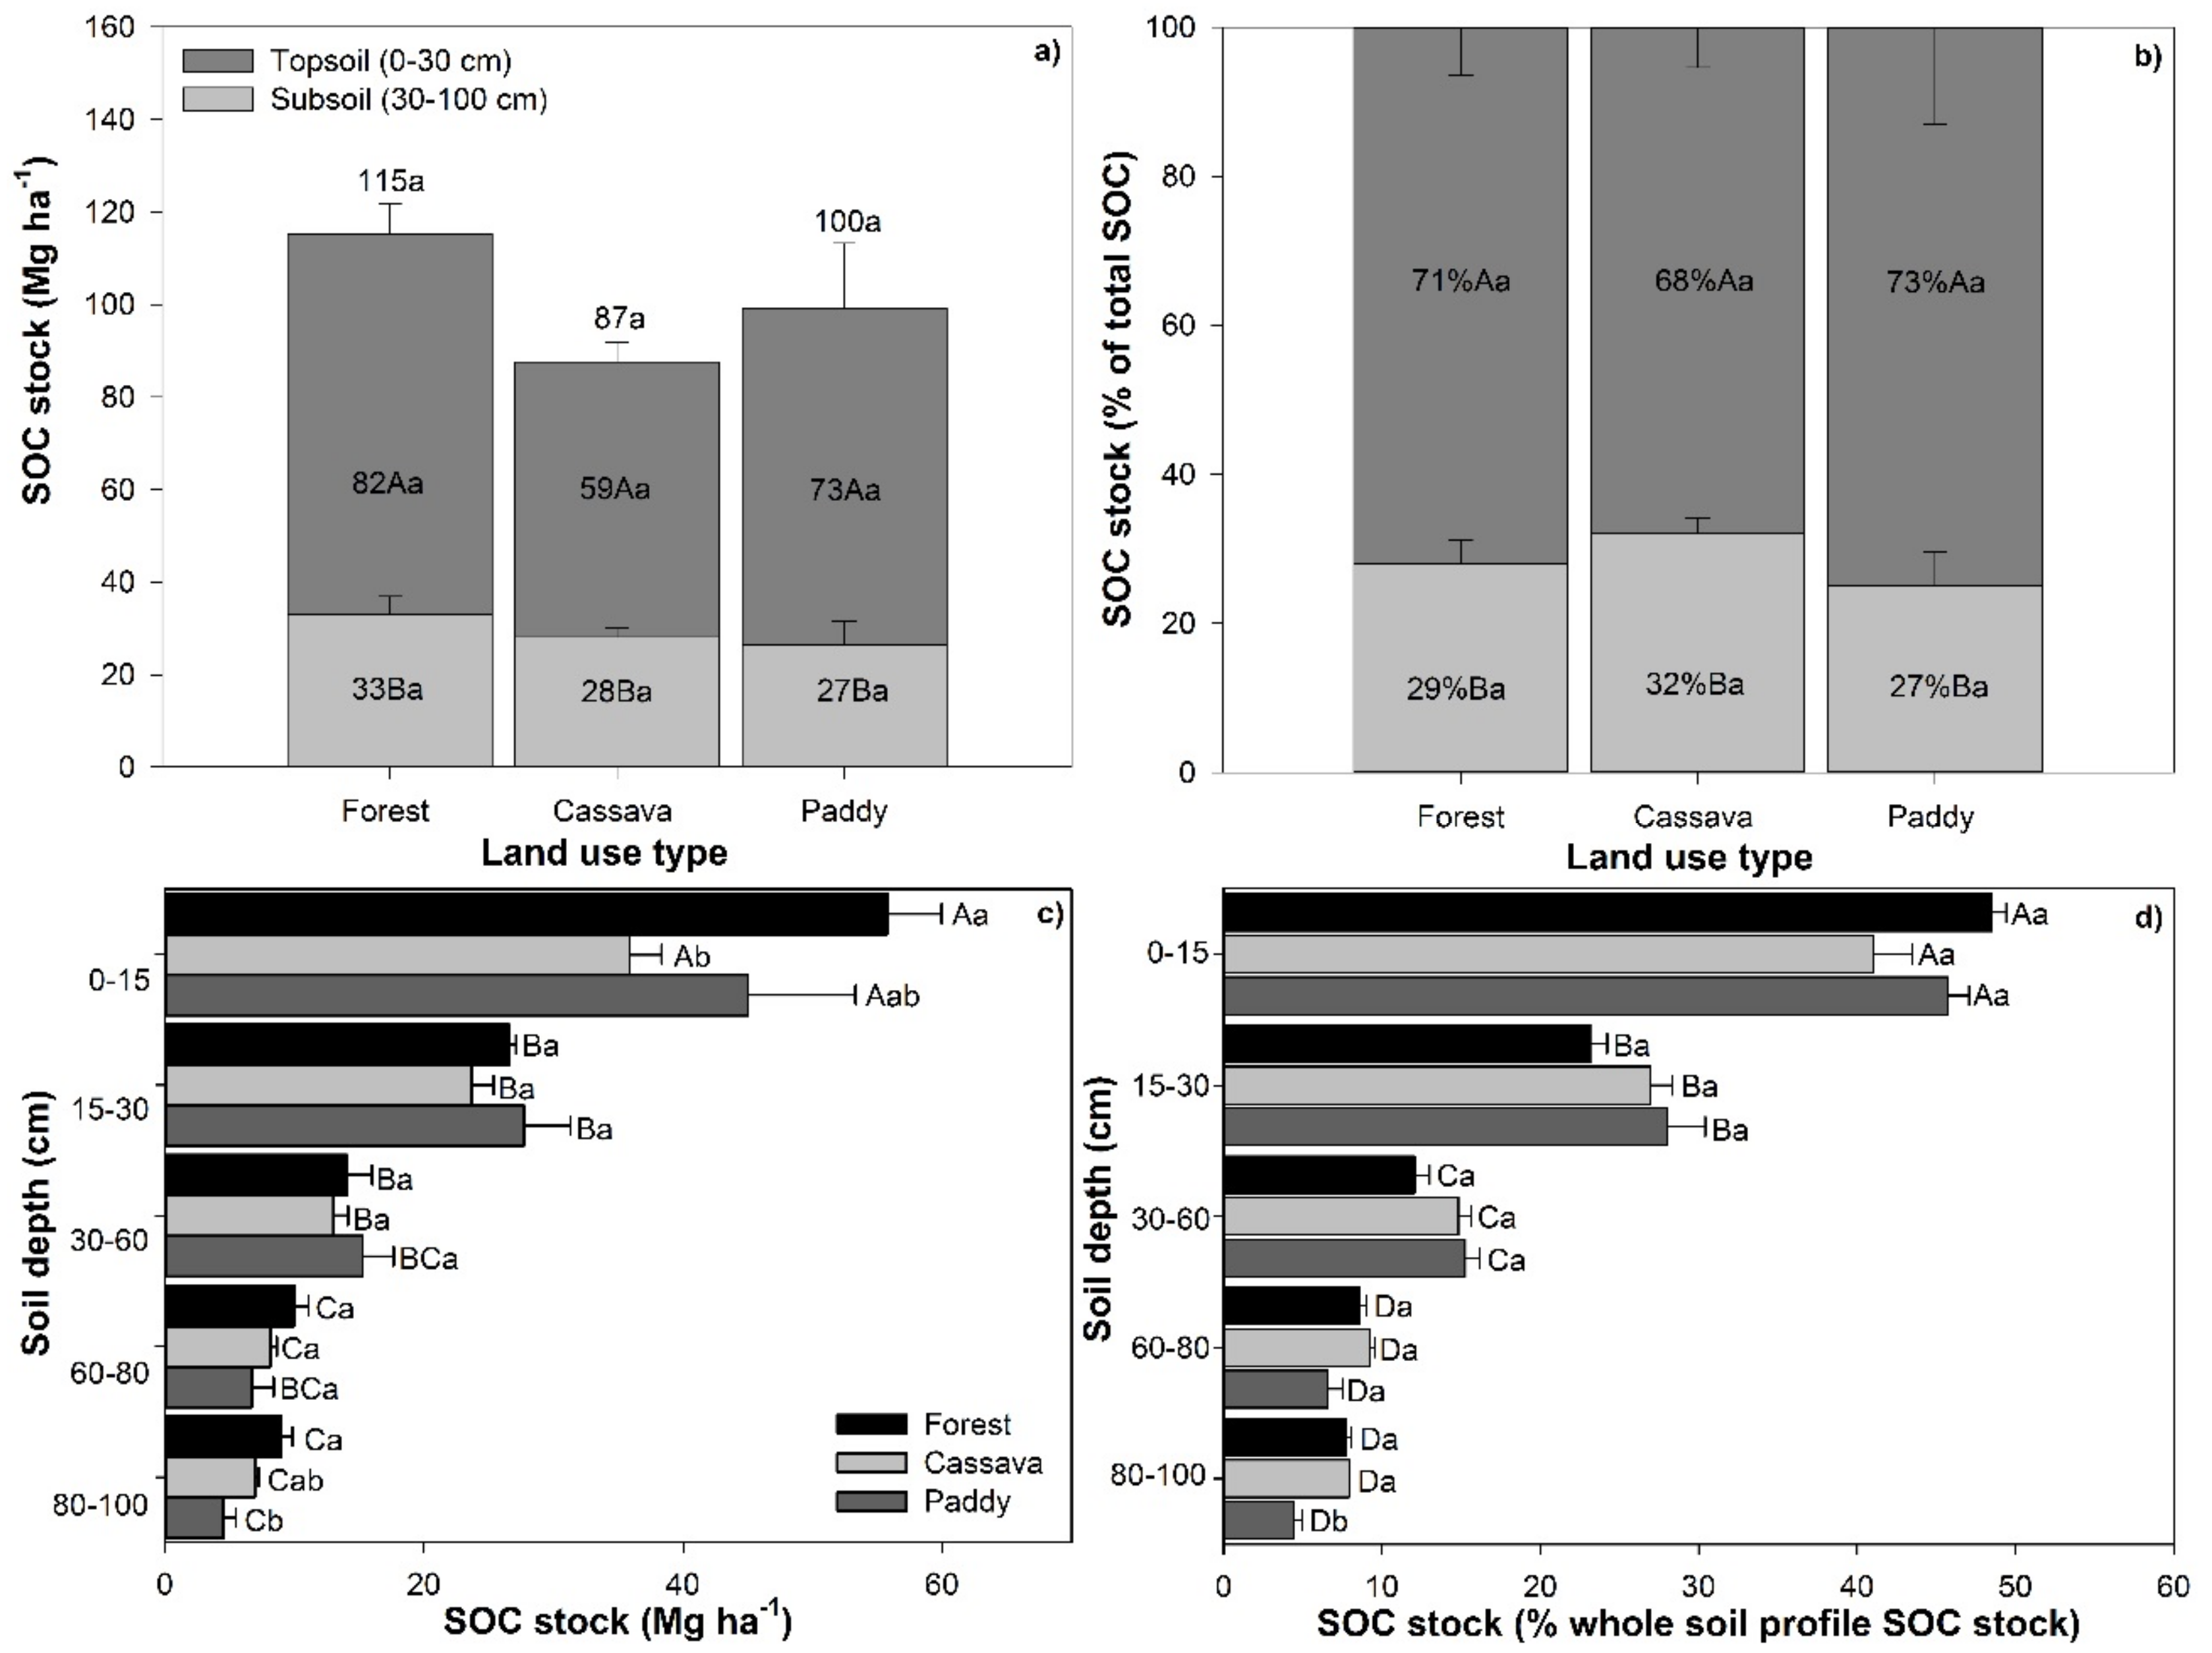
Figure 4.
Land use changes affecting humic acid stocks in the whole soil profile, topsoils, and subsoils: (a) humic acid stocks (Mg ha−1), (b) whole humic acid stocks (percentage of whole soil profile humic acids stock), (c) distribution of humic acid stocks (Mg ha−1), and (d) distribution of humic acid stocks (percentage of whole soil profile humic acids). Uppercase letters accompanying bar graphs denote comparisons of humic acid stocks among different soil depths within a land use type. Lowercase letters denote comparison of humic acid stocks of different land uses at each soil depth. Similar letters indicate no significant differences (p > 0.05), as analyzed by the LSD method. Error bars represent standard error of the mean.

Figure 5.
Relationship between SOC and humic acid stocks pertaining to three land uses and five soil depths in soil profiles down to 100 cm.
Figure 5.
Relationship between SOC and humic acid stocks pertaining to three land uses and five soil depths in soil profiles down to 100 cm.

Table 1.
Soil physical characteristics under different land uses.
| Land Use Type | Soil Depth (cm) | Sand | Silt | Clay | Textures | Bulk Density (g cm−3) | Moisture Content (%) |
|---|---|---|---|---|---|---|---|
| (%) | |||||||
| Forest | 0–15 | 82.6 | 8.0 | 9.4 | Loamy sand | 1.43 | 0.81 |
| 15–30 | 84.0 | 9.0 | 7.0 | Loamy sand | 1.48 | 0.87 | |
| 30–60 | 84.0 | 7.9 | 8.1 | Loamy sand | 1.48 | 0.85 | |
| 60–80 | 76.5 | 11.8 | 11.7 | Sandy loam | 1.54 | 1.53 | |
| 80–100 | 65.0 | 10.9 | 24.1 | Sandy clay loam | 1.67 | 3.23 | |
| Cassava | 0–15 | 84.8 | 9.4 | 5.7 | Loamy sand | 1.41 | 1.50 |
| 15–30 | 82.7 | 9.6 | 7.7 | Loamy sand | 1.65 | 2.00 | |
| 30–60 | 84.2 | 9.9 | 5.9 | Loamy sand | 1.50 | 1.76 | |
| 60–80 | 81.9 | 10.2 | 7.9 | Loamy sand | 1.57 | 1.78 | |
| 80–100 | 74.0 | 9.9 | 16.1 | Sandy loam | 1.61 | 1.93 | |
| Paddy | 0–15 | 79.1 | 14.1 | 6.8 | Loamy sand | 1.49 | 11.66 |
| 15–30 | 79.9 | 13.1 | 7.0 | Loamy sand | 1.58 | 9.37 | |
| 30–60 | 80.8 | 12.9 | 6.3 | Loamy sand | 1.58 | 8.55 | |
| 60–80 | 87.4 | 7.2 | 5.4 | Loamy sand | 1.59 | 11.04 | |
| 80–100 | 93.6 | 2.0 | 4.5 | Sand | 1.55 | 11.84 | |
Table 2.
Ratio of E4:E6 of humic acids in layers down the soil profile of various land uses.
| Soil Depth (cm) | Land Use Type | ||||
|---|---|---|---|---|---|
| Forest | Cassava | Paddy | F–Test | CV (%) | |
| 0–15 | 3.04 a | 3.49 a | 3.91 a | ns | 11.34 |
| 15–30 | 2.56 a B | 2.85 b A B | 3.37a b A | ** | 6.64 |
| 30–60 | 1.95 b | 2.35 b | 2.34 b c | ns | 20.36 |
| 60–80 | 1.95 b | 1.83 c | 2.07 c | ns | 9.64 |
| 80–100 | 1.78 b | 1.61 c | 3.00 a b c | ns | 30.93 |
| F–test | ** | ** | * | ||
| CV (%) | 9.72 | 8.04 | 22.96 | ||
Means in the same column followed by different lowercase letters, indicate significant difference of the ratios under different soil depths in each land use, and means in the same row followed by different uppercase letters, indicate significant different ratios among the different land uses in each soil depth (LSD), p < 0.01, **; p < 0.05, *. ns; not significantly different (p > 0.05). CV; coefficient of variation.
Table 3.
Ratio of C:N of soil layers down the soil profile under various land uses.
| Soil Depth (cm) | Land Use Type | ||||
|---|---|---|---|---|---|
| Forest | Cassava | Paddy | F–Test | CV (%) | |
| 0–15 | 15.20 a | 14.90 | 12.30 | ns | 12.00 |
| 15–30 | 13.80 a | 14.60 | 11.80 | ns | 12.60 |
| 30–60 | 11.70 a | 11.40 | 12.70 | ns | 28.50 |
| 60–80 | 6.50 b | 8.10 | 8.60 | ns | 29.00 |
| 80–100 | 5.10 b | 9.50 | 7.00 | ns | 30.00 |
| F–test | ** | ns | ns | ||
| CV (%) | 19.76 | 30.50 | 27.20 | ||
Means in the same column followed by different lowercase letters indicate significant differences of the ratio among different soil layers in each land use (LSD), p < 0.01, **. ns; not significantly different (p > 0.05). CV; coefficient of variation.
© 2019 by the authors. Licensee MDPI, Basel, Switzerland. This article is an open access article distributed under the terms and conditions of the Creative Commons Attribution (CC BY) license (http://creativecommons.org/licenses/by/4.0/).
Share and Cite
MDPI and ACS Style
Kunlanit, B.; Butnan, S.; Vityakon, P. Land–Use Changes Influencing C Sequestration and Quality in Topsoil and Subsoil. Agronomy 2019, 9, 520. https://doi.org/10.3390/agronomy9090520
AMA Style
Kunlanit B, Butnan S, Vityakon P. Land–Use Changes Influencing C Sequestration and Quality in Topsoil and Subsoil. Agronomy. 2019; 9(9):520. https://doi.org/10.3390/agronomy9090520
Chicago/Turabian StyleKunlanit, Benjapon, Somchai Butnan, and Patma Vityakon. 2019. "Land–Use Changes Influencing C Sequestration and Quality in Topsoil and Subsoil" Agronomy 9, no. 9: 520. https://doi.org/10.3390/agronomy9090520
Note that from the first issue of 2016, this journal uses article numbers instead of page numbers. See further details here.