Article

Phenotype- and SSR-Based Estimates of Genetic Variation between and within Two Important Elymus Species in Western and Northern China

The State Key Laboratory of Grassland Agro-Ecosystems, Key Laboratory of Grassland Livestock Industry Innovation, Ministry of Agriculture, College of Pastoral Agriculture Science and Technology, Lanzhou University, Lanzhou 730020, China
*
Authors to whom correspondence should be addressed.
Genes 2018, 9(3), 147; https://doi.org/10.3390/genes9030147
Submission received: 13 December 2017 / Revised: 1 March 2018 / Accepted: 1 March 2018 / Published: 7 March 2018
(This article belongs to the Section Plant Genetics and Genomics)

Abstract

:
Elymus nutans and Elymus sibiricus are two important perennial forage grasses of the genus Elymus, widely distributed in high altitude regions of Western and Northern China, especially on the Qinghai-Tibetan Plateau. Information on phenotypic and genetic diversity is limited, but necessary for Elymus germplasm collection, conservation, and utilization. In the present study, the phenotypic and genetic differentiation of 73 accessions of the two species were evaluated using 15 phenotypic traits and 40 expressed sequence tag derived simple sequence repeat markers (EST-SSRs). The results showed that only 7.23% phenotypic differentiation (Pst) existed between the two Elymus species based on fifteen quantitative traits. Principal component analysis (PCA) revealed that leaf traits, spike traits, and some seed traits were dominant factors in phenotypic variation. Moreover, 396 (97.8%) and 331 (87.1%) polymorphic bands were generated from 40 EST-SSR primers, suggesting high levels of genetic diversity for the two species. The highest genetic diversity was found in the Northeastern Qinghai-Tibetan Plateau groups. Clustering analysis based on molecular data showed that most accessions of each Elymus species tended to group together. Similar results were described by principal coordinates analysis (PCoA) and structure analysis. The molecular variance analysis (AMOVA) revealed that 81.47% and 89.32% variation existed within the geographical groups for the two species, respectively. Pearson’s correlation analyses showed a strong positive correlation between Nei’s genetic diversity and annual mean temperature. These results could facilitate Elymus germplasm collection, conservation, and future breeding.

1. Introduction

Elymus is the largest genus of the tribe Triticeae with approximately 150 species widely distributed in temperate regions of the world [1]. Two important species of the genus Elymus are hexaploid Elymus nutans Griseb with genomes StStHHYY, and tetraploid Elymus sibiricus with genomes StStHH. Both are self-pollinating, perennial grasses. Indigenous to North Asia, the two Elymus species occur naturally in Eastern Mongolia, Northern Russia, the Himalayas, and parts of Alaska and Canada [2,3]. In China, the two Elymus species are widely distributed in the high altitude regions of Western and Northern China, especially in the Qinghai-Tibetan Plateau [2,3,4]. These usually grow in wet meadows, among bushes, along riverbanks, on mountain slopes, and in valleys at altitudes from 1000 up to 4000 m [3,5]. The two Elymus species have been widely used as forage crops in cultivated pastures and natural grassland due to their good forage quality, tolerance to diverse environmental conditions as well as important ecological functions in vegetation restoration, soil stabilization, and erosion control [6,7]. Moreover, Elymus species are closely related to several important cereal crops such as wheat, barley, and rye, and may serve as potential genetic resource for the improvement of these crops [8,9,10,11].
Despite their ecological and economical importance as potential forage grasses, progress in cultivar development and improvement for the two Elymus species has seriously lagged behind crop plants and other forage grasses. In China, only eight E. sibiricus cultivars and four E. nutans cultivars have been developed from wild materials. The lack of available information about economically valuable traits in the germplasm might be a major reason for the slow progress in cultivar development. The evaluation of phenotypic traits such as plant height, leaf shape, and inflorescence architecture is an initial and essential step for screening germplasms with economically valuable traits, and is also the usual method for determining the relationships among the different accessions [12]. Meanwhile, information about the amount and distribution of genetic diversity is important for germplasm collection in the wild, and for setting up ex situ preserved plant collections of genetic resources that can be used in future plant-breeding programs. Expressed sequence tag derived simple sequence repeat markers (EST-SSRs) are abundant, highly polymorphic, and are easily transferred among related species [13,14,15]. They have been widely used for genetic diversity studies, genetic mapping, and DNA fingerprinting for many crops and forage grasses [7,16,17,18].
Previously, several studies have examined the genetic diversity of E. sibiricus and E. nutans accessions or natural populations. The genetic and geographical divergence of E. nutans germplasm from West China were studied using gliadin [19,20] and inter simple sequence repeat (ISSR) markers [2]. The genetic diversity of 52 E. sibiricus accessions from the Qinghai-Tibetan Plateau was studied by sequence related amplified polymorphism (SRAP) markers [21]. The genetic variation among and within 24 E. sibricus accessions, cultivars, and breeding lines from Northeastern Qinghai-Tibetan Plateau was analyzed by EST-SSR markers [7]. However, most of these previous genetic diversity studies have focused on single Elymus species from a small geographical area in the Qinghai-Tibetan Plateau. The extent and patterns of phenotypic and genetic diversity of E. nutans and E. sibiricus at a large geographical scale are still largely unknown. The Qinghai-Tibetan Plateau is famous for its high elevation, low temperatures, and oxygen concentration where various Elymus species are widely distributed. In contrast, the Mongolian Plateau exhibits a dry and windy climate, and also contains a high diversity of Elymus species [10]. As a consequence, a comprehensive analysis of the phenotypic and genetic diversity of Elymus germplasm, indigenous to the Qinghai-Tibetan Plateau and Mongolian Plateau, may be important not only for the identification and development of Elymus germplasm with economically valuable traits, but also for the conservation and utilization of Elymus species.
The objectives of present study were to (i) differentiate taxonomically between E. nutans and E. sibiricus; (ii) estimate the genetic variability of E. nutans and E. sibiricus geographical groups; and (iii) analyze the genetic structure and relationship of the two Elymus species. These results could facilitate Elymus germplasm collection, conservation, and future breeding.

2. Materials and Methods

2.1. Plant Materials and Phenotype Observation

A total of 37 E. nutans accessions and 36 E. sibiricus accessions were collected and evaluated based on phenotypic traits and EST-SSR markers. Materials were obtained from the U.S. Department of Agriculture Germplasm Resources Information Network (GRIN), Lanzhou University, Sichuan Agricultural University, and Sichuan Academy of Grassland Science (Supplementary Materials, Table S1). These materials originate from the main distribution areas in the Qinghai-Tibetan Plateau (QTP) and Mongolia Plateau (MP) in China including Tibet, Qinghai, Sichuan, Gansu, Xinjiang, and Inner Mongolia, at altitudes ranging from 500 to 4110 m. (Supplementary Materials, Figure S1). These materials were divided into seven geographical groups based on their origin and ecogeographical environment. These geographical groups were characterized by differences in temperature, precipitation, altitude, and elevation. E. nutans accessions were divided into four geographical groups including of Northeastern Qinghai-Tibetan Plateau (NEQ1), Northwestern Qinghai-Tibetan Plateau (NWQ1), Southeastern Qinghai-Tibetan Plateau (SEQ1) and Mongolian Plateau populations (MP1). E. sibiricus accessions were divided into three geographical groups: Northeastern Qinghai-Tibetan Plateau (NEQ2), Southeastern Qinghai-Tibetan Plateau (SEQ2), and Mongolian Plateau (MP2).
Approximately 30 seeds of each accession were germinated and seedlings were maintained in a greenhouse under a 25/15 °C day/night temperature regimes until they were eight weeks old. Twenty individual plants of each accession were transplanted to the Yuzhong experimental field of Lanzhou University, Gansu, China (latitude 35°34′ N, longitude 103°34′ E, elevation 1720 m). After transplanting, plants were watered immediately, and no fertilizer was applied after transplanting.
In the second year, a total of 730 individual plants (10 individuals of each accession) of the two species were selected for evaluating 15 phenotypic traits. Flag leaf length (FL), flag leaf width (FW), length of second leaf from bottom (LB), width of second leaf from bottom (WB), plant height (PH), culm node number (CN), tiller number (TN), culm diameter (CD) spike length (SL), floret number per spike (FN), length of lemma (LL), width of lemma (WL), awn length of lemma (AL), 1000-seed weight (SW1) were measured using the methods described by Zhao et al. [22]. Seed shattering (SS) was determined by measuring pedicel breaking tensile strength (BTS) required to detach the seeds from the pedicels. Thirty randomly chosen spikelets of each plant were examined at 4 weeks after heading, and their average BTS values were calculated.

2.2. DNA Extraction and Polymerase Chain Reaction Amplification

Ten individuals of each accession were sampled and pooled together for DNA extraction using the SDS (sodium dodecyl sulfate) method [23]. The quantity and quality of DNA samples was determined using the NanoDrop ND1000 spectrophotometer (Thermo Scientific, Waltham, MA, USA) and agarose gel electrophoresis, then diluted to 25 ng/µL and stored at −20 °C. A total of 40 EST-SSR primers were used in the study including 25 primers selected from the E. lanceolatus (Elw hereafter), Pseudoroegneria (Ps hereafter), and Leymus (Lt hereafter), and 15 newly developed E. sibiricus (ES hereafter) EST-SSR primers reported by Zhou et al. [15]. The twenty-five Elw, Ps and Lt markers were developed by Bushman et al. [24]. The PCR amplification and SSR genotyping as well as the methods of electrophoresis process were carried out as described by Zhou et al. [15] and Xie et al. [7].

2.3. Data Analysis

The mean value, standard deviation, coefficient of variation (CV), Shannon’s diversity index (H’), and principal component analysis (PCA) of phenotypic traits were analyzed using Excel 2013 (Microsoft Inc., Redmond, WA, USA) and SPSS 19.0 software (SPSS Inc., Chicago, IL, USA). Shannon’s diversity index was calculated as follows: H’ = –∑ pi Ln pi, where pi is the proportion of each phenotypic trait [25,26]. According to the mean value of each trait for each accession, a heatmap was constructed using the Heatmap Illustrator (HemI 1.0) program (Beijing Institude of Genomics, CAS, Beijing, China) [27]. All phenotypic data were normalized under the logarithmic relations (log 2) first due to the different conditions of measurement, then they were used to map the visualized color matrix (73 rows × 15 columns). The color scale ranged from 7.23 to 0.02 (red to blue). Each line and column represented different accessions and different traits, respectively. Hierarchical clustering was performed based on the average linkage method and the similarity metric with Pearson distance. In addition, a Pearson correlation analysis among the different traits was implemented using SPSS 19.0 software. The phenotypic differentiation coefficient (Pst) was calculated as follows: Pst = (σ2t/s)/(σ2t/s + σ2s), where σ2t/s is the variance portion among populations and σ2s is the variance portion within populations [28].
The amplified bands were considered as present (1) and absent (0), and the binary matrix data produced in an Excel file was used for further statistical analysis. Polymorphism information content (PIC) were calculated as follows: PIC = 1 − p2q2, where p is the frequency of present band and q is the frequency absent band [29]. Genetic diversity parameters including observed number of alleles (Na), effective number of alleles (Ne), Shannon’s information index (I), and Nei’s genetic diversity (H) among seven populations were calculated by using GenAlEx 6.5 (Canberra Australia) [30]. The pairwise genetic differentiation and genetic distance among these populations were analyzed using the POPGENE 1.31 program (Edmonton, AB, Canada) [31]. The binary data was analyzed using qualitative routine to generate Jaccard’s genetic similarity coefficient (GS). Based on the GS matrix, a principal coordinates analysis (PCoA) was constructed using DCENTER module in NTSYS (version 2.10), and a dendrogram was constructed using the unweighted pair group method with arithmetic mean (UPGMA) of NTSYS [32]. A bootstrap analysis with 1000 replicates was performed to obtain the confidence of branches of the cluster tree using the Winboot software [33]. The genetic structure of the 73 Elymus accessions was analyzed using STRUCTURE v 2.3.4 software (Stanford, CA, USA) with the ‘admixture mode’, burn-in period of 10,000 interactions and a run of 100,000 replications of Markov chain Monte Carlo (MCMC) after burn in [34]. For each run, 20 independent runs of STRUCTURE were performed with the number of clusters (K) varying from 1 to 11. Mean L (K) and delta K (ΔK) were estimated using the method described by Evanno et al. [35]. Maximum likelihood and delta K (ΔK) were used to determine the optimum number of groups. AMOVA software (version 1.55) (Geneva, Switzerland)was employed to analyze the distribution of genetic variance within and among geographic groups [36]. The Shannon differentiation coefficient (Gst) was calculated according to the following formula: Gst = (Hsp − Hpop)/Hsp (Hsp, total Shannon information index; Hpop, average Shannon information index within the population). Gene flow (Nm) was calculated as Fst (Nm = (1 − Fst)/4Fst) [37]. In addition, to determine the relationships between genetic diversity and environmental factors (annual mean temperature, annual precipitation, altitude, and latitude), a linear regression analysis was conducted on SPSS 19.0 (SPSS Inc., Chicago, IL, USA). GenAlEx6.5 (Canberra, Australia) was used to analyze the correlation between genetic distance and geographic distances by a Mantel test [38].

3. Results

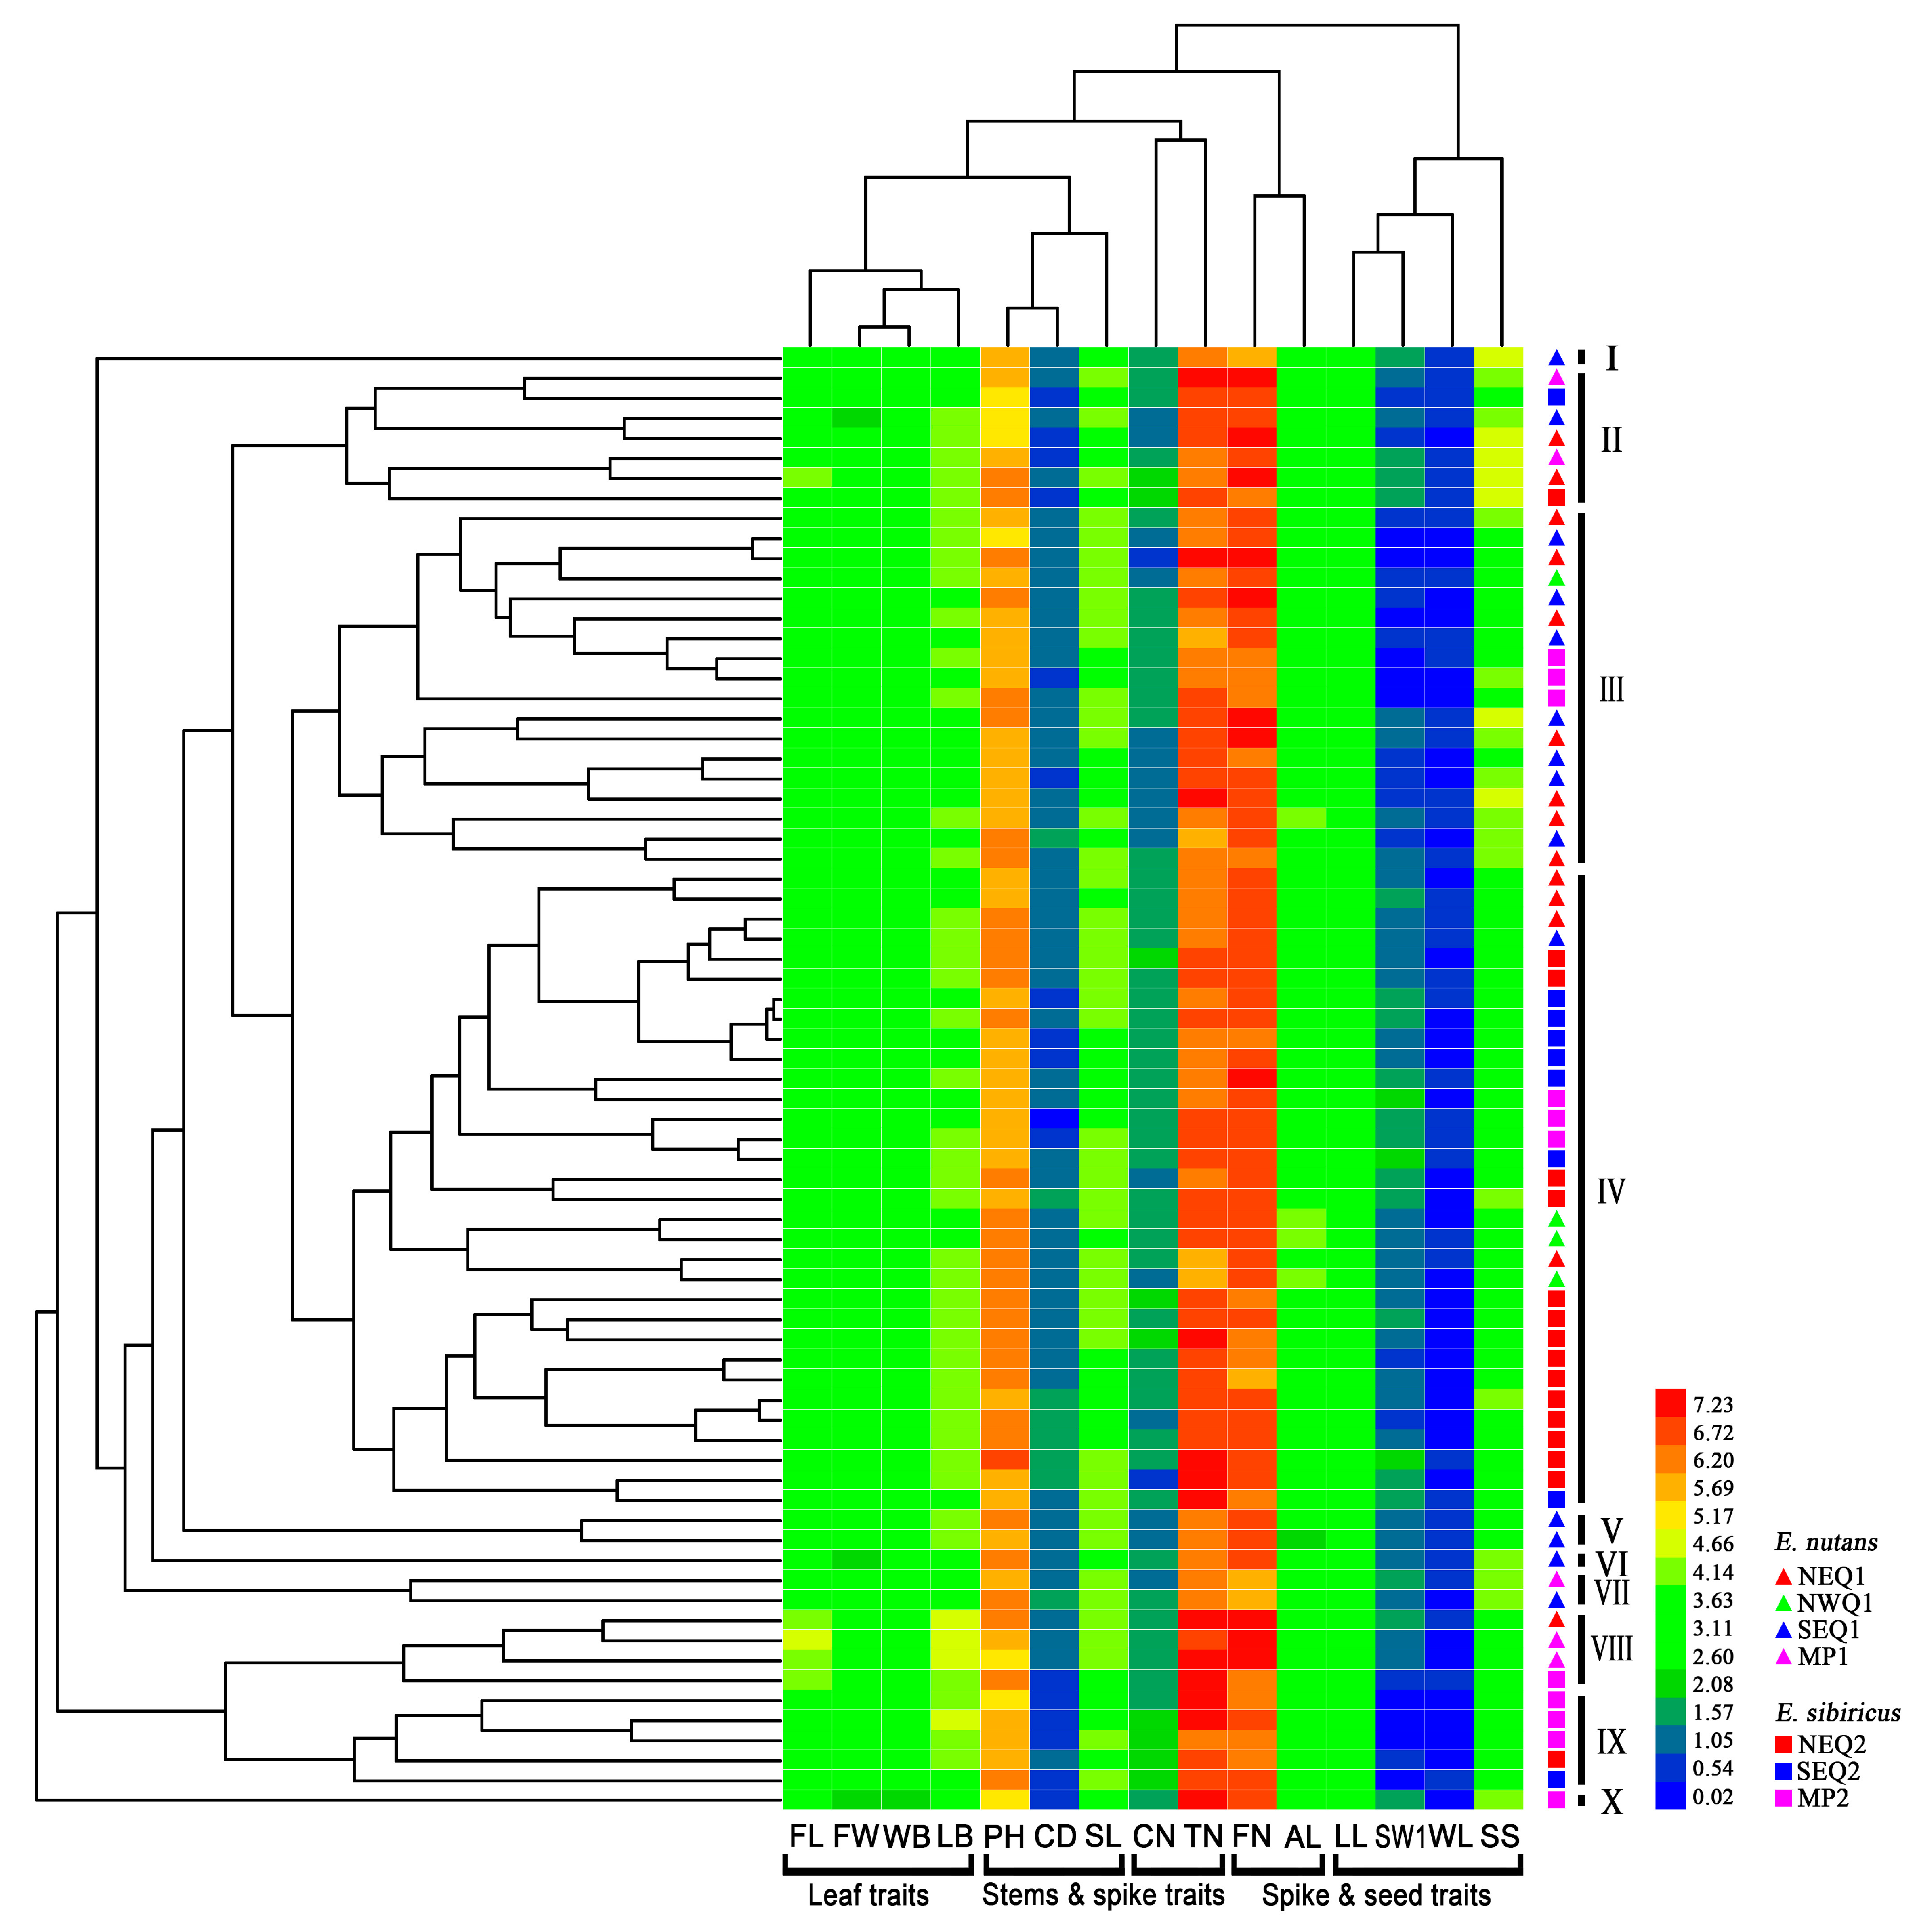
3.1. Phenotypic Differentiation between Two Elymus Species

The phenotypic variations of 73 Elymus accessions were studied using 15 traits. Based on the phenotypic differentiation coefficient (Pst) analysis, 12.67% and 17.10% phenotypic variation existed among E. nutans and E. sibiricus groups, respectively (Table 1). The greatest phenotypic differentiation was found for seed shattering (Pst = 23.43%), followed by awn length (Pst = 18.44%), culm diameter (Pst = 16.56%), and tiller number (Pst = 11.72%) when all the 15 traits between the two species were compared. Many traits showed a considerable level of variation for two Elymus species (Table 2). In E. nutans, shannon’s diversity index (H’) ranged from 1.64 to 2.23, with an average of 2.03. Four traits: flag leaf length (FL), tiller number (TN), floret number per spike (FN), and seed shattering (SS) had a coefficient of variation (CV) greater than 15%. The greatest phenotypic variation was found for seed shattering (CV = 28.11%). For E. sibiricus, the H’ value varied from 1.51 to 2.26, with an average of 2.06. The greatest phenotypic variation was found for tiller number (CV = 19.97%), followed by floret number per spike (CV = 15.47%) and seed shattering (CV = 15.45%). Length of lemma (LL) showed the lowest phenotypic variation in E. nutans (CV = 4.99%) and E. sibiricus (CV = 7.12%), respectively.
Clustering with 15 traits formed two major groups; Group 1 was divided into four subgroups: leaf traits group (FL, FW, WB, and LB); stem and spike traits group (PH, CD, and PL); stem traits group (CN and TN); and spike and seed traits group (FN and AL). The remaining four seed traits (LL, SW1, WL, and SS) were assigned to another group (Figure 1). Clustering analysis showed that 73 accessions were assigned to ten subgroups. For E. nutans accessions, within each cluster there were no obvious correlations between the phenotypic traits and geographic origins. Some E. sibiricus accessions from eastern groups of the Qinghai-Tibetan Plateau (NEQ2 and SEQ2) had similar phenotypic performance (Cluster IV). In E. nutans, the principal component analysis (PCA) showed that the first three principal components could explain 60.77% of the total phenotypic variation. PC1 was mainly involved in leaf traits, PC2 was mainly involved in seed traits (Table 2). In contrast, for E. sibiricus, three principal components explained 54.24% of the total phenotypic variation. PC1 was focused on leaf traits, and PC2 on spike and seed traits. The correlation coefficient analysis showed significantly positive correlations among the four Elymus leaf traits: Flag leaf length (FL), flag leaf width (FW), length of second leaf from bottom (LB), width of second leaf from bottom (WB), while seed shattering showed a negative correlation with most traits detected (Supplementary Materials, Table S2).

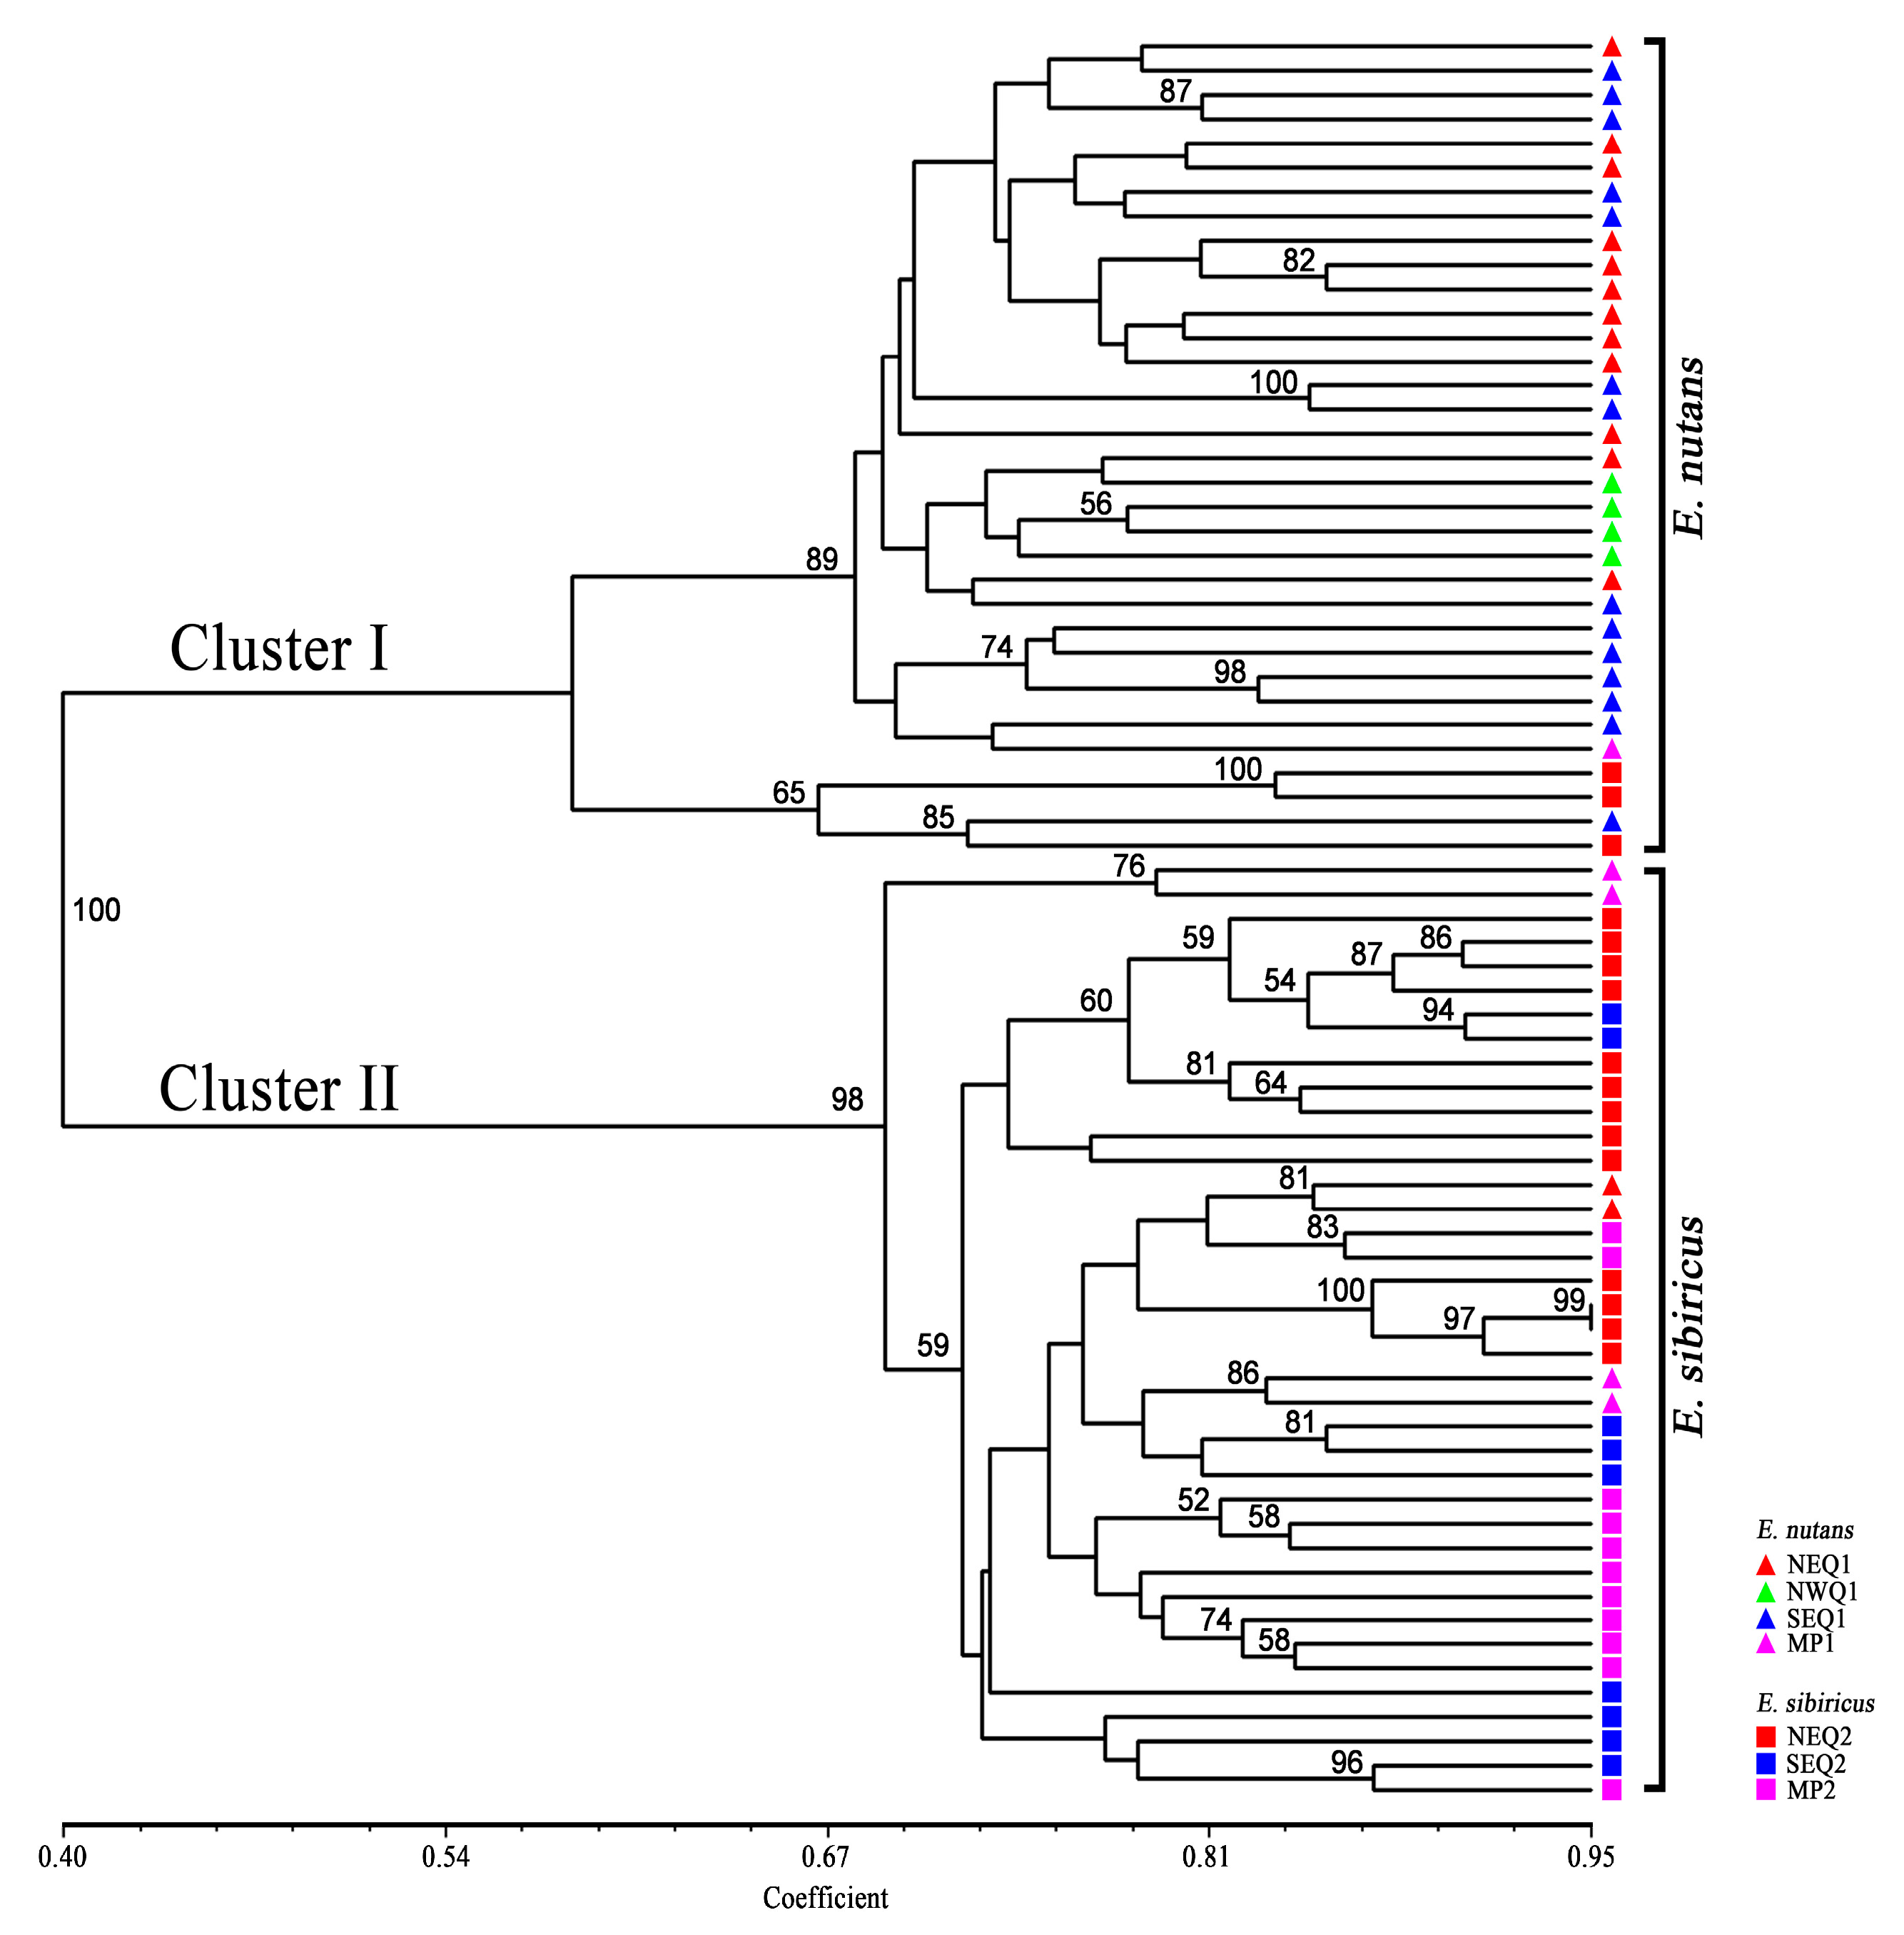
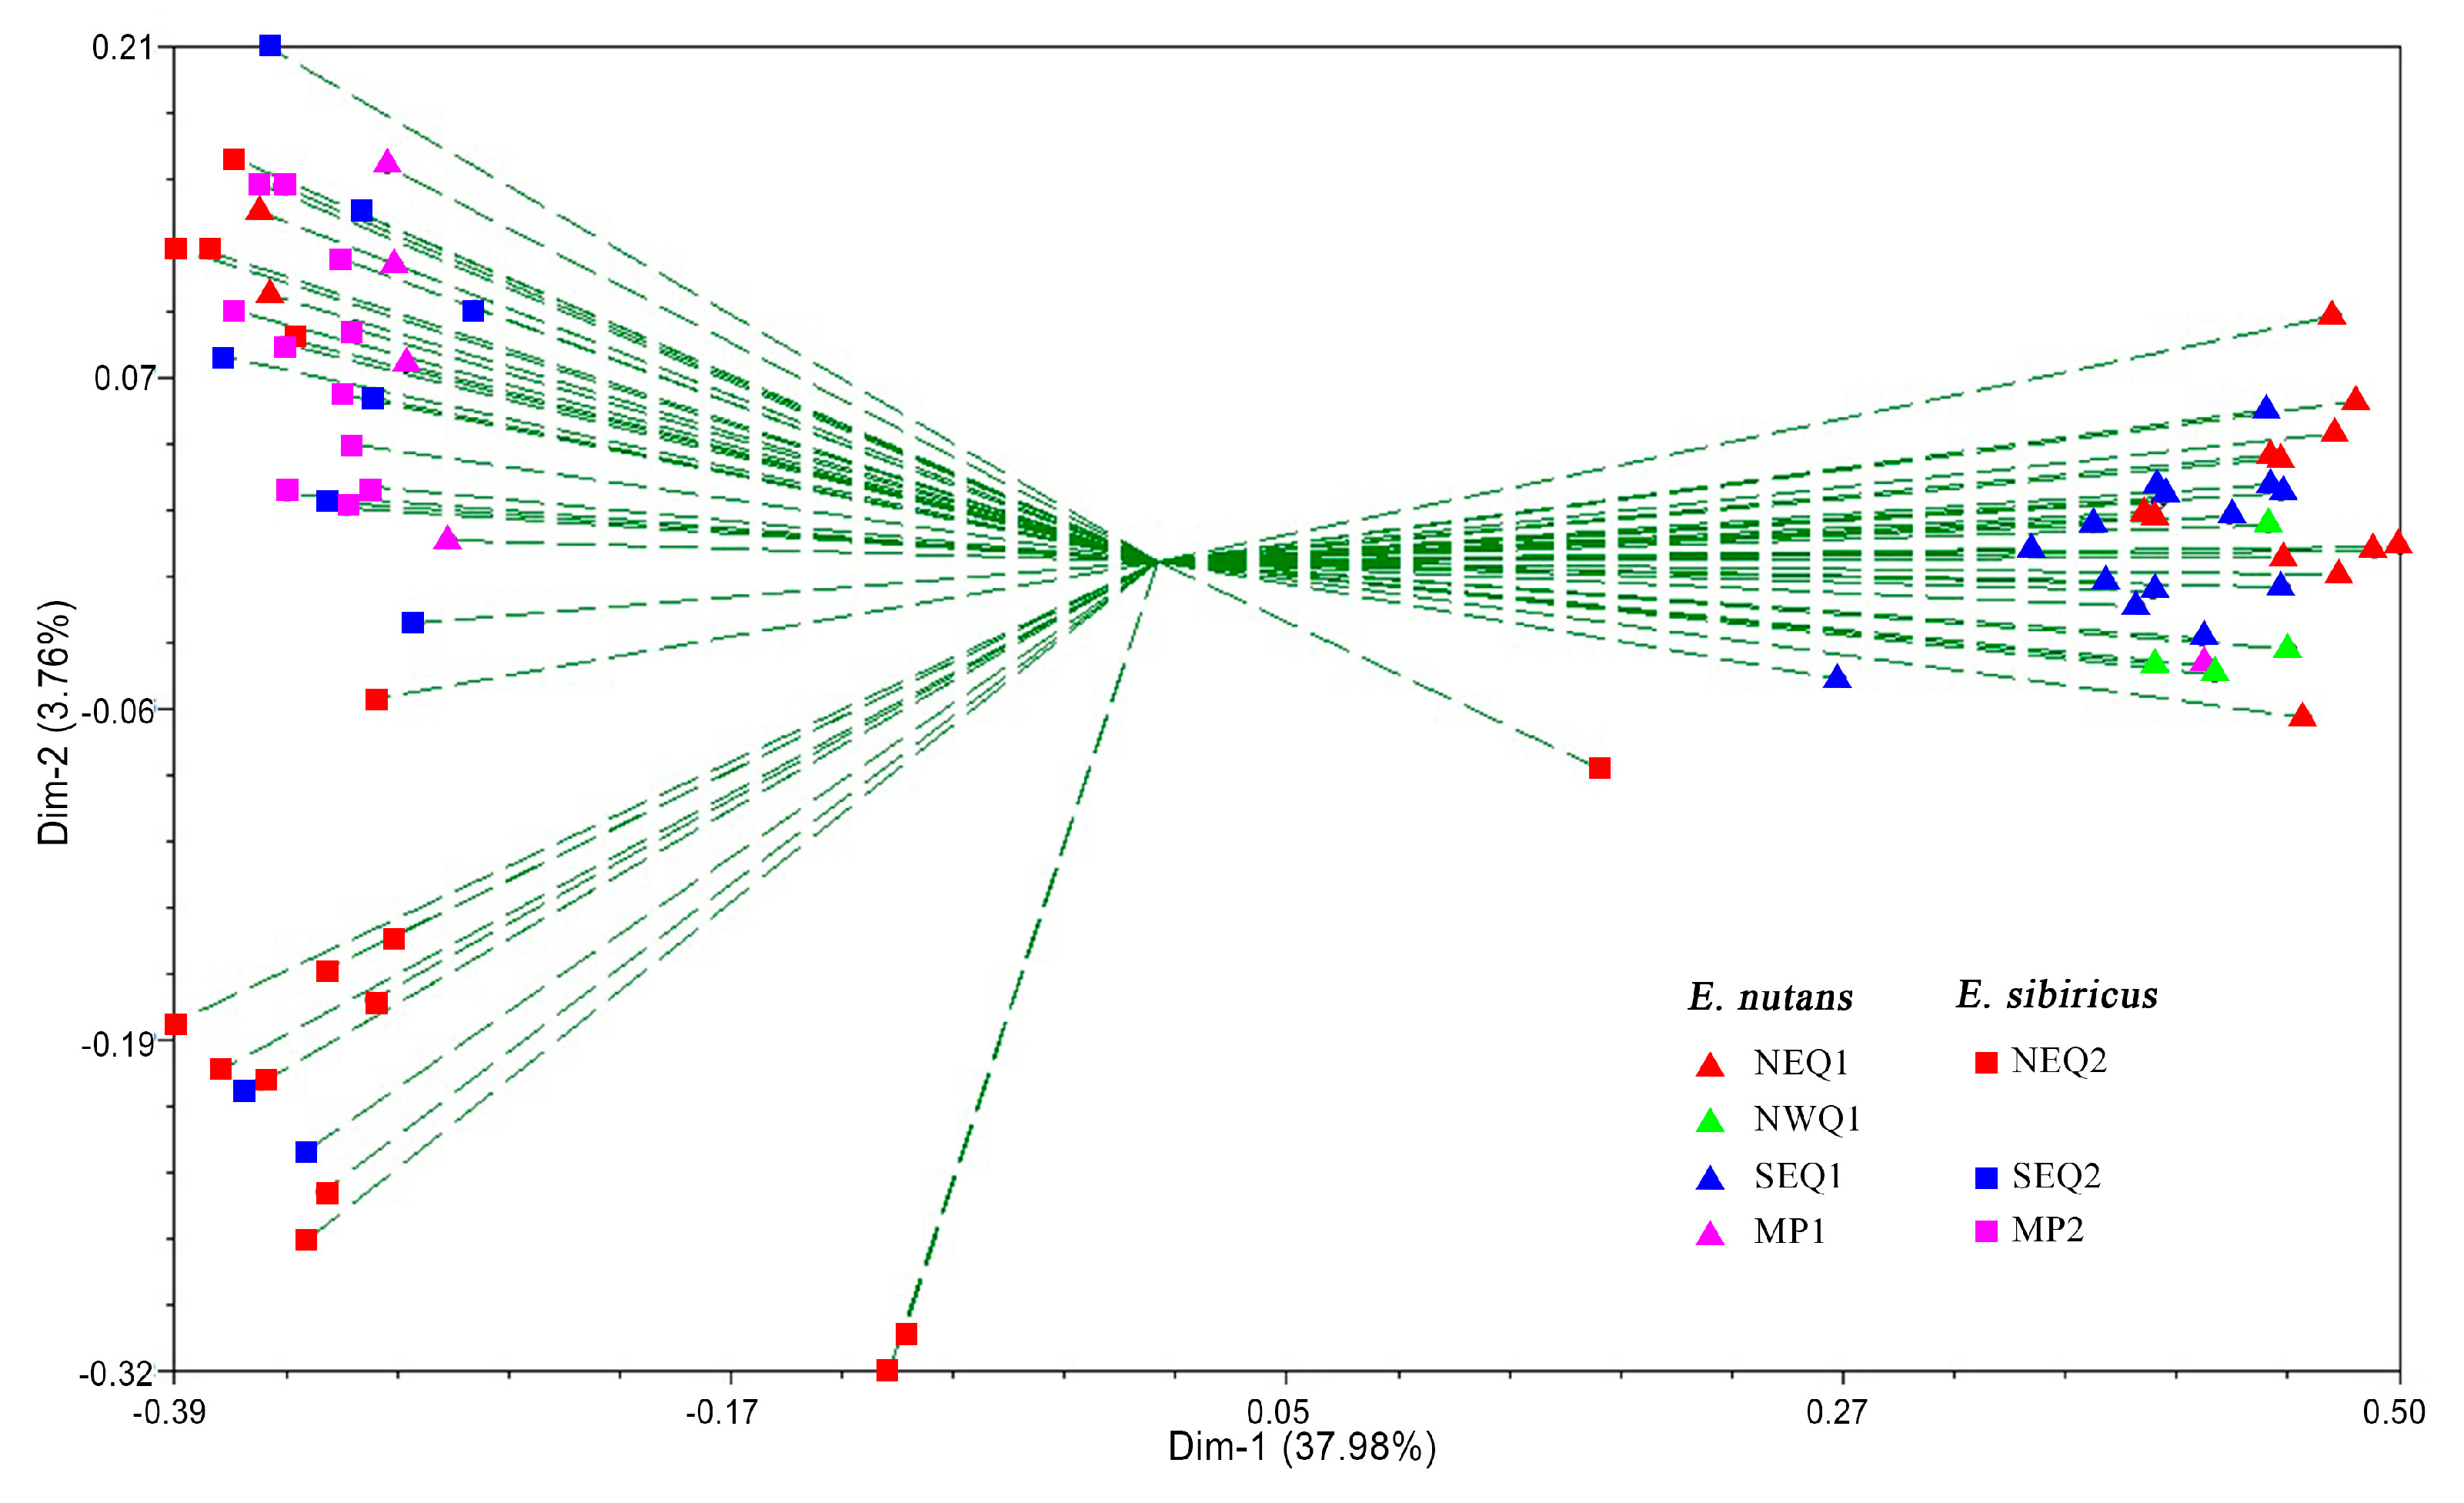
3.2. Genetic Diversity and Genetic Relationship between Two Elymus Species

In this study, forty EST-SSR primers generated 405 and 380 bands for E. nutans and E. sibiricus, respectively (Supplementary Materials, Figure S2). The polymorphic information content (PIC) ranged from 0.16 to 0.45, with an average of 0.32 for E. nutans, and the PIC value varied from 0.03 to 0.43, with an average of 0.23 for E. sibiricus (Supplementary Materials, Table S3). In general, E. nutans had a relatively higher level of genetic diversity (PPL = 68.15%, Na = 1.49, Ne = 1.36, I = 0.33, H = 0.22) than E. sibiricus at species level (Table 3). Genetic variation was found between E. nutans and E. sibiricus in the same geographic region. E. nutans had a higher level of genetic diversity in Northeastern Qinghai-Tibetan Plateau (NEQ) (PPL = 88.64%), Southeastern Qinghai-Tibetan Plateau (75.56%), and Mongolian Plateau (MP) (PPL = 69.88%) groups. The highest genetic diversity was found in Northeastern Qinghai-Tibetan Plateau groups (NEQ) for both the Elymus species (PPL = 88.64% and 81.84%, respectively). Correspondingly, the lowest genetic diversity was found in northwestern Qinghai-Tibetan Plateau (NWQ1) E. nutans groups (PPL = 38.52%) and Southeastern Qinghai-Tibetan Plateau (SEQ2) E. sibiricus groups (PPL = 53.68%).
The unweighted pair-group method using arithmetic averages (UPGMA) cluster analysis showed that all accessions were clustered into two major clusters with a bootstrapping value of 100% (Figure 2). Cluster I contained a total of 31 E. nutans accessions and 3 E. sibiricus accessions. Thirty-three E. sibiricus accessions and 6 E. nutans accessions were assigned to Cluster II. In general, the vast majority of accessions (83.8% E. nutans accessions and 91.7% E. sibiricus accessions) could easily be distinguished using selected EST-SSR markers. The results observed in the principal coordinate analysis (PCoA) were in agreement with the UPGMA analysis. The first three principle components explained 44.98% of the total variation. A moderate, but clear separation between E. nutans and E. sibiricus was revealed (Figure 3). Two E. nutans accessions from Northeastern Qinghai-Tibetan Plateau and four from Mongolian Plateau were grouped with E. sibiricus.

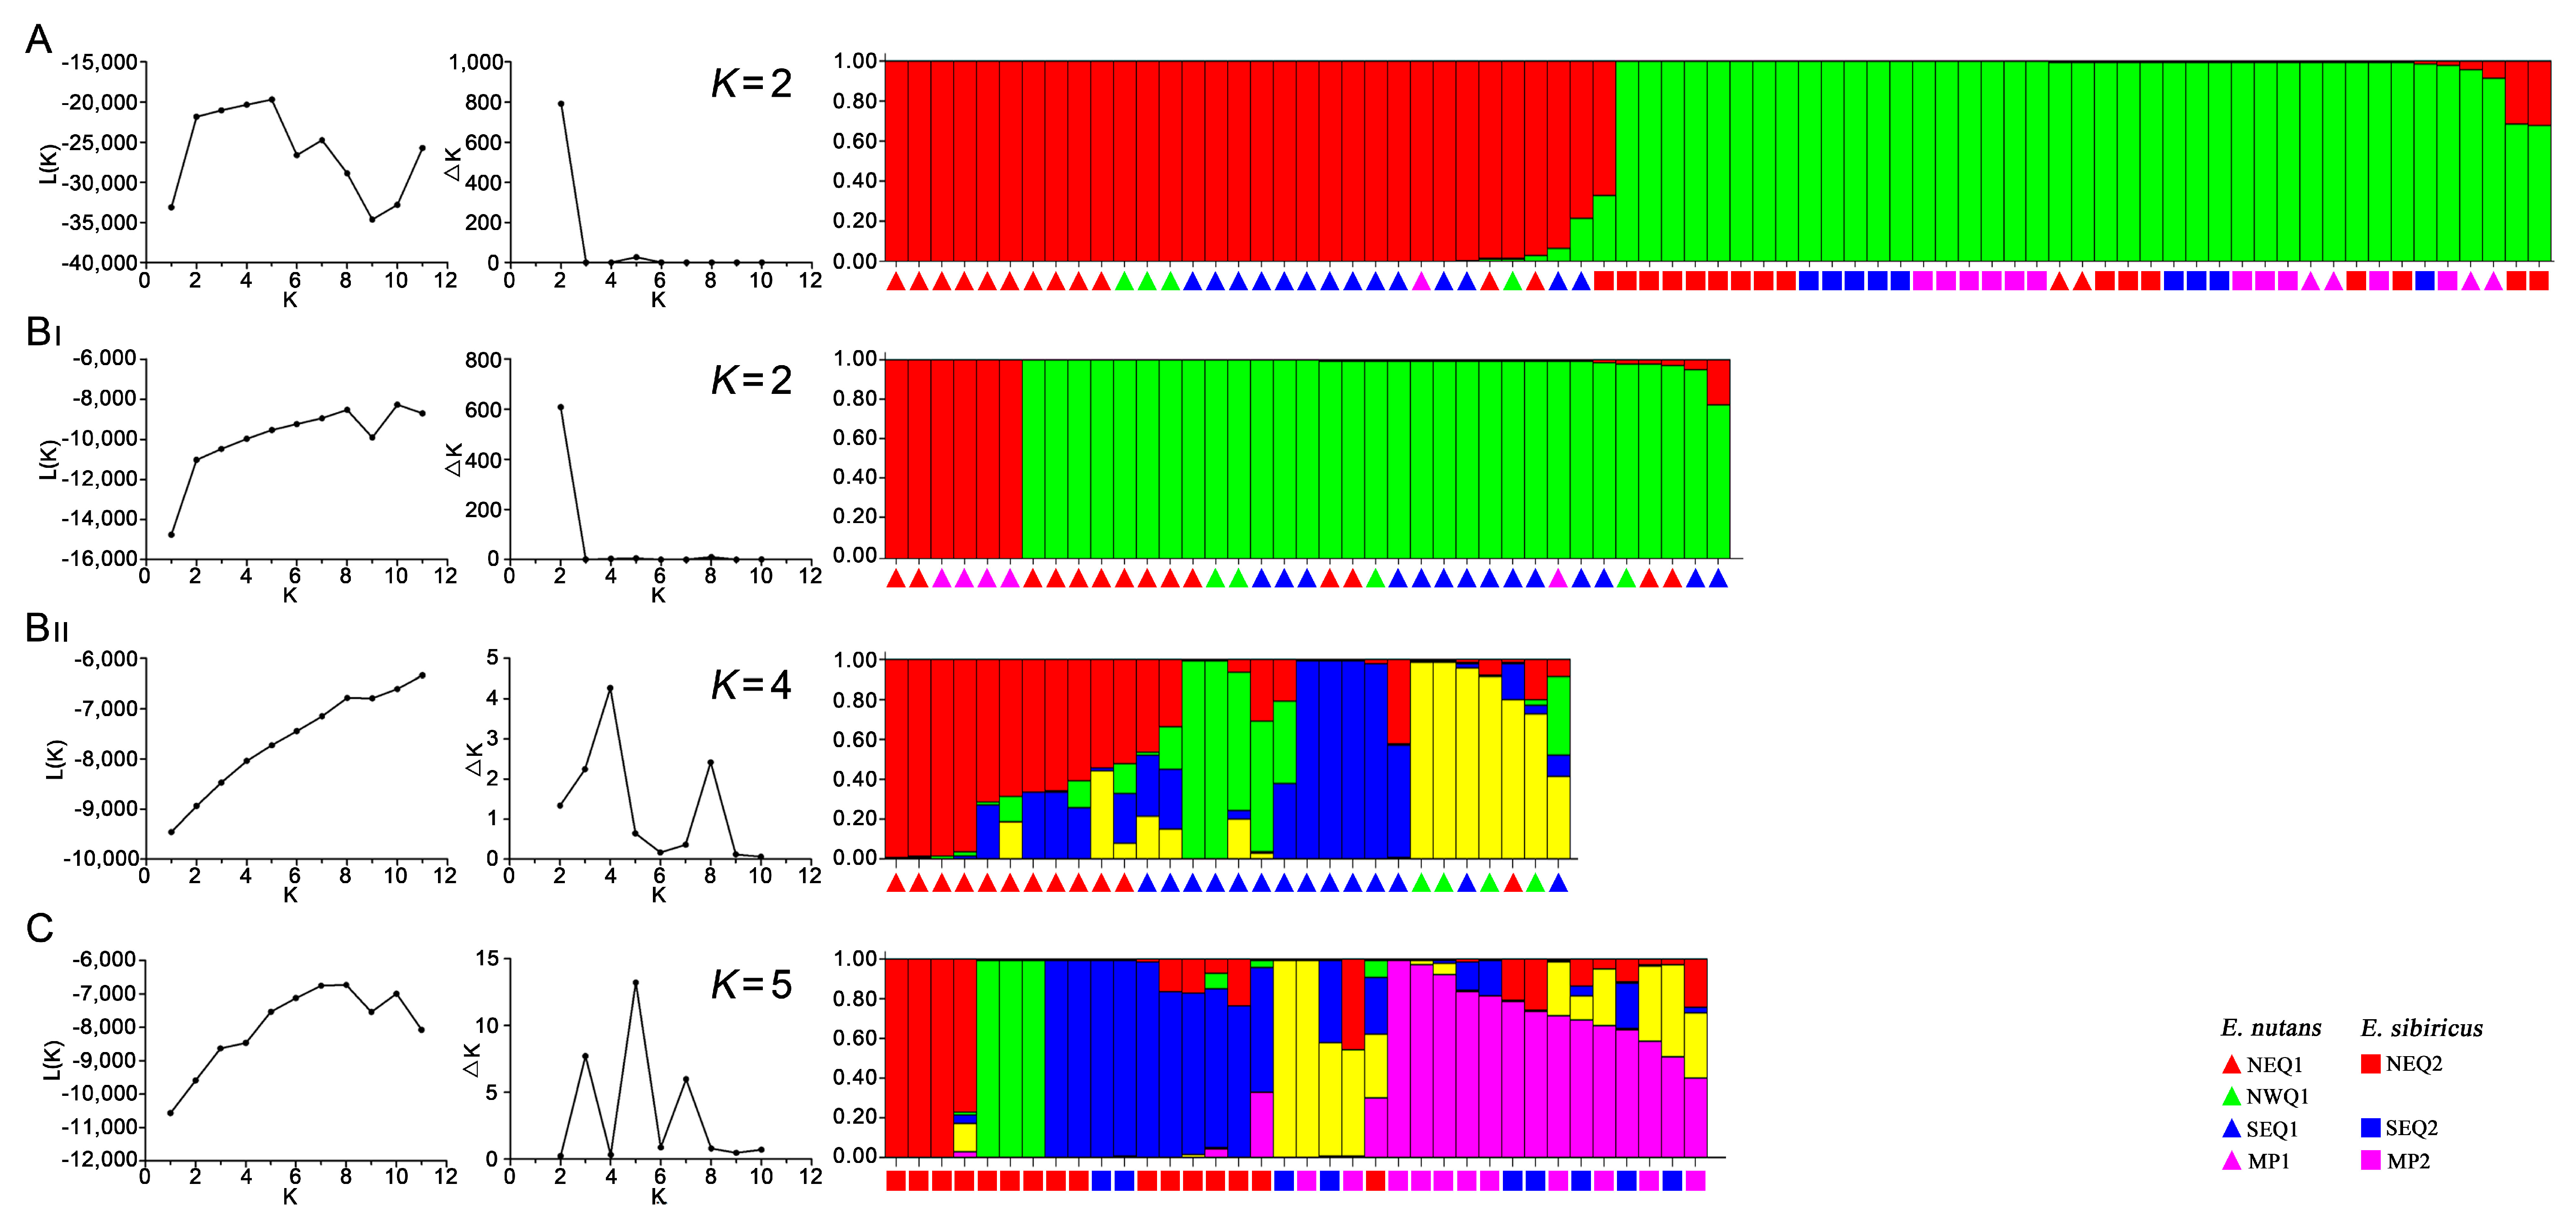
3.3. Genetic Structure between and within the Two Elymus Species

The genetic structure of the 73 Elymus accessions was analyzed using STRUCTURE software. Based on maximum likelihood and delta K (ΔK) values, the optimal number of groups was two (Figure 4). As shown in Figure 4A, all 73 Elymus accessions were divided into two subpopulations, corresponding to E. nutans and E. sibiricus subgroups with a few admixed lines, which was consistent with clustering based on genetic distance. We further investigated the internal genetic structure of E. nutans and E. sibiricus, respectively (Figure 4B,C). Thirty-seven E. nutans accessions were assigned to two major groups when K was two (Figure 4BІ). Group 1 consisted of six accessions, mainly from the Mongolia Plateau; Group 2 consisted of 31 accessions predominantly from the Qinghai-Tibetan Plateau. Thirty E. nutans accessions from the Qinghai-Tibetan Plateau could be clearly divided into four subgroups when K was 4 (Figure 4BII). Eleven E. nutans accessions from Northeastern Qinghai-Tibetan Plateau (ENQ1) and two accessions from Southeastern Qinghai-Tibetan Plateau (SEQ1) were assigned to Cluster 1. Nine accessions (69.2%) in this group were categorized as having admixed ancestry. Ten SEQ1 accessions were assigned to Clusters 2 and 3, the remaining seven accessions were assigned to Cluster 4 based on the proportional membership (>0.5). There was no obvious relationship between geographic location and genetic structure in E. sibiricus accessions (Figure 4C), as demonstrated by 15 accessions from the Northeastern Qinghai-Tibetan Plateau where four in Cluster 1, three in Cluster 2, and eight in Cluster 3. Cluster 3 also included two accessions from the Southeastern Qinghai-Tibetan Plateau. Most admixed lines (42%) from the Mongolian Plateau (MP) and Southeastern Qinghai-Tibetan Plateau (SEQ) were assigned to Clusters 4 and 5.

3.4. Genetic Variation among and within Geographic Groups

Genetic differentiation (Gst) and genetic distance among the four E. nutans and three E. sibiricus geographical groups were calculated based on Nei’s original measures (Table 4). Among the E. nutans groups, the greatest Gst value (0.37) and genetic distance (0.31) were found between Northwestern Qinghai-Tibetan Plateau (NWQ1) and the Mongolian Plateau (MP1). Among the E. sibiricus groups, the greatest genetic differentiation (Gst = 0.09) was found between Southeastern Qinghai-Tibetan Plateau (SEQ2) and the Mongolian Plateau (MP2).
Analysis of molecular variance (AMOVA) was conducted to further evaluate the partitioning of genetic differentiation among and within the geographic groups. The results showed that less than 20% of the variation occurred among the geographic groups, whereas more than 80% of total variance existed within geographic groups (81.47% for E. nutans, 89.32% for E. sibiricus) (Table 5). Moreover, the average Shannon differentiation coefficient was 0.33 for the E. nutans geographic group and 0.25 for E. sibiricus group with a higher gene flow (Nm = 1.96) across all E. sibiricus geographic groups.

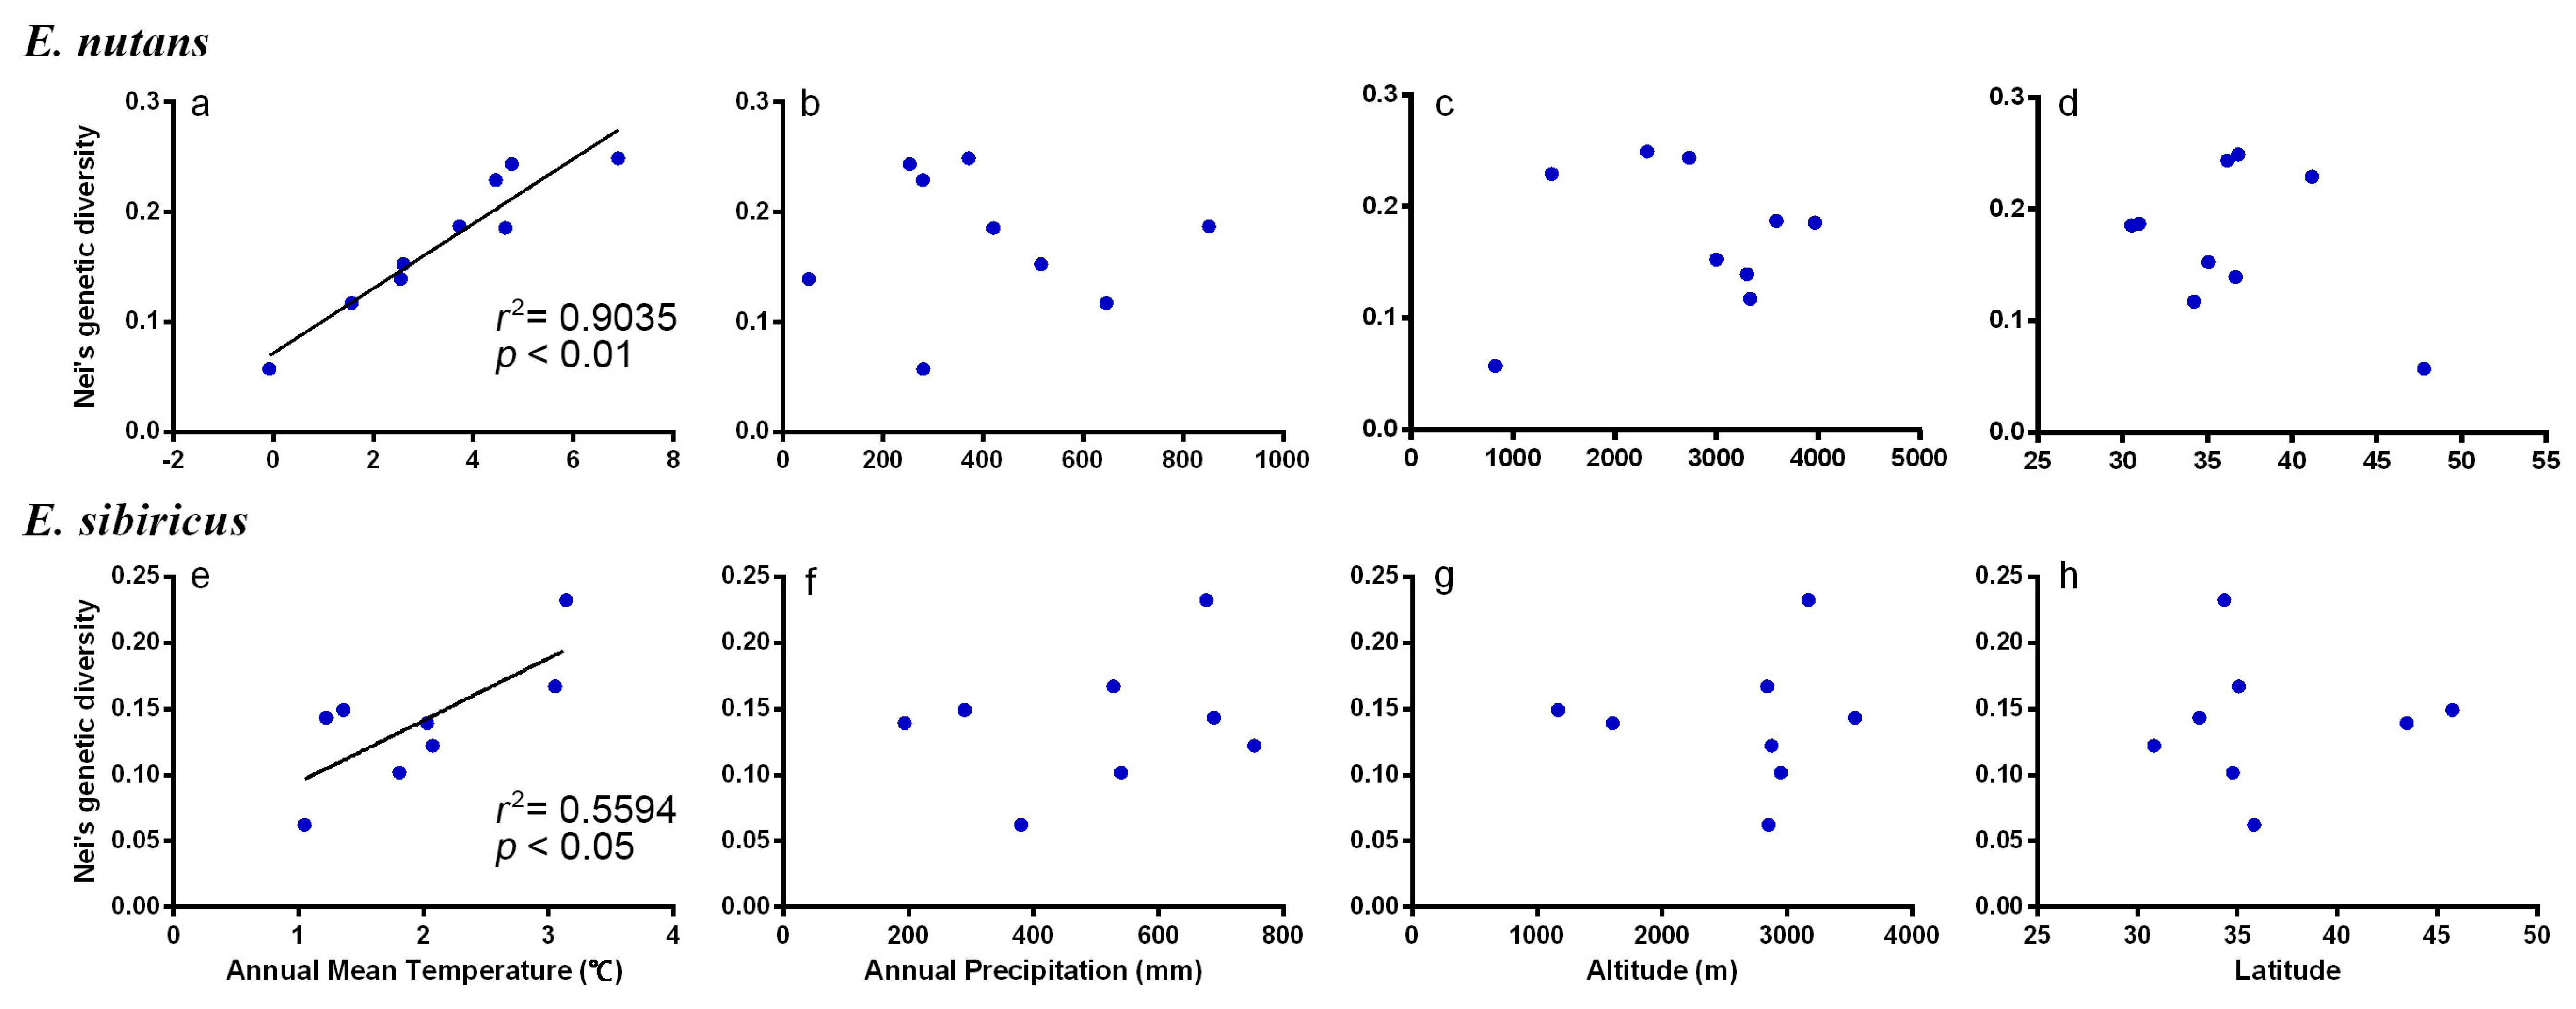
3.5. Association between Habitat Parameters and Genetic Variation

Pearson’s correlation analyses showed that a strong positive correlation between Nei’s genetic diversity and annual mean temperature (r = 0.95 for E. nutans, p < 0.01; r = 0.78 for E. sibiricus, p < 0.05) (Table 6 and Figure 5). While a weakly positive correlation was found between genetic diversity and annual precipitation, altitude as well as latitude change for Elymus groups.

4. Discussion

4.1. Phenotypic and Genetic Diversity between the Two Elymus Species

The measurement of phenotypic traits is considered as an important and fundamental method for diversity analysis [13,39]. Our results showed a relatively high level of phenotypic diversity among the 73 Elymus accessions. Similar results were also found in previous studies. Chen et al. evaluated the phenotypic diversity of 54 E. nutans accessions from Qinghai-Tibetan Plateau based on thirty phenotypic traits, and found 16.05% phenotypic variation [40]. Among these phenotypic traits, leaf traits, spike traits, and some seed traits were dominant factors of phenotypic difference in Elymus species [16,22,40,41]. These traits might be useful for the description and determination of the relationship among different Elymus species. However, the process of phenotypic assessment is time-consuming, and the effectiveness and accuracy of assessment is limited due to the influence of environment factors. Compared with phenotypic assessment, molecular marker technology is an efficient supplement and alternative to phenotypic measurements. Our results showed relatively higher level of genetic diversity of E. sibiricus geographical groups (average PPL = 63.16%) when compared with a previous study. Zhang et al. employed sixteen start codon targeted (SCoT) markers for assessing the genetic diversity of E. sibiricus, and found 37.63% genetic variation among the five geographical groups [42]. Chen et al. analyzed the genetic diversity of 50 E. nutans accessions from the eastern Qinghai-Tibetan Plateau using simple sequence repeat markers (SSRs), and found 91.38% genetic diversity [43]. In this study, although only 14 E. nutans accessions from Southeastern Qinghai-Tibetan Plateau were analyzed, more than 75% genetic diversity was found. Therefore, the results of the present study showed that the two Elymus species had high level of genetic diversity, and also indicated that SSR markers were efficient in assessing the genetic diversity of E. nutans and E. sibiricus accessions.

4.2. Genetic Variation of Geographic Groups and Its Correlation to Environment Factors

In general, E. nutans had a relatively higher genetic diversity when compared with E. sibiricus, possibly due to the additional Y genome in the hexaploid E. nutans and a wider geographic range. Previous studies showed that genetic variability is usually higher in polyploidy species [44]. Based on the AMOVA results, a high level of genetic variation (>80%) was found within the geographical groups of the two Elymus species. Similar results were also found in other self-pollinating Elymus species such as E. trachycaulus and E. glaucus. Steven et al. analyzed four E. trachycaulus populations and found 85% within-population variation using SSR markers [45]. Wilson et al. revealed that 60% of the total genetic variation existed within populations in E. glaucus [46]. The distribution of genetic differences and the patterns of genetic diversity among and within plant populations can be directly and/or indirectly influenced by some factors: plant reproductive mode, random gene flow, gene drift among populations as well as sample size [3,7]. Previous studies have found that seed dispersal of Elymus species played a more important role than pollen movement. Seed dispersal happens more commonly between populations with the same regions at similar altitudes [47]. There are a number of ways in which long-distance seed dispersal can occur including wind-mediated, animal-mediated, and water-mediated seed dispersal. Given the fact that the two species are self-pollinating plant species, we inferred that a significant amount of seed-mediated gene flow among Elymus populations has contributed to their population genetic structure. In addition, the sample size used for the genetic diversity study may have also had a significant effect on the measurements of genetic variability among and within populations [7]. A small sample size from some geographic groups (e.g., four accessions from the Northwestern Qinghai-Tibetan Plateau) may have contributed to a lower estimate of genetic diversity.
Meanwhile, environment parameters are highly correlated with the magnitude and distribution of genetic diversity [7,43]. A species must accumulate more genetic diversity in order to adapt itself to diverse environmental pressures [37]. In this study, a correlation between genetic diversity and the annual mean temperature, annual precipitation, altitude, and latitude change was found for Elymus accessions. In the Qinghai-Tibet Plateau, towering mountains and deep valleys could also serve as genetic barriers of pollinator movement and seed dispersal, which could result in genetic difference among accessions especially in large geographical regions. Therefore, the diversity of geographical origin or ecological conditions of Elymus accessions in this study could explain the relatively high level of genetic diversity.

4.3. Conservation Implications

Phenotypically and genetically diverse germplasm is a potentially valuable source for the improvement of desired agronomic trait such as seed yield, quality and stress tolerance. To broaden the genetic base, one of the important strategies is to screen and develop novel germplasm or breeding lines with desired traits. Wild germplasm could provide advantageous alleles like improved disease resistance, stress resistance, and higher yield for modifying crops by hybridization and introgression [48]. Past studies in wheatgrass [49] and orchard grass [50] have demonstrated incorporation of useful genetic and phenotypic diversity into cultivated material. In addition, Zhang et al. used two wild E. sibiricus genotypes with genetic and phenotypic differences to generate F1 hybrids. The molecular and phenotypic diversity analysis of F1 population revealed rich genetic and phenotypic variations. Seed shattering, flag leaf length and width showed the positive heterosis [51]. Zhao et al. created five hybrid populations by crossing seven wild E. sibiricus genotypes with seed shattering variation, and found high level of genetic diversity in hybrid populations using SSR markers, and the results also suggested more genetic variation could be captured in hybrid populations by crossing breeding [52]. A previous report showed genetic distance between germplasm can be a predictor of combining ability, and suggested that genetically differentiated pool of germplasm was important for plant genetic improvement [50]. Based on our data, Elymus accessions from the Northwestern groups of the Qinghai-Tibetan Plateau had highest level of genetic diversity. The greatest phenotypic differentiation was found for seed shattering. Therefore, these wild accessions with affluent genetic diversity and desired traits could be used as important genetic resources for future Elymus breeding programs.

5. Conclusions

This study showed a high level of phenotypic and genetic diversity of 73 Elymus accessions in Western and Northern China. E. nutans had relatively higher genetic diversity than E. sibiricus at the species level. The ecological factors such as annual temperature, precipitation, altitude played a role in the divergence. More genetic variation of the two Elymus species can be captured when sampling a larger number of germplasm from the Northeastern Qinghai-Tibetan Plateau. Meanwhile, these traits related to biomass yield and seed yield should be considered in future breeding programs.

Supplementary Materials

The following are available online at https://www.mdpi.com/2073-4425/9/3/147/s1. Figure S1: The geographical distribution of E. nutans and E. sibiricus accessions used in the study, Figure S2: The amplification results of 73 Elymus accesions by Elw2807s159, Table S1: Details of seventy-three Elymus accessions used in the study, Table S2: Correlation coefficients obtained from pairwise comparisons of 15 phenotypic traits of E. nutans (above diagonal) and E. sibiricus (below diagonal), Table S3: EST-SSR markers used in this study, amplification results, assigned linkage groups of Elymus.

Acknowledgments

This study was supported by grants from the Chinese National Basic Research Program (2014CB138704), the Program for Changjiang Scholars and Innovative Research Team in University (IRT-17R50), the Open Project Program of State Key Laboratory of Grassland Agro-ecosystems, the 111 project (B12002).

Author Contributions

W.X. and Y.W. conceived the project and designed the experiments. Z.Z. performed the experiments; Z.Z., and W.X. analyzed the data and wrote the manuscript. J.Z., X.Z., and Y.Z. contributed the plant materials. All authors have read and approved the final manuscript.

Conflicts of Interest

The authors declare no conflict of interest.

References

  1. Dewey, D.R. The genomic system of classification as a guide to intergeneric hybridization with the perennial Triticeae. Taxon 1984, 35, 202. [Google Scholar]
  2. Chen, Z.H.; Miao, J.M.; Zhong, J.C.; Ma, X.; Chen, S.Y.; Zhang, X.Q. Genetic diversity of wild Elymus nutans germplasm detected by SRAP markers. Acta Pratacult. Sin. 2009, 18, 192–200. [Google Scholar]
  3. Ma, X.; Chen, S.Y.; Zhang, X.Q.; Bai, S.Q.; Zhang, C.B. Assessment of worldwide genetic diversity of Siberian wild rye (Elymus sibiricus L.) germplasm based on gliadin analysis. Molecules 2012, 17, 4424–4434. [Google Scholar] [CrossRef] [PubMed]
  4. You, M.H.; Liu, J.P.; Bai, S.Q.; Li, D.X.; Yan, J.J.; Zhang, C.B. Influence of row spaces and planting years on yield of fresh grass and seeds of Elymus sibiricus. Pratacult. Sci. 2012, 29, 1278–1284. [Google Scholar]
  5. Lu, B.R. Meiotic studies of Elymus nutans and E. jacquemontii (Poaceae, Triticeae) and their hybrids with Pseudoroegneria spicata and seventeen Elymus species. Plant Syst. Evol. 1993, 186, 193–212. [Google Scholar] [CrossRef]
  6. Knapp, E.E.; Rice, K.J. Genetic structure and gene flow in Elymus glaucus (blue wildrye): Implications for native grassland restoration. Restor. Ecol. 1996, 4, 1–10. [Google Scholar] [CrossRef]
  7. Xie, W.G.; Zhao, X.H.; Zhang, J.Q.; Wang, Y.R.; Liu, W.X. Assessment of genetic diversity of Siberian wild rye (Elymus sibiricus L.) germplasms with variation of seed shattering and implication for future genetic improvement. Biochem. Syst. Ecol. 2015, 58, 211–218. [Google Scholar] [CrossRef]
  8. Lanwrenee, T. Inheritance of a dwarf character in Russian wild ryegrass, Elymus junceus. Can. J. Genet. Cytol. 1967, 9, 126–128. [Google Scholar]
  9. Sharma, H.C.; Gill, B.S. New hybrids between Agropyron and wheat. Theor. Appl. Genet. 1983, 66, 111–121. [Google Scholar] [CrossRef] [PubMed]
  10. Yan, X.B.; Guo, Y.X.; Zhou, H.; Wang, K. Isozyme variability among Elymus species indigenous to the Tibetan and Inner Mongolian Plateaus. Grassl. Sci. 2007, 53, 91–96. [Google Scholar] [CrossRef]
  11. Díaz, O.; Salomon, B.; Bothmer, R.V. Genetic diversity and structure in populations of Elymus caninus (L.) L. (Poaceae). Hereditas 1999, 131, 63–74. [Google Scholar] [CrossRef]
  12. Last, L.; Lüscher, G.; Widmer, F.; Boller, B.; Kölliker, R. Indicators for genetic and phenotypic diversity of Dactylis glomerata in Swiss permanent grassland. Ecol. Ind. 2014, 38, 181–191. [Google Scholar] [CrossRef]
  13. Xie, W.G.; Zhang, X.Q.; Cai, H.W.; Liu, W.; Peng, Y. Genetic diversity analysis and transferability of cereal EST-SSR markers to orchardgrass (Dactylis glomerata L.). Biochem. Syst. Ecol. 2010, 38, 740–749. [Google Scholar] [CrossRef]
  14. Madesis, P.; Abraham, E.M.; Kalivas, A.; Ganopoulos, I.; Tsaftaris, A. Genetic diversity and structure of natural Dactylis glomerata L. populations revealed by morphological and microsatellite-based (SSR/ISSR) markers. Genet. Mol. Res. 2014, 13, 4226–4240. [Google Scholar] [CrossRef] [PubMed]
  15. Zhou, Q.; Luo, D.; Ma, L.C.; Xie, W.G.; Wang, Y.; Wang, Y.R.; Liu, Z.P. Development and cross-species transferability of EST-SSR markers in Siberian wildrye (Elymus sibiricus L.) using illumina sequencing. Sci. Rep. 2016, 6, 20549. [Google Scholar] [CrossRef] [PubMed]
  16. Ravi, M.; Geethanjali, S.; Sameeyafarheen, F.; Maheswaran, M. Molecular marker based genetic diversity analysis in rice (Oryza sativa L.) using RAPD and SSR markers. Euphytica 2003, 133, 243–252. [Google Scholar] [CrossRef]
  17. Huang, H.; Lu, J.; Ren, Z.B.; Hunter, W.; Dowd, S.E.; Dang, P. Mining and validating grape (Vitis L.) ESTs to develop EST-SSR markers for genotyping and mapping. Mol. Breed. 2011, 28, 241–254. [Google Scholar] [CrossRef] [PubMed]
  18. Huang, L.K.; Huang, X.; Yan, H.D.; Yin, G.H.; Zhang, X.Q.; Tian, Y.; Zhang, Y.; Jiang, X.M.; Yan, Y.H.; Ma, X.; et al. Constructing DNA fingerprinting of Hemarthria cultivars using EST-SSR and SCoT markers. Genet. Resour. Crop Evol. 2014, 61, 1047–1055. [Google Scholar] [CrossRef]
  19. Ma, X.; Zhou, Y.H.; Yu, H.Q.; Zhang, H.Q. Genetic diversity of Gliadin in wild germplasm of Elymus nutans Griseb. Hereditas 2006, 28, 699–706. [Google Scholar] [PubMed]
  20. Miao, J.M.; Zhang, X.Q.; Chen, S.Y.; Ma, X.; Chen, Z.H.; Zhong, J.C.; Bai, S.Q. Gliadin analysis of Elymus nutans Griseb. from the Qinghai-Tibetan Plateau and Xinjiang, China. Grassl. Sci. 2011, 57, 127–134. [Google Scholar] [CrossRef]
  21. Yan, J.J.; Bai, S.Q.; Zhang, X.Q.; You, M.H.; Zhang, C.B.; Li, D.X.; Zeng, Y. Genetic diversity of wild Elymus sibiricus germplasm from the Qinghai-Tibetan Plateau in China detected by SRAP markers. Acta Pratacult. Sin. 2010, 19, 173–183. [Google Scholar]
  22. Zhao, X.H.; Jiang, X.; Zhao, K.; Zhao, X.H.; Yin, J.; Xie, W.G. Screening of germplasm with low seed shattering rate and evaluation on agronomic traits in Elymus sibiricus L. J. Plant Gen. Resour. 2015, 16, 691–699. [Google Scholar]
  23. Shan, Z.; Wu, H.L.; Li, C.L.; Chen, H.; Wu, Q. Improved SDS method for general plant genomic DNA extraction. Guangdong Agric. Sci. 2011, 38, 113–115. [Google Scholar]
  24. Bushman, B.S.; Larson, S.R.; Mott, I.W.; Cliften, P.F.; Wang, R.R.; Chatterton, N.J.; Hernandez, A.G.; Ali, S.; Kim, R.W.; Thimmapuram, J.; et al. Development and annotation of perennial Triticeae ESTs and SSR markers. Genome 2008, 51, 779–788. [Google Scholar] [CrossRef] [PubMed]
  25. Shannon, C.E.; Weaver, W. The Mathematical Theory of Communication; University of Illinois Press: Urbana/Chicago, IL, USA, 1949. [Google Scholar]
  26. Zhang, M.Q.; Wang, Y.R.; Zhang, J.Y.; Liu, Z.P.; Zhang, L.; Nie, B.; Zhou, J. A study on genetic diversity of reproductive characters in Elymus nutans germplasm resources. Acta Pratacult. Sin. 2011, 20, 182–191. [Google Scholar]
  27. Deng, W.K.; Wang, Y.B.; Liu, Z.X.; Cheng, H.; Xue, Y. HemI: A Toolkit for Illustrating Heatmaps. PLoS ONE 2014, 9, e111988. [Google Scholar] [CrossRef] [PubMed]
  28. Ge, S.; Wang, M.X.; Chen, Y.W. An analysis of population genetic structure of masson pine by isozyme technique. Sci. Silvae Scin. 1988, 24, 399–409. [Google Scholar]
  29. Ghislain, M.; Zhang, D.P.; Fajardo, D.; Huamán, Z.; Hijmans, R.J. Marker-assisted sampling of the cultivated Andean potato Solanum phureja collection using RAPD markers. Genet. Resour. Crop Evol. 1999, 46, 547–555. [Google Scholar] [CrossRef]
  30. Peakall, R.; Smouse, P.E. GenAlEx 6.5: Genetic analysis in Excel. Population genetic software for teaching and research—An update. Bioinformatics 2012, 28, 2537–2539. [Google Scholar] [CrossRef] [PubMed]
  31. Yeh, F.C.; Boyle, T.J.B. Population genetic analysis of co-dominant and dominant markers and quantitative traits. Belg. J. Bot. 1997, 129, 157. [Google Scholar]
  32. Rohlf, F.J. NTSYS-pc-Numerical Taxonomy and Multivariate Analysis System; Exeter Software: Setauket, NY, USA, 1988. [Google Scholar]
  33. Yap, I.V.; Nelson, R.J. Winboot: A Program for Performing Bootstrap Analysis of Binary Data to Determine the Confidence Limits of UPGMA-based Dendrograms; International Rice Research Institute: Manila, Philippines, 1996. [Google Scholar]
  34. Pritchard, J.K.; Stephens, M.; Donnelly, P. Inference of population structure using multilocus genotype data. Genetics 2000, 155, 945–959. [Google Scholar] [PubMed]
  35. Evanno, G.; Regnaut, S.; Goudet, J. Detecting the number of clusters of individuals using the software STRUCTURE: A simulation study. Mol. Ecol. 2005, 14, 2611–2620. [Google Scholar] [CrossRef] [PubMed]
  36. Excoffier, L.; Smouse, P.E.; Quattro, J.M. Analysis of molecular variance inferred from metric distances among DNA haplotypes: Application to human mitochondrial DNA restriction data. Genetics 1992, 131, 479–491. [Google Scholar] [PubMed]
  37. Zhang, C.L.; Zhang, J.B.; Fan, Y.; Sun, M.; Wu, W.D.; Zhao, W.D.; Yang, X. P; Huang, L.K.; Peng, Y.; Ma, X.; et al. Genetic structure and eco-geographical differentiation of wild sheep fescue (Festuca ovina L.) in Xinjiang, Northwest China. Molecules 2017, 22, 1316. [Google Scholar] [CrossRef] [PubMed]
  38. Mantel, N. The detection of disease clustering and a generalized regression approach. Cancer Res. 1967, 27, 209–220. [Google Scholar] [PubMed]
  39. Shehzad, T.; Okuizumi, H.; Kawase, M.; Okuno, K. Development of SSR-based sorghum (Sorghum bicolor (L.) Moench) diversity research set of germplasm and its evaluation by morphological traits. Genet. Resour. Crop Evol. 2009, 56, 809–827. [Google Scholar] [CrossRef] [Green Version]
  40. Chen, S.Y.; Chen, Z.H.; Zhou, Q.P.; Li, S.D.; Ma, X.; Zhang, X.Q. Study on morphological diversity of Elymus nutans germplasm resources from Qinghai-Tibetan Plateau. Chin. J. Grassl. 2016, 38, 27–33. [Google Scholar]
  41. Zhang, J.B.; Bai, S.Q.; Zhang, X.Q.; Ma, X.; Yan, J.J.; Zhang, C.B.; You, M.H. Study on ear characters of Elymus nutans Griseb. in the northwestern plateau of Sichuan province. J. Sichuan Univ. 2009, 46, 1505–1509. [Google Scholar]
  42. Zhang, J.C.; Xie, W.G.; Wang, Y.R.; Zhao, X.H. Potential of Start Codon Targeted (SCoT) Markers to Estimate Genetic Diversity and Relationships among Chinese Elymus sibiricus Accessions. Molecules 2015, 20, 5987–6001. [Google Scholar] [CrossRef] [PubMed]
  43. Chen, S.Y.; Zhang, X.Q.; Ma, X.; Huang, L.K. Assessment of genetic diversity and differentiation of Elymus nutans indigenous to Qinghai-Tibet Plateau using simple sequence repeats markers. Can. J. Plant Sci. 2013, 93, 1089–1096. [Google Scholar] [CrossRef]
  44. Xie, W.G.; Zhang, X.Q.; Ma, X.; Cai, H.W.; Huang, L.K.; Peng, Y.; Zeng, B. Diversity comparison and phylogenetic relationships of cocksfoot (Dactylis glomerata L.) germplasm as revealed by SSR markers. Can. J. Plant Sci. 2010, 90, 13–21. [Google Scholar] [CrossRef]
  45. Stevens, L.; Salomon, B.; Sun, G. Microsatellite variability and heterozygote excess in Elymus trachycaulus population from British Columbia in Canada. Biochem. Syst. Ecol. 2007, 35, 725–736. [Google Scholar] [CrossRef]
  46. Wilson, B.L.; Kitzmiller, J.; Rolle, W.; Hipkins, V.D. Isozyme variation and its environmental correlates in Elymus glaucus from California Floristic Province. Can. J. Bot. 2001, 79, 139–153. [Google Scholar]
  47. Yan, X.B.; Guo, Y.X.; Liu, F.Y.; Zhao, C.; Liu, Q.L.; Lu, B.R. Population structure affected by excess gene flow in self-pollinating Elymus nutans and E. burchan-buddae (Triticeae: Poaceae). Popul. Ecol. 2010, 52, 233–241. [Google Scholar] [CrossRef]
  48. Huang, H.; Liu, Y. Natural hybridization, introgression breeding, and cultivar improvement in the genus actinidia. Tree Genet. Genomes 2014, 10, 1113–1122. [Google Scholar] [CrossRef]
  49. Jensen, K.B.; Mott, I.W.; Robins, J.G.; Waldron, B.L.; Nelson, M. Genetic improvement and diversity in Snake River wheatgrass (Elymus wawawaiensis) (Poaceae: Triticeae). Rangel. Ecol. Manag. 2012, 65, 76–84. [Google Scholar] [CrossRef]
  50. Robins, J.G.; Bushman, B.S.; Jensen, K.B. Dry matter yield combing ability among nine sources of cocksfoot germplasm. Euphytica 2012, 188, 419–428. [Google Scholar] [CrossRef]
  51. Zhang, Z.Y.; Zhang, J.C.; Zhao, X.H.; Xie, W.G.; Wang, Y.R. Assessing and broadening genetic diversity of Elymus sibiricus germplasm for the improvement of seed shattering. Molecules 2016, 21, 869. [Google Scholar] [CrossRef] [PubMed]
  52. Zhao, X.H.; Zhang, J.C.; Zhang, Z.Y.; Wang, Y.R.; Xie, W.G. Hybrid identification and genetic variation of Elymus sibiricus hybrid populations using EST-SSR markers. Hereditas 2017, 154, 15. [Google Scholar] [CrossRef] [PubMed]
Figure 1. Clustering and Heatmap analysis of the 73 Elymus accessions using fifteen phenotypic traits. All of the 73 Elymus accessions were clustered in ten subgroups. Each line and column represents different accessions and different traits, respectively.
Genes 09 00147 g001
Figure 2. Unweighted pair group method with arithmetic mean (UPGMA)-derived dendrogram of 73 Elymus accessions based on Jaccard’s genetic similarity, only bootstrap values higher than 50% are presented. The species and geographical groups each individual belongs to refer to right codes.
Genes 09 00147 g002
Figure 3. Principal coordinates analysis (PCoA) for the first and second coordinates estimated for EST-SSR markers using Jaccard’s genetic similarity matrix for seven groups of Elymus accessions. Different groups were distinguished by different colors and shapes. Red triangle: NEQ1; green triangle: NWQ1; blue triangle: SEQ1; pink triangle: MP1; red square: NEQ2; blue square: SEQ2; pink square: MP2.
Genes 09 00147 g003
Figure 4. Population structure of 73 Elymus accessions based on Bayesian inferred from STRUCTURE program with 40 EST-SSR markers data set. Each structure was described by using two graphics of the process to detect the optimum K value. One was the mean L (K) over 20 runs for each K value (1–11), another was the maximum delta K values used to determine the uppermost level of structure for K ranging from 2 to 10. Different code and corresponding vertical lines represent an individual genotype and different colors represent genetic stock. (A) 73 accessions were clustered into two groups at K = 2. Red zone: 31 E. nutans accessions and 1 E. sibiricus accessions; Green zone: 35 E. sibiricus accessions and 6 E. nutans accessions; (BI) E. nutans accessions were clustered into two groups (K = 2); (BII) E. nutans accessions from QTP were clustered into four groups (K = 4); and (C) E. sibiricus accessions were clustered into five groups (K = 5).
Genes 09 00147 g004
Figure 5. Regression analysis between Nei’s genetic diversity (H) and environmental factors for E. nutans and E. sibiricus. A regression line was fitted only for analyses with p < 0.05.
Genes 09 00147 g005
Table 1. Variance portion of each trait among geographic groups (AP) and within geographic groups (WP), phenotypic differentiation coefficient (Pst) for 15 traits within and between two Elymus species (Pst (S)).
TraitsE. nutansE. sibiricusPst (S)
Variance PortionPercent of Variance Portion (%)Pst Variance PortionPercent of Variance Portion (%)Pst
AP (σ2t/s)WP (σ2s)AP (σ2t/s)WP (σ2s)AP (σ2t/s)WP (σ2s)AP (σ2t/s)WP (σ2s)
FL6.2314.4321.3449.4030.17%2.148.6710.9944.5319.80%5.02%
FW1.192.9418.5245.9328.74%0.010.0515.4160.2920.37%1.86%
LB3.4615.0811.7751.3418.65%2.095.9211.9133.7126.10%6.60%
WB0.882.8414.8347.5923.76%0.020.0423.2049.9431.73%3.93%
PH29.18138.0911.5754.7817.44%210.93155.0739.6729.1657.63%0.00%
CN0.020.343.5953.456.29%0.020.480.0055.210.00%16.56%
TN22.411175.190.9147.911.87%81.55823.073.4935.249.02%11.72%
CD0.000.070.0029.550.00%0.350.230.000.250.00%8.94%
SL0.655.690.0048.670.00%0.697.885.1358.238.09%5.10%
FN128.25797.297.0443.7513.86%170.48432.2215.2538.6728.29%0.00%
LL0.010.0110.9546.8618.95%0.010.0118.7835.9034.35%3.79%
WL0.010.010.2147.040.44%0.000.000.000.910.00%0.00%
AL0.010.0811.6065.6615.02%0.010.033.5360.375.53%18.44%
SW10.040.426.7877.788.02%0.061.174.6187.565.00%3.10%
SS1.5020.641.7624.156.78%1.089.095.0943.1410.57%23.43%
Mean12.92144.878.0648.9212.67%31.2996.2610.4742.2117.10%7.23%
Table 2. The phenotypic diversity coefficient of 15 traits and the first three principal components of phenotypic variation for E. nutans (left) and E. sibiricus (right) accessions.
TraitsRangeMean ValueStandard DeviationCVH’PCA of E. nutansPCA of E. sibiricus
ENESENESENESENESENESPC1PC2PC3PC1PC2PC3
Leaf traitsFL (cm)7.20–25.607.50–23.4012.3812.291.931.6415.66%13.61%2.152.080.78−0.370.320.71−0.42−0.11
FW (mm)4.90–13.805.30–12.909.319.121.010.9911.28%11.14%2.112.170.860.15−0.170.88−0.260.20
LB (cm)12.60–30.8013.30–25.6019.0019.032.181.6311.62%8.54%1.902.080.78−0.410.190.81−0.29−0.11
WB (mm)6.10–15.105.90–13.8010.9110.441.041.049.88%10.26%2.232.070.840.09−0.330.82−0.180.30
Stems traitsPH (cm)44.30–99.6046.70–114.9071.0972.126.567.559.54%10.70%1.982.080.140.66−0.490.500.34−0.33
CN (No.)1.00–4.501.00–5.302.973.750.390.4913.25%13.69%2.072.220.600.270.210.18−0.340.43
TN (No.)65.60–214.579.30–198.60110.95130.7623.1025.9220.46%19.97%1.932.090.36−0.490.150.15−0.11−0.36
CD (mm)1.60–3.101.40–3.402.432.300.290.2911.89%12.33%1.871.980.260.25−0.650.570.46−0.51
Spike and seed traitsSL (cm)12.30–24.7011.10–24.7018.6317.571.571.468.52%8.47%2.102.210.55−0.03−0.130.330.69−0.04
FN (No.)56.10–211.368.20–155.00128.57113.5524.1717.7919.88%15.47%2.112.120.48−0.540.170.120.300.50
LL (mm)7.30–10.607.30–12.309.219.590.460.694.99%7.12%2.152.050.350.680.260.250.66−0.15
WL (mm)1.00–1.801.10–1.701.491.410.140.139.55%9.43%2.221.900.170.640.540.09−0.050.69
AL (mm)5.00–19.008.90–15.6013.4511.521.141.028.67%9.03%2.132.260.200.19−0.450.150.260.49
SW1 (g)1.10–4.001.00–5.002.362.710.190.218.51%8.64%1.811.510.370.650.470.120.710.30
SS (gf)11.70–33.009.30–28.2019.5414.745.522.2128.11%15.45%1.642.07−0.430.210.480.020.510.29
Mean 12.79%11.59%2.032.06
EV 4.272.802.053.472.672.00
%V 28.4418.6413.7023.1317.7713.34
C% 28.4447.0860.7723.1340.9054.24
EN, E. nutans accessions; ES, E. sibiricus accessions; FL, flag leaf length; FW, flag leaf width; LB, length of second leaf from bottom; WB, width of second leaf from bottom; PH, plant height; CN, culm node number; TN, tiller number; CD, culm diameter; SL, spike length; FN, floret number per spike; LL, length of lemma; WL, width of lemma; AL, awn length of lemma; SW1, 1000 seed weight; SS, seed shattering; CV, coefficient of variation; H’, Shannon’s diversity index; EV, eigenvalues; %V, % of variance; C%, Cumulative %.
Table 3. Environmental parameters of geographic regions and genetic variability within four E. nutans and three E. sibiricus groups.
SpeciesPopAMT (°C)AP (mm)A (m)L (N)NNPLPPL (%)NPBNaNeIH
E. nutansNEQ14.00446.202819.3035°63′1435988.6441.82 ± 0.031.45 ± 0.020.42 ± 0.010.27 ± 0.01
NWQ12.5051.303300.0036°67′415638.5201.02 ± 0.041.24 ± 0.020.21 ± 0.010.14 ± 0.01
SEQ14.20636.503779.3030°75′1430675.5651.63 ± 0.031.36 ± 0.020.34 ± 0.010.22 ± 0.01
MP12.60279.701158.0043°82′528369.88111.50 ± 0.041.38 ± 0.020.35 ± 0.010.23 ± 0.01
Mean 276.068.155.01.49 ± 0.021.36 ± 0.010.33 ± 0.010.22 ± 0.01
47
E. sibiricusNEQ22.30521.802930.9035°06′1631181.84621.78 ± 0.031.37 ± 0.020.36 ± 0.010.23 ± 0.01
SEQ21.60717.303244.4032°10′920453.6831.29 ± 0.041.29 ± 0.020.27 ± 0.010.18 ± 0.01
MP21.70237.601405.8044°52′1120553.9551.31 ± 0.041.28 ± 0.020.26 ± 0.010.17 ± 0.01
Mean 240.063.1623.301.46 ± 0.021.31 ± 0.010.29 ± 0.010.19 ± 0.01
40
AMT, annual mean temperature; AP, annual precipitation; A, altitude; L, latitude; N, sample size; NPL, the number of polymorphic loci; PPL, the percentage of polymorphic loci; NPB, number of private bands; Na, observed number of alleles; Ne, effective number of alleles; I, Shannon’s Information index; H, Nei’s genetic diversity.
Table 4. Pairwise genetic differentiation (Gst) (below diagonal) and pairwise genetic distance (above diagonal) among four E. nutans and three E. sibiricus groups based on Nei’s original measures.
E. nutansNEQ1NWQ1SEQ1MP1
NEQ1 0.110.050.14
NWQ10.17 0.090.31
SEQ10.070.17 0.23
MP10.170.370.26
E. sibiricusNEQ2SEQ2MP2
NEQ2 0.040.05
SEQ20.08 0.04
MP20.090.09
Table 5. Analysis of molecular variance (AMOVA) of in four E. nutans and three E. sibiricus geographic groups.
SpeciesSource of VarianceDegrees of FreedomSum of SquaresMean SquareVariance ComponentsTotal Variancep-Value
E. nutansAmong geographic groups3503.15167.7213.07 18.53%<0.001
Within geographic groups331897.0657.4956.4981.47%<0.001
Total362400.21 69.56
E. sibiricusAmong geographic groups2218.15109.085.45 10.68%<0.001
Within geographic groups331505.4345.6245.62 89.32%<0.001
Total351723.58 51.07
Table 6. Regression analysis between Nei’s genetic diversity (H) and environmental factors.
SpeciesPearson CoefficientAnnual Mean TemperatureAnnual PrecipitationAltitudeLatitude
E. nutansr0.95−0.030.16−0.39
p<0.01 **0.95 ns0.68 ns0.29 ns
E. sibiricusr0.780.280.040.03
p0.03 *0.51 ns0.92 ns0.95 ns
** p < 0.01, * p < 0.05, ns = not significant.

