A Novel Hybrid Sequence-Based Model for Identifying Anticancer Peptides

1
School of Electronic and Communication Engineering, Shenzhen Polytechnic, Shenzhen 518060, China
2
Key Laboratory of Optoelectronic Devices and Systems of Ministry of Education and Guangdong Province, College of Optoelectronic Engineering, Shenzhen University, Shenzhen 518060, China
*
Author to whom correspondence should be addressed.
Genes 2018, 9(3), 158; https://doi.org/10.3390/genes9030158
Submission received: 24 January 2018
/
Revised: 14 February 2018
/
Accepted: 27 February 2018
/
Published: 13 March 2018
(This article belongs to the Special Issue Selected Papers from the Bioinformatics and Intelligent Information Processing Conference (BIIP2018))
Abstract
:Cancer is a serious health issue worldwide. Traditional treatment methods focus on killing cancer cells by using anticancer drugs or radiation therapy, but the cost of these methods is quite high, and in addition there are side effects. With the discovery of anticancer peptides, great progress has been made in cancer treatment. For the purpose of prompting the application of anticancer peptides in cancer treatment, it is necessary to use computational methods to identify anticancer peptides (ACPs). In this paper, we propose a sequence-based model for identifying ACPs (SAP). In our proposed SAP, the peptide is represented by 400D features or 400D features with g-gap dipeptide features, and then the unrelated features are pruned using the maximum relevance-maximum distance method. The experimental results demonstrate that our model performs better than some existing methods. Furthermore, our model has also been extended to other classifiers, and the performance is stable compared with some state-of-the-art works.
1. Introduction
Cancer is a serious health issue worldwide [1,2], and millions of people die of it. Traditional treatment methods focus on killing cancer cells, but at the same time normal cells are also killed and there are high costs involved [3,4]. However, this situation has changed with the discovery of anticancer peptides (ACPs). Because ACPs can interact with the anionic cell membrane components of cancer cells, cancer cells can be killed selectively by the ACPs without impairing the normal cells [5,6]. Anticancer peptides do not impair the body’s physiological functions, providing a new direction for cancer treatment. Though there exist drawbacks in the development process of ACPs, ACPs are safer than synthetic drugs, and have greater efficacy, selectivity, and specificity [7,8]. ACPs represent a promising line of treatment [5,6]. Thus, treatment methods involving anticancer peptides have been receiving increasing attention. ACPs are represented by short peptides with 5 to 30 amino acids. However, it is still difficult to distinguish ACPs from other (natural or artificially designed) peptides. It is quite expensive and time-consuming to identify anticancer peptides using experimental methods. Moreover, only few of them can be applied in clinics [9]. Therefore, it is necessary to use computational methods to predict anticancer peptides. The identification of ACPs could prompt their application in cancer treatment, so it is urgent to use computational methods to predict anticancer peptides.
There have been some works on identifying ACPs by computational methods. Tyagi et al. [10] used the support vector machine for classifying the type of ACPs, in which amino acid composition and binary profiles are considered as features to represent the peptides. Hajisharifi et al. [11] proposed a model based on the local alignment kernel method to predict the ACPs. Chen et al. [12] developed a powerful sequence-based method to discriminate anticancer ACPs, and better results were demonstrated through cross validation. All the mentioned methods have reported encouraging results for ACP prediction.
However, for the purposes of prompting the application of ACPs into cancer treatment quickly, it is important to develop an efficient model for predicting ACPs. The experimental results show that sequence-based methods [13,14,15,16] perform better than the previous methods [10,11] by considering the sequence pattern information. In our work, the peptides are represented by Pseudo amino acid composition (PseACC) g-gap dipeptide mode and 400D features. The g-gap dipeptide model [12] is a sequence-based feature which describes the occurrence frequency of the g-gap dipeptide. Meanwhile, 400D is a feature of the occurrence frequency of consecutive amino acid residue in the proteins. Afterwards, the features are reduced by using the maximum relevance-maximum distance method [17]. Then, the unrelated features are pruned by maximum distance. Moreover, the model is applied to three classifiers, such as random forest, ensemble classification, and support vector machine, respectively. The model performs more stably than some existing methods with respect to some performance metrics.
This work provides several main contributions. Firstly, we proposed a sequence-based model (called sequence-based model for identifying ACP (SAP)) for predicting ACPs, which performs stably on different classifiers. Secondly, in our proposed SAP, the peptides are represented by PseACC with g-gap dipeptide composition mode and 400D features, which can describe the sequence pattern information. Thirdly, features are pruned by the maximum relevance-maximum distance method without affecting the performance of the predictor.
2. Material and Methods
2.1. Integration of Anticancer and Non-Anticancer Peptide Sources
In this section, the construction of the benchmark data set is introduced. Though there are larger data sets [18], to compare with related work, we used the data set in [19]. The data set includes anticancer peptides and non-anticancer peptides. The set of anticancer peptides is represented as C+, and the non-anticancer peptides are represented as C−. Thus, the union of the C+ and C− is the benchmark data set.
According to the property of data sets, the intersection of the C+ and C− should be empty. Hence, there is
Set C+ contains 138 anticancer peptides, which are selected from the data set of Chen et al. [19]. The 138 positive samples are selected from the antimicrobial peptides database [20]. To reduce redundancy and avoid homology bias, peptides with more than 90% sequence similarity to each other are removed from the data set by Cluster Database at High Identity with Tolerance (CD-HIT) [21]. CD-HIT is a type of software used for reducing the similarity of the protein sequences. Finally, there are 206 non-anticancer peptides and 138 anticancer peptides in data set C for the experiments.
2.2. Features for Peptide Representation
The features used for peptides representation are introduced in this section. The flow chart of our sequence-based identifying anticancer peptides model is illustrated first. Figure 1 shows the peptides are represented by the features (i.e., 400D or g-gap dipeptide composition). Then, the features are selected by the maximum relevance-maximum distance (MRMD) method. It denotes the maximum relevance-maximum distance method for dimension reduction. The features are ranked by the MRMD method, and then some features are pruned for the purpose of balancing the accuracy and stability of feature ranking and the prediction task. The MRMD method will be illustrated in detail in Section 2.3 (Feature Selection). The peptides are predicted by the classifiers (i.e., the support vector machine (SVM) in our model).
In our SAP, the sequence pattern information is represented by 400D features and PseACC with g-gap dipeptide composition. The 400D features will be introduced first. The features of PseACC with g-gap dipeptide composition will be described later.
There is a peptide sample P with L residues, and a straightforward method for peptide P representation is
where R1 is the 1-st residue of P, and RL is the l-th residue of the peptide. fi is used to represent the normalized occurrence frequency of the i-th type of native amino acid in the peptide. Thus, the peptide P is represented by R = [f1,…fi,…,f20]. However, the sequence information is lost in the frequency feature.
P = R1R2R3…RL
In contrast to previous works, the proposed model considers the sequence information (Tyagi et al., 2014). The 400D features are sequence-based features. There are 20 amino acids used to represent the protein, so the combination of two consecutive amino acids is represented as AB. The frequency of the combination of AB is denoted as fAB. Thus, there are 400(202) possible combinations of each two amino acids. The 400D features are represented by the frequencies of the 400 combinations. Thus, the value of each dimension of 400D represents the occurrence times of each two consecutive amino acids. The pattern information is described in the 400D features.
Pseudo amino acid composition [22,23] and Chou’s PseACC [24,25,26] are usually used to extract the sequence pattern information of the protein. Some more recent special protein identification methods [27,28,29] also use the features. Pseudo amino acid composition [22] has been used in many fields of protein attribute predictions [27,28,30,31,32,33,34,35,36,37,38,39,40,41,42], as well as in drug development [43] and studies on the drug target area [44,45]. In contrast to previous works, g-gap dipeptide composition is considered in Chen’s work [12]. Given the peptide P as shown in Equation (3), the g-gap dipeptide composition is shown as
where denotes the occurrence frequency of the u-th g-gap dipeptide in P. is calculated by Equation (5) [12].
where is the number of the u-th g-gap dipeptide. For the short peptides, the range of g is usually up to 4. When g equals 0, the dipeptide composition is formed by the nearest residues. When g is 1, the second nearest residues are considered, and so forth.
The features of 400D and pseudo amino acids are integrated together to represent the peptide P. A redundancy may exist between the features, and thus the unrelated features are pruned by the MRMD method [17].
2.3. Feature Selection
The objective function of MRMD is shown as Equation (6). If m-1 features have been selected, the m-th feature will be selected if the i-th feature maximizes Equation (6).
where MRi is the relevance between the features. The relevance is measured by the Pearson’s correlation coefficient, shown as Equation (7).
where N is the number of vectors, and is the average value on the k-th dimension. MDi is used to measure the level of similarity between two feature vectors. In our experiments, the maximum distance is calculated as the mean of the Euclidean distance (ED), cosine distance (COS) and Tanimoto coefficient (TC) (shown as Equation (11)). The maximum distances used are defined as follows.
In Equations (8)–(11), M is the number of features. The distance on each dimension is calculated, and the feature with the maximum distance will be selected by satisfying Equation (6).
2.4. Classification Methods
The basic idea of classification is learning the parameters of the classifier by the training data. There are N tuples in the training set , and . C is the label set of the data. C is the number of classes. Each sample is represented by a multi-dimensional vector, such as , where M is denoted as the dimension number. The goal of classification is to train the parameters of the classifier by the training set with the minimum accuracy loss.
In our SAP, the SVM is used to classify the anticancer peptides and non-anticancer peptides. The objective function of SVM is shown as Equation (12) [46]. The goal of SVM is to find a hyperplane (w) that can maximize the distance between the samples of different classes.
where is the label of the training sample , and b is the bias.
2.5. Evaluation Criteria and Measurement
The evaluation criteria are introduced in this part. Five metrics are used to evaluate the performance of the predictors, which are specificity (SP), sensitivity (SN), overall accuracy (Acc), Mathews correlation coefficient (MCC), and the F-score, respectively. is denoted as the number of anticancer peptides labeled by the classifier, and is the number of anticancer peptides misclassified by the non-anticancer peptides. is denoted as the number of non-anticancer peptides labeled by the classifier, and is the number of non-anticancer peptides labeled by the anticancer peptides.
Sensitivity is used in Chou’s work [47] and represents the sensitivity, which is calculated by Equation (13). Specificity is the specificity of the algorithm, which is measured by the rate of misclassification of the anticancer peptide. The calculation of Sp is shown as Equation (14). Assessments of Sp or Sn individually are not sufficient to evaluate the performance of a method. The overall accuracy is calculated by Equation (15). Mathews correlation coefficient considers the rate of both Sp and Sn, as shown in Equation (16).
There are u peptides labeled by anticancer peptides, and there are v real anticancer peptides in u. Precision (P) is . There are v real anticancer peptides labeled by the classifier, and there are w anticancer peptides in the data set. The recall (R) is . Precision and recall are considered in F-score [48]. The calculation of the F-score is shown in Equation (17).
The performance of the methods is measured by the abovementioned five metrics. Accuracy is the average accuracy of the method. Mathew’s correlation coefficient describes the stability of the algorithms. F-score reflects the trade-off between the precision and accuracy.
3. Results
3.1. Contrast Experiments Based on 400-Dimensional Classical Features
Experiment (1): The experiments are running on iACP (ACP identifying tool) and SAP. The results are reported based on ten cross validations. Table 1 shows the classification performance of our model compared with iACP [19].
The experimental results show that our proposed method by using 400D features performs better than iACP [19] on all the five metrics. The MCC value for our method is 0.8301, and the MCC value of iACP is 0.8058. iACP is a predictor based on the SVM, and the peptide is represented by g-gap dipeptide model. Our model improves the MCC of iACP by nearly 3%. The F-score of SAP is 0.8947 while the F-score of iACP is 0.8788. The F-score of iACP is improved by 1.6% using our method. The experimental results show that our method can identify the anticancer peptides accurately.
3.2. Contrast Experiments Based on Integrated Features
Experiment (2): The experiments are run on the selected integrated features of the data set. The peptides are represented by the 400D and g-gap dipeptide features used in [19]. Each peptide is described by a high-dimensional vector. The features will be pruned by the maximum relevance-maximum distance methods. Table 2 shows the results of the experiments.
The results of Experiment (2) show that the proposed SAP still performs the best compared with two other algorithms. However, the accuracy of the selected SAP, whose features are pruned by the maximum relevance-maximum distance method, is comparable to that of iACP, which means that the features of selected SAP can also classify the peptides well. The specificity of the selected SAP reaches to 0.966, which is better than for SAP and iACP.
3.3. Comparison with State-of-the-Art Methods
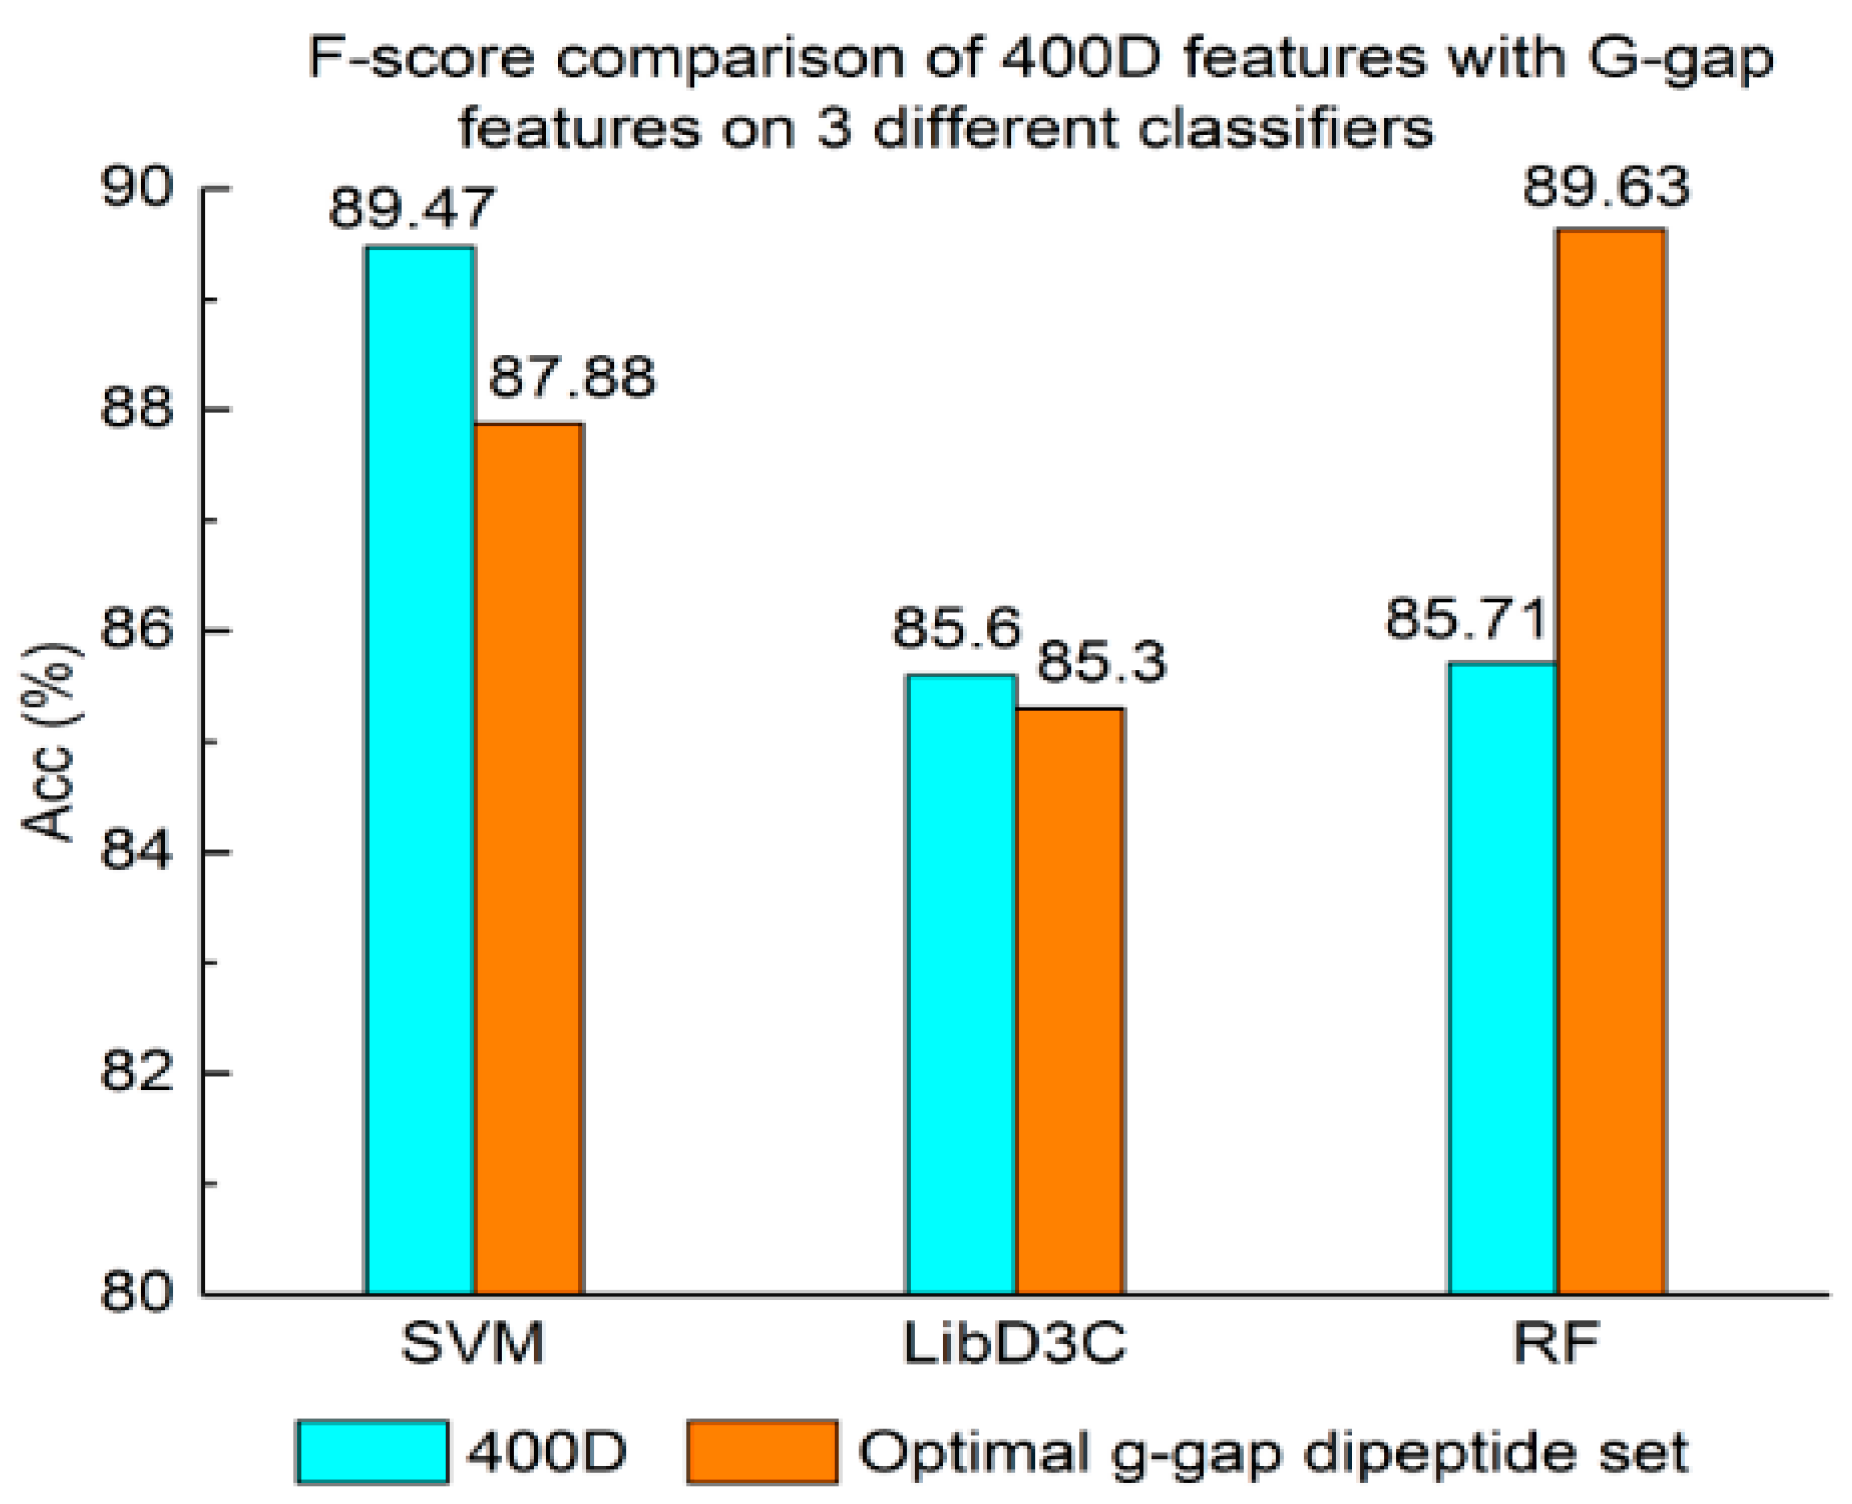
Experiment (3): For the purpose of demonstrating the efficiency of SAP used in our method, the proposed model is compared with the features used in iACP [19]. Figure 2, Figure 3 and Figure 4 show the metrics of the Acc, MCC, and F-score of 400D features compared with g-gap dipeptide composition on three classifiers (support vector machine, random forests, and LibD3C [49]).
The random forest (RF) ensemble algorithm [50,51] trains a few decision trees together. The training samples are selected by bagging sampling, which means that the samples will be put back into the data set after each selection. The training samples on each decision tree can be overlapped. The key idea of random forest is m features are selected from M dimensions on each decision tree, and t decision tree will be trained. Then, a decision is made by a voting process.
In random forest, the features are evaluated by the information gain. The information gain is used to find the features and the threshold, and the formula is shown in Equation (18) [50,51].
where si is the i-th sample in the training set, and is the probability of class .
LibD3C is a selective ensemble model. In the model, a number of candidate classifiers are trained, and the classifiers which are accurate and diverse will be selected. LibD3C is a hybrid model of ensemble pruning which is based on K-means clustering and the combination of dynamic selection and circulating [49].
The performance of 400D compared with g-gap features is shown in Figure 2, Figure 3 and Figure 4. The 400D features perform better when SVM or LibD3C is used. However, on the RF algorithm, the method of 400D features does not perform better than g-gap features on Acc, MCC, and F-score. However, in the experiments the performance of RF using the selected features is compatible to that of RF using g-gap features (shown in Figure 5, Figure 6 and Figure 7). In the experiments, the g-gap features perform best on the RF classifier. The accuracy of 400D using SVM and g-gap with the RF algorithm is the best, at 0.9186. The lowest accuracy is g-gap on the LibD3C. The best MCC is 0.8301, which uses 400D features on the SVM. The lowest MCC is 0.7529 when g-gap features are used to classify the peptides by LibD3C. The lowest F-score is 0.853 when LibD3C is used with g-gap features. The highest F-score is 0.8963 when RF classifies the peptides with g-gap features.
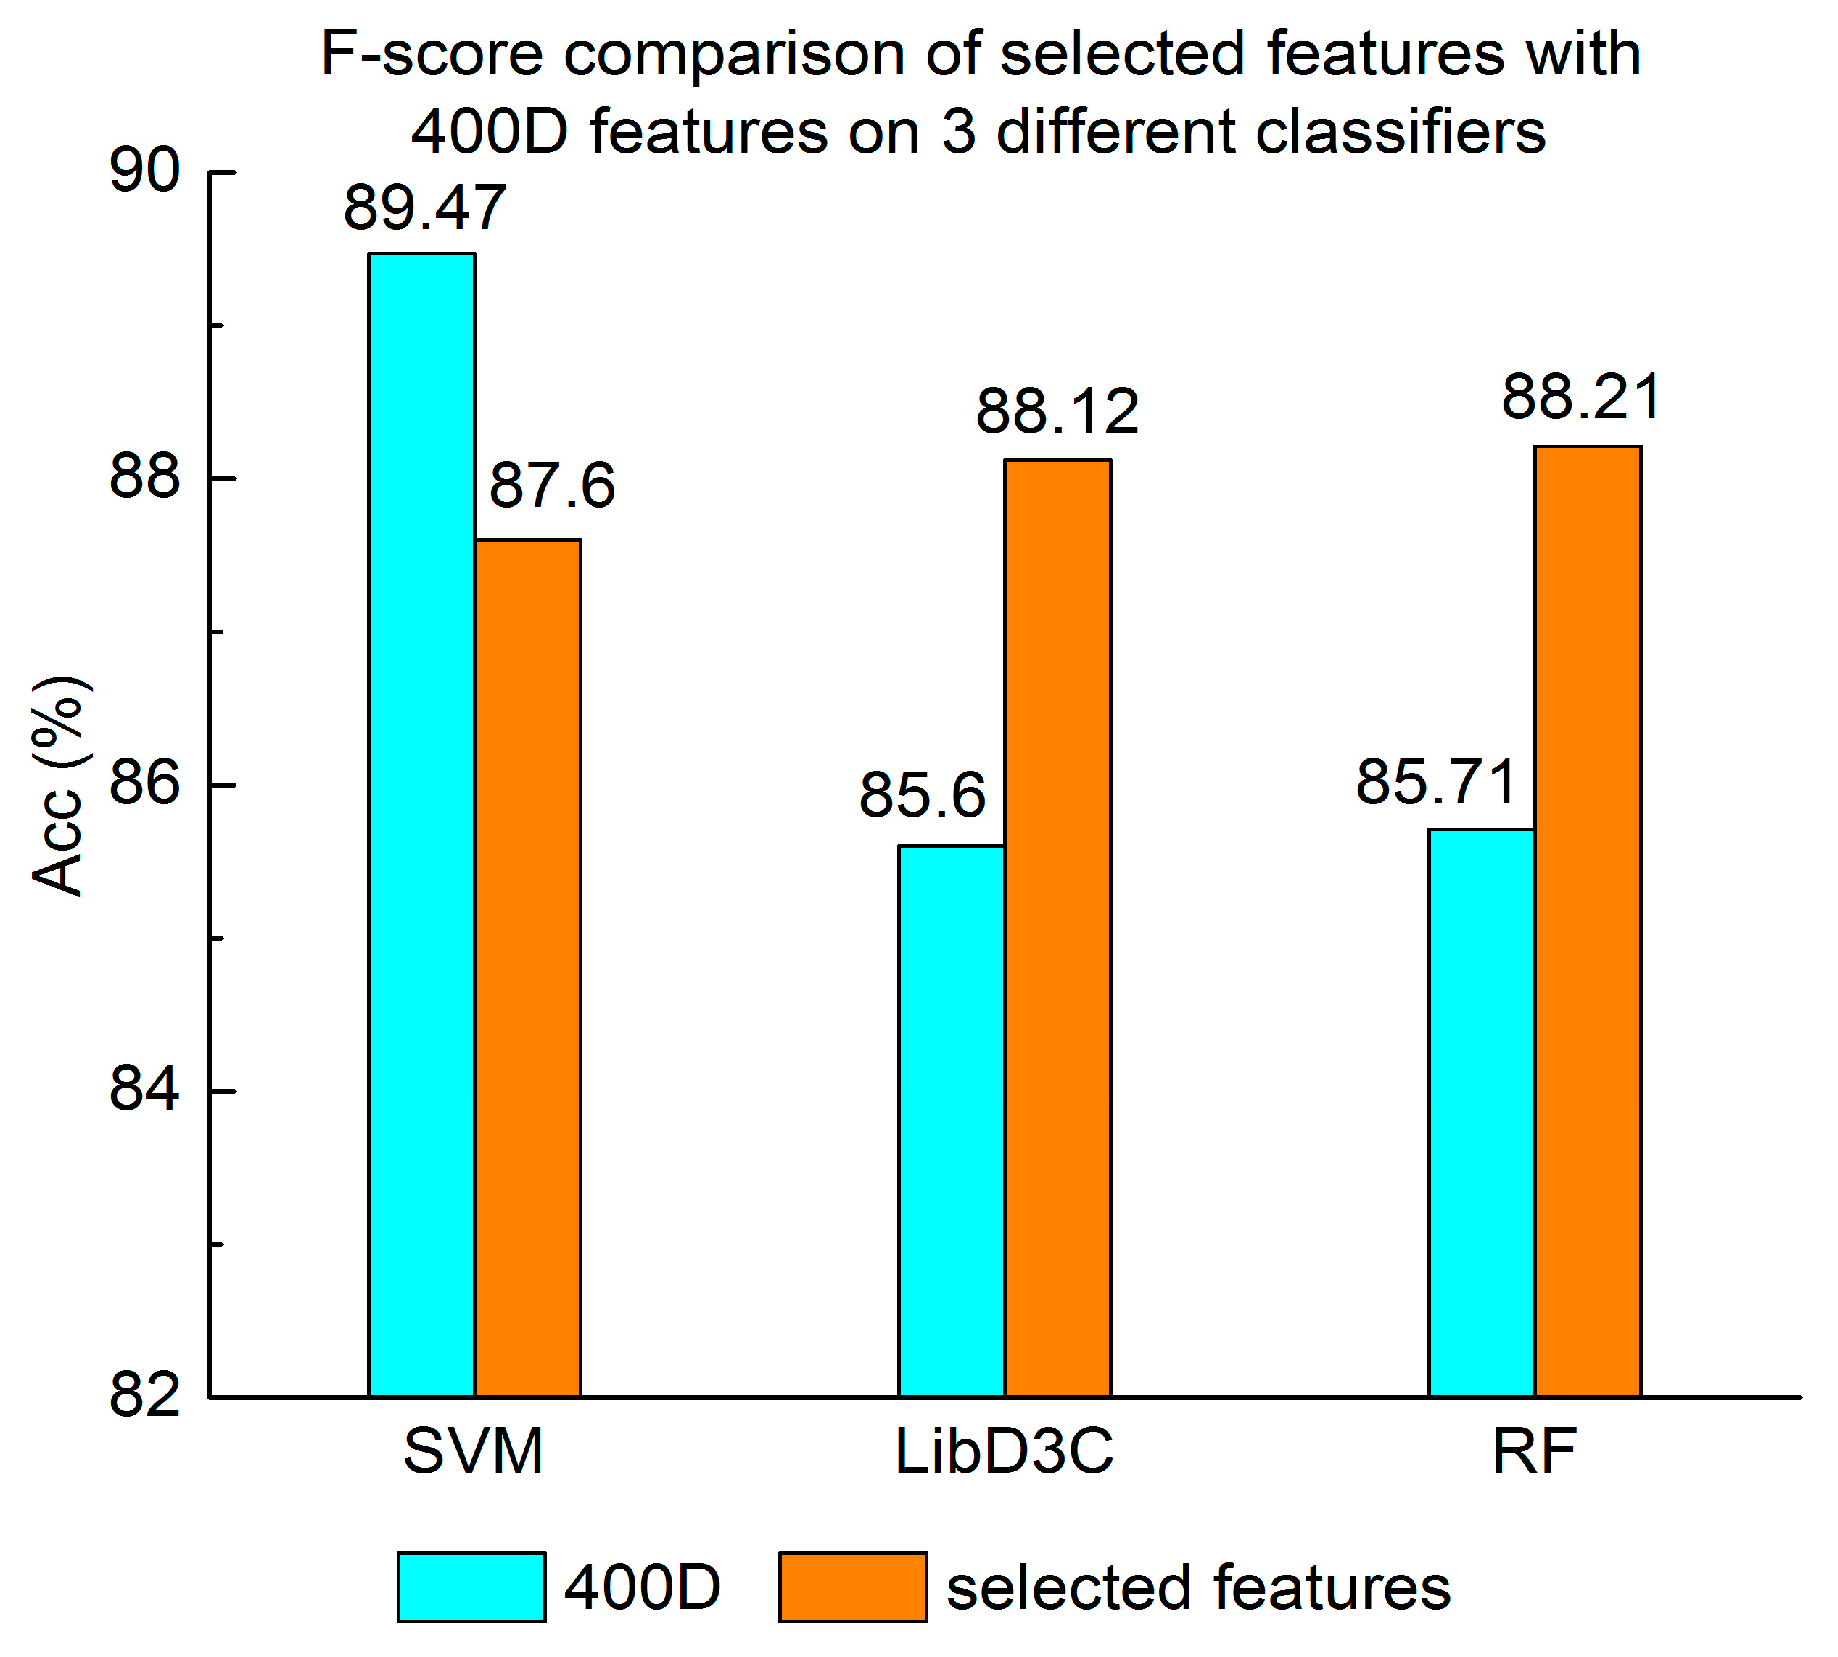
Experiment (4): The performance of selected integrated features compared with 400D features is shown in Figure 5, Figure 6 and Figure 7. The 400D features perform better when SVM is used. However, on the LibD3C and RF, the selected features perform better than 400D features on Acc, MCC, and F-score. However, when the ensemble algorithms are used, the methods with selected features perform better than the 400D features on Acc, MCC and F-score.
Above all, the experimental results show the method of selected features performs better on ensemble classifiers (RF and LibD3C) than 400D features, and 400D features perform better than g-gap features on SVM and LibD3C.
4. Discussion
We compared the results of Experiments (1–4). First, the 400D SVM performs better than iACP, as shown in Table 1. Both the 400D features and g-gap features can represent the sequence pattern information of peptides, but 400D can classify the peptides more accurately. Thus, we propose a new method for peptide classification.
Second, the method based on 400D features performs stably on three different classifiers. The method based on 400D features is flexible on the classifiers. By comparing the experimental results of the two groups, we draw the conclusion that the 400D features can represent the sequence information of the anticancer peptide. The method with selected features can improve the performance of the method based on 400D features on RF.
Since user-friendly and publicly accessible web servers represent future directions for developing practically more useful models, we shall make efforts in our future work to provide a web server for the method presented in this paper. Moreover, as demonstrated in a series of recent publications (see, e.g., [1,52,53,54,55,56]) on the development of new prediction methods, user-friendly, and publicly accessible web servers will significantly enhance their impacts, and we shall make efforts in our future work to provide a web server for the prediction method presented in this paper.
5. Conclusions
In this paper, a novel hybrid sequence-based model for identifying anticancer peptide prediction is proposed. In our proposed model, 400D is used to represent the sequence pattern information. In contrast to previous works, the redundancy features and unrelated features are pruned. In the experiments, the model based on 400D features performs better than existing methods. The experimental results demonstrated that the 400D model performs stably on the three classifiers, because the poorest performance is shown when g-gap is used. The features selected by the MRMD method can improve the performance of 400D features on RF. Our proposed method shows better performance with respect to anticancer peptide classification. On the other hand, there are also some related problems that our method can be used to address, such as DNA-binding protein prediction [52], methylation site prediction [57], phosphorylation site prediction [58] and protein–protein interaction prediction [59], etc.
Acknowledgments
This work was supported by the Science and Technology Innovation Commission of Shenzhen (grant No. JCYJ20160523113602609) and the National Nature Science Foundation of China (grant Ns. 61575128, 61771331).
Author Contributions
L.X. initially drafted the manuscript and performed most of the code work and experiments. C.L. collected the features and analyzed the experiments. L.W. and G.L. revised the drafts of the manuscript. All authors read and approved the final manuscript.
Conflicts of Interest
The authors declare no conflict of interest.
References
- Chen, W.; Feng, P.; Yang, H.; Ding, H.; Lin, H.; Chou, K.C. iRNA-AI: Identifying the adenosine to inosine editing sites in RNA sequences. Oncotarget 2017, 8, 4208. [Google Scholar] [CrossRef] [PubMed]
- Albenna, S.; Shai, Y.; Jacobsen, F.; Steinstraesser, L. Oncolytic activities of host defense peptides. Int. J. Mol. Sci. 2011, 12, 8027–8051. [Google Scholar] [CrossRef] [PubMed]
- Kalyanaraman, B.; Joseph, J.; Kalivendi, S.; Wang, S.; Konorev, E.; Kotamraju, S. Doxorubicin-induced apoptosis: Implications in cardiotoxicity. Mol. Cell. Biochem. 2002, 234, 119–124. [Google Scholar] [CrossRef] [PubMed]
- Maliepaard, M.; Scheffer, G.L.; Faneyte, I.F.; van Gastelen, M.A.; Pijnenborg, A.C.; Schinkel, A.H.; van De Vijver, M.J.; Scheper, R.J.; Schellens, J.H. Subcellular localization and distribution of the breast cancer resistance protein transporter in normal human tissues. Cancer Res. 2001, 61, 3458–3464. [Google Scholar] [PubMed]
- Mader, J.S.; Hoskin, D.W. Cationic antimicrobial peptides as novel cytotoxic agents for cancer treatment. Expert Opin. Investig. Drugs 2006, 15, 933–946. [Google Scholar] [CrossRef] [PubMed]
- Hoskin, D.W.; Ramamoorthy, A. Studies on anticancer activities of antimicrobial peptides. BBA Biomembr. 2008, 1778, 357–375. [Google Scholar] [CrossRef] [PubMed]
- Diana, G.; Salomé, V.A.; Castanho, M.A. From antimicrobial to anticancer peptides. A review. Front. Microbiol. 2013, 4, 294. [Google Scholar]
- Huang, Y.; Feng, Q.I.; Yan, Q.; Hao, X.; Chen, Y. Alpha-helical cationic anticancer peptides: A promising candidate for novel anticancer drugs. Mini Rev. Med. Chem. 2015, 15, 73–81. [Google Scholar] [CrossRef] [PubMed]
- Thundimadathil, J. Cancer treatment using peptides: Current therapies and future prospects. J. Amino Acids 2012, 2012, 967347. [Google Scholar] [CrossRef] [PubMed]
- Tyagi, A.; Kapoor, P.; Kumar, R.; Chaudhary, K.; Gautam, A.; Raghava, G.P.S. In silico models for designing and discovering novel anticancer peptides. Sci. Rep. 2013, 3, 2984. [Google Scholar] [CrossRef] [PubMed]
- Hajisharifi, Z.; Piryaiee, M.; Beigi, M.M.; Behbahani, M.; Mohabatkar, H. Predicting anticancer peptides with Chou’s pseudo amino acid composition and investigating their mutagenicity via Ames test. J. Theor. Biol. 2014, 341, 34–40. [Google Scholar] [CrossRef] [PubMed]
- Chen, W.; Feng, P.M.; Lin, H.; Chou, K.C. iRSpot-PseDNC: Identify recombination spots with pseudo dinucleotide composition. Nucleic Acids Res. 2013, 41, e68. [Google Scholar] [CrossRef] [PubMed]
- Chen, X.-X.; Tang, H.; Li, W.-C.; Wu, H.; Chen, W.; Ding, H.; Lin, H. Identification of Bacterial Cell Wall Lyases via Pseudo Amino Acid Composition. BioMed Res. Int. 2016, 8. [Google Scholar] [CrossRef] [PubMed]
- Ding, H.; Liang, Z.Y.; Guo, F.B.; Huang, J.; Chen, W.; Lin, H. Predicting bacteriophage proteins located in host cell with feature selection technique. Comput. Biol. Med. 2016, 71, 156–161. [Google Scholar] [CrossRef] [PubMed]
- Ding, H.; Feng, P.M.; Chen, W.; Lin, H. Identification of bacteriophage virion proteins by the ANOVA feature selection and analysis. Mol. BioSyst. 2014, 10, 2229–2235. [Google Scholar] [CrossRef] [PubMed]
- Tang, H.; Zou, P.; Zhang, C.; Chen, R.; Chen, W.; Lin, H. Identification of apolipoprotein using feature selection technique. Sci. Rep. 2016, 6, 30441. [Google Scholar] [CrossRef] [PubMed]
- Zou, Q.; Zeng, J.; Cao, L.; Ji, R. A novel features ranking metric with application to scalable visual and bioinformatics data classification. Neurocomputing 2016, 173, 346–354. [Google Scholar] [CrossRef]
- Wei, L.; Tang, J.; Zou, Q. Local-DPP: An improved DNA-binding protein prediction method by exploring local evolutionary information. Inf. Sci. 2017, 384, 135–144. [Google Scholar] [CrossRef]
- Chen, W.; Ding, H.; Feng, P.; Lin, H.; Chou, K.C. iACP: A sequence-based tool for identifying anticancer peptides. Oncotarget 2016, 7, 16895–16909. [Google Scholar] [CrossRef] [PubMed]
- Wang, G.; Li, X.; Wang, Z. APD2: The updated antimicrobial peptide database and its application in peptide design. Nucleic Acids Res. 2009, 37, D933–D937. [Google Scholar] [CrossRef] [PubMed]
- Fu, L.; Niu, B.; Zhu, Z.; Wu, S.; Li, W. CD-HIT: Accelerated for clustering the next-generation sequencing data. Bioinformatics 2012, 28, 3150–3152. [Google Scholar] [CrossRef] [PubMed]
- Chou, K.C. Prediction of protein cellular attributes using pseudo-amino acid composition. Proteins Struct. Funct. Bioinform. 2001, 43, 246–255. [Google Scholar] [CrossRef] [PubMed]
- Chou, K.C. Using amphiphilic pseudo amino acid composition to predict enzyme subfamily classes. Bioinformatics 2005, 21, 10–19. [Google Scholar] [CrossRef] [PubMed]
- Lin, S.X.; Lapointe, J. Theoretical and experimental biology in one—A symposium in honour of Professor Kuo-Chen Chou’s 50th anniversary and Professor Richard Giegé’s 40th anniversary of their scientific careers. J. Biomed. Sci. Eng. 2013, 6, 435–442. [Google Scholar] [CrossRef]
- Cao, D.S.; Xu, Q.S.; Liang, Y.Z. Propy: A tool to generate various modes of Chou’s PseAAC. Bioinformatics 2013, 29, 960–962. [Google Scholar] [CrossRef] [PubMed]
- Du, P.; Gu, S.; Jiao, Y. PseAAC-General: Fast building various modes of general form of Chou’s pseudo-amino acid composition for large-scale protein datasets. Int. J. Mol. Sci. 2014, 15, 3495–3506. [Google Scholar] [CrossRef] [PubMed]
- Sahu, S.S.; Panda, G. A novel feature representation method based on Chou’s pseudo amino acid composition for protein structural class prediction. Comput. Biol. Chem. 2010, 34, 320–327. [Google Scholar] [CrossRef] [PubMed]
- Mohabatkar, H.; Mohammad Beigi, M.; Abdolahi, K.; Mohsenzadeh, S. Prediction of allergenic proteins by means of the concept of Chou’s pseudo amino acid composition and a machine learning approach. Med. Chem. 2013, 9, 133–137. [Google Scholar] [CrossRef] [PubMed]
- Chen, J.; Guo, M.; Wang, X.; Liu, B. A comprehensive review and comparison of different computational methods for protein remote homology detection. Brief. Bioinform. 2016. [Google Scholar] [CrossRef]
- Zhou, X.B.; Chen, C.; Li, Z.C.; Zou, X.Y. Using Chou’s amphiphilic pseudo-amino acid composition and support vector machine for prediction of enzyme subfamily classes. J. Theor. Biol. 2007, 248, 546–551. [Google Scholar] [CrossRef] [PubMed]
- Esmaeili, M.; Mohabatkar, H.; Mohsenzadeh, S. Using the concept of Chou’s pseudo amino acid composition for risk type prediction of human papillomaviruses. J. Theor. Biol. 2010, 263, 203–209. [Google Scholar] [CrossRef] [PubMed]
- Mohabatkar, H.; Beigi, M.M.; Esmaeili, A. Prediction of GABA A receptor proteins using the concept of Chou’s pseudo-amino acid composition and support vector machine. J. Theor. Biol. 2011, 281, 18–23. [Google Scholar] [CrossRef] [PubMed]
- Beigi, M.M.; Behjati, M.; Mohabatkar, H. Prediction of metalloproteinase family based on the concept of Chou’s pseudo amino acid composition using a machine learning approach. J. Struct. Funct. Genom. 2011, 12, 191–197. [Google Scholar] [CrossRef] [PubMed]
- Nanni, L.; Lumini, A.; Gupta, D.; Garg, A. Identifying bacterial virulent proteins by fusing a set of classifiers based on variants of Chou’s pseudo amino acid composition and on evolutionary information. IEEE/ACM Trans. Comput. Biol. Bioinform. 2012, 9, 467–475. [Google Scholar] [CrossRef] [PubMed]
- Gupta, M.K.; Niyogi, R.; Misra, M. An alignment-free method to find similarity among protein sequences via the general form of Chou’s pseudo amino acid composition. SAR QSAR Environ. Res. 2013, 24, 597–609. [Google Scholar] [CrossRef] [PubMed]
- Tara, N.; Afzal, M.; Ansari, T.M.; Tahseen, R.; Iqbal, S.; Khan, Q.M. Combined use of alkane-degrading and plant growth-promoting bacteria enhanced phytoremediation of diesel contaminated soil. Int. J. Phytoremediat. 2014, 16, 1268–1277. [Google Scholar] [CrossRef] [PubMed]
- Huang, C.; Yuan, J.Q. Predicting protein subchloroplast locations with both single and multiple sites via three different modes of Chou’s pseudo amino acid compositions. J. Theor. Biol. 2013, 335, 205–212. [Google Scholar] [CrossRef] [PubMed]
- Khan, Z.U.; Hayat, M.; Khan, M.A. Discrimination of acidic and alkaline enzyme using Chou’s pseudo amino acid composition in conjunction with probabilistic neural network model. J. Theor. Biol. 2015, 365, 197–203. [Google Scholar] [CrossRef] [PubMed]
- Dehzangi, A.; Heffernan, R.; Sharma, A.; Lyons, J.; Paliwal, K.; Sattar, A. Gram-positive and Gram-negative protein subcellular localization by incorporating evolutionary-based descriptors into Chou’s general PseAAC. J. Theor. Biol. 2015, 364, 284–294. [Google Scholar] [CrossRef] [PubMed]
- Kumar, R.; Srivastava, A.; Kumari, B.; Kumar, M. Prediction of β-lactamase and its class by Chou’s pseudo-amino acid aomposition and support vector machine. J. Theor. Biol. 2014, 365, 96–103. [Google Scholar] [CrossRef] [PubMed]
- Wang, X.; Zhang, W.; Zhang, Q.; Li, G.Z. MultiP-SChlo: Multi-label protein subchloroplast localization prediction with Chou’s pseudo amino acid composition and a novel multi-label classifier. Bioinformatics 2015, 31, 2639–2645. [Google Scholar] [CrossRef] [PubMed]
- Mandal, M.; Mukhopadhyay, A.; Maulik, U. Prediction of protein subcellular localization by incorporating multiobjective PSO-based feature subset selection into the general form of Chou’s PseAAC. Med. Biol. Eng. Comput. 2015, 53, 331–334. [Google Scholar] [CrossRef] [PubMed]
- Zhong, W.Z.; Zhou, S.F. Molecular science for drug development and biomedicine. Int. J. Mol. Sci. 2014, 15, 20072–20078. [Google Scholar] [CrossRef] [PubMed]
- Chou, K.C. Impacts of bioinformatics to medicinal chemistry. Med. Chem. 2015, 11, 218–234. [Google Scholar] [CrossRef] [PubMed]
- Xu, Y.; Chou, K.C. Recent progress in predicting posttranslational modification sites in proteins. Curr. Top. Med. Chem. 2015, 16, 591–603. [Google Scholar] [CrossRef]
- Cristianini, N.; Shawetaylor, J. An Introduction to Support Vector Machines and Other Kernel-Based Learning Methods; Cambridge University Press: Cambridge, UK, 2000; Volume 32, pp. 1–28. [Google Scholar]
- Chou, K.C. Using subsite coupling to predict signal peptides. Protein Eng. 2001, 14, 75–79. [Google Scholar] [CrossRef] [PubMed]
- Powers, D.M.W. Evaluation: From precision, recall and F-Factor to ROC, informedness, markedness and correlation. J. Mach. Learn. Technol. 2011, 2, 2229–3981. [Google Scholar]
- Lin, C.; Chen, W.; Qiu, C.; Wu, Y.; Krishnan, S.; Zou, Q. LibD3C: Ensemble classifiers with a clustering and dynamic selection strategy. Neurocomputing 2014, 123, 424–435. [Google Scholar] [CrossRef]
- Ho, T.K. Classification Technique Using Random Decision Forests. U.S. Patent 6,009,199, 28 December 1999. [Google Scholar]
- Kandaswamy, K.K.; Chou, K.C.; Martinetz, T.; Möller, S.; Suganthan, P.N.; Sridharan, S.; Pugalenthi, G. AFP-Pred: A random forest approach for predicting antifreeze proteins from sequence-derived properties. J. Theor. Biol. 2011, 270, 56–62. [Google Scholar] [CrossRef] [PubMed]
- Chen, W.; Yang, H.; Feng, P.; Ding, H.; Lin, H. iDNA4mC: Identifying DNA N4-methylcytosine sites based on nucleotide chemical properties. Bioinformatics 2017, 33, 3518–3523. [Google Scholar] [CrossRef] [PubMed]
- Feng, P.; Ding, H.; Yang, H.; Chen, W.; Lin, H.; Chou, K.C. iRNA-PseColl: Identifying the occurrence sites of different RNA modifications by incorporating collective effects of nucleotides into PseKNC. Mol. Ther. Nucleic Acids 2017, 7, 155–163. [Google Scholar] [CrossRef] [PubMed]
- Chen, W.; Tang, H.; Ye, J.; Lin, H.; Chou, K.C. iRNA-PseU: Identifying RNA pseudouridine sites. Mol. Ther. Nucleic Acids 2016, 5, e332. [Google Scholar] [PubMed]
- Chen, W.; Tang, H.; Lin, H. MethyRNA: A web server for identification of N6-methyladenosine sites. J. Biomol. Struct. Dyn. 2017, 35, 683–687. [Google Scholar] [CrossRef] [PubMed]
- Feng, P.M.; Chen, W.; Lin, H.; Chou, K.C. iHSP-PseRAAAC: Identifying the heat shock protein families using pseudo reduced amino acid alphabet composition. Anal. Biochem. 2013, 442, 118–125. [Google Scholar] [CrossRef] [PubMed]
- Wei, L.; Xing, P.; Shi, G.; Ji, Z.L.; Zou, Q. Fast prediction of protein methylation sites using a sequence-based feature selection technique. IEEE/ACM Trans. Comput. Biol. Bioinform. 2018, 99, 1. [Google Scholar] [CrossRef] [PubMed]
- Wei, L.; Xing, P.; Tang, J.; Zou, Q. PhosPred-RF: A Novel Sequence-Based Predictor for Phosphorylation Sites Using Sequential Information Only. IEEE Trans. NanoBioscience 2017, 16, 240–247. [Google Scholar] [CrossRef] [PubMed]
- Wei, L.; Xing, P.; Zeng, J.; Chen, J.; Su, R.; Guo, F. Improved prediction of protein–protein interactions using novel negative samples, features, and an ensemble classifier. Artif. Intell. Med. 2017, 83, 67–74. [Google Scholar] [CrossRef] [PubMed]
Figure 1.
The flow chart of identifying anticancer peptides. MRMD: maximum relevance-maximum distance; SVM: support vector machine.
Figure 1.
The flow chart of identifying anticancer peptides. MRMD: maximum relevance-maximum distance; SVM: support vector machine.
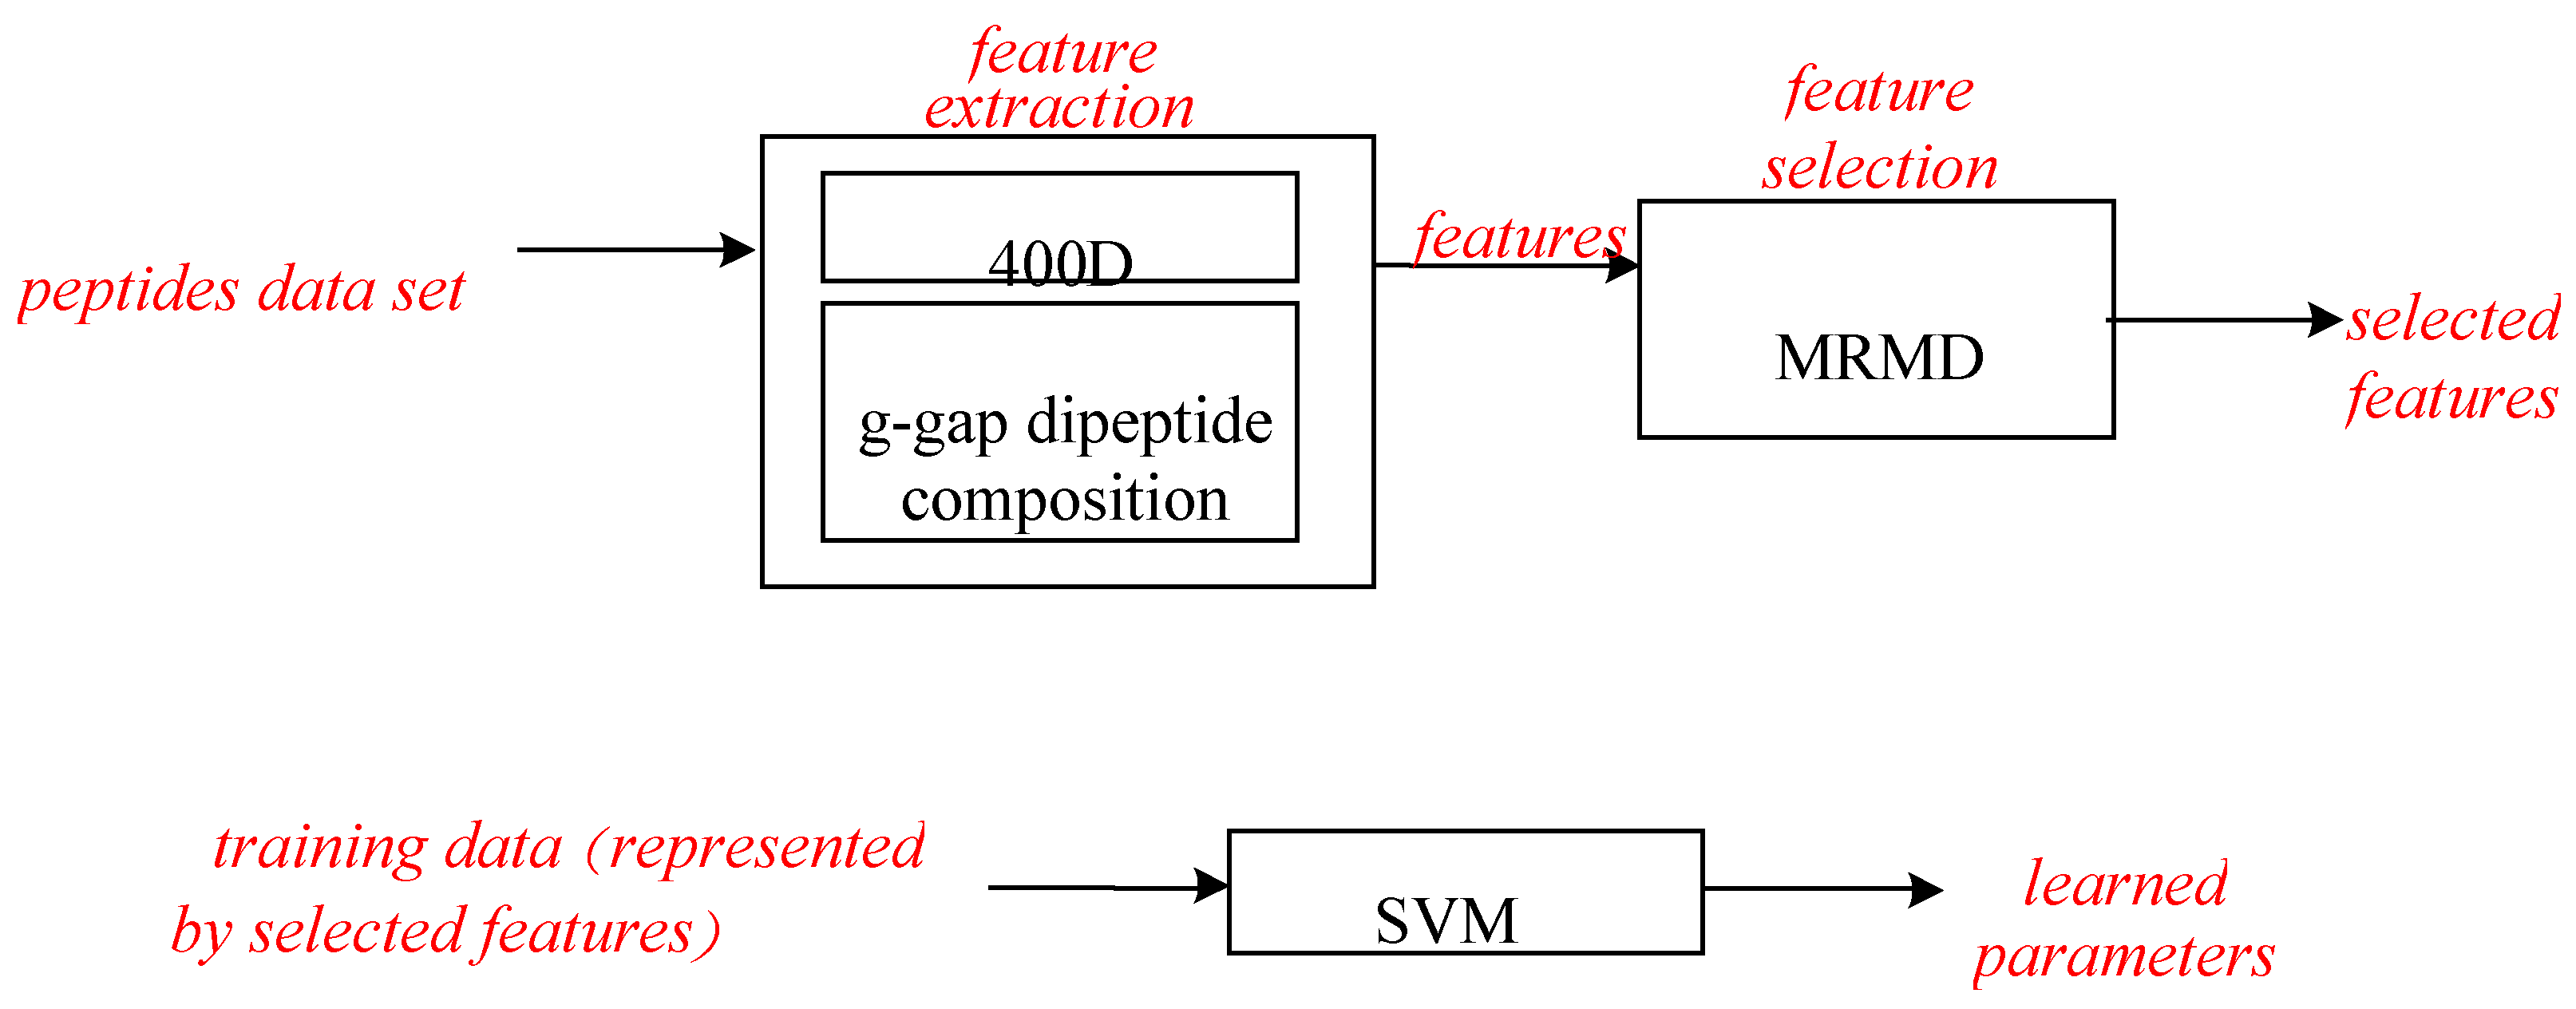
Figure 2.
Overall accuracy comparison of 400D features with G-gap features on three different classifiers. RF: random forest.
Figure 2.
Overall accuracy comparison of 400D features with G-gap features on three different classifiers. RF: random forest.
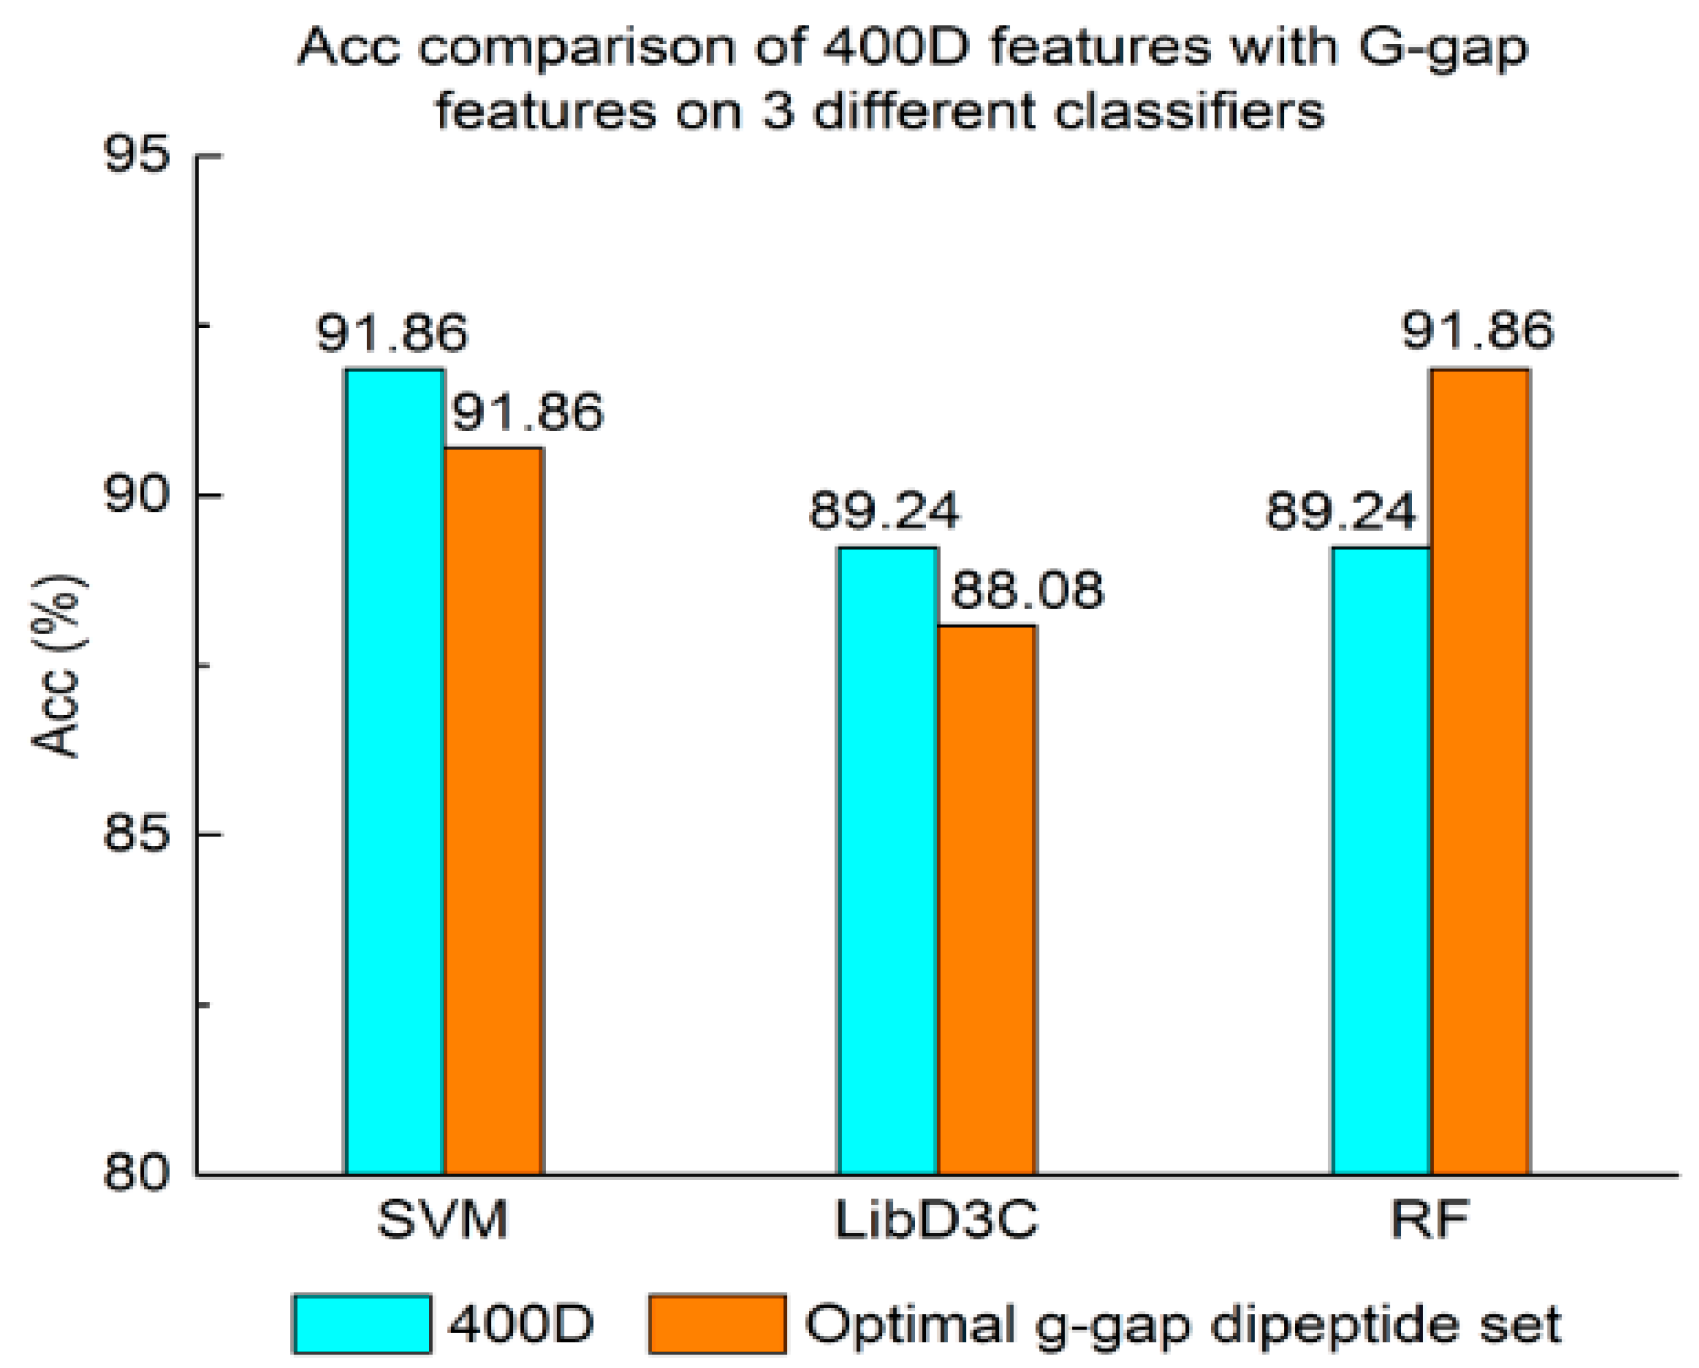
Figure 3.
Mathew’s correlation coefficient value comparison of 400D features with G-gap features on three different classifiers.
Figure 3.
Mathew’s correlation coefficient value comparison of 400D features with G-gap features on three different classifiers.
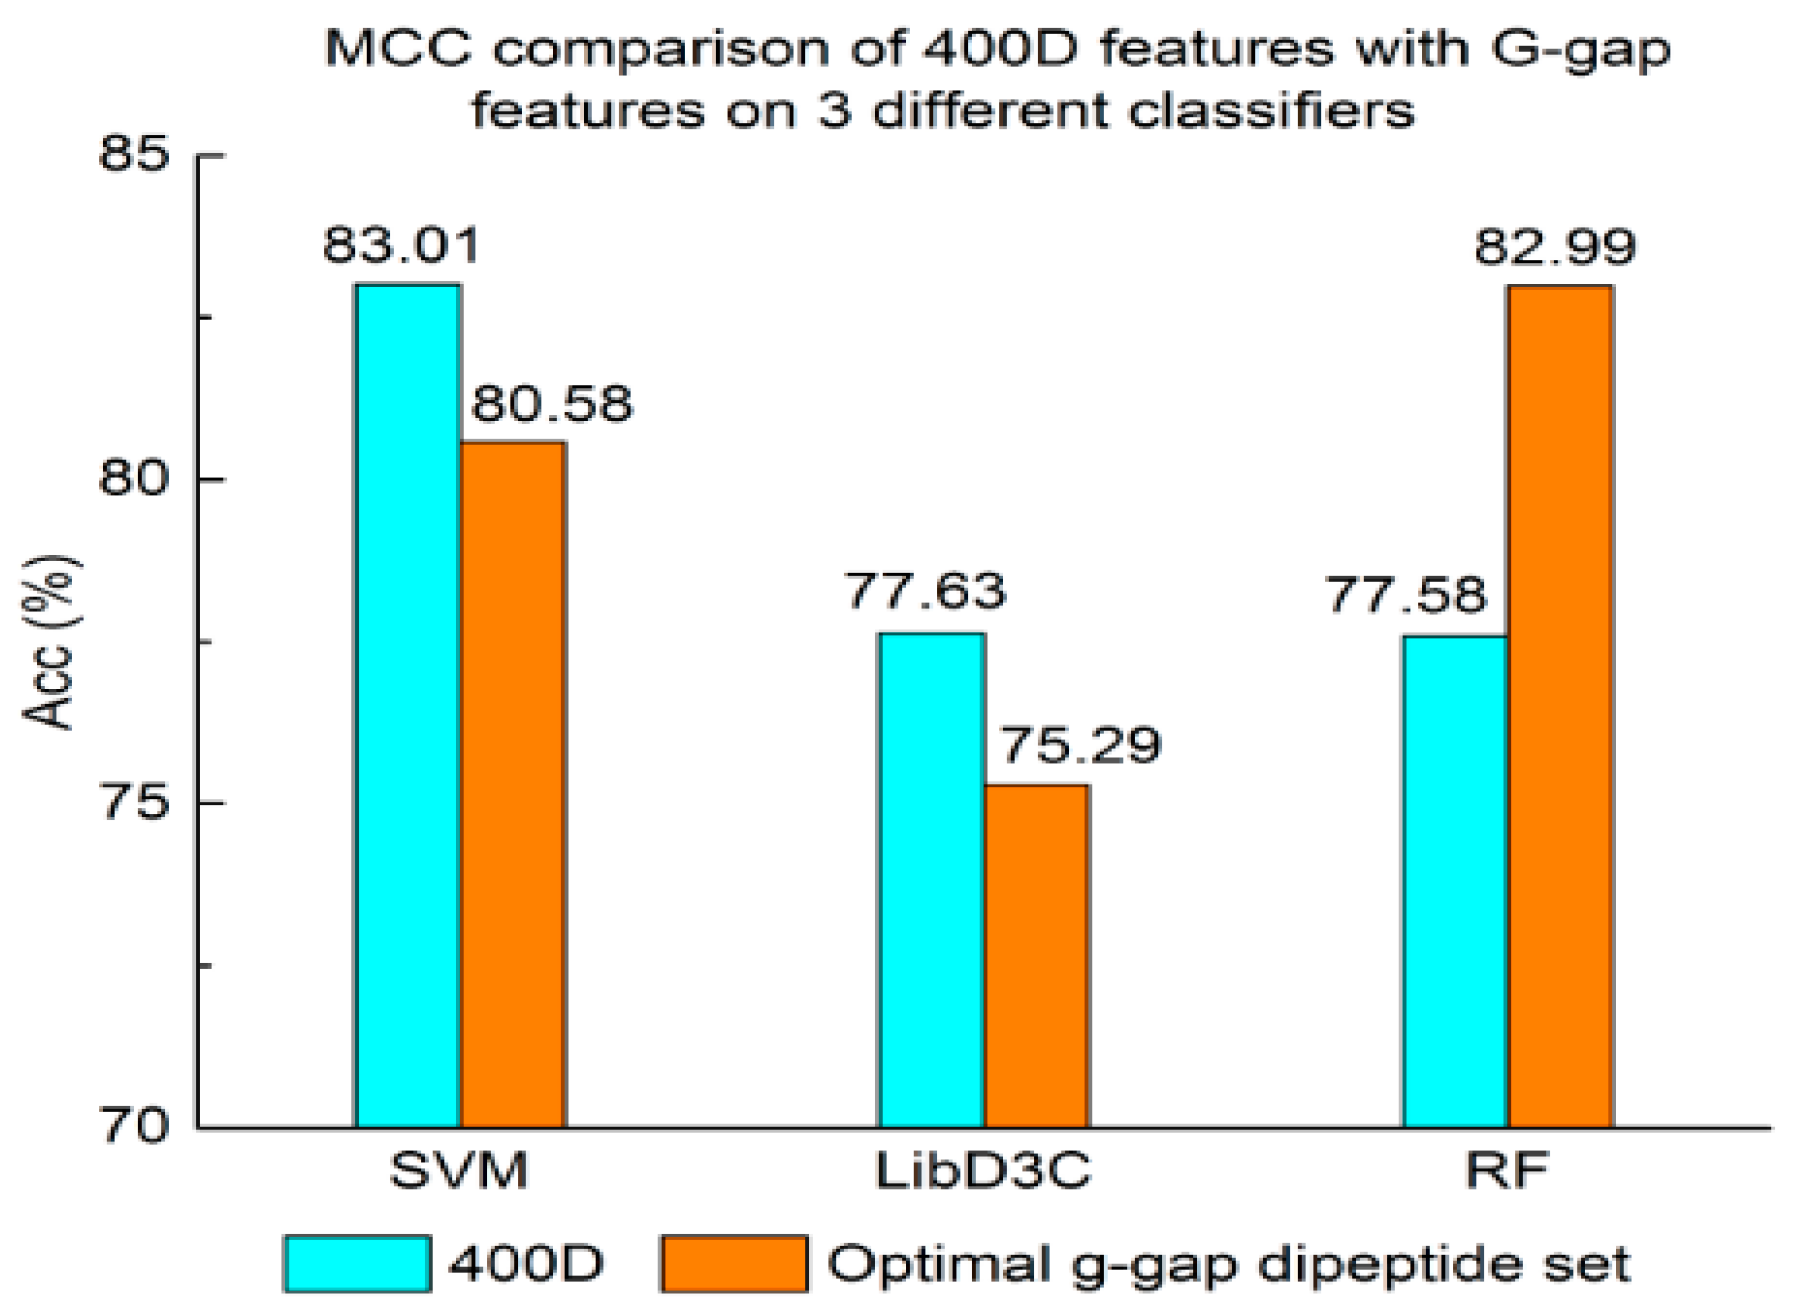
Figure 4.
F-score comparison of 400D features with G-gap features on three different classifiers.

Figure 5.
Acc comparison of selected features with 400D features on three different classifiers.
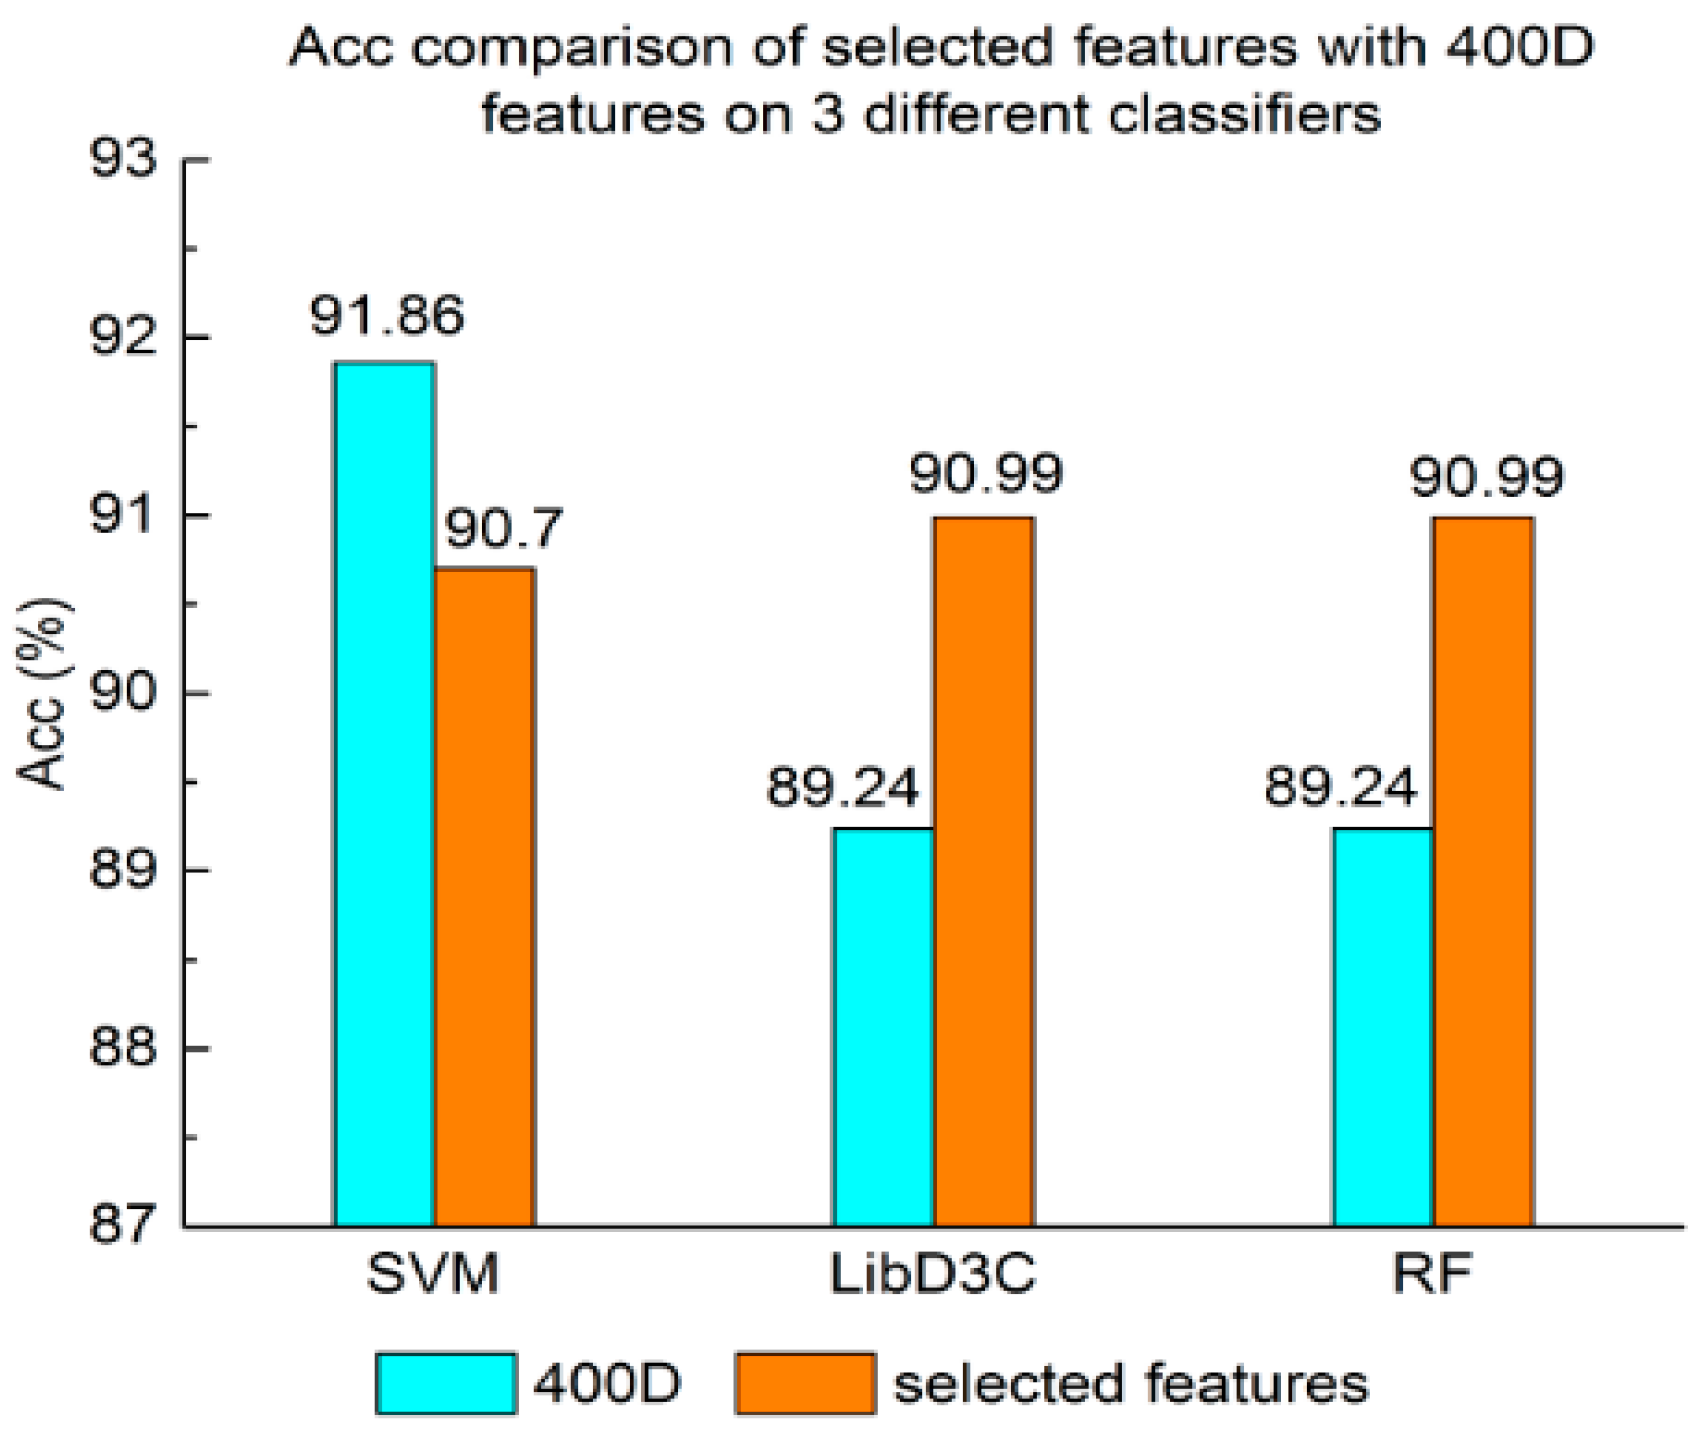
Figure 6.
MCC comparison of selected features with 400D features on three different classifiers.
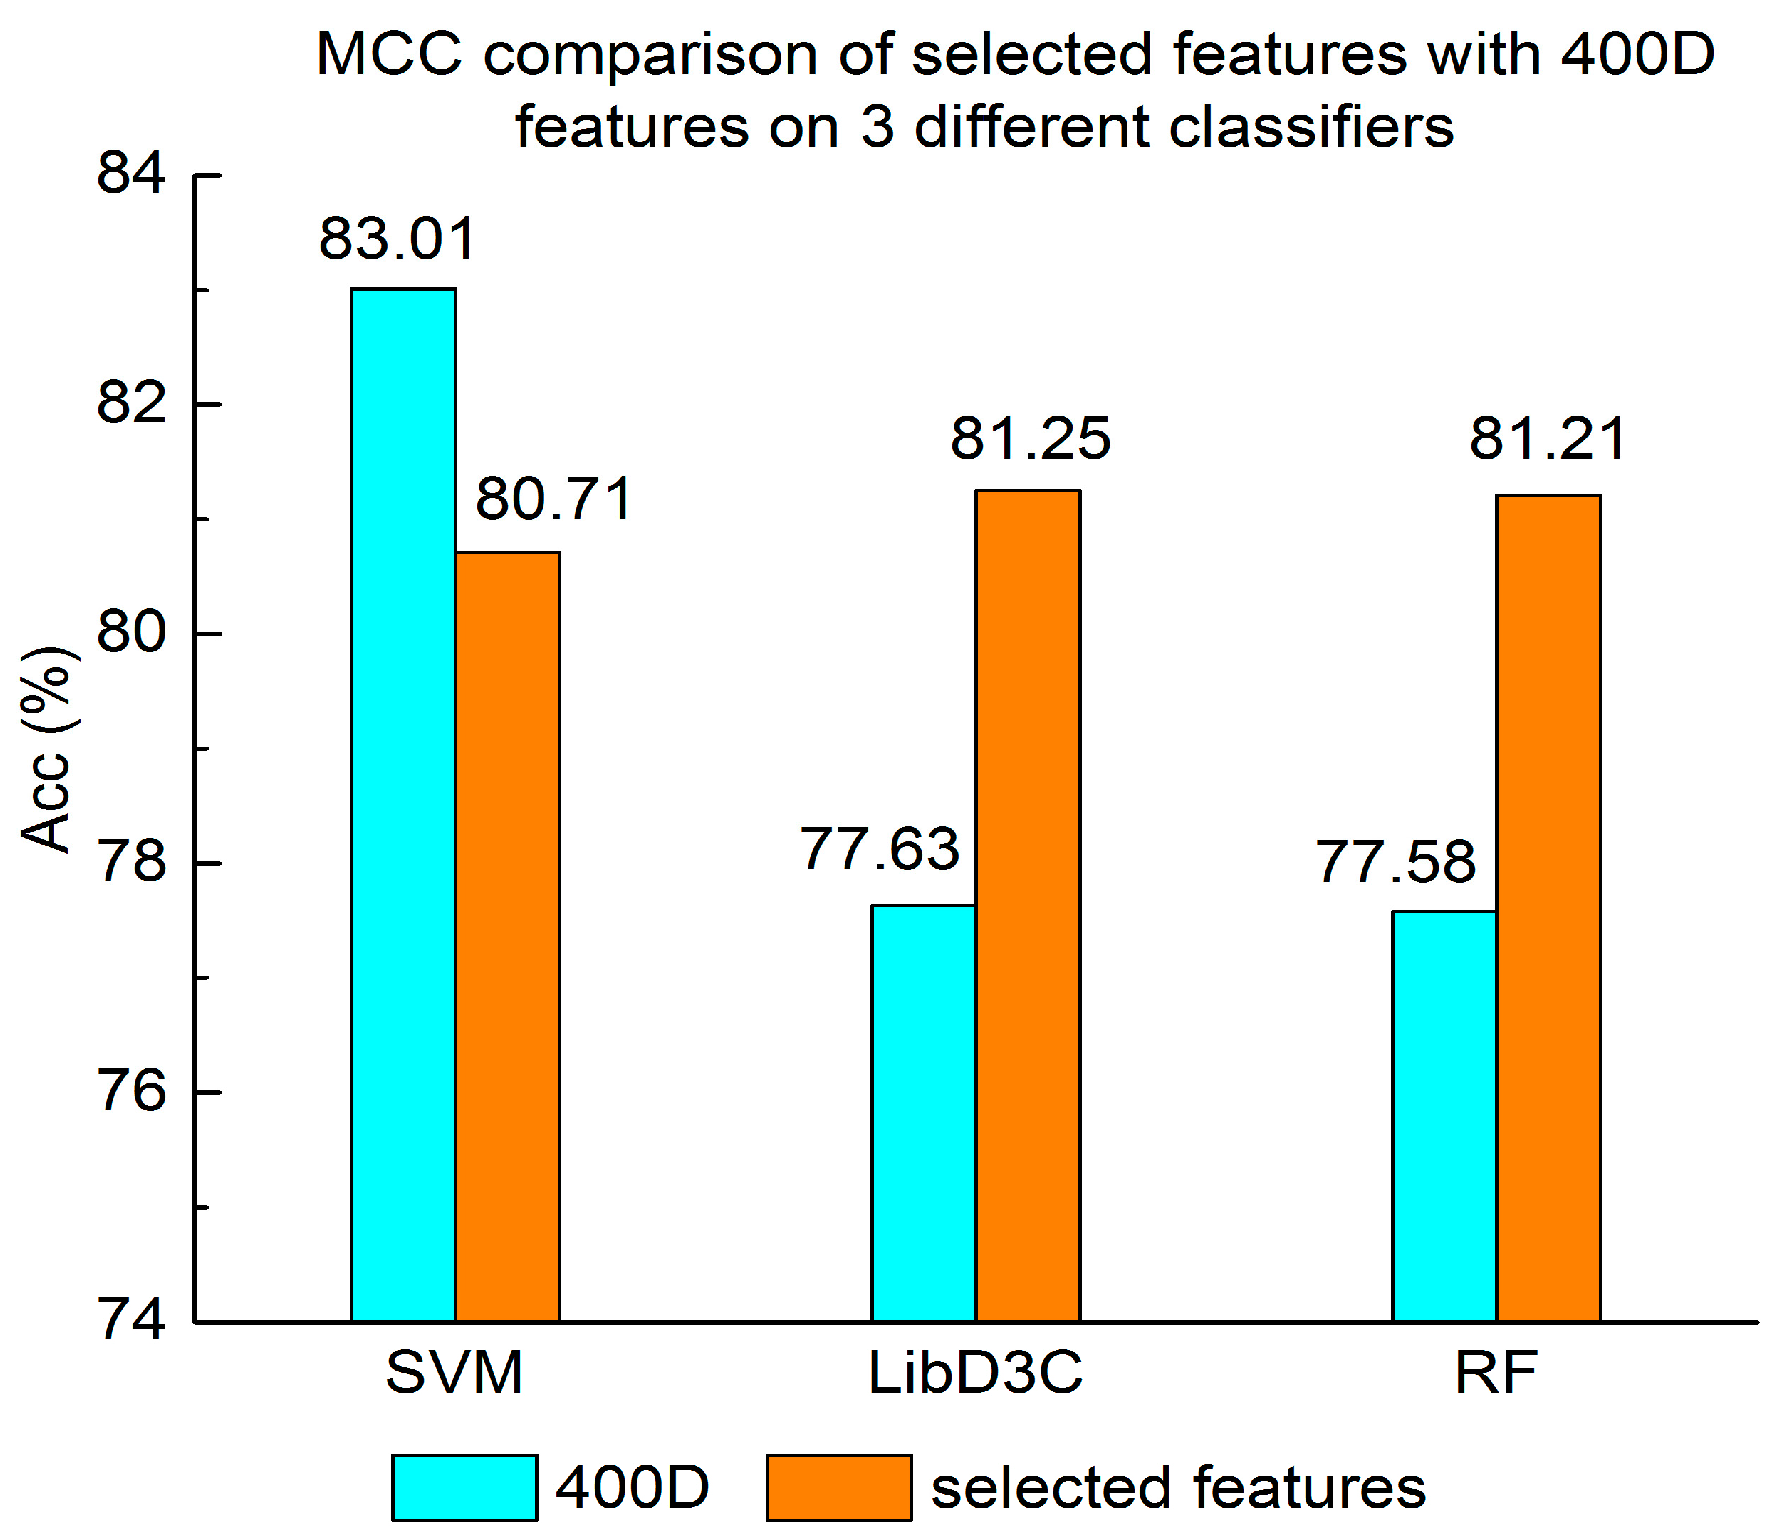
Figure 7.
F-score comparison of selected features with 400D features on three different classifiers.
Figure 7.
F-score comparison of selected features with 400D features on three different classifiers.


Table 1.
Performance comparison with state-of-the-art methods.
| Methods | Sn | Sp | Acc | MCC | F_score |
|---|---|---|---|---|---|
| iACP | 84.06% | 95.15% | 90.7% | 80.58% | 87.88% |
| SAP (400D) | 86.23% | 95.63% | 91.86% | 83.01% | 89.47% |
Sn: sensitivity; Sp: specificity; Acc: overall accuracy; MCC: Mathew’s correlation coefficient; SAP: sequence-based model for identifying ACP; iAPC: tool for identifying ACP proposed in [19].
Table 2.
Performance comparison with selected features.
| Methods | Sn | Sp | Acc | MCC | F_score |
|---|---|---|---|---|---|
| iACP (g-gap) | 84.06% | 95.15% | 90.7% | 80.58% | 87.88% |
| SAP (400D) | 86.23% | 95.63% | 91.86% | 83.01% | 89.47% |
| SAP (selected features) | 81.88% | 96.6% | 90.7% | 80.71% | 87.6% |
© 2018 by the authors. Licensee MDPI, Basel, Switzerland. This article is an open access article distributed under the terms and conditions of the Creative Commons Attribution (CC BY) license (http://creativecommons.org/licenses/by/4.0/).
Share and Cite
MDPI and ACS Style
Xu, L.; Liang, G.; Wang, L.; Liao, C. A Novel Hybrid Sequence-Based Model for Identifying Anticancer Peptides. Genes 2018, 9, 158. https://doi.org/10.3390/genes9030158
AMA Style
Xu L, Liang G, Wang L, Liao C. A Novel Hybrid Sequence-Based Model for Identifying Anticancer Peptides. Genes. 2018; 9(3):158. https://doi.org/10.3390/genes9030158
Chicago/Turabian StyleXu, Lei, Guangmin Liang, Longjie Wang, and Changrui Liao. 2018. "A Novel Hybrid Sequence-Based Model for Identifying Anticancer Peptides" Genes 9, no. 3: 158. https://doi.org/10.3390/genes9030158
Note that from the first issue of 2016, this journal uses article numbers instead of page numbers. See further details here.