Diurnal Cycle of the North American Monsoon in a Mesoscale Model Simulation: Evolution of Key Parameters in Relation to Precipitation

Abstract
: The diurnal cycle of the North American monsoon is analyzed based on the output from a mesoscale model simulation. Statistically significant diurnal cycle in precipitation is identified, with heavy precipitation—essentially convective—dominating in local afternoons. Temporal evolution of key parameters in relation to precipitation is investigated, based on which a sequence of the dynamic/thermodynamic processes underlying precipitation development is proposed. Particularly, the afternoon peak in precipitation is found preceded by enhanced static instability and low-level convergence.1. Introduction
Precipitation associated with the North American monsoon (NAM) affects the warm season hydroclimate over a large portion of the southwestern United States and the northwestern Mexico [1]. Characterized by relatively large daily variations, the NAM precipitation forms a challenge for model simulations [2-4]. Hourly development of convection and precipitation depends on enhanced atmospheric instability and low-level convergence, of which the ultimate driver is the diurnal cycle in the solar radiative forcing [5]. In that regard, heavy precipitation tends to occur when both atmospheric instability and low-level convergence favor the development of deep convection, usually during late afternoons to early evenings.
A simulation of the NAM precipitation was conducted by Zou and Zheng [4] using the Fifth-generation Penn State/NCAR Mesoscale Model (MM5) [6] coupled to the Simplified Simple Biosphere (SSiB) [7] and verified against gauge-based and satellite observations. It needs to be understood as what processes control the diurnal cycle in the simulation; specifically, what are the evolution characteristics of atmospheric instability and low-level convergence (among others) in relation to precipitation, which forms the focus of the current work. Here, key precipitation-related parameters from the coupled MM5-SSiB simulation are analyzed in order to better characterize and understand the diurnal cycle of the NAM.
2. Data and Methods
2.1. Data
Three-hourly output from the coupled MM5-SSiB simulation [4] is analyzed. The analysis period covers 0000 UTC 1 July through 0000 UTC 11 July 2002. Two-way interactive nesting grids were used in the simulation. The coarser domain, with a 45-km spatial resolution, covers the region of 18.8° N–41.0° N and 125.8° W–93.8° W. The finer domain, with a 15-km resolution, covers 22.2° N–32.9° N and 115.7° W–101.5° W. The model used 30 vertical levels, with the top of atmosphere located at 50 hPa. Detailed information on the model configurations can be found in [4].
2.2. Static Stability
Three quantities are calculated from the model output to represent static stability of the atmosphere. Vertical variation of the saturated equivalent potential temperature (dθSE/dz) is often used to describe whether and to what extent a specific layer of the atmosphere is statically stable or unstable. A more sophisticated measure of static stability is the convective available potential energy (CAPE), which is the amount of buoyant energy available to accelerate a parcel vertically. On a tephigram, CAPE represents the area where the parcel sounding is warmer than the environment. CAPE can be realized only if a parcel can be lifted to the level of free convection. The counterpart of CAPE is the so-called convective inhibition (CINH), which is the amount of energy beyond the normal work of expansion needed to lift a parcel from the surface to the level of free convection. On a tephigram, CINH represents the area where the parcel sounding is cooler than the environment. In the presence of CINH, a parcel, if lifted from the planetary boundary layer (PBL), would sink back. This “capping” must be overcome in order for PBL-based lifting to raise a parcel into the CAPE region.
2.3. Spectral Analysis
The Multi-Taper Method (MTM) [8] is used for spectral analysis. This method is desirable since it can properly handle time series that has both broadband and line components on its spectrum. The method is also non-parametric. Because of these properties, MTM has been widely used for the analysis of atmospheric data where signals very often show narrow-banded and not strictly harmonic variabilities [e.g., 9,10].
3. Results
3.1. Precipitation Characteristics
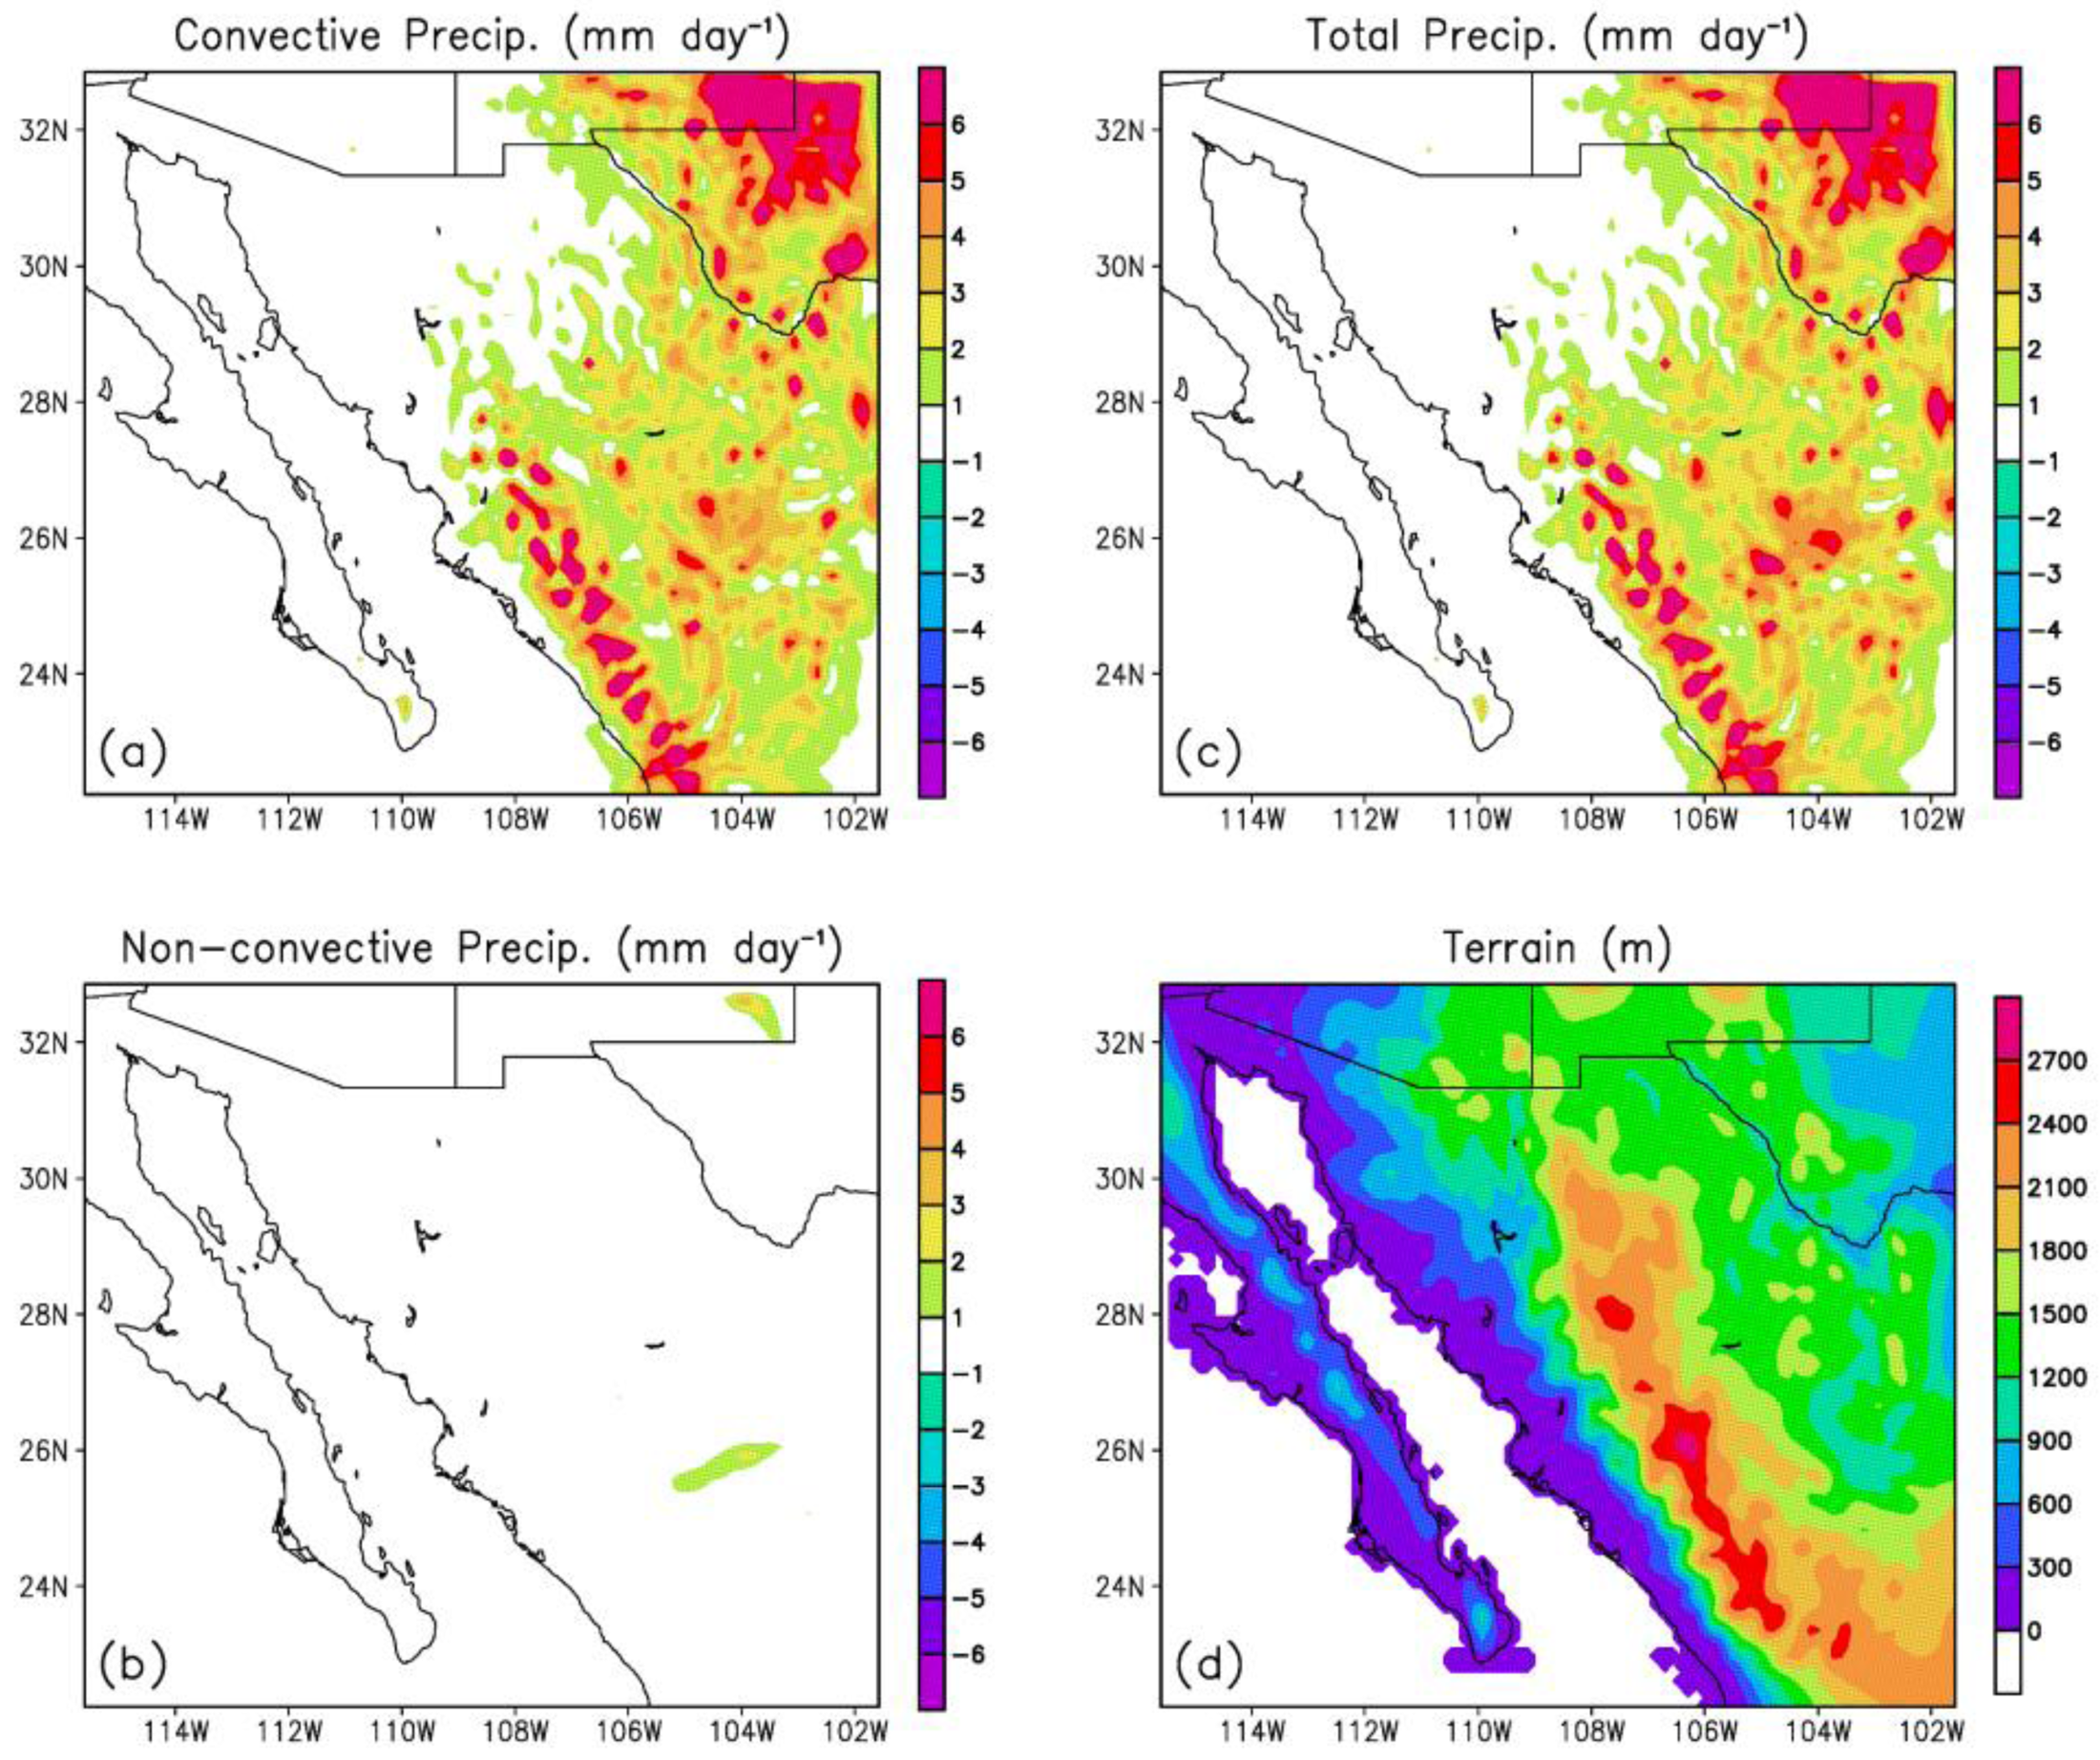
Based on the 10-day mean precipitation (Figure 1c), a belt of heavy precipitation (with precipitation rate of over 6 mm day−1) can be identified along the western and eastern slopes of the Sierra Madre Occidental (see Figure 1d for the terrain elevation). Also noted is a center of heavy precipitation to the northeast which is outside the core region of the NAM. As shown, precipitation during the period of interest (1–10 July 2002) is essentially convective (Figure 1a); non-convective precipitation (Figure 1b) is well negligible during this period. As a result, only the total precipitation will be discussed hereafter.
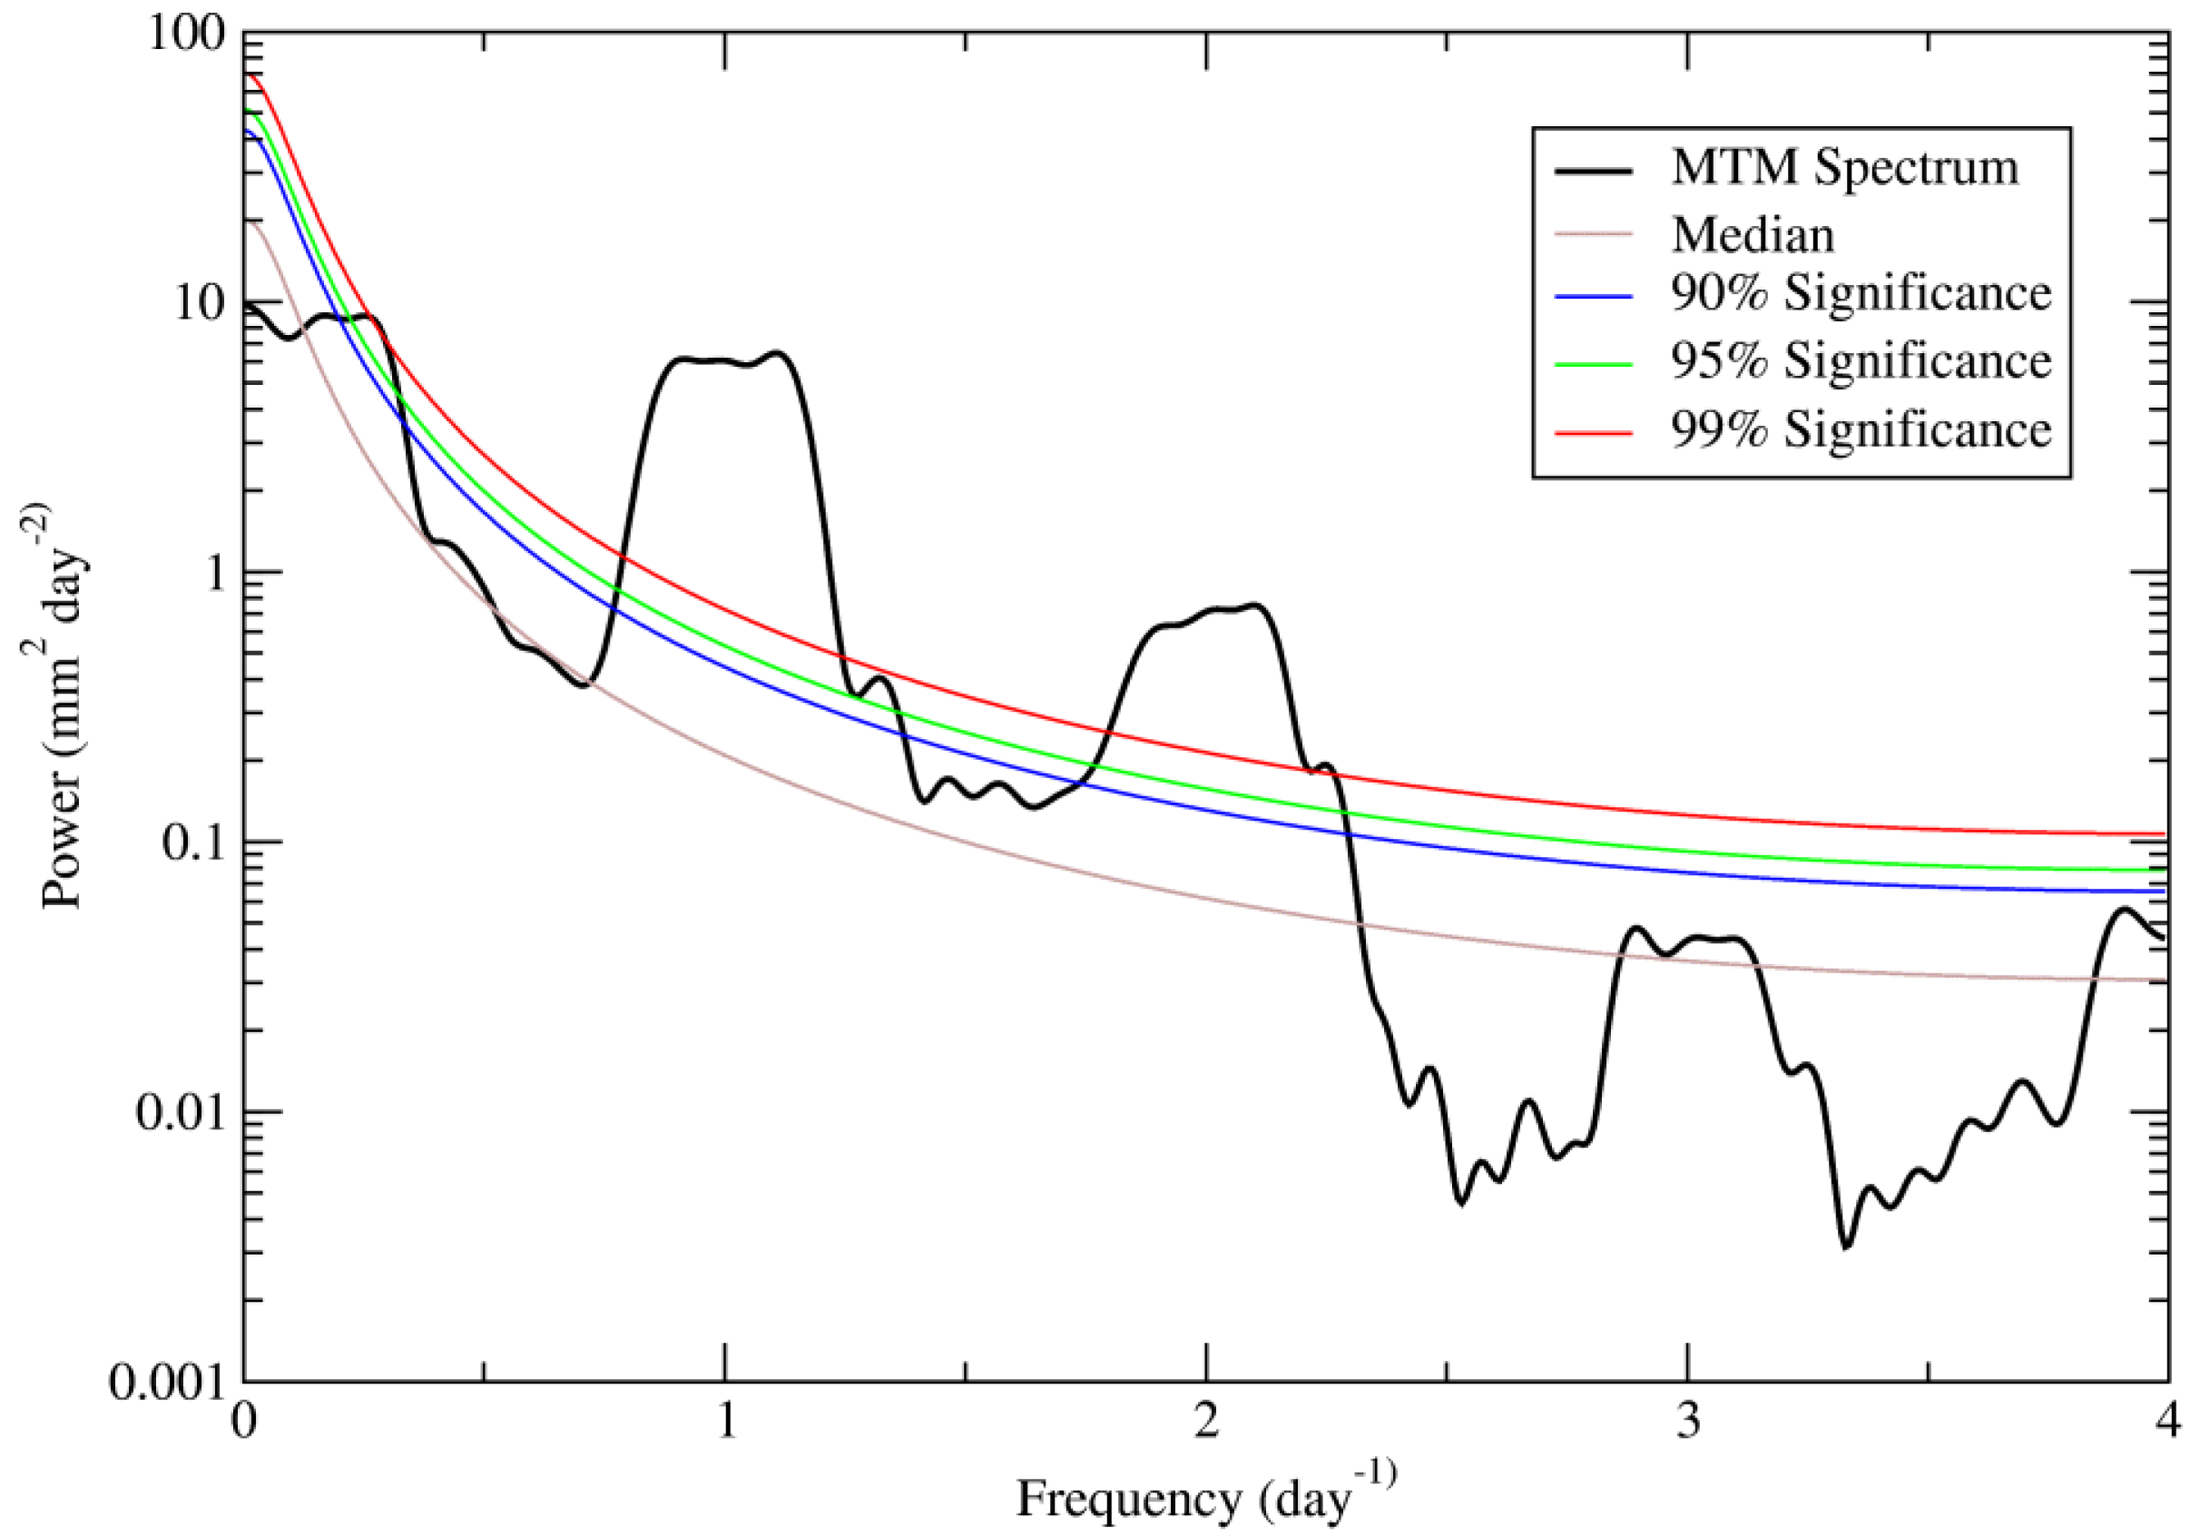
To assess the significance of the diurnal cycle, a spectral analysis is applied to the domain-averaged precipitation. At the 99% significance level, two spectral peaks can be identified from the MTM power spectrum, one which corresponds to the diurnal and semi-diurnal cycle (Figure 2). The diurnal cycle, as expected, has the largest power of variability (up to ∼10 mm2 day−2). Spatial structure and temporal evolution of the diurnal cycle will be detailed below.
3.2. Diurnal Cycle: Spatial Structure
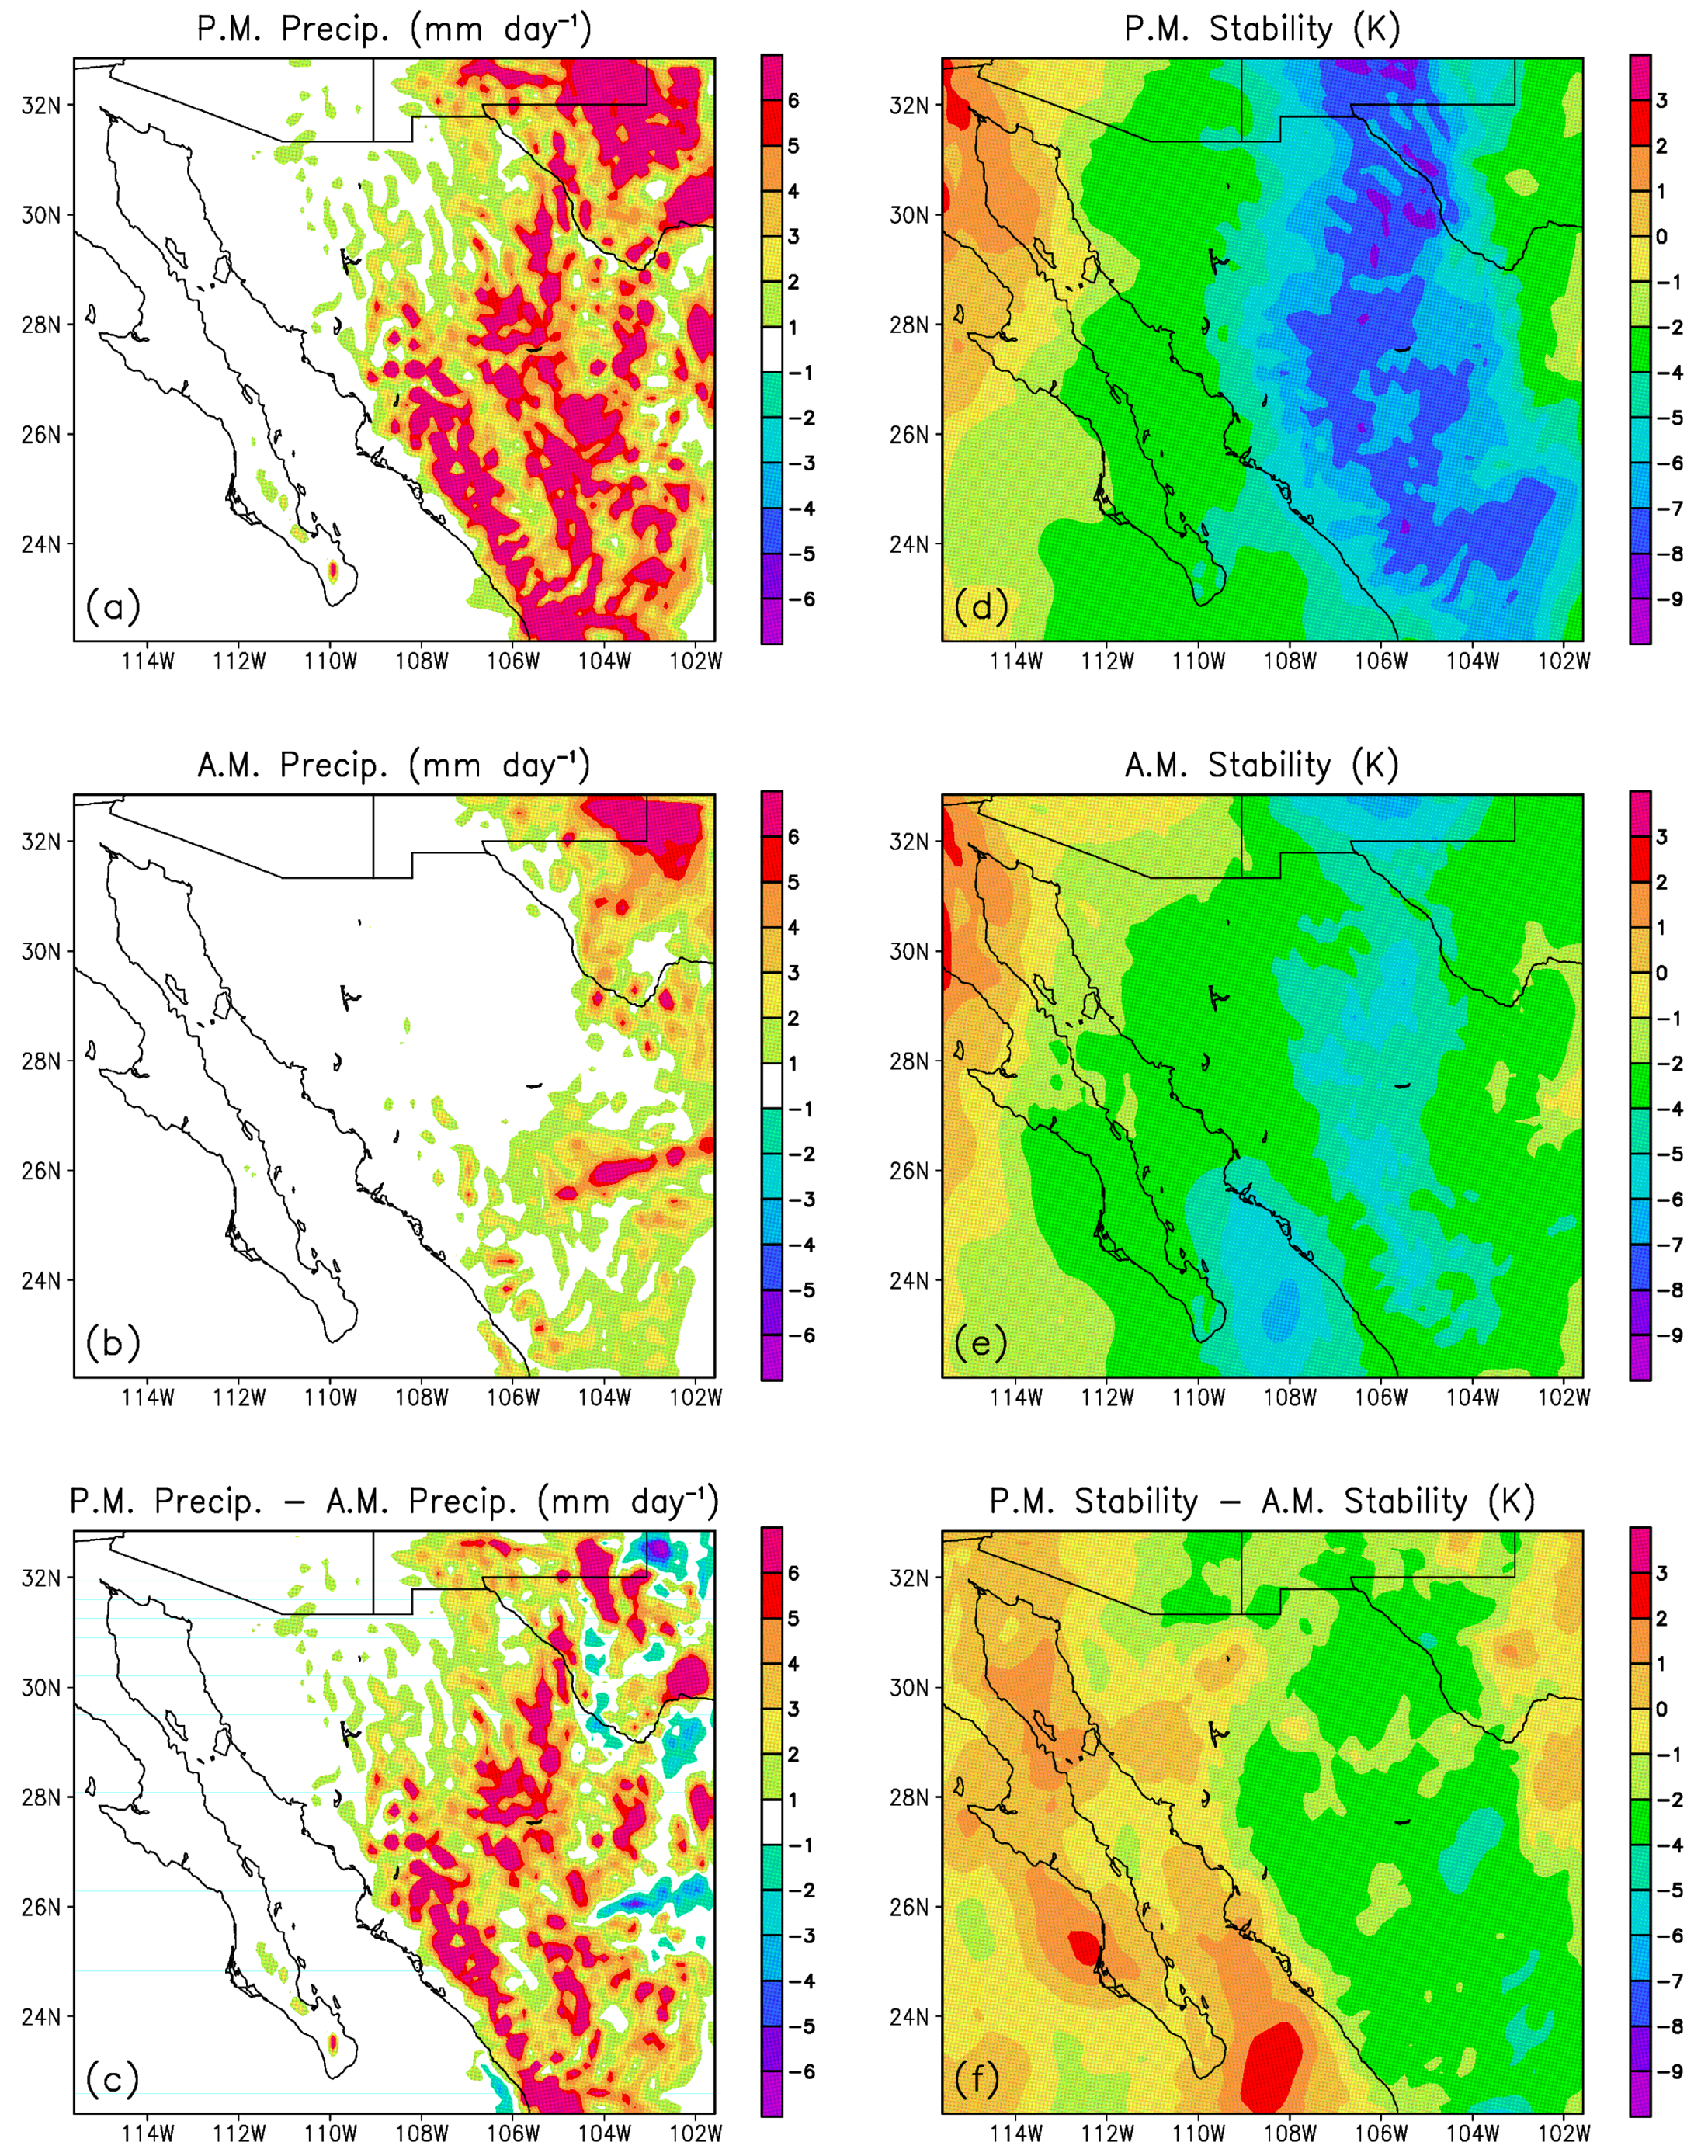
Spatial patterns of the diurnal cycle in precipitation and related parameters are examined by constructing and comparing morning and afternoon composites since the diurnal cycle in precipitation shall be rooted in the solar radiative forcing which maximizes in local afternoons. Here, “mornings” and “afternoons” are defined as the period of 02:00–11:00 and 14:00–23:00 Local Standard Time (LST), respectively.
Comparison of Figure 3a and 3b show that over the majority of the domain, precipitation mainly occurs in the afternoon. Figure 3c further demonstrates the afternoon-morning contrast. In accordance with precipitation, a strong contrast exists in static stability (represented by the difference in θSE between 500 hPa and 700 hPa) between mornings and afternoons (Figure 3d–f). In the afternoon, strong instability exists along the slopes of the Sierra Madre Occidental, the Central Plateau of Mexico, as well as part of Texas and New Mexico (Figure 3d). On the other hand, the atmosphere is in general less unstable during the morning (Figure 3e). The difference between the afternoon and morning stability is further demonstrated in Figure 3f.
Composites of afternoon and morning CAPE as well as the afternoon-morning difference are shown in Figure 4a–c. The CINH counterparts are shown in Figure 4d–f. Higher CAPE is seen in the afternoon across the majority of the domain, although the contrast is comparatively small along the western slope of the Sierra Madre Occidental. CINH is rather weak in both mornings and afternoons, with afternoon values being slightly weaker and therefore more favorable for the initiation of convection.
3.3. Diurnal Cycle: Temporal Evolution
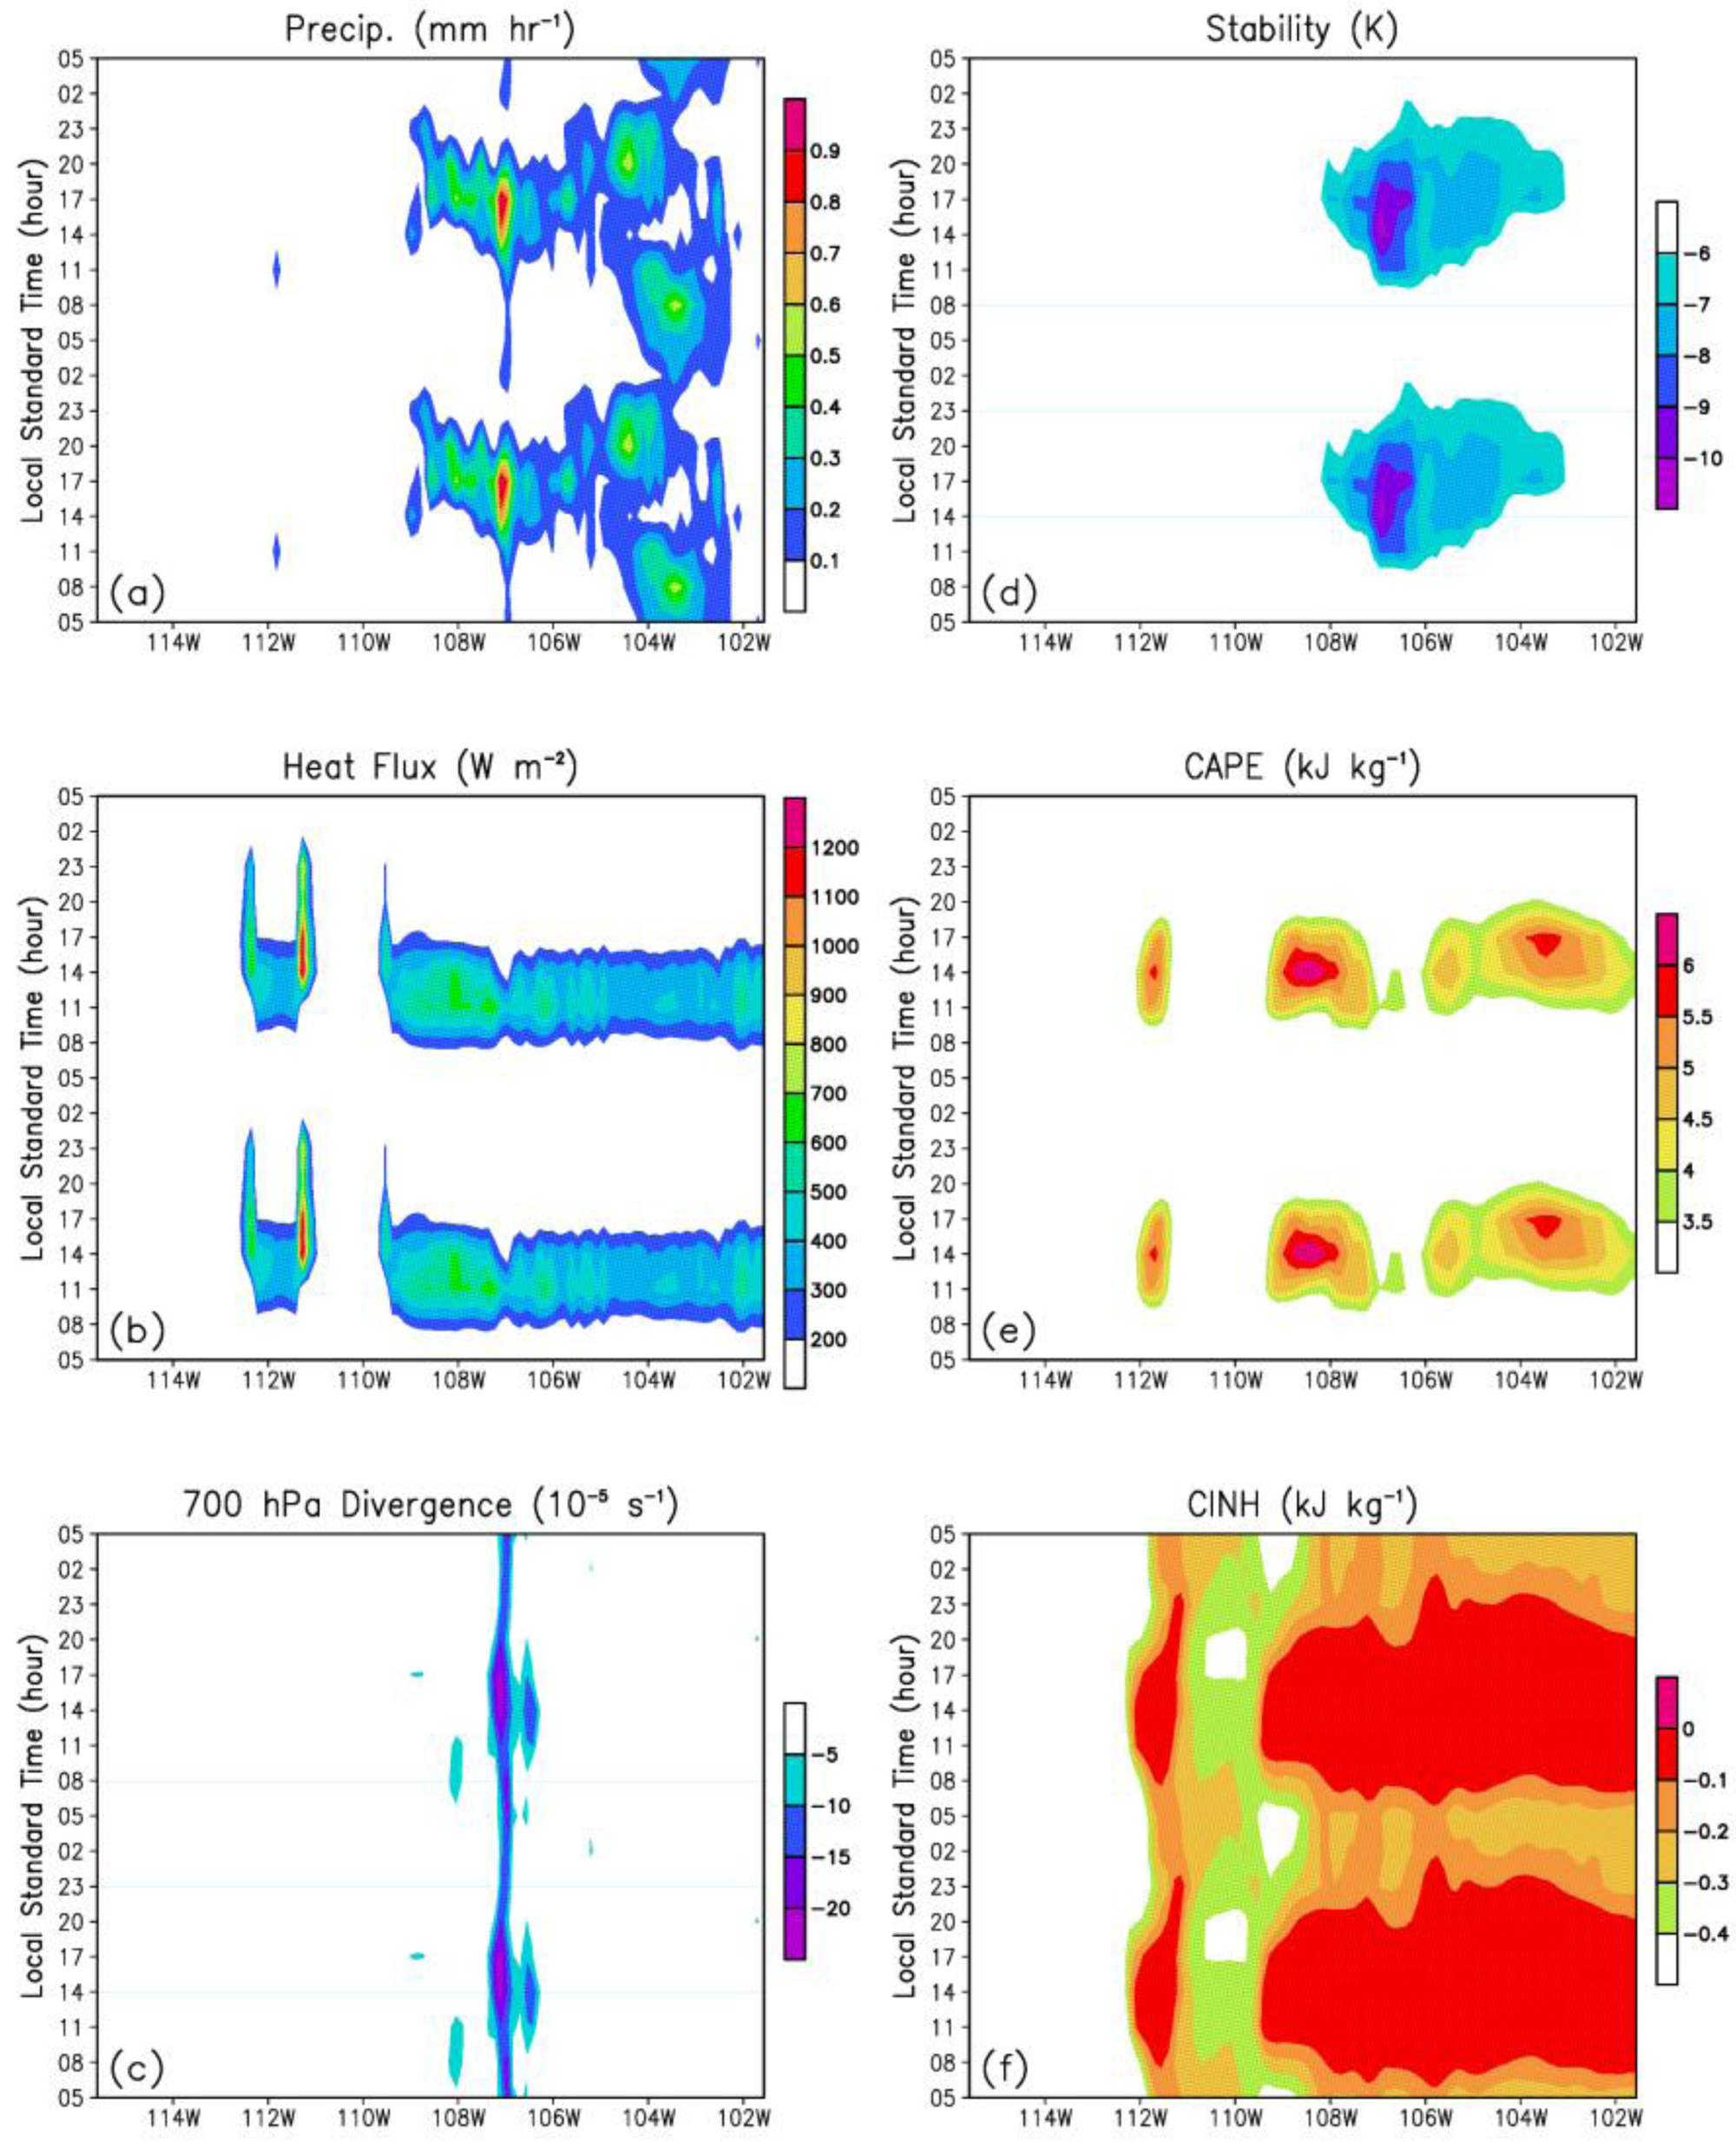
To have a temporal depiction of the diurnal cycle, time-longitude sections are constructed for some key parameters at a representative latitude of 26°N (Figure 5). Diurnal cycles are evident in all these parameters. Precipitation is found to maximize at about 17:00 LST near 107° W (Figure 5a). For surface heat flux (sensible and latent), the maximum is reached at 11:00 LST east of 110° W (Figure 5b). To the west, the maximum is reached a little later, due, likely, to the thermal inertia of the sea. 700–500-hPa static instability is at its maximum around 14:00 LST near the precipitation center (Figure 5d). For CAPE, the maximum is reached at about 14:00 (17:00) LST west (east) of 105° W (Figure 5e). Strong low-level convergence exists on a narrow band centered over maximum precipitation, peaking around 14:00–17:00 LST (Figure 5c). CINH is generally weak throughout the day (Figure 5f). In this case, maximum precipitation near 107° W is attributable to enhanced static instability and low-level convergence, both being persistent for a few hours until after precipitation occurs. Interestingly, a semi-diurnal cycle in precipitation can be identified to the east of 105°W, with peaks during early mornings and early evenings (Figure 5a).
Approximate times when the various parameters reach the maximum/minimum (such that they are favorable for the development of convection) in Figure 5 are summarized in Table 1. Note that the times are accurate to the extent allowed by the temporal resolution of the model output, i.e., 3 hours. The underlying processes can be described as follows: (1) Sensible and latent heat flux warms up the atmosphere from the surface; (2) CINH weakens as a result of the surface heating; (3) Static instability and low-level convergence develop in the atmosphere due to the surface heating; (4) Potential convection is favored by the development of static instability and low-level convergence; (5) Precipitation occurs when potential convection is realized and moisture condensed.
4. Summary and Discussion
The diurnal cycle of the NAM is investigated based on the output from a 10-day run of coupled MM5-SSiB. Heavy precipitation, essentially convective, is found along the western and eastern slopes of the Sierra Madre Occidental as well as part of New Mexico and Texas. Spectral analysis highlights the significance of the diurnal cycle in the simulated precipitation, with a spectral peak identified well above the 99% significance level centered at the period of about 1 day.
Temporal evolution of key parameters suggests the following sequence in convection/precipitation development: maximum surface heating→maximum (i.e., closest to zero) CINH→maximum static instability and low-level convergence→maximum precipitation. The importance of low-level convergence and CAPE found here is in accord with previous studies based on coarser resolution observation and model simulation [5], as well as high-resolution regional reanalysis [11]. It should however be noted that the results presented here are based on a 10-day period from one year. Some intraseasonal and interannual variability is expected, which itself needs to be characterized and quantified. The Kain-Fritsch convective parameterization [12] was used in the simulation. Dependence of the results on the convection scheme also needs to be evaluated. In that regard, application of cloud-resolving models would be highly desirable due to more realistic representation of the convection/precipitation process in those models.
Some features in the simulation are interesting, although not investigated here. For example, a node of relatively low CAPE is noted east of maximum precipitation (Figure 5e), which could be related to the elevated terrain. Presumably, lifting an air parcel from a higher level would result in less potential energy being realized, hence smaller values of CAPE. In addition to the diurnal cycle, a semi-diurnal cycle in precipitation is also found at the 99% significance level (Figures 2 and 5a). Possible causes of this semi-diurnal cycle include the mountain-plains solenoid [13], and perhaps less importantly, gravitational tides associated with the moon [14]. Feedback from precipitation to the land surface is an important factor to be considered in the precipitation process. The weakening of surface heat flux after precipitation occurs (Figure 5b; note the local minimum near the precipitation center) is suggestive of such feedback.


| Parameter | Approx. Peak Time (LST) |
|---|---|
| Surface heat flux | 11:00 (max.) |
| CINH | 11:00–14:00 (max.) |
| 700–500-hPa static stability | 14:00 (min.) |
| CAPE | 14:00–17:00 (max.) |
| 700-hPa divergence | 14:00–17:00 (min.) |
| Precipitation | 17:00 (max.) |
Acknowledgments
This paper is based on a graduate course project directed by N. Zeng and conducted at the Department of Atmospheric and Oceanic Science, University of Maryland, College Park. The UCLA SSA-MTM Toolkit is used in the spectral analysis and gratefully acknowledged. Comments from two anonymous reviewers are very helpful.
References
- Adams, D.K.; Comrie, A.C. The North American monsoon. Bull. Am. Meteorol. Soc. 1997, 78, 2197–2213. [Google Scholar]
- Gutzler, D.; Kim, H.-K.; Higgnis, R.W. The North American Monsoon Model Assessment Project (NAMAP). Predict. Cent. Atlas 2003, 11, 32. [Google Scholar]
- Zhang, D.L.; Zheng, W.Z.; Xue, Y.K. A numerical study of early summer regional climate and weather over LSA-East. Part I: Model implementation and verification. Mon. Wea. Rev. 2003, 131, 1895–1909. [Google Scholar]
- Zou, C.Z.; Zheng, W. Simulation of diurnal patterns of summer precipitation in the North American monsoon: An assessment using TRMM. Geophys. Res. Lett. 2004, 31, L07105. [Google Scholar]
- Dai, A.; Giorgi, F.; Trenberth, K.E. Observed and model-simulated diurnal cycles of precipitation over the contiguous United States. J. Geophys. Res. 1999, 104, 6377–6402. [Google Scholar]
- Grell, G.A.; Dudhia, J.; Stauffer, D.R. A Description of the Fifth-Generation Penn State/NCAR Mesoscale Model (MM5); Tech. Note NCAR/TN-398+STR; The National Center for Atmospheric Research: Boulder, CO, USA, 1995; p. 122. [Google Scholar]
- Xue, Y.; Sellers, P.J.; Kinter, J.L., III; Shukla, J. A simplified biosphere model for global climate studies. J. Climate 1991, 4, 345–364. [Google Scholar]
- Ghil, M.; Allen, R.M.; Dettinger, M.D.; Ide, K.; Kondrashov, D.; Mann, M.E.; Robertson, A.; Saunders, A.; Tian, Y.; Varadi, F.; Yiou, P. Advanced spectral methods for climatic time series. Rev. Geophys. 2002, 40(3), 1–41. [Google Scholar]
- Kuo, C.; Lindberg, C.; Thomson, D.J. Coherence established between atmospheric carbon dioxide and global temperature. Nature 1990, 343, 709–714. [Google Scholar]
- Ghil, M.; Vautard, R. Interdecadal oscillations and the warming trend in global temperature time series. Nature 1991, 350, 324–327. [Google Scholar]
- Becker, E.J.; Berbery, E.H. The diurnal cycle of precipitation over the North American monsoon region during the NAME 2004 field campaign. J. Climate 2008, 21, 771–787. [Google Scholar]
- Krain, J.S. The Kain-Fritsch convective parameterization: An update. J. Appl. Meteorol. 2004, 43, 170–181. [Google Scholar]
- Wolyn, P.G.; McKee, T.B. The mountain-plains circulation east of a 2-km high north-south barrier. Mon. Wea. Rev. 1994, 122, 1490–1508. [Google Scholar]
- Brier, G.W. Diurnal and semidiurnal atmospheric tides in relation to precipitation variations. Mon. Wea. Rev. 1965, 93, 93–100. [Google Scholar]
© 2011 by the authors; licensee MDPI, Basel, Switzerland. This article is an open access article distributed under the terms and conditions of the Creative Commons Attribution license (http://creativecommons.org/licenses/by/3.0/).
Share and Cite
Guan, B.; Zheng, W. Diurnal Cycle of the North American Monsoon in a Mesoscale Model Simulation: Evolution of Key Parameters in Relation to Precipitation. Atmosphere 2011, 2, 57-66. https://doi.org/10.3390/atmos2020057
Guan B, Zheng W. Diurnal Cycle of the North American Monsoon in a Mesoscale Model Simulation: Evolution of Key Parameters in Relation to Precipitation. Atmosphere. 2011; 2(2):57-66. https://doi.org/10.3390/atmos2020057
Chicago/Turabian StyleGuan, Bin, and Weizhong Zheng. 2011. "Diurnal Cycle of the North American Monsoon in a Mesoscale Model Simulation: Evolution of Key Parameters in Relation to Precipitation" Atmosphere 2, no. 2: 57-66. https://doi.org/10.3390/atmos2020057