


Atmosphere 2024, 15(5), 535; https://doi.org/10.3390/atmos15050535 (registering DOI) - 27 Apr 2024
Abstract
In this paper, the global distribution of precipitation for 2023, in terms of global totals and regional anomaly patterns, is analyzed using information from the new Global Precipitation Climatology Project (GPCP) V3.2 Monthly product, including how the precipitation amounts and patterns from 2023
[...] Read more.
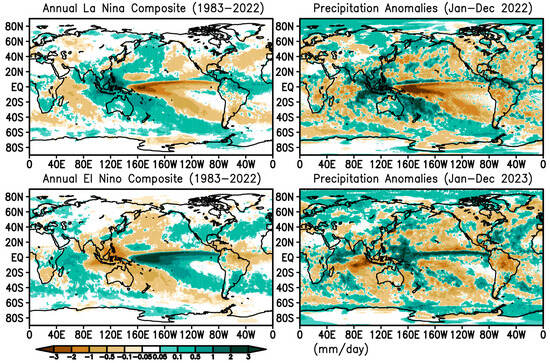
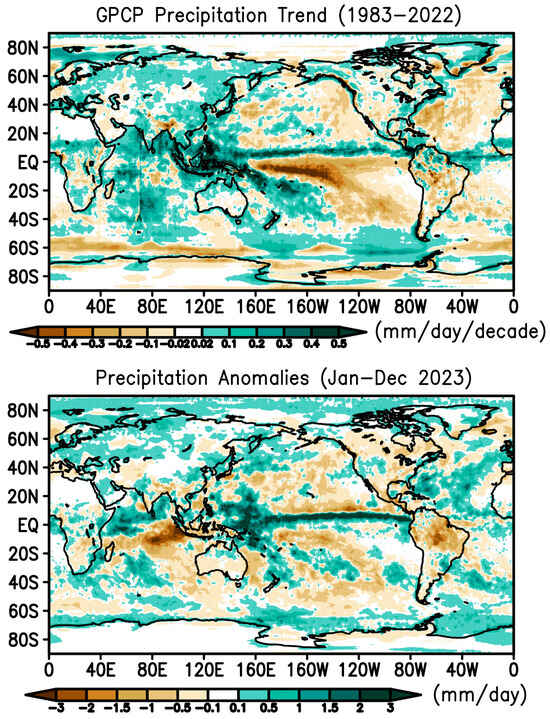
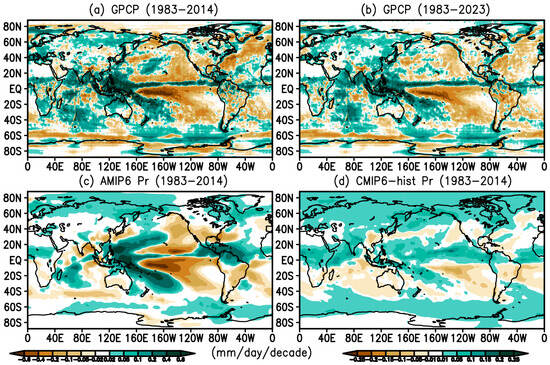
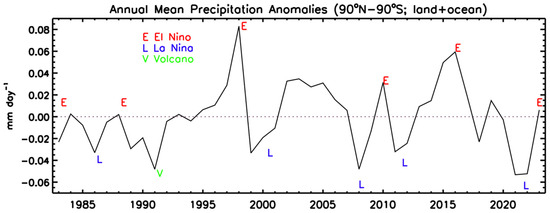
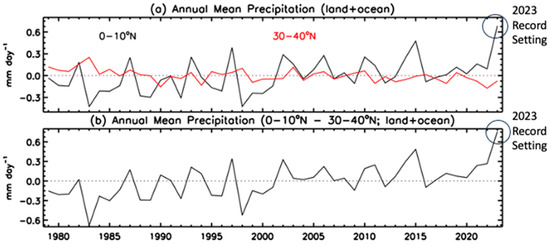
In this paper, the global distribution of precipitation for 2023, in terms of global totals and regional anomaly patterns, is analyzed using information from the new Global Precipitation Climatology Project (GPCP) V3.2 Monthly product, including how the precipitation amounts and patterns from 2023 fit into the longer record from 1983–2023. The tropical pattern of anomalies for 2023 is dominated by the effect of the El Nino which began during the Northern Hemisphere spring, after three plus years of La Nina conditions. The transition from La Nina conditions through 2022 shows the rapid change in many regional features from positive to negative anomalies or the reverse. Comparison of the observed regional trend maps with climate model results indicates similarity between the observations and the model results forced by observed SSTs, while the “free-running” model ensemble shows only a broad general agreement over large regions. Global total precipitation shows about a 3% range over the span of data, with El Nino and La Nina years prominent as positive and negative features, with 2023 showing a small positive global anomaly. The ITCZ (Inter-Tropical Convergence Zone) latitude band, 0–10° N, sets a record high mean rain rate in 2023 after a steady upward trend over the decades, probably a response related to global warming.
Full article
(This article belongs to the Special Issue The Water Cycle and Climate Change (2nd Edition))
►
Show Figures
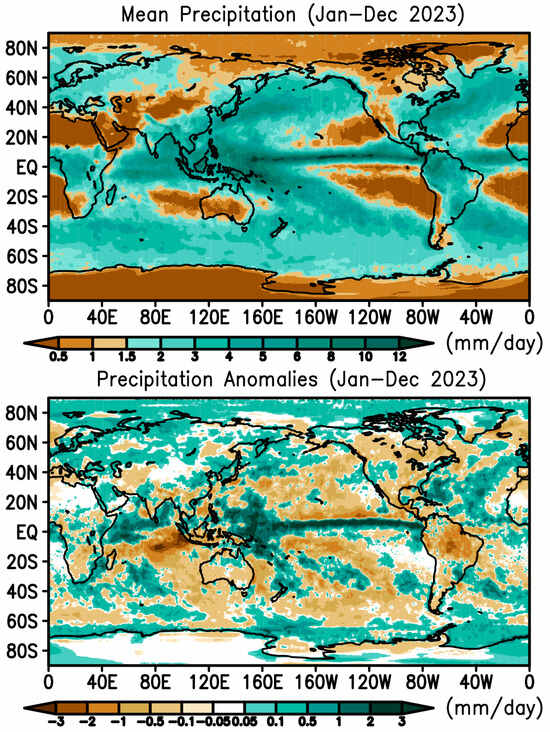
Figure 1


