The Coupled Effect of Mid-Tropospheric Moisture and Aerosol Abundance on Deep Convective Cloud Dynamics and Microphysics

Abstract
: The humidity of the mid troposphere has a significant effect on the development of deep convection. Dry layers (dry intrusions) can inhibit deep convection through the effect of a thermal inversion resulting from radiation and due to the reduction in buoyancy resulting from entrainment. Recent observations have shown that the sensitivity of cloud top height to changes in mid-tropospheric humidity can be larger than straightforward “parcel dilution” would lead us to expect. Here, we investigate how aerosol effects on cloud development and microphysics are coupled to the effects of mid-tropospheric dry air. The two effects are coupled because the buoyancy loss through entrainment depends on droplet evaporation, so is controlled both by the environmental humidity and by droplet sizes, which are, in turn, controlled in part by the aerosol size distribution. Previous studies have not taken these microphysical effects into account. Cloud development and microphysics are examined using a 2-D non-hydrostatic cloud model with a detailed treatment of aerosol, drop, and ice-phase hydrometeor size spectra. A moderately deep mixed-phase convective cloud that developed over the High Plains of the United States is simulated. We find that a dry layer in the mid troposphere leads to a reduction in cloud updraft strength, droplet number, liquid water content and ice mass above the layer. The effect of the dry layer on these cloud properties is greatly enhanced under elevated aerosol conditions. In an environment with doubled aerosol number (but still realistic for continental conditions) the dry layer has about a three-times larger effect on cloud drop number and 50% greater effect on ice mass compared to an environment with lower aerosol. In the case with high aerosol loading, the dry layer stops convective development for over 10 min, and the maximum cloud top height reached is lower. However, the effect of the dry layer on cloud vertical development is significantly reduced when aerosol concentrations are lower. The coupled effect of mid-tropospheric dry air and aerosol on convective development is an additional way in which long term changes in aerosol may impact planetary cloud processes and climate.1. Introduction
The effect of mid-tropospheric moisture on convective cloud development has been studied extensively in recent years [1−9]. These studies have found that convection in a dry atmosphere tends to be more readily diminished by entrainment of very dry air. The phenomenon occurs globally: in the northern hemisphere [1], southern hemisphere [4,10], and the tropics [2,11]. The effect has also been studied at oceanic [11], continental [1,12], and coastal locations [13,8]. The processes have been examined through case studies [4], statistics [2], and numerical simulations [7,13,14]. The studies also help to understand the large-scale moisture-convection feedback [15]. For example, Ridout [6] found that there is a large increase in stored buoyant energy in association with the suppression of deep convection by dry layers. The presence of dry mid-tropospheric air may cause the buildup of buoyant energy for subsequent episodes of deep convection, such as those associated with the onset of the Madden-Julian oscillation [16−18].
The relationship between moist convection and free-tropospheric humidity involves various mechanisms at a range of spatial and temporal scales [15]. Locally, dry air inhibits deep convection through two processes [12]: firstly, the thermal inversion due to the dry layer can prevent the development of convective clouds; and secondly, the entrainment of dry air as the parcel rises decreases the buoyancy [8,11,14,19]. Both processes control the cloud top height. The impact of tropospheric humidity above the boundary layer depends on parcel buoyancy [14,20,21], as well as other factors, such as wind shear, which may affect the mixing rate near the cloud boundary [6]. Shepherd et al. [13] discussed the relative importance of moisture in the boundary layer and in the mid troposphere. For long-lived, organized convective systems with low cloud bases and large wind shear, low-level moisture may likely affect convective activity. For short-lived convection with weak wind shear and higher cloud bases, moisture in the mid troposphere can significantly impact rainfall. The process of the suppression of deep convection by dry layers touches on some of the fundamental issues of representing moist convection [7,22].
Sherwood et al. [8] noted that the observed sensitivity of cloud top height to changes in free-tropospheric humidity was larger than expected from straightforward “parcel dilution”. They found that a 20% increase in mean water vapor mixing ratio between 750 and 500 hPa was associated with about 1 km deeper maximum cloud penetration. They also suggested that dynamical feedbacks involving the evaporation of lofted cloud or raindrops during the early stages of convective growth might affect subsequent development.
An important process that has not been considered in the previous studies is the aerosol properties of the entrained air. The buoyancy loss through entrainment is very much dependent on the amount of droplet evaporation, thus, on the environmental humidity and droplet sizes. Because droplet spectra depend on aerosol spectra, aerosol abundance may affect cloud development. In addition, the entrained aerosol may result in spectral broadening from CCN growing into small droplets [23]. Therefore, the effect of aerosol on the droplet spectrum is a potentially important process affecting convective clouds and their response to dry layers.
Recent studies have found that the interaction between aerosol and deep convective cloud is complex, depending on many factors, such as aerosol loading, geographical location and atmospheric thermal conditions [24–27]. In our previous work [27] we used a cloud model with a detailed treatment of microphysics and aerosols to study the sensitivity of a continental deep convective cloud to the abundance of aerosol. The meteorological conditions show that there is a dry layer in the midtroposphere. The model produced different cloud features when the initial aerosol concentrationincreased. In the high aerosol case, cloud development was inhibited for about10 min, but other caseswith low aerosol concentrations did not exhibit this feature. The inhibition in cloud development wasclearly related to the dry layer, but also depended on the amount of aerosol. However, we did not investigate the link between them. Nevertheless, our previous results show that dry layers and aerosol are likely to have a coupled effect on deep convective cloud development, which has not been previously studied.
Wang et al. [28] have shown that the smaller droplets in polluted stratocumulus clouds evaporate more rapidly and that this enhanced evaporation during entrainment can counteract the increases in liquid water path associated with reduced collision-coalescence. A recent modeling study of Trade Wind maritime cumulus [29] found that the lifetime, depth and width of the clouds can decrease in environments with high aerosol abundance, which is contrary to the expectation that the cloud lifetime should be enhanced. They attribute this response to the enhanced evaporation during entrainment in clouds with more drops. A similar study of warm continental cumulus [30] also found evaporation to play a role in determining cloud response to changes in aerosol. A similar process occurs during entrainment of dry air in the deeper mixed-phase clouds that we study here. Our work contrasts with theirs because we study unstable, moderately deep mixed-phase clouds rather than warm trade cumulus within a capped inversion. We also examine the coupled effect of humidity and aerosol in controlling the cloud response.
Our specific objective is to study the response of a moderately deep mixed-phase cloud to aerosol abundance both with and without a dry layer in the mid troposphere. We investigate the issue with a dynamic cloud model with bin-resolved microphysics and aqueous-phase chemistry. The research contributes to and extends our current understanding of factors influencing deep convective clouds in the following ways. Firstly, it will study the synergistic roles of aerosol abundance and mid-tropospheric humidity, while previous work has studied these as separate issues. Secondly, the simulations with the cloud model provide information on the way in which drop spectra respond. In this paper, sections 2 and 3 describe the cloud model and the experimental design. Section 4 discusses results from numerical simulations and conclusions follow in Section 5.
2. The Model
In this section we briefly describe the model used for simulations. The numerical model is the Model of Aerosols and Chemistry in Convective Clouds (MAC3), which is based on the axisymmetric nonhydrostatic cloud model of Reisin et al. [31] and includes newly added modules of trace gas chemistry and aerosol [32,33].
The governing equations include the following atmospheric variables: the vertical and radial velocity, pressure perturbation, virtual potential temperature perturbation, specific humidity perturbation, specific number concentration and mass of aerosol in a spectral bin, specific number concentration and mass for each type of cloud hydrometeors in a size bin, and concentration of activated ice nuclei. The microphysical processes are solved with an accurate multi-moment method [31,34–36].
Four hydrometeor species are included: drops, ice crystals, graupel and snowflakes (aggregates). Each particle species is divided into 34 bins, with mass doubling for adjacent bins. The aerosol spectrum is represented by 43 bins. The warm microphysical processes include nucleation of drops based on the calculated supersaturation and the prognosed aerosol spectrum, condensation and evaporation, collision-coalescence, and binary break-up. The cold processes are ice nucleation (deposition, condensation-freezing, contact nucleation, and immersion freezing), ice multiplication, deposition and sublimation of ice, ice-ice and ice-drop interactions, melting of ice particles, sedimentation of drops and ice particles.
The aerosol module includes prognostic equations for the number concentration of aerosol particles and of the specific mass of aerosols which become activated, scavenged by hydrometeors, and remain in the air, and regenerated following complete evaporation/sublimation of hydrometeors, gas-cloud interactions and aqueous phase oxidation of dissolved SO2 by ozone and hydrogen peroxide.
The effects of entrainment and mixing in our model are included in a turbulent diffusion operator [37]. The operator is defined as
3. The Experimental Design
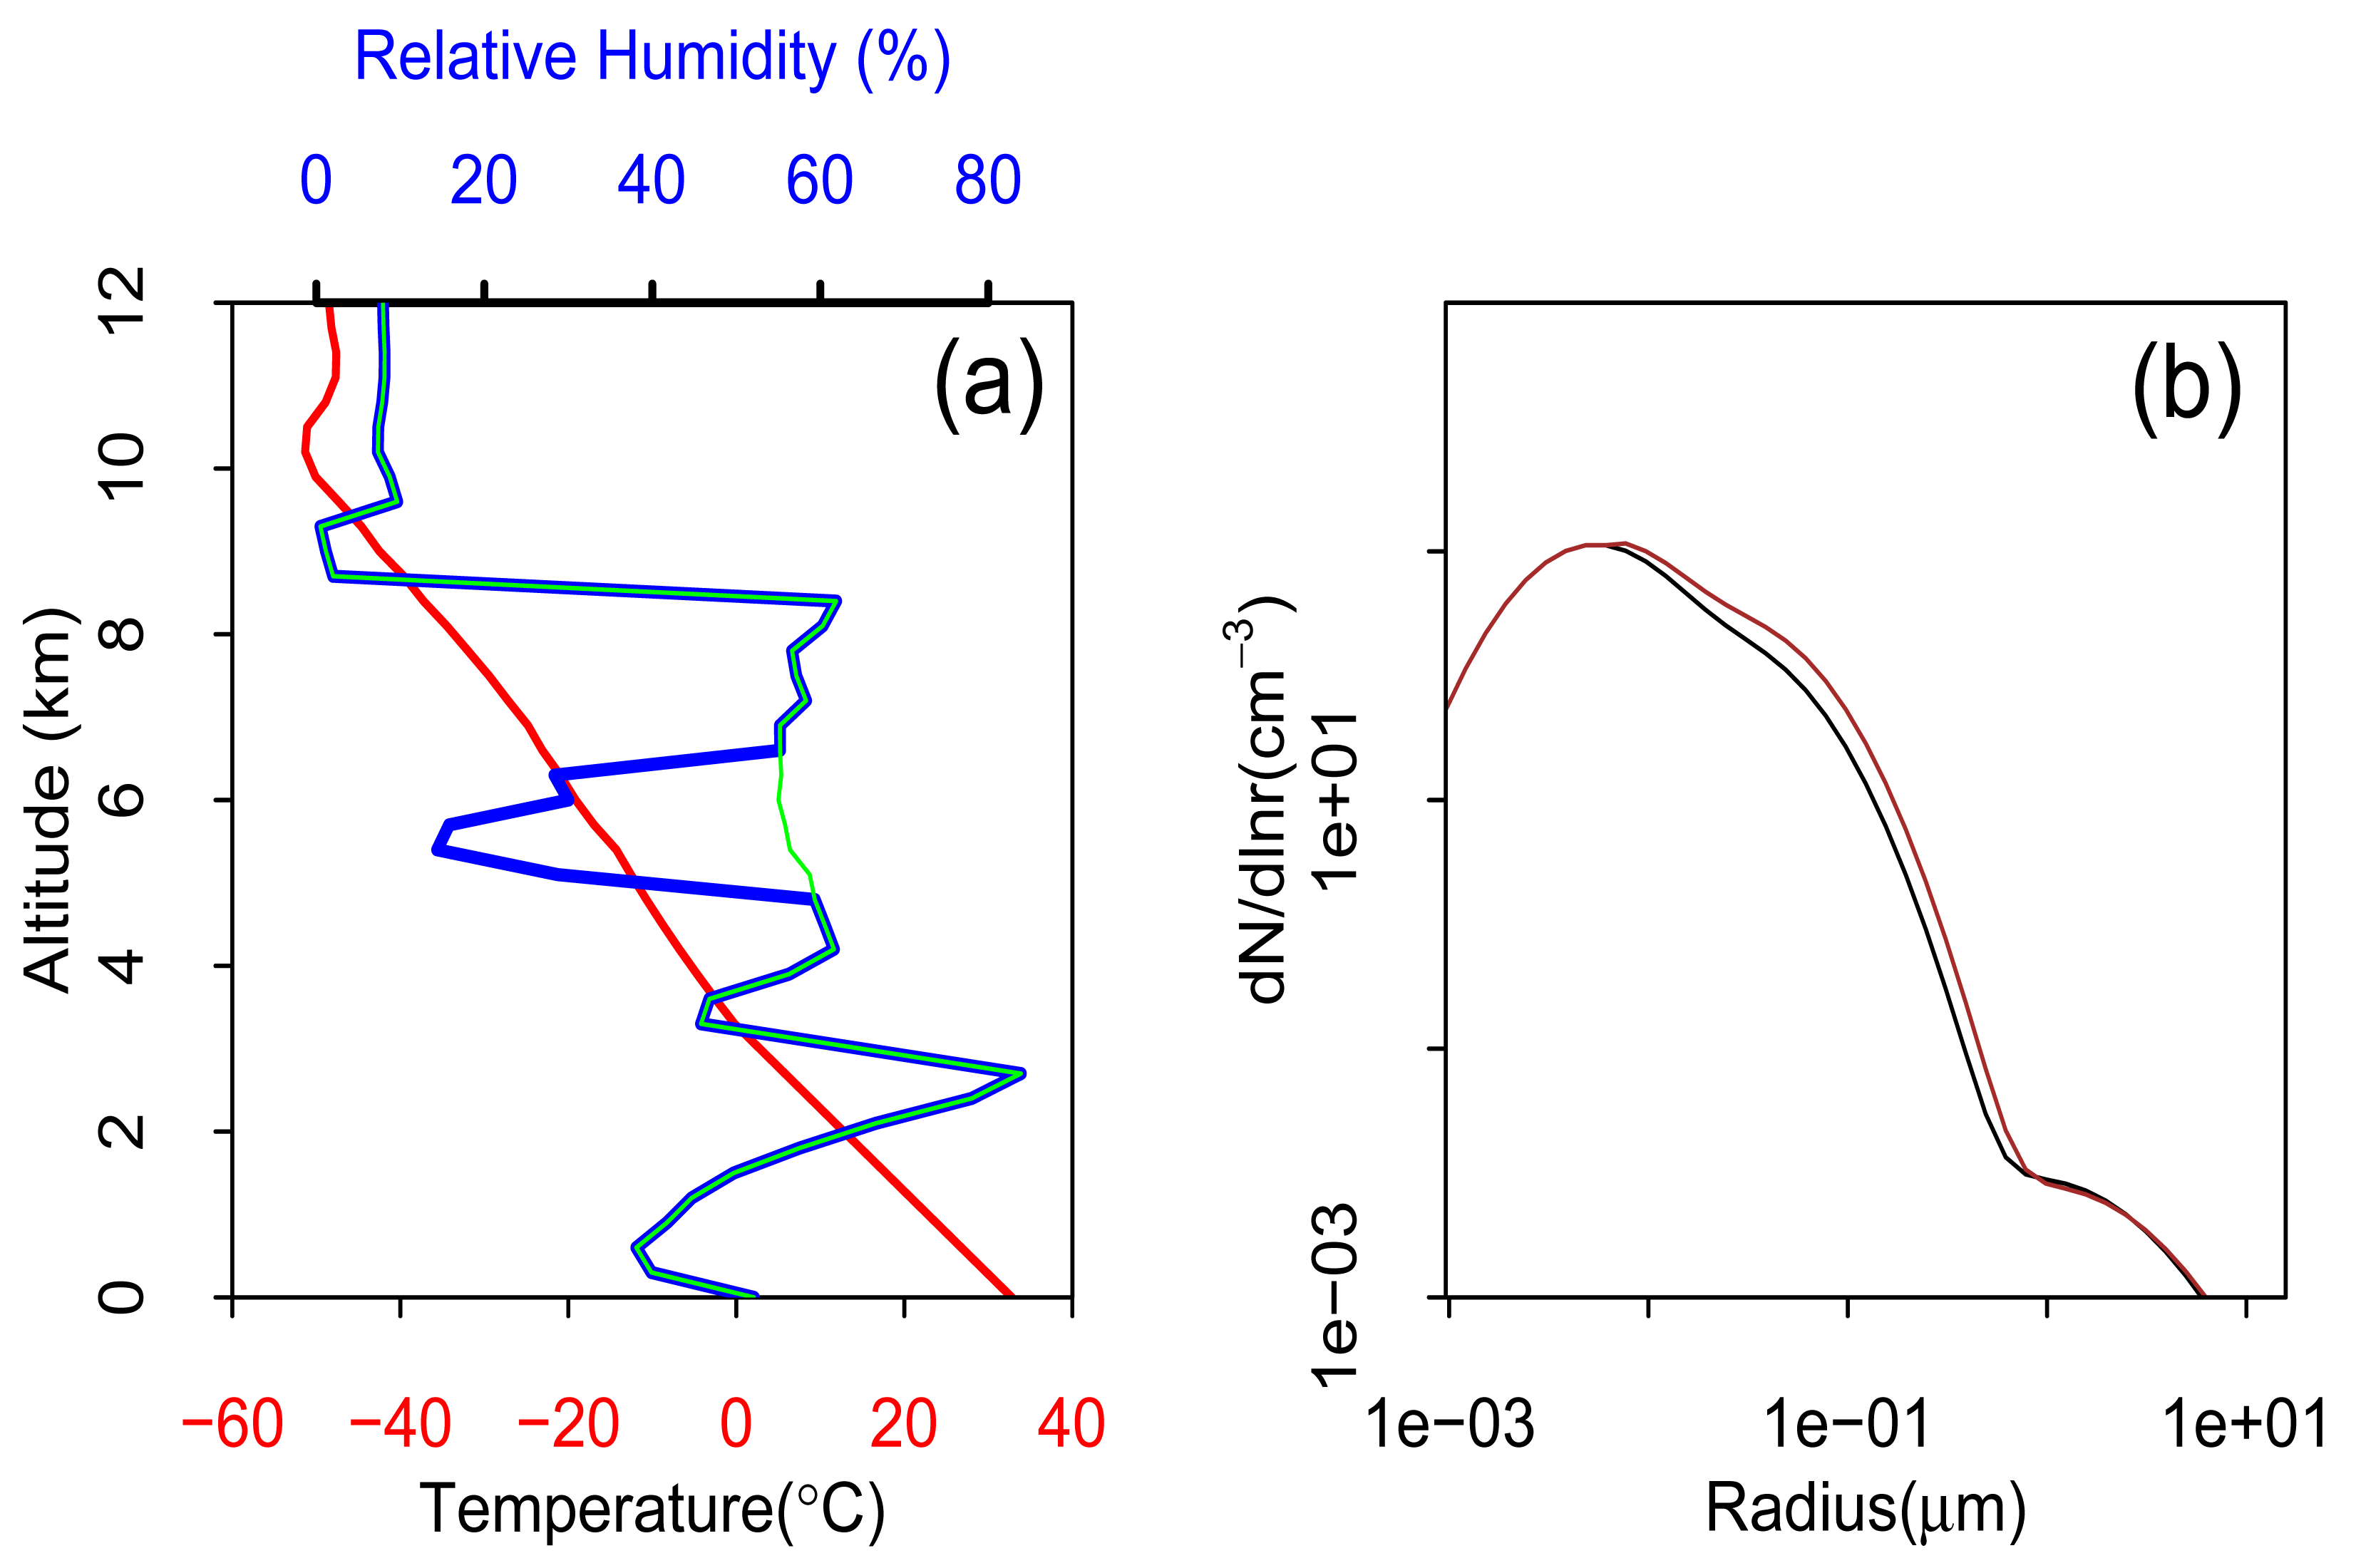
The 19 July 1981 Cooperative Convective Precipitation Experiment (CCOPE) case has been extensively studied [27,33,39–43]. This case is characterized by moderate instability and weak wind shear [44]. The vertical profile of relative humidity is marked by large changes on a scale of about 2 km (Figure 1a). A dry layer between 4.9 and 6.4 km is of particular interest in this study.
MAC3 is run here in an axisymmetric configuration, which is appropriate for clouds that developed during the low wind shear conditions of 19 July 1981 over Montana [27]. The model domain is 12 km in the vertical direction and 6 km in the radial direction, with vertical and horizontal grid sizes of 300 m and 150 m, respectively, and 60 and 120 m, respectively, for the high resolution runs. Open boundary conditions are used [37]. A time step of 2.5 s is used for condensation/evaporation of drops or deposition/sublimation of ice particles, and 0.01 for gas absorption. All other processes use a time step of 5 s. The cloud is initialized by a 450 m wide warm bubble of 2 K in a layer centered at an altitude of 900 m.
The initial aerosol size distribution is based on observations made in Mondana, USA by Dye et al. [44] and is typical of continental conditions (Figure 1b). The distribution is made up of 3 modes (the Aitken, accumulation and coarse modes), with geometric mean particle radii of 0.006, 0.03, and 1.0 μm, respectively [27,33,43,45]. These modes are mapped onto the model's 43 aerosol particle size bins, with the mass per particle and the number concentration in each bin treated as prognostic tracers. Based on Hobbs et al. [46], Yin et al. [32] assumed that 15% of the aerosol particles were water soluble, and that the soluble aerosols were composed of ammonium sulphate, regardless of size. Only sulphate aerosols are considered in the simulations. We also assume that theaerosol number (and mass) decreases with altitude according to where N(z = 0,rn) is the aerosol concentration at the surface, z is altitude, rn is aerosol radius, and zs (= 2 km) is the scale height [27]. Because aerosol is a prognostic tracer in the model, this initial aerosol profile changes in and around the cloud as the cloud develops, and aerosol particles transported and processed by the cloud can be re-entrained [33]. Cui and Carslaw [45] studied the sensitivity to changes in the vertical profile of aerosol. They found that the cloud causes an increase in upper troposphere aerosol mass when the initial upper troposphere aerosol abundance is low and a decrease when the initial abundance is high. Realistic increases in cloud condensation nucleus concentrations reduce the precipitation efficiency and thereby the scavenging efficiency of aerosol and allow more aerosol material to be transported to the upper troposphere. The enhancement of the upper troposphere aerosol mass after a cloud event therefore increases in clouds with higher CCN concentration, a positive feedback driven by the response of scavenging rates to aerosol abundance.
The purpose of the model runs is to examine how the cloud changes as the aerosol concentration and mid-tropospheric humidity vary. The base case simulation used here is the same as that used by Yin et al. [33] who compared the simulated cloud with observations. The model provided a reasonably good reproduction of the cloud base height, size of the main updraught core, updraught speed at cloud base, start time of the updraught decay, location and time of the maximum liquid-water content, concentration of droplets, first appearance of graupel, and location of the first radar echo. Therefore, the simulated cloud in this case is in good agreement with observations. In sensitivity simulations, Cui et al. [27] found that the dynamics and microphysics changed in response to changes in the aerosol size distribution. When the number of particles in the aerosol accumulation mode was doubled (which controls the evolution of cloud drop number depending on the attained supersaturation), the cloud top temporally stopped ascending.
In order to investigate the coupled effect of the mid-tropospheric humidity and the aerosol abundance, we designed four simulations. The first run is the base case, which uses the observed humidity profile, including the dry layer between 4.8 and 6.6 km (see Figure 1a), and the standard number of particles in the aerosol accumulation mode. We refer to this as case OrgDry. This simulation is identical to the base case described by Yin et al. [33] and Cui et al. [27] and produced ∼930 cm−3 drops at cloud base. In the second run, the humidity in the mid-tropospheric dry layer is increased from ∼15% to ∼55% (OrgWet), but cloud base drop concentrations are identical to OrgDry when the two clouds just formed. In the third simulation, the observed dry humidity profile is used but the amplitude of the aerosol accumulation mode is doubled (DblDry), resulting in a cloud base drop concentration of 1200 cm−3. In the fourth simulation, the amplitude of the accumulation mode is doubled and the humidity in the mid-tropospheric dry layer is increased to ∼55% (DblWet). The four cases are listed in Table 1.
4. Results
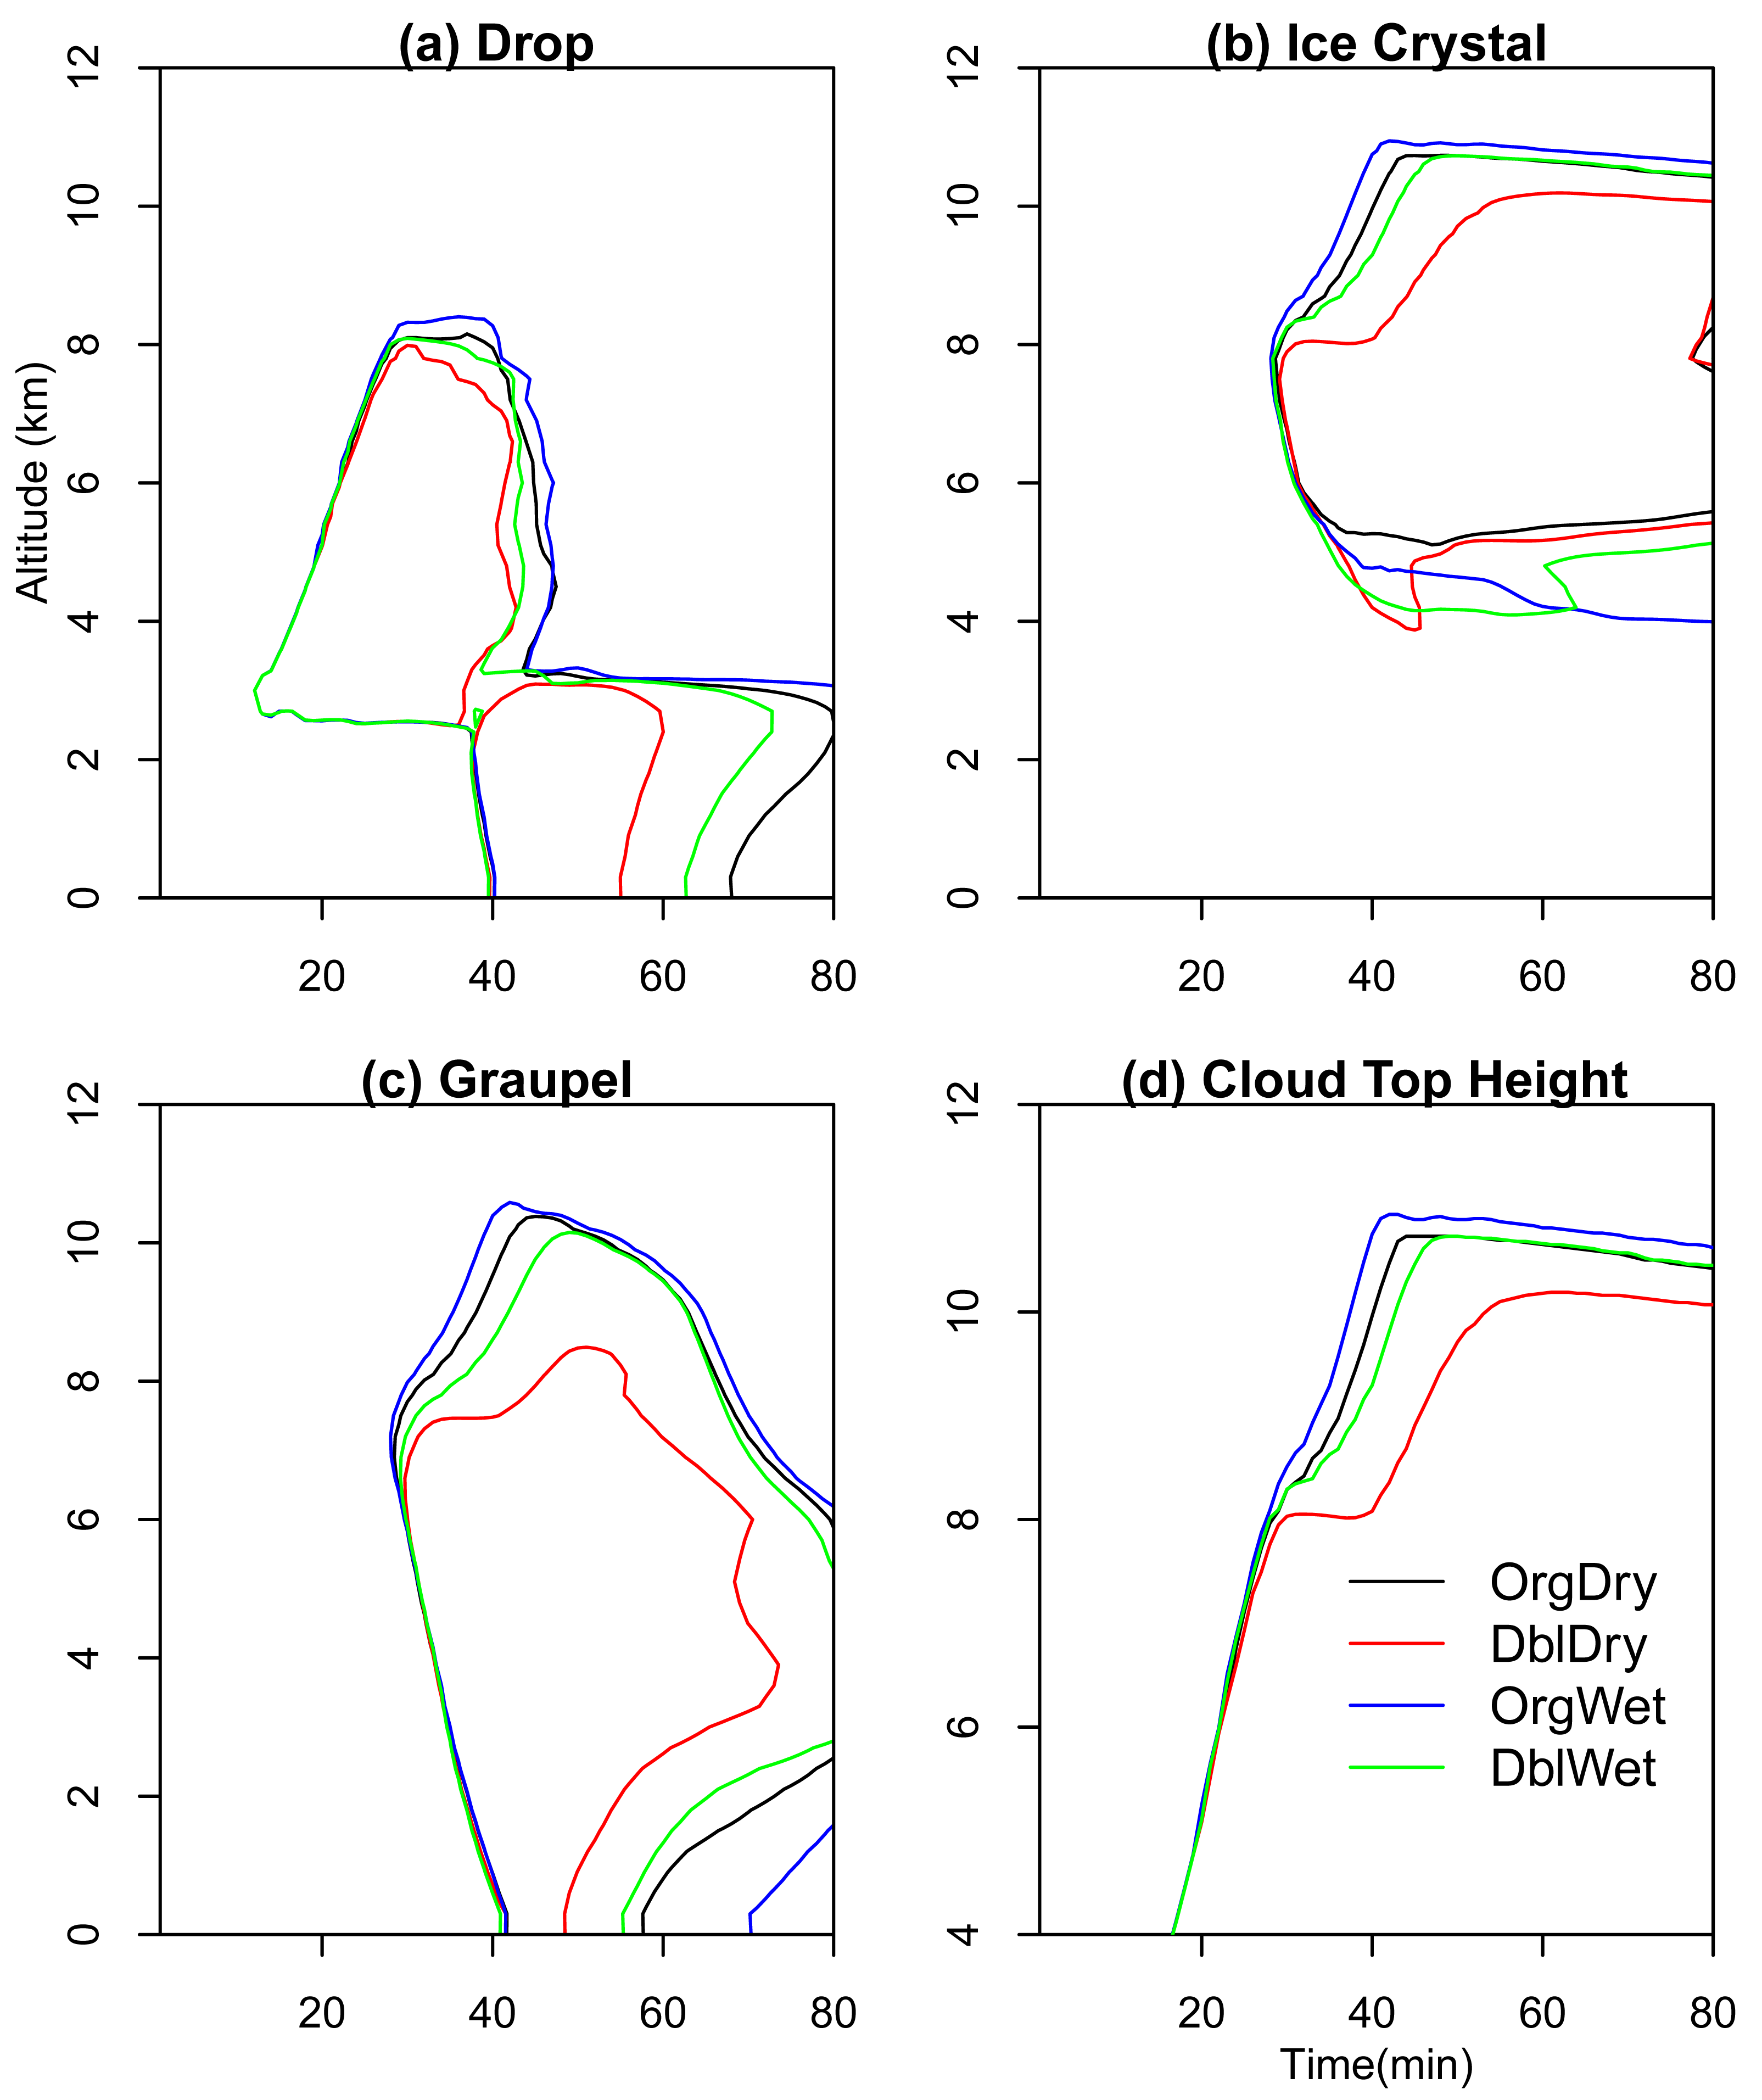
Figure 2 shows how the cloud top height and masses of drops, ice crystals and graupel vary between the four cases. In response to the changes in mid-tropospheric humidity and aerosol abundance, the simulated clouds gradually diverge after 20 min. A distinctive feature in cloud top heights is the change from stagnation in case DblDry (at ∼30–40 min) to more steady development in case DblWet. Another feature is the increase in the top height of graupel particles in the high aerosol case when the dry layer is removed. The top of graupel particles is ∼8 km in case DblDry, while it is ∼10 km in DblWet. Generally, cloud top heights tend to increase with decreasing aerosol without the dry layer. Figures 2a and 2c also indicate the large differences in surface precipitation between the four runs. In Cui et al. [27], we studied the aerosol impact on precipitation, and found that an increase in aerosol loading produces more numerous but smaller drops, which suppresses the warm rain process and reduces the precipitation. Cui et al. [26] examined the microphysical responses to aerosol abundance. We found that the precipitation of the CCOPE cloud is mainly from melting graupel particles. When the aerosol loading increases from moderate to high, the suppressed warm rain process results in smaller graupel particles. Therefore, the precipitation is suppressed. The results of the four cases in this paper are in agreement with our previous studies. In short, the dry layer can suppress the development of the convective cloud and the suppression is more significant with increasing aerosol loading. The causes for the coupled effect will be studied by examining the differences in cloud microphysics and thermal dynamics in Figures 3–7.
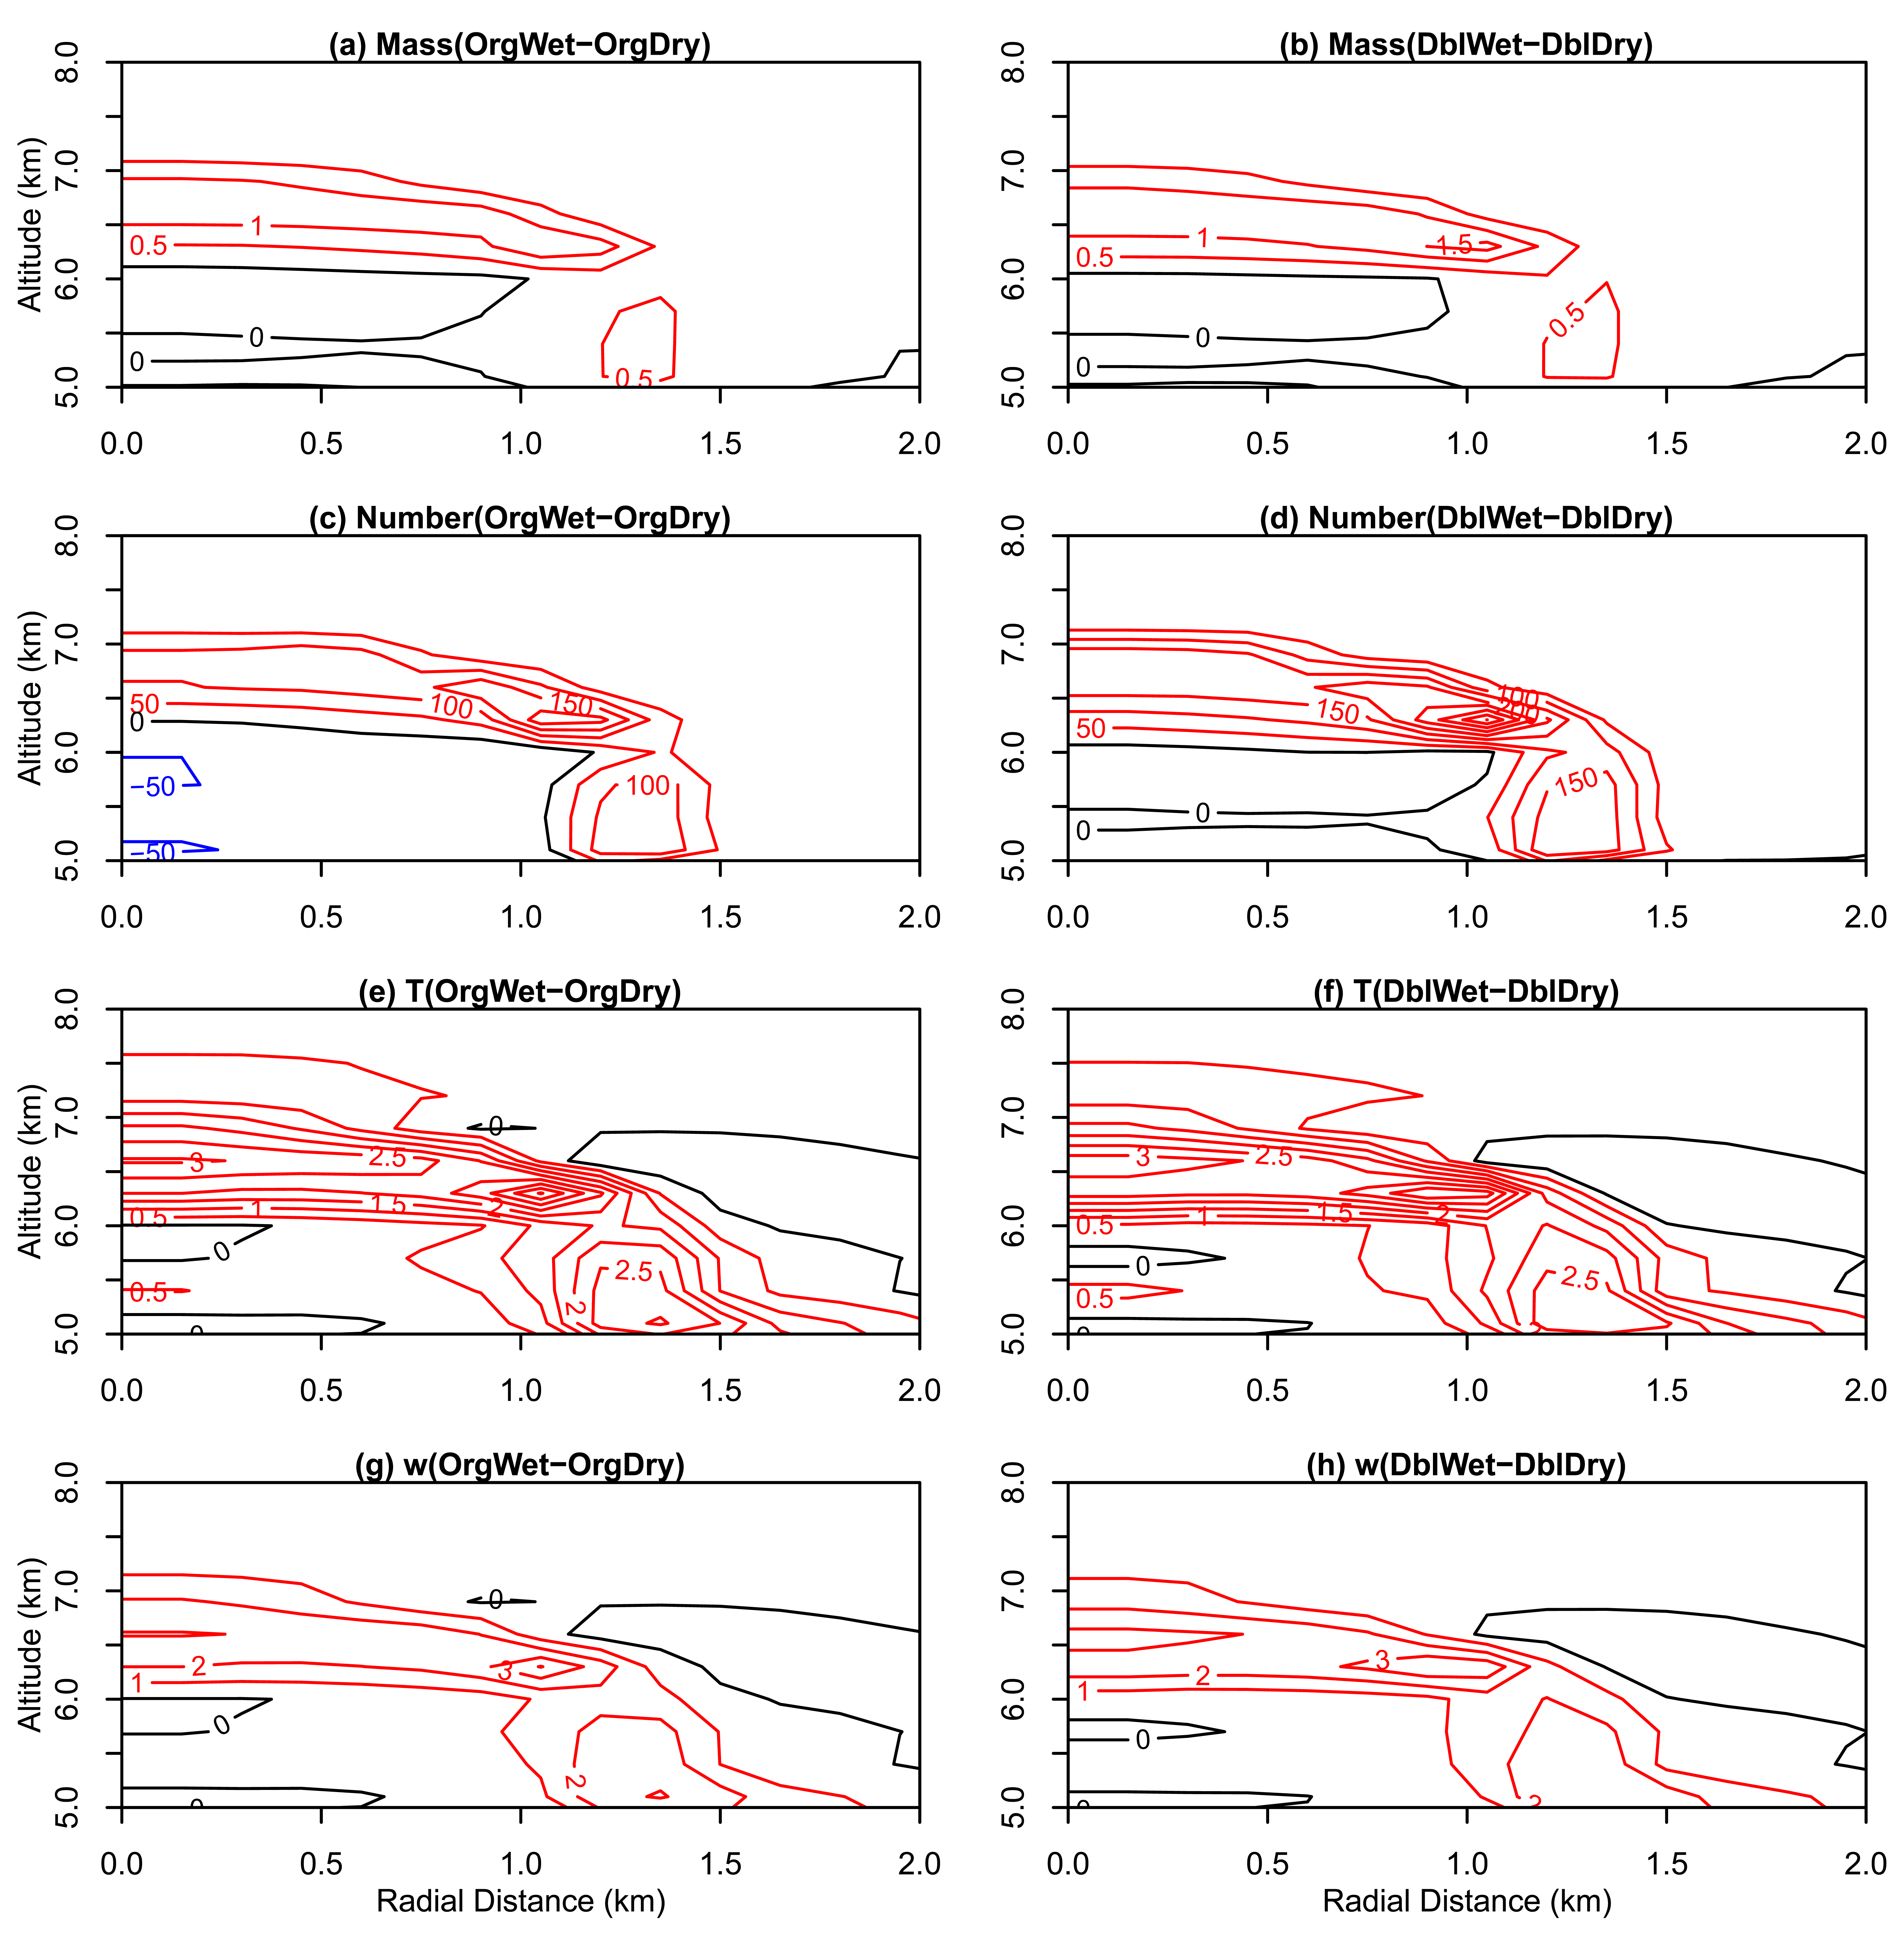
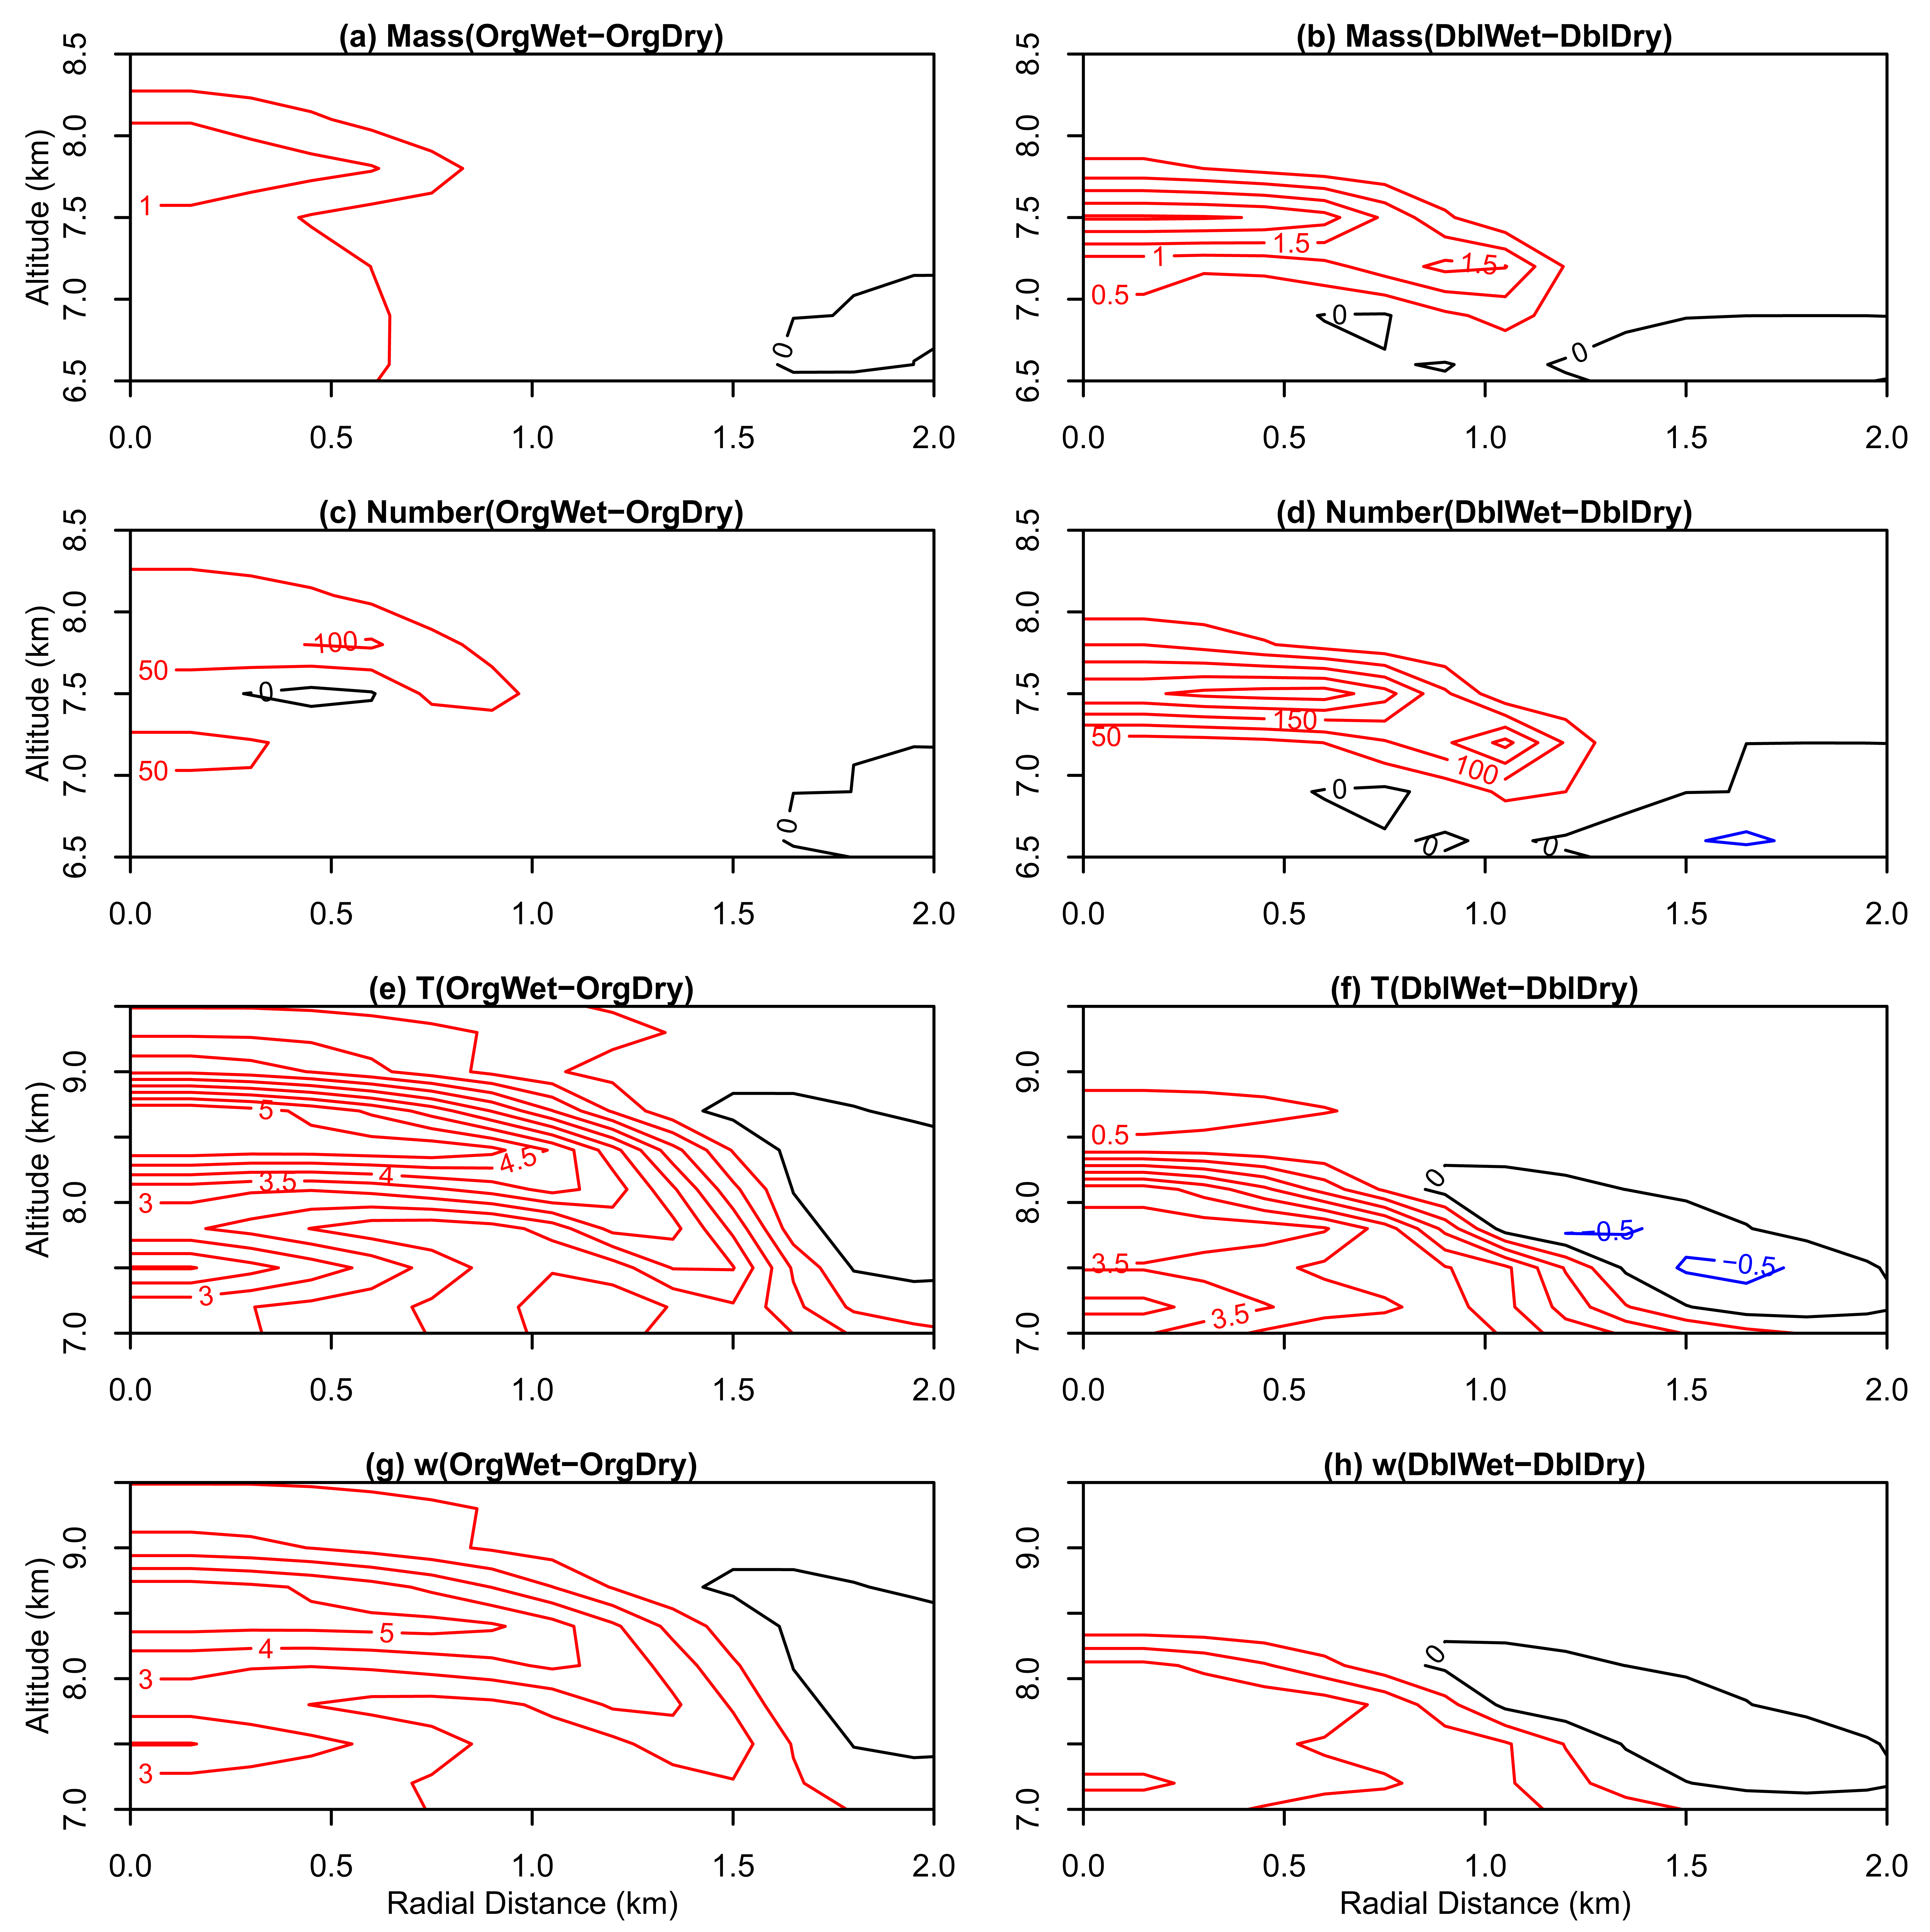
Cloud tops reach the bottom of the dry layer at ∼20 min in all cases and pass through the dry layer during 20–25 min. At 20 min, there are very small differences in the maximum specific mass of hydrometeors and the cloud top height. After passing the dry layer at ∼25 min, the differences become progressively larger in the upper part of the clouds. Figure 3 shows the differences at 25 min of simulation in the specific mass and number concentrations of droplets, in the temperature, and in the vertical velocity between the wet cases (without the dry layer) and dry cases (with the dry layer). A comparison between the wet and dry cases with the same initial aerosol concentrations indicates that the removal of the dry layer leads to more vigorous clouds, in accord with previous findings [9]. Both the specific mass (Figure 3a,b) and number concentrations (Figure 3c,d) of droplets increase near the cloud top and edge when the dry layer is removed, and the increase is much larger in the high aerosol cases (DblWet-DblDry). The removal of the dry layer suppresses evaporation caused by mixing and produces more droplets near the cloud top and edge. Droplet concentrations increase in these regions by up to 200–300 cm−3. Less evaporation, together with less dilution, results in more latent heating in wet cases (Figure 3e,f). This, in turn, promotes updrafts that are stronger by up to 2–3 ms−1 (Figure 3g,h). The differences are larger in the high aerosol cases (right column of Figure 3) than in the low aerosol cases (left column) because the droplets are smaller and evaporate more quickly. Therefore, the microphysical structure, cloud dynamics, and thermodynamics, are more sensitive to changes in initial aerosol abundance in a dry mid-tropospheric environment.
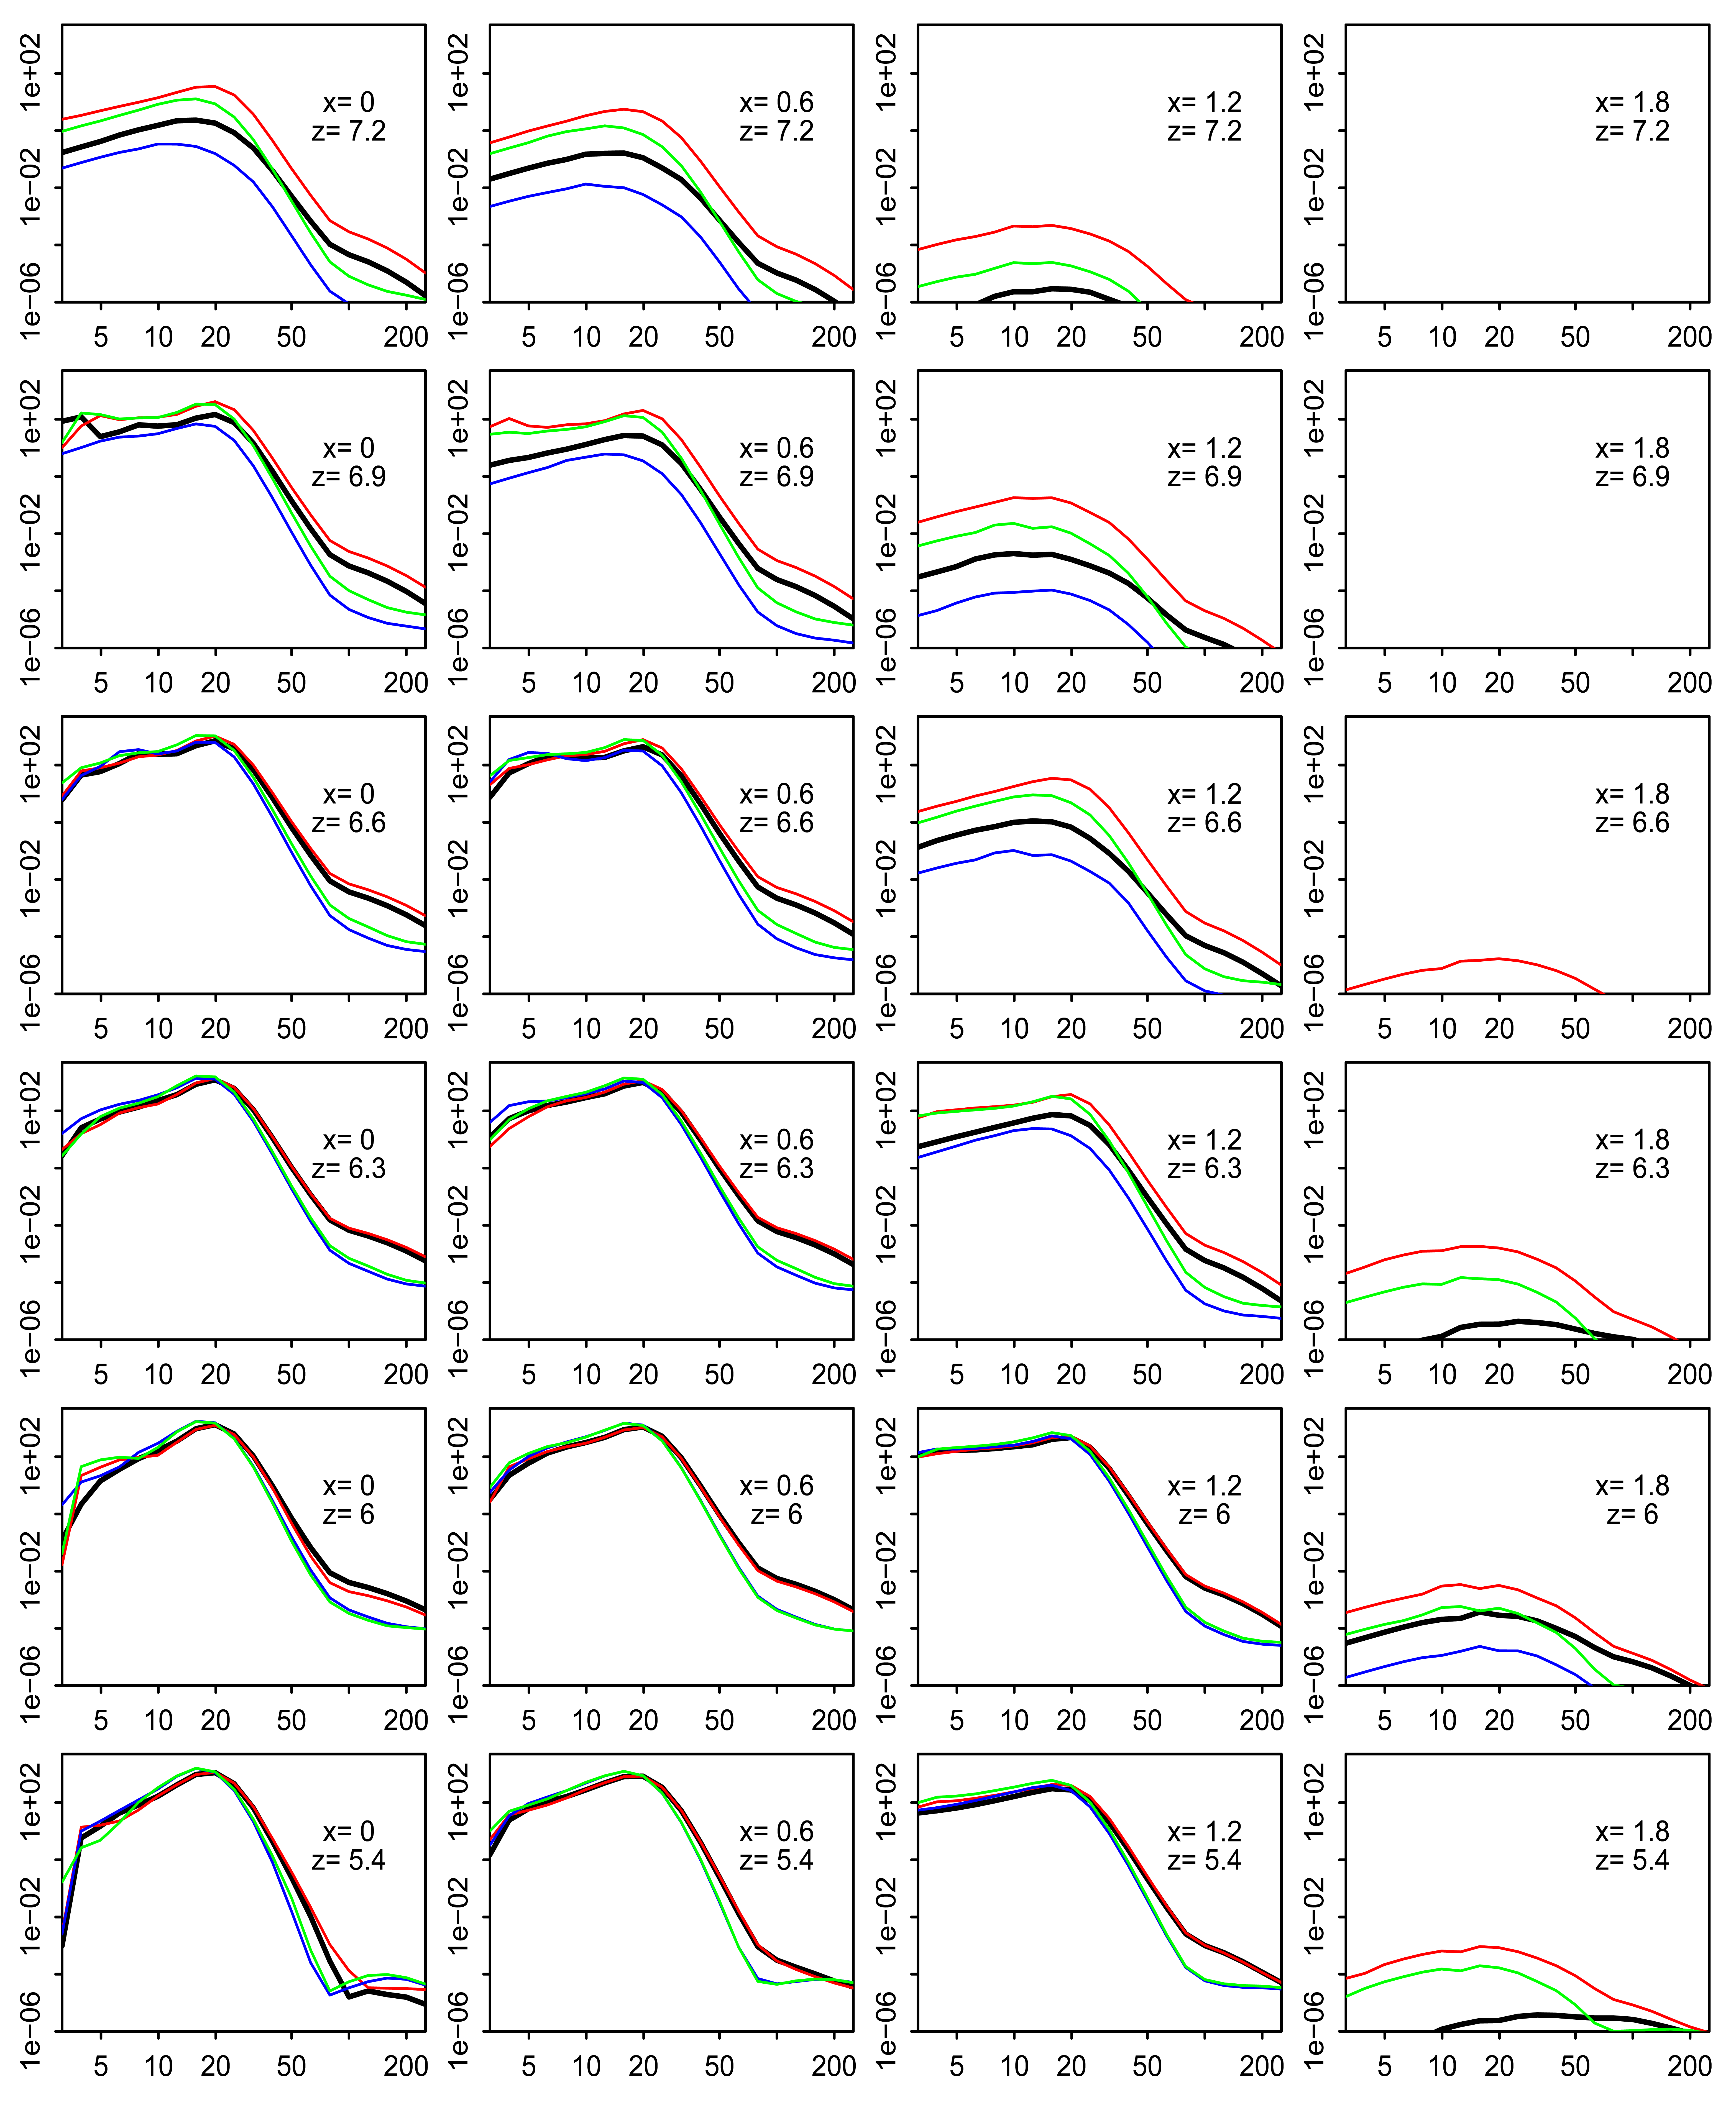
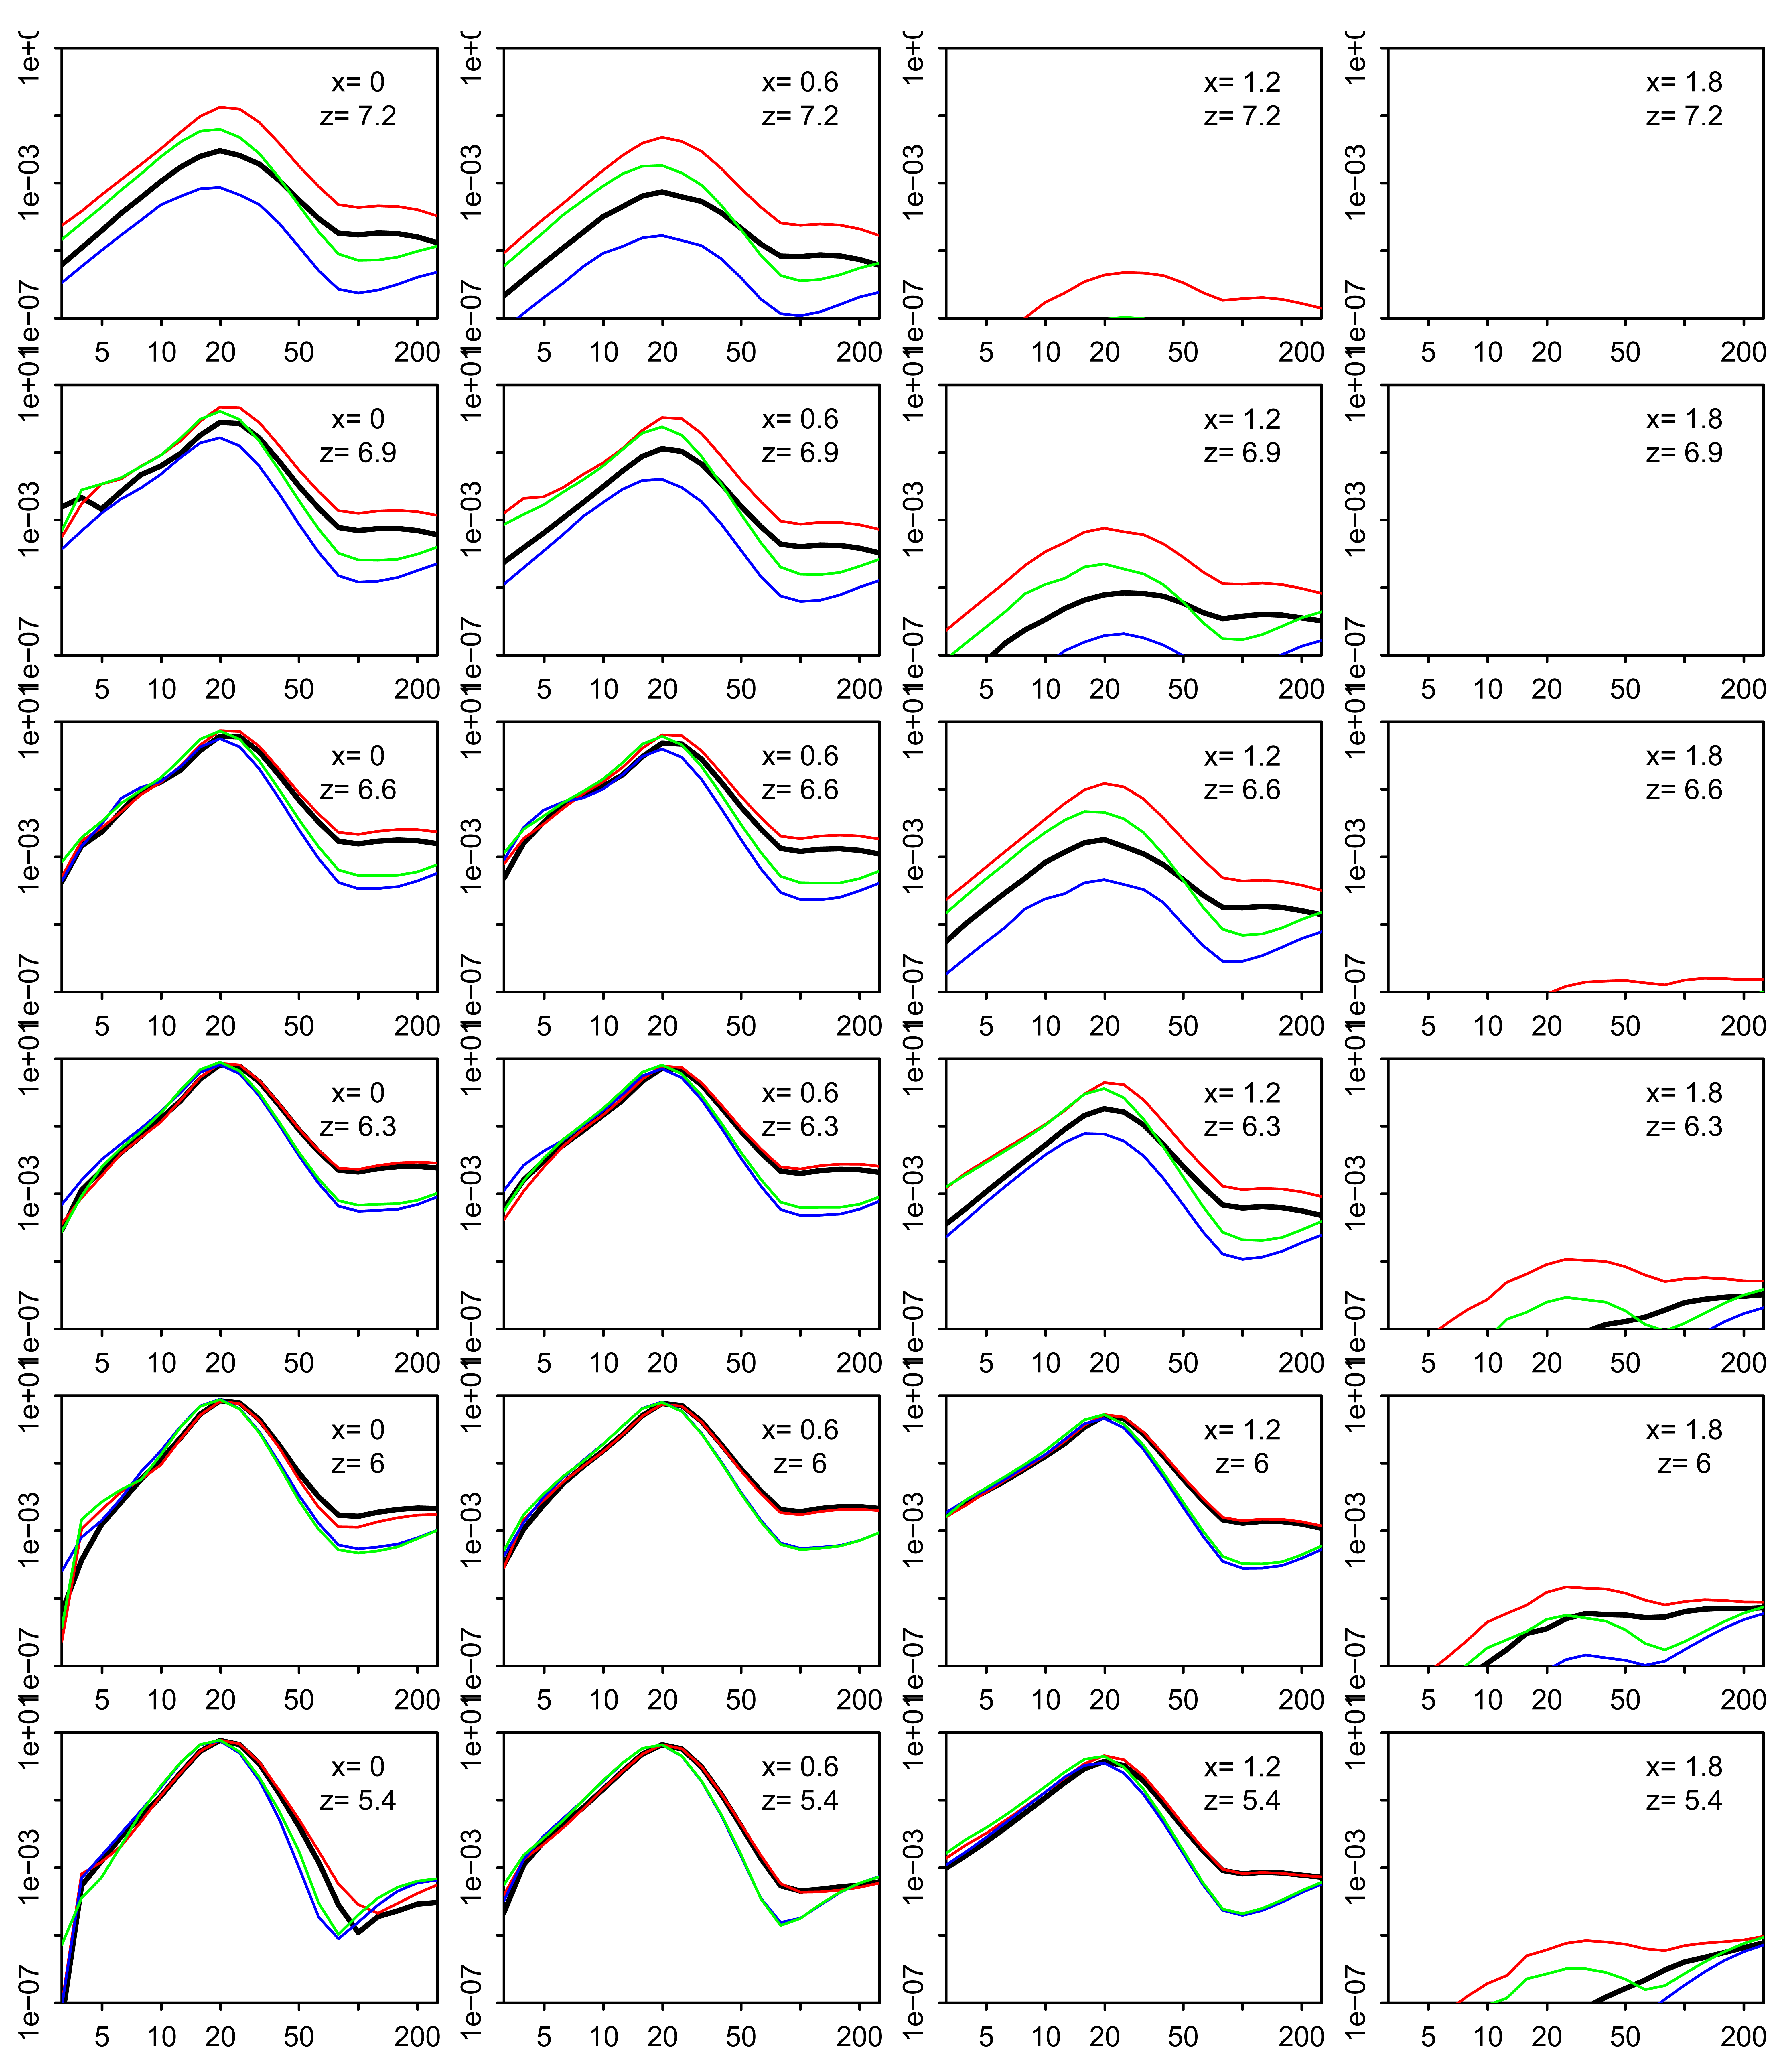
Two factors in this study may affect buoyancy. One is the changes in the initial moisture profiles, which causes a change of 6.88 J kg−1 in convective available potential energy. The other is discussed below. The process of buoyancy depletion acts through cloud microphysical processes, which eventually affects cloud thermodynamics and dynamics. The size distribution of drops reveals how the aerosol abundance and mid-tropospheric humidity affect cloud microphysics at selected locations (Figures 4,5). For cases with the same initial aerosol concentrations (OrgDry and OrgWet; or DblDry and DblWet), the drop distributions vary with mid-tropospheric humidity. In the cloud lateral boundary and the cloud top layer, the figures indicate an increase in both the number and mass distributions in the wet cases. But in the updraft core, the differences in the distributions are small between the dry and wet cases, reflecting the fact that the mid-tropospheric dry layer reduces the drops by a process of mixing and entrainment across the cloud boundaries and gradually into the core. For cases with the same initial moisture profile, the distributions of drops vary with the initial aerosol concentrations. In the cloud lateral boundary and the cloud top layer, the figures indicate an increase in both the number and mass distributions in the low aerosol cases. But in the updraft core, there are more large drops (radii ≥ 20 μm) for the low aerosol cases. Figures 3–5 indicate that mid-tropospheric humidity is an important factor affecting cloud microphysics, but that the magnitude of the effect depends also on the aerosol abundance.
Figure 6 shows the differences at 35 min in the specific mass and number concentrations of droplets, in the temperature, and in the vertical velocity between the wet and dry cases. A comparison between this figure and Figure 3 (for 25 min) indicates that the impact of removing the dry layer becomes stronger than at 25 min although the maximum impact is now in air that has ascended 1–1.5 km above the dry layer at 6 km. The effect of the dry layer on drop specific mass is ∼ 2 g kg−1 in the high aerosol case but only ∼1 g kg−1 in the low aerosol case. Likewise, drop number concentrations are reduced by greater than 200 cm−3 by the dry layer but only by ∼50 cm−3 in the low aerosol case. The enhancement of cloud activity is therefore much larger between cases DblDry and DblWet. Case DblWet still has a cloud top height lower than case OrgWet, but it overcomes the stagnation in case DblDry. The top of graupel particles grows accordingly (Figure 2).
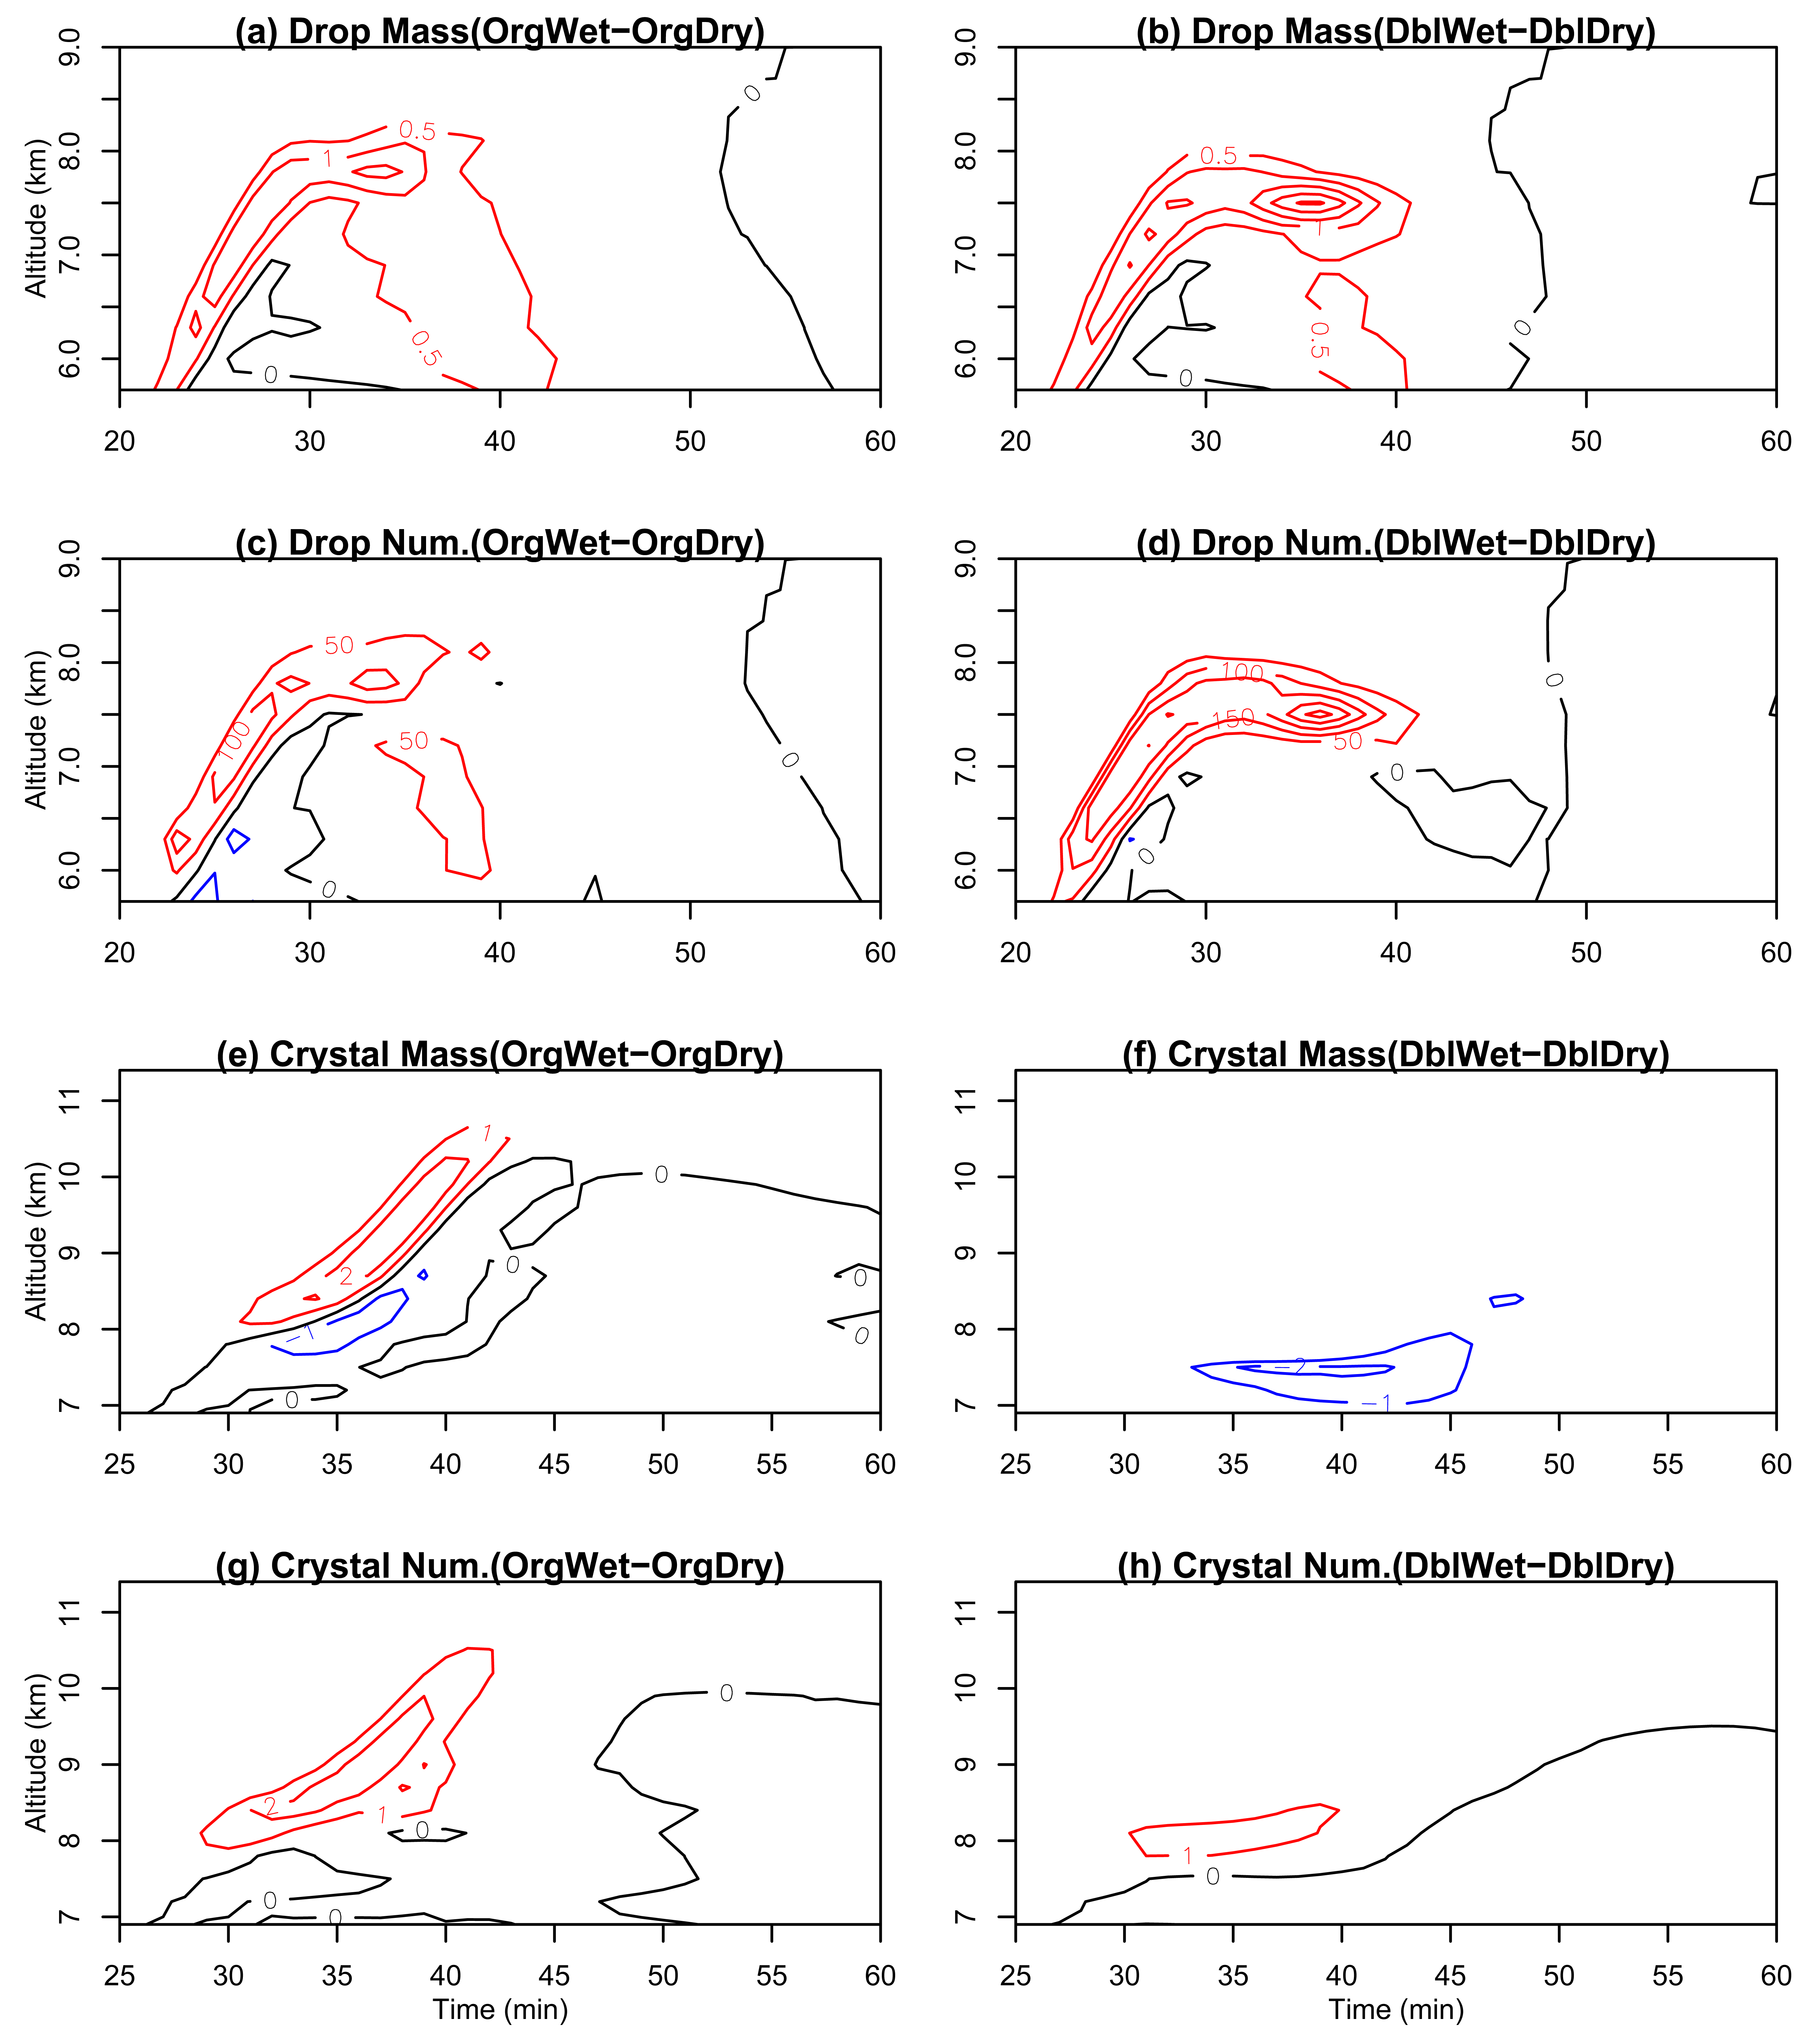
Figure 7 shows the differences of drops and ice crystals at the cloud centre between the wet and dry cases. Both the mass and number of drops increase near the cloud top when the dry layer is removed because the moister atmosphere delays drop dissipation (Figure 7a–d). The effect of the dry layer on drop mass and number is most pronounced and lasts longer in the high aerosol cases (right hand panels of Figure 7). The effect of the dry layer on ice properties is slightly different to that on the droplets. The removal of the dry layer results in greater ice crystal mass, mostly before 40 min (Figure 7e–g), and again, the effect of the dry layer on ice mass is more pronounced and lasts longer when aerosol concentrations are higher. However, the increase in ice crystal number concentration upon removing the dry layer is larger in the low aerosol case (Figure 7g) than in high aerosol case (Figure 7h). This is because immersion freezing is the dominant mode of freezing in these simulations, and in the low aerosol case, there are more large drops near the cloud top, which is preferable for immersion freezing [27].
Sherwood et al. [8] found that increases in mid-tropospheric moisture lead to higher cloud top, but the sensitivity is too large to be explained by simple dilution of parcel buoyancy through entrainment and mixing. They speculated that dynamical feedbacks involving the re-evaporation of lofted cloud and/or raindrops during the earlier stages of convective growth produce effects at later times that enhance the overall sensitivity. The results of our simulations are consistent with Sherwood et al.'s speculation in terms of the liquid phase microphysics. The role of mid-tropospheric moisture in determining cloud top height is not to add more buoyancy. Rather, it is to lose less buoyancy by reducing evaporation from entrainment and mixing. Therefore, the air parcel theory cannot explain the sensitivity in the Sherwood study. Our study further indicates that the ice phase microphysics is different in response to changes in mid-tropospheric moisture. Since the cloud top heights in the Sherwood et al. study reached above 12 km, the existence of supercooled droplets is almost excluded. Cloud drops will have already frozen either by heterogeneous freezing at lower levels or by homogeneous freezing at higher levels. Therefore, the ice phase microphysics causes a final push on the cloud top. This has been confirmed by previous studies [27,47].
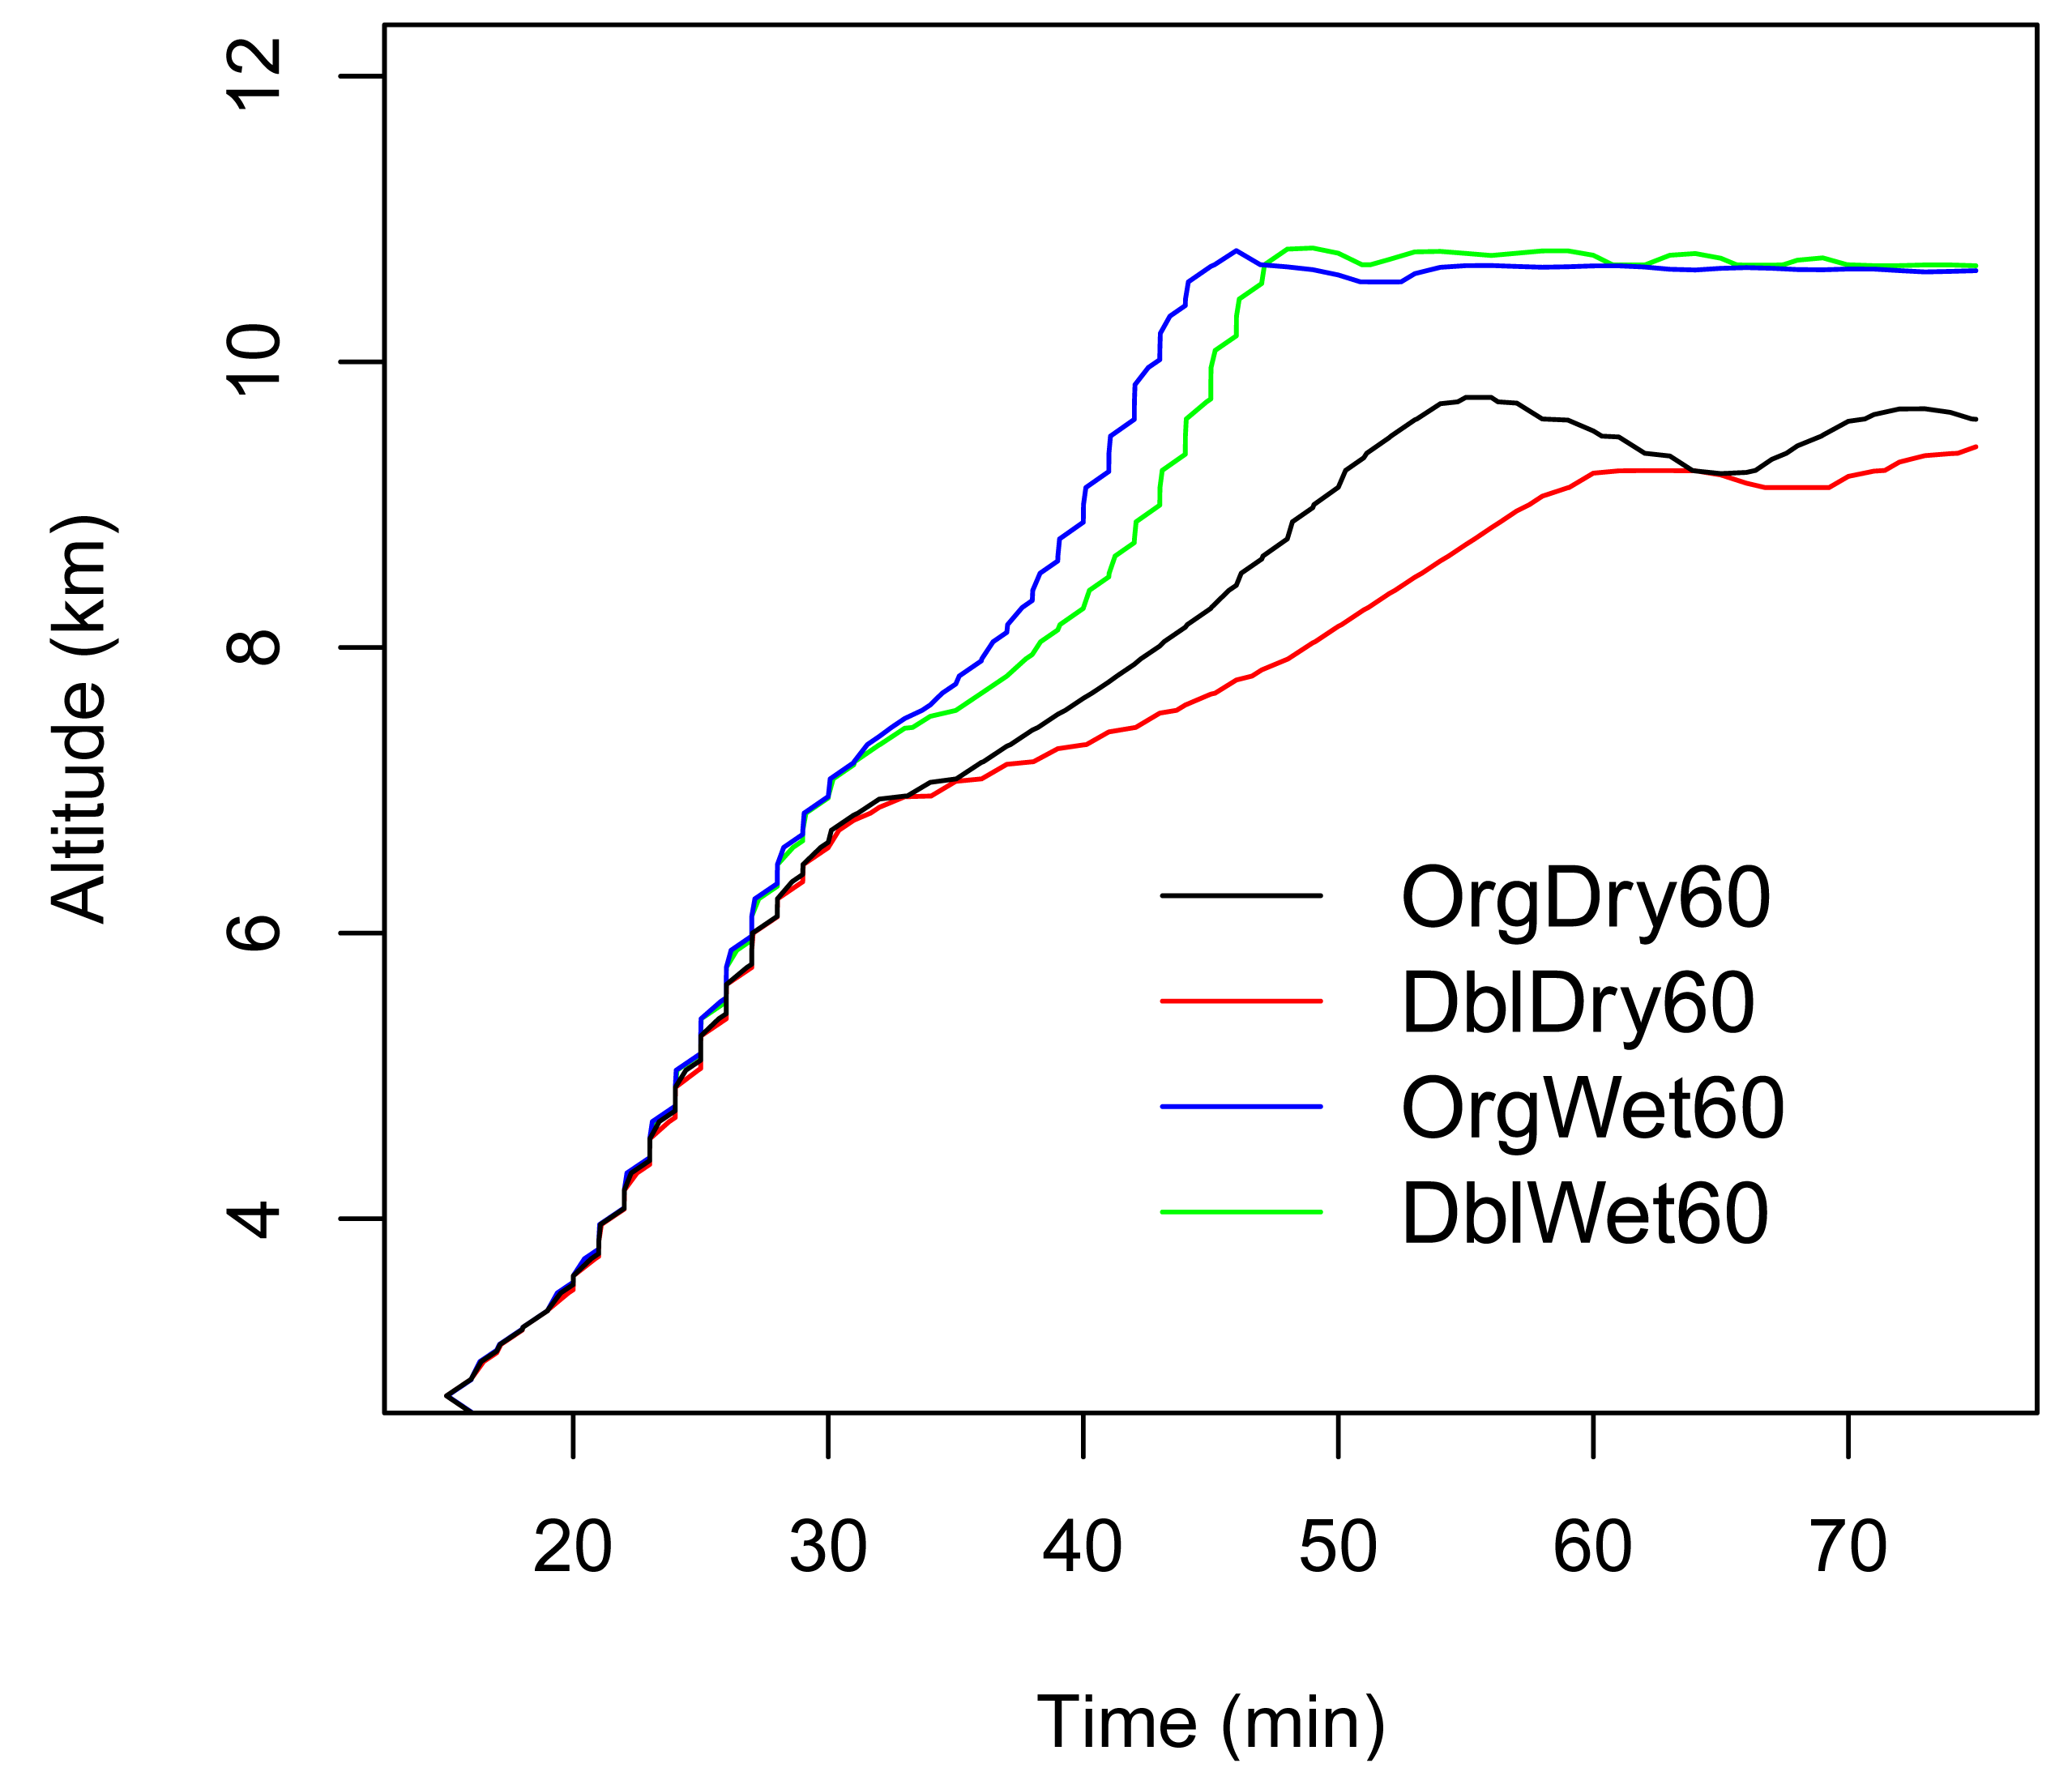
The treatment of entrainment and mixing processes in the model is related to the spatial resolution. To see the effect of resolution on the results, we have simulated the cloud 4 runs of 60-m resolution in the horizontal and 120-m in the vertical: OrgDry60, OrgWet60, DblDry60, and DblWet60. The temporal variation of cloud top height is shown for the runs in Figure 8. The cloud top height increases when the dry layer is removed for both high and low aerosol loadings.
The results of the sensitivity simulations show that dry layers can reduce cloud activity when aerosol loading is high.
5. Discussion
In this paper, we investigate the coupling effect of mid-tropospheric moisture and aerosol abundance on the dynamics and microphysics of a deep convective cloud with a numerical model. The model used is a dynamic cloud model with bin-resolved microphysics and aqueous-phase chemistry. The cloud, which formed on 19 July 1981 over Montana during CCOPE, developed in an environment with moderate instability, weak wind shear, and a strong dry layer in the mid-troposphere. We investigate the response of the cloud to aerosol abundance both with and without the mid-tropospheric dry layer.
The impact of dryness in the mid troposphere varies greatly depending on aerosol abundance. When aerosol abundance is high, the impact is large enough to alter cloud dynamics and microphysics. In the high aerosol case, the cloud top temporarily stops ascending with the dry layer. This does not repeat when the dry layer is removed. We find that the dry layer in the mid troposphere leads to a reduction in cloud updraft strength, droplet number, liquid water content and ice mass in the cloud above the layer, and that these changes are amplified in high aerosol environments.
Our simulations agree with previous studies showing that mid-tropospheric dryness suppresses convective activity. These studies suggest that dry layers inhibit the growth of deep convective clouds by reducing buoyancy through entrainment. Our study, using bin-resolved microphysics, suggests that enhanced evaporation of clouds with high droplet concentrations can significantly impact cloud, and that macroscopic and microphysical properties can add to a dilution effect.
Mixing in our model is calculated at each time step as a result of turbulent diffusion, which is assumed to mix cloudy and dry air down to the molecular level. There are two conceptual models for the mixing of cloudy and clear air [48] and each is likely to result in a different response of the cloud microphysics during entrainment. The homogeneous mixing model applies to situations in which the turbulent mixing time scale is much longer than the droplet evaporation timescale. During a mixing event, all cloud droplets therefore experience the same environmental conditions, all droplets experience some evaporation and the number of cloud droplets does not change. In the inhomogeneous mixing model, in which the timescale of turbulent mixing is shorter than droplet evaporation, cloud drops at the interface between cloudy and clear air can evaporate completely, while other drops are unaffected. In this case, the number of drops decreases. A number of studies have simulated the mixing process from the scale of individual entrained blobs of dry air (∼ metres) down to the Kolmogorov scale at which molecular diffusion wipes out remaining gradients in cloud properties [23,49,50] and there is some limited observational support [49,51]. These studies have concluded that mixing in real clouds is likely to lie somewhere between extreme homogeneous and heterogeneous, and that homogeneous mixing is the best approximation of clouds with high turbulence, such as cumulus clouds.
Lehmann et al. [52] discussed the scales in a quantitative way. They argued that the ratio of the mixing and thermodynamic reaction time scales, defined as the Damköhler number, is not sufficient to describe the mixing process. They introduced a transition length scale to separate the inertial subrange into a range of length scales for which mixing between ambient dry and cloudy air is inhomogeneous, and a range for which the mixing is homogeneous. The mixing process depends on many factors, such as the mixing scales, turbulence, ambient relative humidity and sizes and concentrations of drops [53]. In the case of extreme heterogeneous mixing, droplets at the cloudy-clear interfaces evaporate completely, so the rate of loss of cloud water and droplet number is essentially independent of the droplet size spectrum. In homogeneous mixing, all droplets are exposed to the same humidity and all droplets will evaporate a bit, so such mixing will lead to different evaporation behavior in clouds with different initial drop spectra. The timescale of evaporation depends on the droplet size (τ = r2/DS, where r is the droplet radius, D is the diffusion coefficient of water vapor in air and S is the subsaturation (e.g., 0.1 for RH = 90%). Therefore, in the cloud with a larger number of smaller droplets, evaporation occurs more rapidly during mixing. In the cloud we simulate here, the mid-cloud median radius varies between 12 and 14 μm between the base case and doubled CCN case, so the timescale of drop evaporation is initially 36% longer in the cloud with larger drops. This difference in evaporation timescale increases further as the droplets shrink. Thus, during mixing, the cloud with initially smaller droplets suffers a greater loss of droplets as it passes through the dry layer.
The effect of aerosol on cloud dissipation that we have described operates under relatively dry mid-tropospheric conditions with fairly high aerosol loadings. Under these conditions, the entrainment of dry air combined with the rapid evaporation of small droplets leads to more rapid reduction of cloud buoyancy than would be expected from either a moist mid-troposphere with fairly high aerosol loadings or a dry mid-troposphere with fairly low aerosol loadings alone. Moist maritime air with low aerosol number concentrations is at the opposite extreme. Dry layers have less effect because oceanic areas have typically low aerosol and droplet concentrations and high humidity. The competition for the available moisture is much less intense, and the reduction of cloud buoyancy is much slower. The recent study by Koren et al. [23] revealed that convective cloud top height increases over the Atlantic due to aerosol. Recently, Huang et al. [54] studied the deep convective cells over the Black Forest in Germany. They found more vigorous growth and a higher top in the cleaner cloud. This is caused partly by the cooling effect through evaporation, which occurred near the cloud boundary via entrainment and mixing of the cloud air with the ambient dry air and in the upper part of the cloud through the Bergeron mechanism. The reduction in cloud updraft strength due to enhanced evaporation in polluted environments that we describe here is likely to be more important over dry continental regions with high aerosol loadings.
Limitations of our current research include the resolution, and the treatment of the entrainment and mixing. The resolution in the current simulations resolution is restricted by the use of bin resolved microphysics and aerosol processes. Turbulent mixing takes considerable time before droplets are exposed to the environmental air [49]. Such a delay should be taken into account when low spatial resolution is used. The work by Jeffery and Reisner [55] shows promise for future development.
The existence of dry layers is a global phenomenon [56]. This phenomenon has been extensively studied during the TOGA COARE IOP [6,57,58]. Recent studies have revealed dry layers in other regions, such as over the West African monsoon area [7], the Arctic [59], the United Kingdom [60] and the tropical Atlantic [61,62]. Further work is required to determine whether the effect of aerosol on cloud dissipation could have wider implications for large-scale cloud processes and climate. A large-scale suppression of convective clouds over substantial regions due to enhanced aerosol loadings would amount to a negative climate forcing (due to the increased outgoing longwave radiation from lower cloud tops). However, the effect of aerosol on convective clouds is complex and multi-faceted [63], and net changes in cloud top height need to be considered alongside changes in anvil properties, cloud extent, etc. Previous studies [64,65] have also suggested that increased aerosol leads to cloud invigoration due to a suppression of low-level rainout and aerosol washout, as well as elevation of the onset of precipitation. The greater suppression of cloud development due to more rapid evaporation in dry layers would compete with that effect. Further research also needs to answer how the coupling effect controls convective cloud fields rather than just a single cloud.


| Experiment | Description | |
|---|---|---|
| Aerosol | Humidity | |
| OrgDry | Base case | Base case |
| DblDry | Amplitude of the accumulation mode is doubled | Base case |
| OrgWet | Same as in the base case | Relative humidity between 5.1 and 6.3 km is increased to ∼55%. |
| DblWet | Amplitude of the accumulation mode is doubled | Relative humidity between 5.1 and 6.3 km is increased to ∼55%. |
Acknowledgments
Funding is acknowledged from the EU Tropical Convection and Nitrogen Oxides project (TROCCINOX, EVK2-CT-2001-00122), the EU PARTS project (EVK2-CT-2001-00112) and the NERC project Modelling the Modification of Convective Clouds due to Anthropogenic Aerosol (MMOCCAA, NE/B50469X/1).
References
- Maddox, R.A.; McCollum, D.M.; Howard, K.W. Large scale patterns associated with severe summertime thunderstorms over central Arizona. Weather Forecast. 1995, 10, 763–778. [Google Scholar]
- Brown, R.G.; Zhang, C.D. Variability of midtropospheric moisture and its effect on cloud-top height distribution during TOGA COARE. J. Atmos. Sci. 1997, 54, 2760–2774. [Google Scholar]
- Gilmore, M.S.; Wicker, L.J. The Influence of midtropospheric dryness on supercell morphology and evolution. Mon. Weather Rev. 1998, 126, 943–958. [Google Scholar]
- McBride, J.L.; Frank, W.M. Relationships between stability and monsoon convection. J. Atmos. Sci. 1999, 56, 24–36. [Google Scholar]
- McCaul, E.W.; Weisman, M.L. The sensitivity of simulated supercell structure and intensity to variations in the shapes of environmental buoyancy and shear profiles. Mon. Weather Rev. 2001, 129, 664–687. [Google Scholar]
- Ridout, J.A. Sensitivity of tropical Pacific convection to dry layers at mid- to upper levels: Simulation and parameterization tests. J. Atmos. Sci. 2002, 59, 3362–3381. [Google Scholar]
- Derbyshire, S.H.; Beau, I.; Bechtold, P.; Grandpeix, J.Y.; Piriou, J.M.; Redelsperger, J.L.; Soares, P.M.M. Sensitivity of moist convection to environmental humidity. Q. J. R. Meteorol. Soc. 2004, 130, 3055–3079. [Google Scholar]
- Sherwood, S.C.; Minnis, P.; McGill, M. Deep convective cloud-top heights and their thermodynamic control during CRYSTAL-FACE. J. Geophys. Res. 2004, 109. [Google Scholar] [CrossRef]
- Takemi, T.; Hirayama, O.; Liu, C.H. Factors responsible for the vertical development of tropical oceanic cumulus convection. Geophys. Res. Lett. 2004, 31. [Google Scholar] [CrossRef]
- Bhat, G.S. Some salient features of the atmosphere observed over the north Bay of Bengal during BOBMEX. Indiana Acad. Sci. 2003, 112, 131–146. [Google Scholar]
- Parsons, D.B.; Yoneyama, K.; Redelsperger, J.L. The evolution of the tropical western Pacific atmosphere-ocean system following the arrival of a dry intrusion. Q. J. R. Meteorol. Soc. 2000, 126, 517–548. [Google Scholar]
- Roca, R.; Lafore, J.P.; Piriou, C.; Redelsperger, J.L. Extratropical dry-air intrusions into the West African monsoon midtroposphere: An important factor for the convective activity over the Sahel. J. Atmos. Sci. 2005, 62, 390–407. [Google Scholar]
- Shepherd, J.M.; Ferrier, B.S.; Ray, P.S. Rainfall morphology in Florida convergence zones: A numerical study. Mon. Weather Rev. 2001, 129, 177–197. [Google Scholar]
- Redelsperger, J.L.; Parsons, D.B.; Guichard, F. Recovery processes and factors limiting cloud-top height following the arrival of a dry intrusion observed during TOGA COARE. J. Atmos. Sci. 2002, 59, 2438–2457. [Google Scholar]
- Grabowski, W.W.; Moncrieff, M.W. Moisture-convection feedback in the tropics. Q. J. R. Meteorol. Soc. 2004, 130, 3081–3104. [Google Scholar]
- Madden, R.A.; Julian, P.R. Detection of a 40–50 day oscillation in the zonal wind in the tropical Pacific. J. Atmos. Sci. 1971, 28, 702–708. [Google Scholar]
- Madden, R.A.; Julian, P.R. Description of global-scale circulation cells in the tropics with a 40–50 day period. J. Atmos. Sci. 1972, 29, 1109–1123. [Google Scholar]
- Kawamura, R.F.; Fukuta, Y.; Ueda, H.; Matsuura, T.; Iizuka, S. A mechanism of the onset of the Australian summer monsoon. J. Geophys. Res. 2002, 107, 4204. [Google Scholar]
- Mapes, B.E.; Zuidema, P. Radiative-dynamical consequences of dry tongues in the tropical troposphere. J. Atmos. Sci. 1996, 53, 620–638. [Google Scholar]
- Raymond, D.J.; Blyth, A.M. A stochastic mixing model for nonprecipitating cumulus. J. Atmos. Sci. 1986, 43, 2708–2718. [Google Scholar]
- Kain, J.S.; Fritsch, J.M. A one dimensional entraining detraining plume model and its application in convective parameterization. J. Atmos. Sci. 1990, 47, 2784–2802. [Google Scholar]
- Mapes, B.E. Convective inhibition, subgrid-scale triggering energy, and stratiform instability in a toy tropical wave model. J. Atmos. Sci. 2000, 57, 1515–1535. [Google Scholar]
- Su, C.W.; Krueger, S.K.; McMurtry, P.A.; Austin, P.H. Linear eddy modeling of droplet spectral evolution during entrainment and mixing in cumulus clouds. Atmos. Res. 1998, 48, 41–58. [Google Scholar]
- Rosenfeld, D.; Lohmann, U.; Raga, G.B.; O'Dowd, C.D.; Kulmala, M.; Fuzzi, S.; Reissell, A.; Andreae, M.O. Flood or drought: How do aerosols affect precipitation? Science 2008, 321, 1309–1313. [Google Scholar]
- Stevens, B.F.; Feinglod, G. Untangling aerosol effects on clouds and precipitation in a buffered system. Nature 2009, 461, 607–613. [Google Scholar]
- Cui, Z.Q.; Davies, S.; Carslaw, K.S.; Blyth, A.M. The response of precipitation to aerosol through riming and melting in deep convective clouds. Atmos. Chem. Phys. 2011, 11, 3495–3510. [Google Scholar]
- Cui, Z.Q.; Carslaw, K.S.; Yin, Y.; Davies, S. A numerical study of aerosol effects on the dynamics and microphysics of a deep convective cloud in a continental environment. J. Geophys. Res. 2006, 111. [Google Scholar] [CrossRef]
- Wang, S.P.; Wang, Q.; Feingold, G. Turbulence, condensation, and liquid water transport in numerically simulated nonprecipitating stratocumulus clouds. J. Atmos. Sci. 2003, 60, 262–278. [Google Scholar]
- Xue, H.W.; Feingold, G. Large-eddy simulations of trade wind cumuli: Investigation of aerosol indirect effects. J. Atmos. Sci. 2006, 63, 1605–1622. [Google Scholar]
- Jiang, H.L.; Xue, H.W.; Teller, A.; Feingold, G.; Levin, Z. Aerosol effects on the lifetime of shallow cumulus. Geophys. Res. Lett. 2006, 33. [Google Scholar] [CrossRef]
- Reisin, T.; Levin, Z.; Tzivion, S. Rain production in convective clouds as simulated in an axisymmetric model with detailed microphysics .1. Description of the model. J. Atmos. Sci. 1996, 53, 497–519. [Google Scholar]
- Yin, Y.; Carslaw, K.S.; Parker, D.J. Redistribution of trace gases by convective clouds-mixed-phase processes. Atmos. Chem. Phys. 2002, 293–306. [Google Scholar]
- Yin, Y.; Carslaw, K.S.; Feingold, G. Vertical transport and processing of aerosols in a mixed-phase convective cloud and the feedback on cloud development. Q. J. R. Meteorol. Soc. 2005, 131, 221–245. [Google Scholar]
- Tzivion, S.; Feingold, G.; Levin, Z. An efficient numerical solution to the stochastic collection equation. J. Atmos. Sci. 1987, 44, 3139–3149. [Google Scholar]
- Feingold, G.; Tzivion, S.; Levin, Z. Evolution of raindrop spectra. 1. Solution to the stochastic collection/breakup equation using the method of moments. J. Atmos. Sci. 1988, 45, 3387–3399. [Google Scholar]
- Tzivion, S.; Feingold, G.; Levin, Z. The evolution of raindrop spectra: Part II. Collisional collection r breakup and evaporation in a rainshaft. J. Atmos. Sci. 1989, 46, 3312–3327. [Google Scholar]
- Tzivion, S.; Reisin, T.; Levin, Z. Numerical simulation of hygroscopic seeding in a convective cloud. J. Appl. Meteorol. 1994, 33, 252–267. [Google Scholar]
- Monin, A.C.; Yaglom, A.M. Statistical Hydromechanics; Izdatelstvo Nauka: Moscow, Russia, 1968; Volume 2, p. 633. [Google Scholar]
- Helsdon, J.H.; Farley, R.D. A numerical modeling study of a Montana thunderstorm. 2. Model results versus observations involging electrical aspects. J. Geophys. Res. 1987, 92, 5661–5675. [Google Scholar]
- Taylor, G.R. Sulfate production and deposition in midlatitude continental cumulus clouds. 2. Chemistry model formulation and sensitivity analysis. J. Atmos. Sci. 1989, 46, 1991–2007. [Google Scholar]
- Zhang, Y.P.; Kreidenweis, S.; Taylor, G.R. The effects of clouds on aerosol and chemical species production and distribution. Part III: Aerosol model description and sensitivity analysis. J. Atmos. Sci. 1998, 55, 921–939. [Google Scholar]
- Murakami, M. Numerical modeling of dynamic and microphysical evolution of an isolated convective cloud- The 19 July 1981 CCOPE cloud. J. Meteorol. Soc. Jpn. 1990, 68, 107–128. [Google Scholar]
- Respondek, P.S.; Flossmann, A.I.; Alheit, R.R.; Pruppacher, H.R. A theoretical study of the wet removal of atmospheric pollutants. 5. The uptake, redistribution, and deposition of (NH4)2SO4 by a convective cloud containing ice. J. Atmos. Sci. 1995, 52, 2121–2132. [Google Scholar]
- Dye, J.E.; Jones, J.J.; Winn, W.P.; Cerni, T.A.; Gardiner, B.; Lamb, D.; Pitter, R.L.; Hallett, J.; Saunders, C.P.R. Early electrification and precipitation development in a small, isolated Montana cumulonimbus. J. Geophys. Res. 1986, 91, 1231–1247. [Google Scholar]
- Cui, Z.Q.; Carslaw, K.S. Enhanced vertical transport efficiency of aerosol in convective clouds due to increases in tropospheric aerosol abundance. J. Geophys. Res. 2006, 111. [Google Scholar] [CrossRef]
- Hobbs, P.V.; Bowdle, D.A.; Radke, L.F. Particles in the lower troposphere over the high plains of the United Scates. 1. Size distributions, elemental compositions and morphologies. J. Clim. Appl. Meteorol. 1985, 24, 1344–1356. [Google Scholar]
- Cotton, W.R. Numerical simulation of precipitation development in supercooled cumuli. Mon. Weather Rev. 1972, 100, 764–784. [Google Scholar]
- Baker, M.B.; Corbin, R.G.; Latham, J. The influence of entrainment on the evolution of cloud droplet spectra. 1. A model of inhomogeneous mixing. Q. J. R. Meteorol. Soc. 1980, 106, 581–598. [Google Scholar]
- Jensen, J.B.; Baker, M.B. A simple model of droplet spectral evolution during turbulent mixing. J. Atmos. Sci. 1989, 46, 2812–2829. [Google Scholar]
- Andrejczuk, M.; Grabowski, W.W.; Malinowski, S.P.; Smolarkiewicz, P.K. Numerical simulation of cloud-clear air interfacial mixing. J. Atmos. Sci. 2004, 61, 1726–1739. [Google Scholar]
- Brenguier, J.L.; Burnet, F. Experimental study of the effect of mixing on droplet spectra. Proceedings of the 12th International Conference on Clouds and Precipitation, Zurich, Switzerland; 1996; pp. 67–70. [Google Scholar]
- Lehmann, K.; Siebert, H.; Shaw, R.A. Homogeneous and inhomogeneous mixing in Cumulus clouds: Dependence on local turbulence structure. J. Atmos. Sci. 2009, 66, 3641–3659. [Google Scholar]
- Freud, E.; Rosenfeld, D.; Axisa, D.; Kulkarni, J.R. Resolving both entrainment-mixing and number of activated CCN in deep convective clouds. Atmos. Chem. Phys. Discuss. 2011, 11, 9673–9703. [Google Scholar]
- Blyth, A.M.; Huang, Y.; Brown, P.; Cotton, R.J.; Crosier, J.; Bower, K.N.; Gallagher, M.W.; Jones, H.; Gadian, A.M.; Choularton, T.W.; Cardwell, J.; Coe, H.; Mobbs, S.D.; Hagen, M. Development of ice particles in convective clouds observed over the Black Forest mountains during COPS. Q. J. R. Meteorol. Soc. 2011, 137, 275–286. [Google Scholar]
- Jeffery, C.A.; Reisner, J.M. A study of cloud mixing and evolution using PDF methods. Part I: Cloud front propagation and evaporation. J. Atmos. Sci. 2006, 63, 2848–2864. [Google Scholar]
- Stohl, A. A 1-year Lagrangian “climatology” of airstreams in the Northern Hemisphere troposphere and lowermost stratosphere. J. Geophys. Res. 2001, 106, 7263–7279. [Google Scholar]
- Numaguti, A.; Oki, R.; Nakamura, K.; Tsuboki, K.; Misawa, N.; Asai, T.; Kodama, Y.M. 4-5-day-period variation and low level dry air observed in the equatorial western Pacific during theTOGA-COARE IOP. J. Meteorol. Soc. Jpn. 1995, 73, 267–290. [Google Scholar]
- Yoneyama, K.; Fujitani, T. The behavior of dry westerly air associated with convection observed during the TOGA-COARE R/V Natsushima cruise. J J. Meteorol. Soc. Jpn. 1995, 73, 291–304. [Google Scholar]
- Rao, T.N.; Kirkwood, S. Characteristics of tropopause folds over Arctic latitudes. J. Geophys. Res. 2005, 110. [Google Scholar] [CrossRef]
- Esler, J.G.; Haynes, P.H.; Law, K.S.; Barjat, H.; Dewey, K.; Kent, J.; Schmitgen, S.; Brough, N. Transport and mixing between airmasses in cold frontal regions during Dynamics and Chemistry of Frontal Zones (DCFZ). J. Geophys. Res. 2003, 108. [Google Scholar] [CrossRef]
- Dunion, J.P. Rewriting the Climatology of the Tropical North Atlantic and Caribbean Sea Atmosphere. J. Climate 2011, 24, 893–908. [Google Scholar]
- Zhang, C.; Pennington, J. African dry-air outbreaks. J. Geophys. Res. 2004, 109. [Google Scholar] [CrossRef]
- Graf, H.F. Atmospheric science-The complex interaction of aerosols and clouds. Science 2004, 303, 1309–1311. [Google Scholar]
- Andreae, M.O.; Rosenfeld, D.; Artaxo, P.; Costa, A.A.; Frank, G.P.; Longo, K.M.; Silva-Dias, M.A.F. Smoking rain clouds over the Amazon. Science 2004, 303, 1337–1342. [Google Scholar]
- Kaufman, Y.J.; Koren, I.; Remer, L.A.; Rosenfeld, D.; Rudich, Y. The effect of smoke, dust, and pollution aerosol on shallow cloud development over the Atlantic Ocean. Proc. Natl. Acad. Sci. USA 2005, 102, 11207–11212. [Google Scholar]
© 2011 by the authors; licensee MDPI, Basel, Switzerland. This article is an open access article distributed under the terms and conditions of the Creative Commons Attribution license (http://creativecommons.org/licenses/by/3.0/)
Share and Cite
Cui, Z.; Carslaw, K.S.; Blyth, A.M. The Coupled Effect of Mid-Tropospheric Moisture and Aerosol Abundance on Deep Convective Cloud Dynamics and Microphysics. Atmosphere 2011, 2, 222-241. https://doi.org/10.3390/atmos2030222
Cui Z, Carslaw KS, Blyth AM. The Coupled Effect of Mid-Tropospheric Moisture and Aerosol Abundance on Deep Convective Cloud Dynamics and Microphysics. Atmosphere. 2011; 2(3):222-241. https://doi.org/10.3390/atmos2030222
Chicago/Turabian StyleCui, Zhiqiang, Kenneth S. Carslaw, and Alan M. Blyth. 2011. "The Coupled Effect of Mid-Tropospheric Moisture and Aerosol Abundance on Deep Convective Cloud Dynamics and Microphysics" Atmosphere 2, no. 3: 222-241. https://doi.org/10.3390/atmos2030222