Analysis and Application of the Relationship between Cumulonimbus (Cb) Cloud Features and Precipitation Based on FY-2C Image

Abstract
:1. Introduction
2. Study Area and Methodology
2.1. Study Area
2.2. Data
2.3. Methodology
2.3.1. Cloud Parameters
- (1)
- The top brightness temperature of the Cb pixel (TB): The TB of the infrared channels.
- (2)
- The gradient of pixel TB (GT): GT is the gradient of the TB for three infrared channels with a window size of 3 × 3 pixels, centered on pixel i (x,y):GT(x,y) = [(TB(x+1,y) + TB(x−1,y))2 + (TB(x,y+1) − TB(x,y−1))2]1/2
- (3)
- The difference of pixel TB over split-window channels (DT): DT is the difference in TB over split-window channels (IR Channels a and b):DTab(x,y) = TBa(x,y) − TBb(x,y)
- (4)
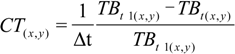
- The change ratio of pixel TB (CT):In this study, ∆t is typically 1 hour.
![Atmosphere 05 00211 i001]()
- (5)
- The deviation of the convective cloud center (DCC): DCC is the distance of pixel i (x,y) to the Cb patch center (x0, y0):The center of the Cb patch can be the geometric center (XGeo,YGeo) or the gravitational center (XGra,YGra).DCC(i,j) = ((x0 − x)2 + (y0 − y)2)1/2
- (6)
- The minimum TB of a cloud patch (TminP):
![Atmosphere 05 00211 i002]()
- (7)
- The mean TB of a cloud patch (TmeanP):where N is the number of pixels in a Cb patch.
![Atmosphere 05 00211 i003]()
- (8)
- The difference in TB over split windows for a Cb patch (DSWT):DSWT = TmeanPIR1 − TmeanPIR2
- (9)
- The difference in TB over IR and WV windows for a Cb patch (DIWT):DIWT = TmeanPIR1 − TmeanPWV
- (10)
- The cloud patch area (Area):Area = N × pixel resolution
- (11)
- The cloud patch perimeter (PERI):where Nbound is the number of pixels on the boundary of a Cb patch.PERI = Nbound × pixel resolution
- (12)
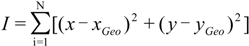
- The shape index of geometric momentum (SIGM): SIGM is defined as the ratio of the geometric momentum of a cloud patch, I, to that of a round patch with the same size (I0):where:SIGM = I / I0and (x, y) is the coordinate of pixel i, (xGeo, yGeo) is the geometric center of the cloud patch and I0 is the geometric momentum of a round patch with the same area.
![Atmosphere 05 00211 i004]()
- (13)
- The shape index of the perimeter (SIP): SIP is defined as the ratio of the perimeter (PERI) of a cloud patch to that of a round patch with the same area (PERI0):SIP = PERI / PERI0
- (14)
- The eccentricity (ECCT): ECCT is defined as:where c is the distance between the focus and the center of the ellipse and a is the length of the long axis.ECCT = c / a
- (15)
- The boundary steepness (BS): BS measures how steeply the temperature increases along the boundary of a cloud patch:where μb(i) is the distance from pixel i on the cloud patch boundary to the corresponding position on the warmer cloud patch boundary.
![Atmosphere 05 00211 i005]()
- (16)
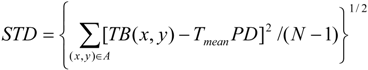
- The standard deviation of the TB of a cloud patch (STD):
![Atmosphere 05 00211 i006]()
- (17)
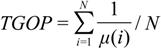
- The TB gradient of cloud patch (TGOP): TGOP is defined as the average temperature gradient from the shooting top (TminP) to every pixel on the Cb boundary:where μ(i) is the distance from pixel i on the boundary to the shooting top (TminP).
![Atmosphere 05 00211 i007]()
- (18)
- The life stage of a cloud patch (LF) [23]: the lifecycle of a Cb patch is divided into 8 stages (LF1: the birth of a new cloud patch; LF2: the development of a single cloud patch; LF3: the dissipation of a single cloud patch; LF4: the merger of cloud cells; LF5: the dissipation of a single cloud patch into several cloud patches (the complex dissipation of a single cloud patch); LF6: the development of cloud cells; LF7: the dissipation of cloud cells; LF8: uncertain cloud patch)
- (19)
- The horizontal moving speed of a Cb patch (HMSP) [23]: HMSP is the displacement of the cloud patch centers between two successive images divided by the time interval between the images.
- (20)
- The horizontal moving direction of a cloud patch (HMDP) [23]: HMDP is a measure of the displacement of the cloud patch center in two successive images.
- (21)
- The cloud growth rate (CGR) [23]: CGR is the ratio of the area of a cloud patch to its area in a previous image.
- (22)
- The vertical moving characteristic of a Cb patch (VMCP) [23]: VMCP is represented by the ratio of the average TB of a Cb patch to the average TB it showed in a previous image, in that cloud top TB can reflect the height of a convective cloud, as well.


2.3.2. Parameter Extraction

| Type | Features* | No. | Parameters** |
|---|---|---|---|
| Pixel features | Coldness features | 1 | Top brightness temperature of the Cb pixel (TB):TB1, TB2, TB3 |
| 2 | Gradient of the pixel TB (GT): GT1, GT2, GT3 | ||
| 3 | Difference of the pixel TB for IR channels (DT): DT21, DT31, DT32, | ||
| Time evolution features | 4 | Changing ratio of the pixel TB (CT): CT1, CT2, CT3 | |
| Situation features | 5 | Deviation to the convective cloud center (DCC ***): DCC1, DCC2 | |
| Cloudpatch features | Coldness features | 6 | Minimum TB of cloud patch (TminP) |
| 7 | Mean TB of cloud patch (TmeanP) | ||
| 8 | Difference of Cb patch TB for the split window (DSWT) | ||
| 9 | Difference of Cb patch TB for IR and WV channel (DIWT) | ||
| Geometric features | 10 | Cloud patch area (Area) | |
| 11 | Perimeter (PERI) | ||
| 12 | Shape index of the geometric inertia momentum (SIGM) | ||
| 13 | Shape index of the perimeter (SIP) | ||
| 14 | Eccentricity (ECCT) | ||
| Texture features | 15 | Boundary steepness (BS) | |
| 16 | Standard deviations of the cloud patch (STD) | ||
| 17 | TB gradient of cloud patch(TGOP) | ||
| Dynamical features | 18 | Life stage factor of the cloud patch (LF) | |
| 19 | Horizontal moving speed of a Cb patch (HMSP) | ||
| 20 | Horizontal moving direction of cloud patch (HMDP) | ||
| 21 | Cloud growth rate (CGR) | ||
| 22 | Vertical moving characteristic of cloud patch (VMCP) |
| Classes | Sea* | Land | Low-Level Clouds | Midlevel Clouds | Thin Cirrus | Thick Cirrus | Multi-Layer Clouds | Cumulonimbus |
|---|---|---|---|---|---|---|---|---|
| Sea ** | 1 | 0 | 0 | 0 | 0 | 0 | 0 | 0 |
| Land | 0 | 0.97 | 0 | 0.01 | 0.01 | 0.01 | 0 | 0 |
| Low-level clouds | 0.04 | 0.05 | 087 | 0.02 | 0.02 | 0 | 0 | 0 |
| Midlevel clouds | 0.01 | 0 | 0.02 | 0.92 | 0.05 | 0 | 0 | 0 |
| Thin cirrus | 0.01 | 0.01 | 0.02 | 0.01 | 0.93 | 0.02 | 0 | 0 |
| Thick cirrus | 0 | 0 | 0 | 0.01 | 0.02 | 0.92 | 0.05 | 0 |
| Multi-layer clouds | 0 | 0 | 0 | 0.03 | 0 | 0.01 | 0.9 | 0.06 |
| Cumulonimbus | 0 | 0 | 0 | 0 | 0 | 0.01 | 0.01 | 0.98 |
2.3.3. The Analysis of the Relationship
| Year | Month | Number of Cb Samples on Pixel Scale | Number of Cb Samples on Cloud Patch Scale | ||||
|---|---|---|---|---|---|---|---|
| Cb | Cb with Precipitation | Ratio of Precipitation (%) | Cb | Cb with Precipitation | Ratio of Precipitation (%) | ||
| 2007 | 5 | 209 | 61 | 29.19 | 48 | 15 | 31.25 |
| 6 | 2034 | 691 | 33.97 | 905 | 443 | 48.95 | |
| 7 | 10,914 | 4225 | 38.71 | 1880 | 718 | 38.19 | |
| 8 | 9663 | 3339 | 34.55 | 1495 | 680 | 45.48 | |
| 9 | 3744 | 919 | 24.55 | 675 | 237 | 35.11 | |
| 10 | 1869 | 397 | 21.24 | 367 | 182 | 49.59 | |
| 2008 | 7 | 9102 | 3632 | 39.90 | 1423 | 684 | 48.07 |
| Total | 37,535 | 13,264 | 35.34* | 6793 | 2959 | 43.56* | |
2.3.4. The Application of the Relationship
| No. | Parameters | Corr | Chosen ※ | No. | Parameters | Corr | Chosen | No. | Parameters | Corr | Chosen |
|---|---|---|---|---|---|---|---|---|---|---|---|
| 1 | TB1 | −0.352 ** | 1 | 12 | CT3 | −0.128 | 0 | 23 | ECCT | −0.029 | 0 |
| 2 | TB2 | −0.343 ** | 0 | 13 | DCC1 | −0.013 | 0 | 24 | BS | −0.199 | 0 |
| 3 | TB3 | −0.306 * | 0 | 14 | DCC2 | −0.016 | 0 | 25 | STD | 0.086 | 0 |
| 4 | GT1 | −0.172 | 0 | 15 | TminP | −0.044 | 0 | 26 | TGOP | −0.016 | 0 |
| 5 | GT2 | 0.081 | 0 | 16 | TmeanP | −0.032 | 0 | 27 | LF | 0.269 * | 1 |
| 6 | GT3 | −0.309 * | 1 | 17 | DSWT | 0.161 | 0 | 28 | HMSP | 0.089 | 0 |
| 7 | DT21 | −0.081 | 0 | 18 | DIWT | 0.079 | 0 | 29 | HMDP | −0.215 | 0 |
| 8 | DT31 | −0.306 * | 1 | 19 | Area | 0.330 * | 1 | 30 | CGR | 0.288* | 1 |
| 9 | DT32 | −0.302 | 0 | 20 | PERI | 0.268 * | 1 | 31 | VMCP | −0.194 | 0 |
| 10 | CT1 | 0.018 | 0 | 21 | SIGM | −0.243 | 0 | ||||
| 11 | CT2 | −0.332 * | 1 | 22 | SIP | −0.033 | 0 |
3. Results
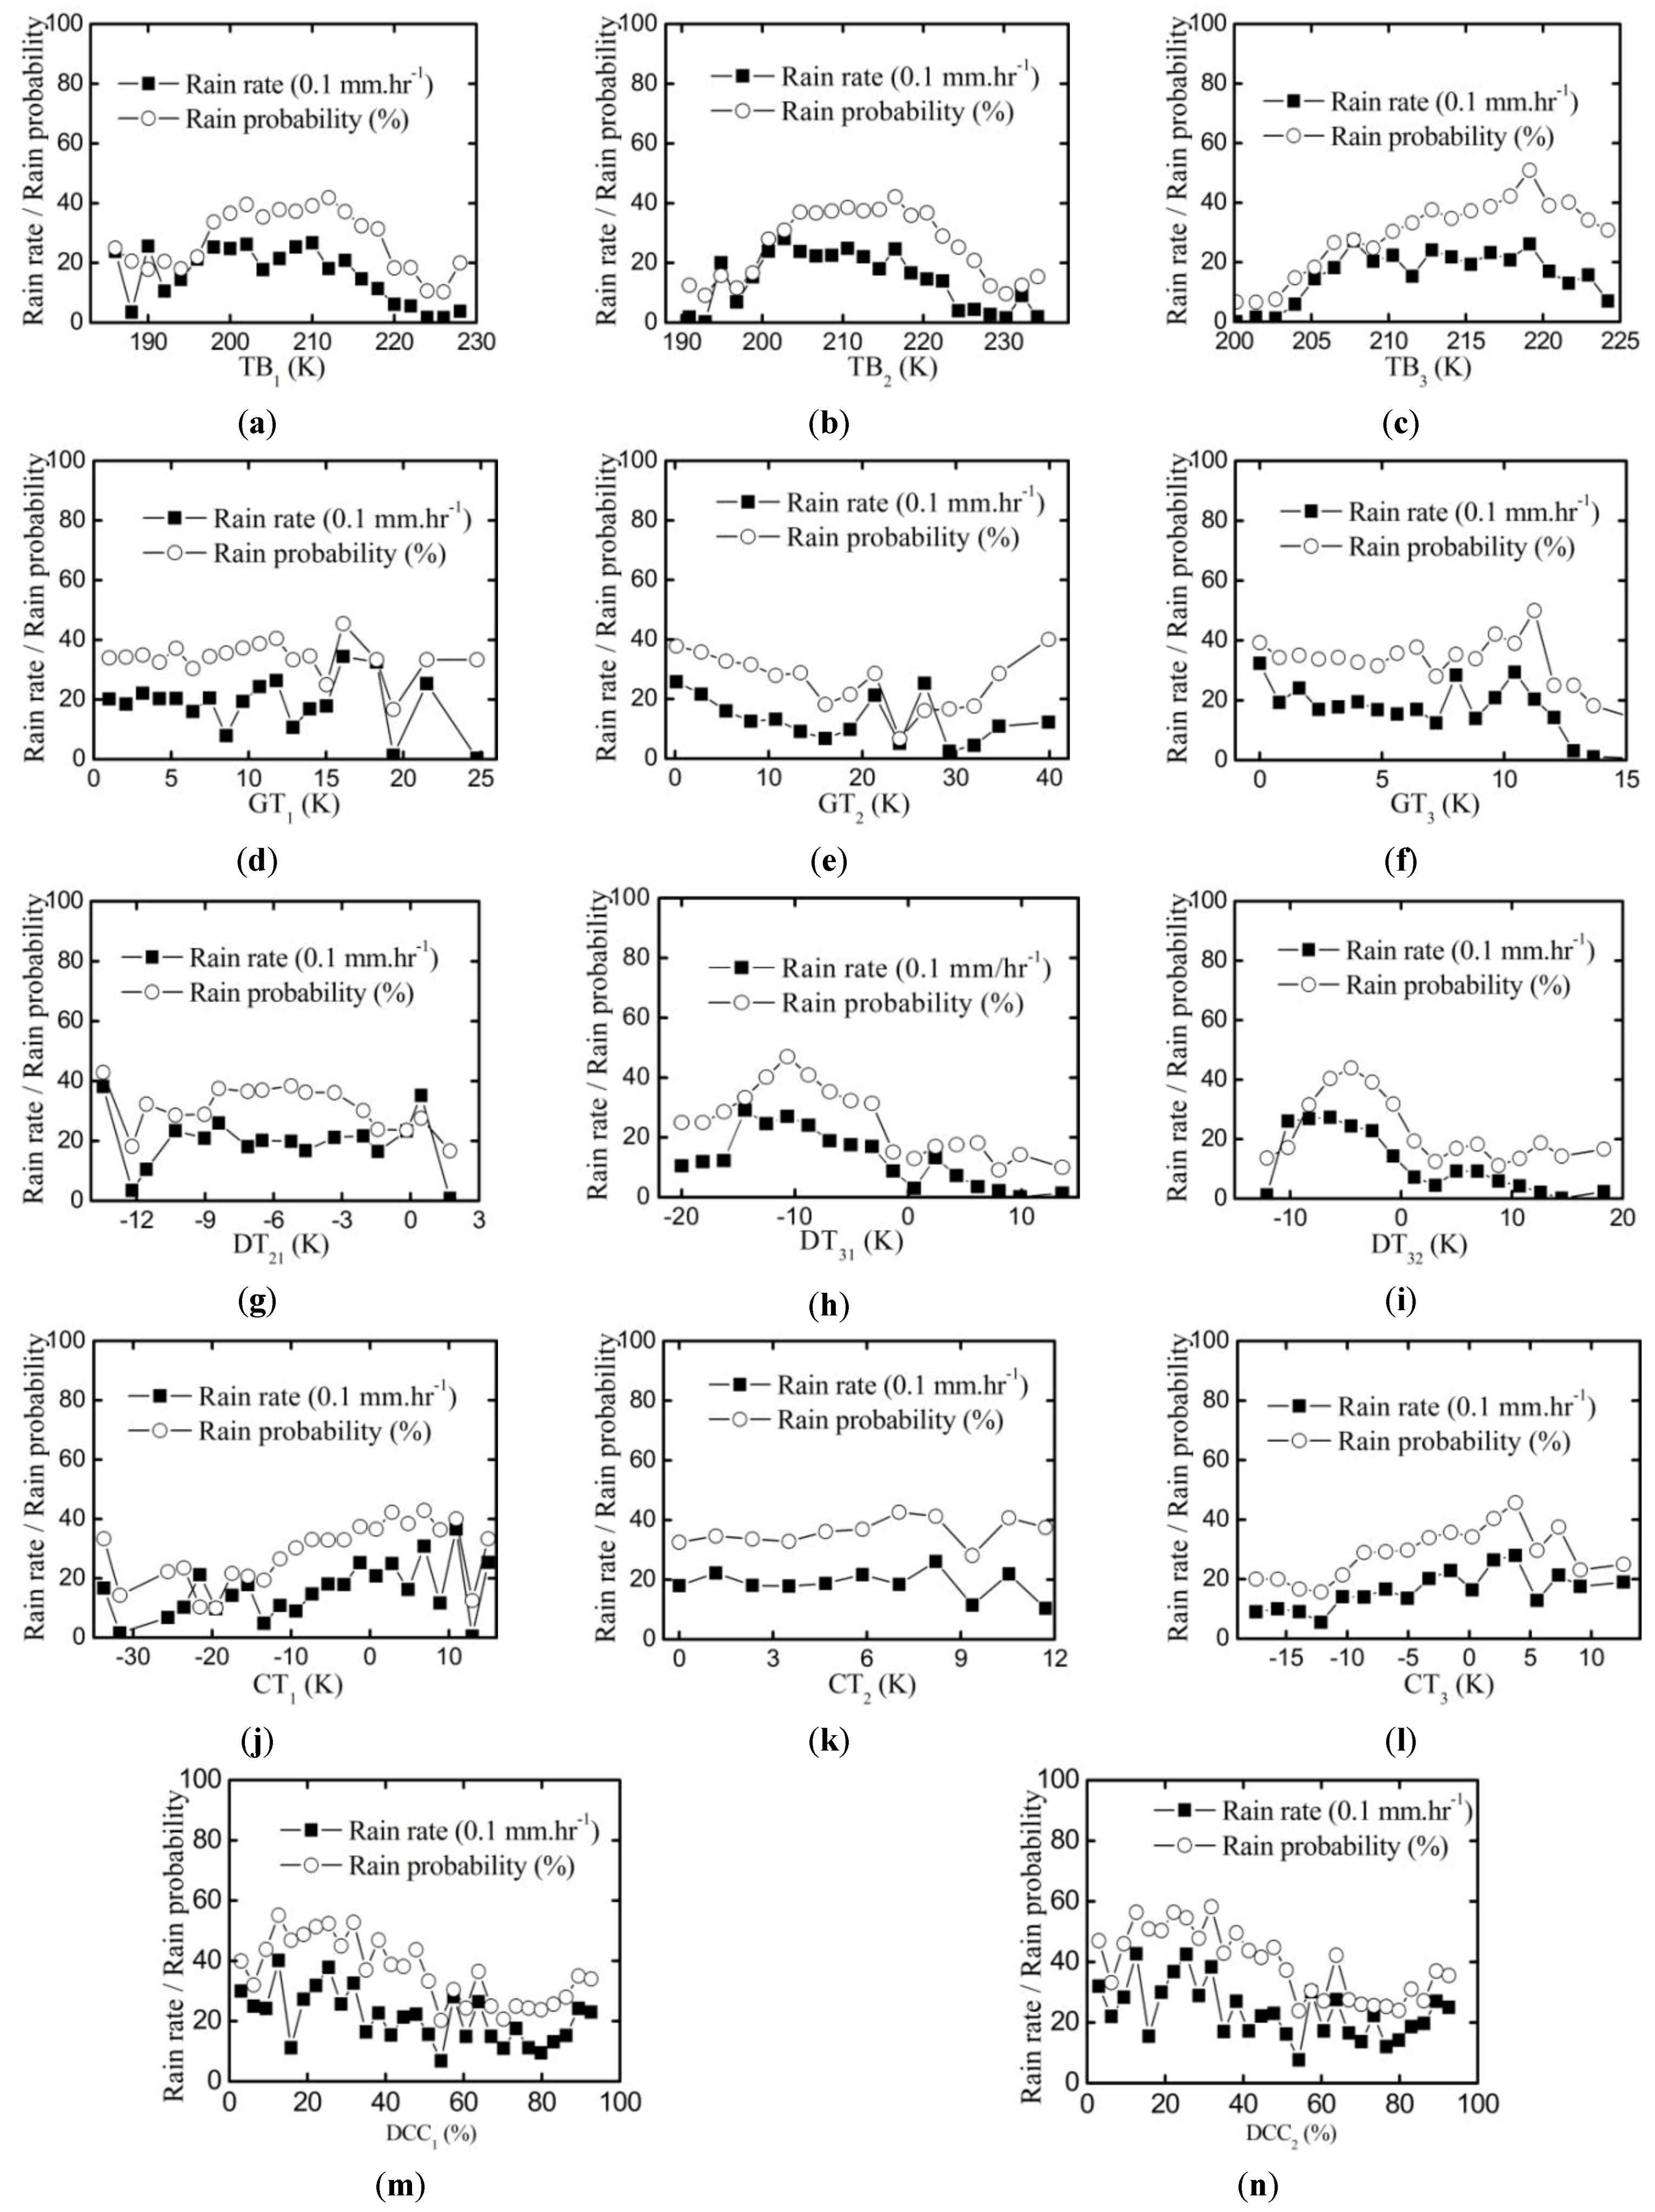
3.1. Relationship between Precipitation and Pixel Features
(1) Coldness Features

(2) Differences of the IR Channels
(3) Time Evolution Features
(4) The Deviation of the Cloud Center (DCC)
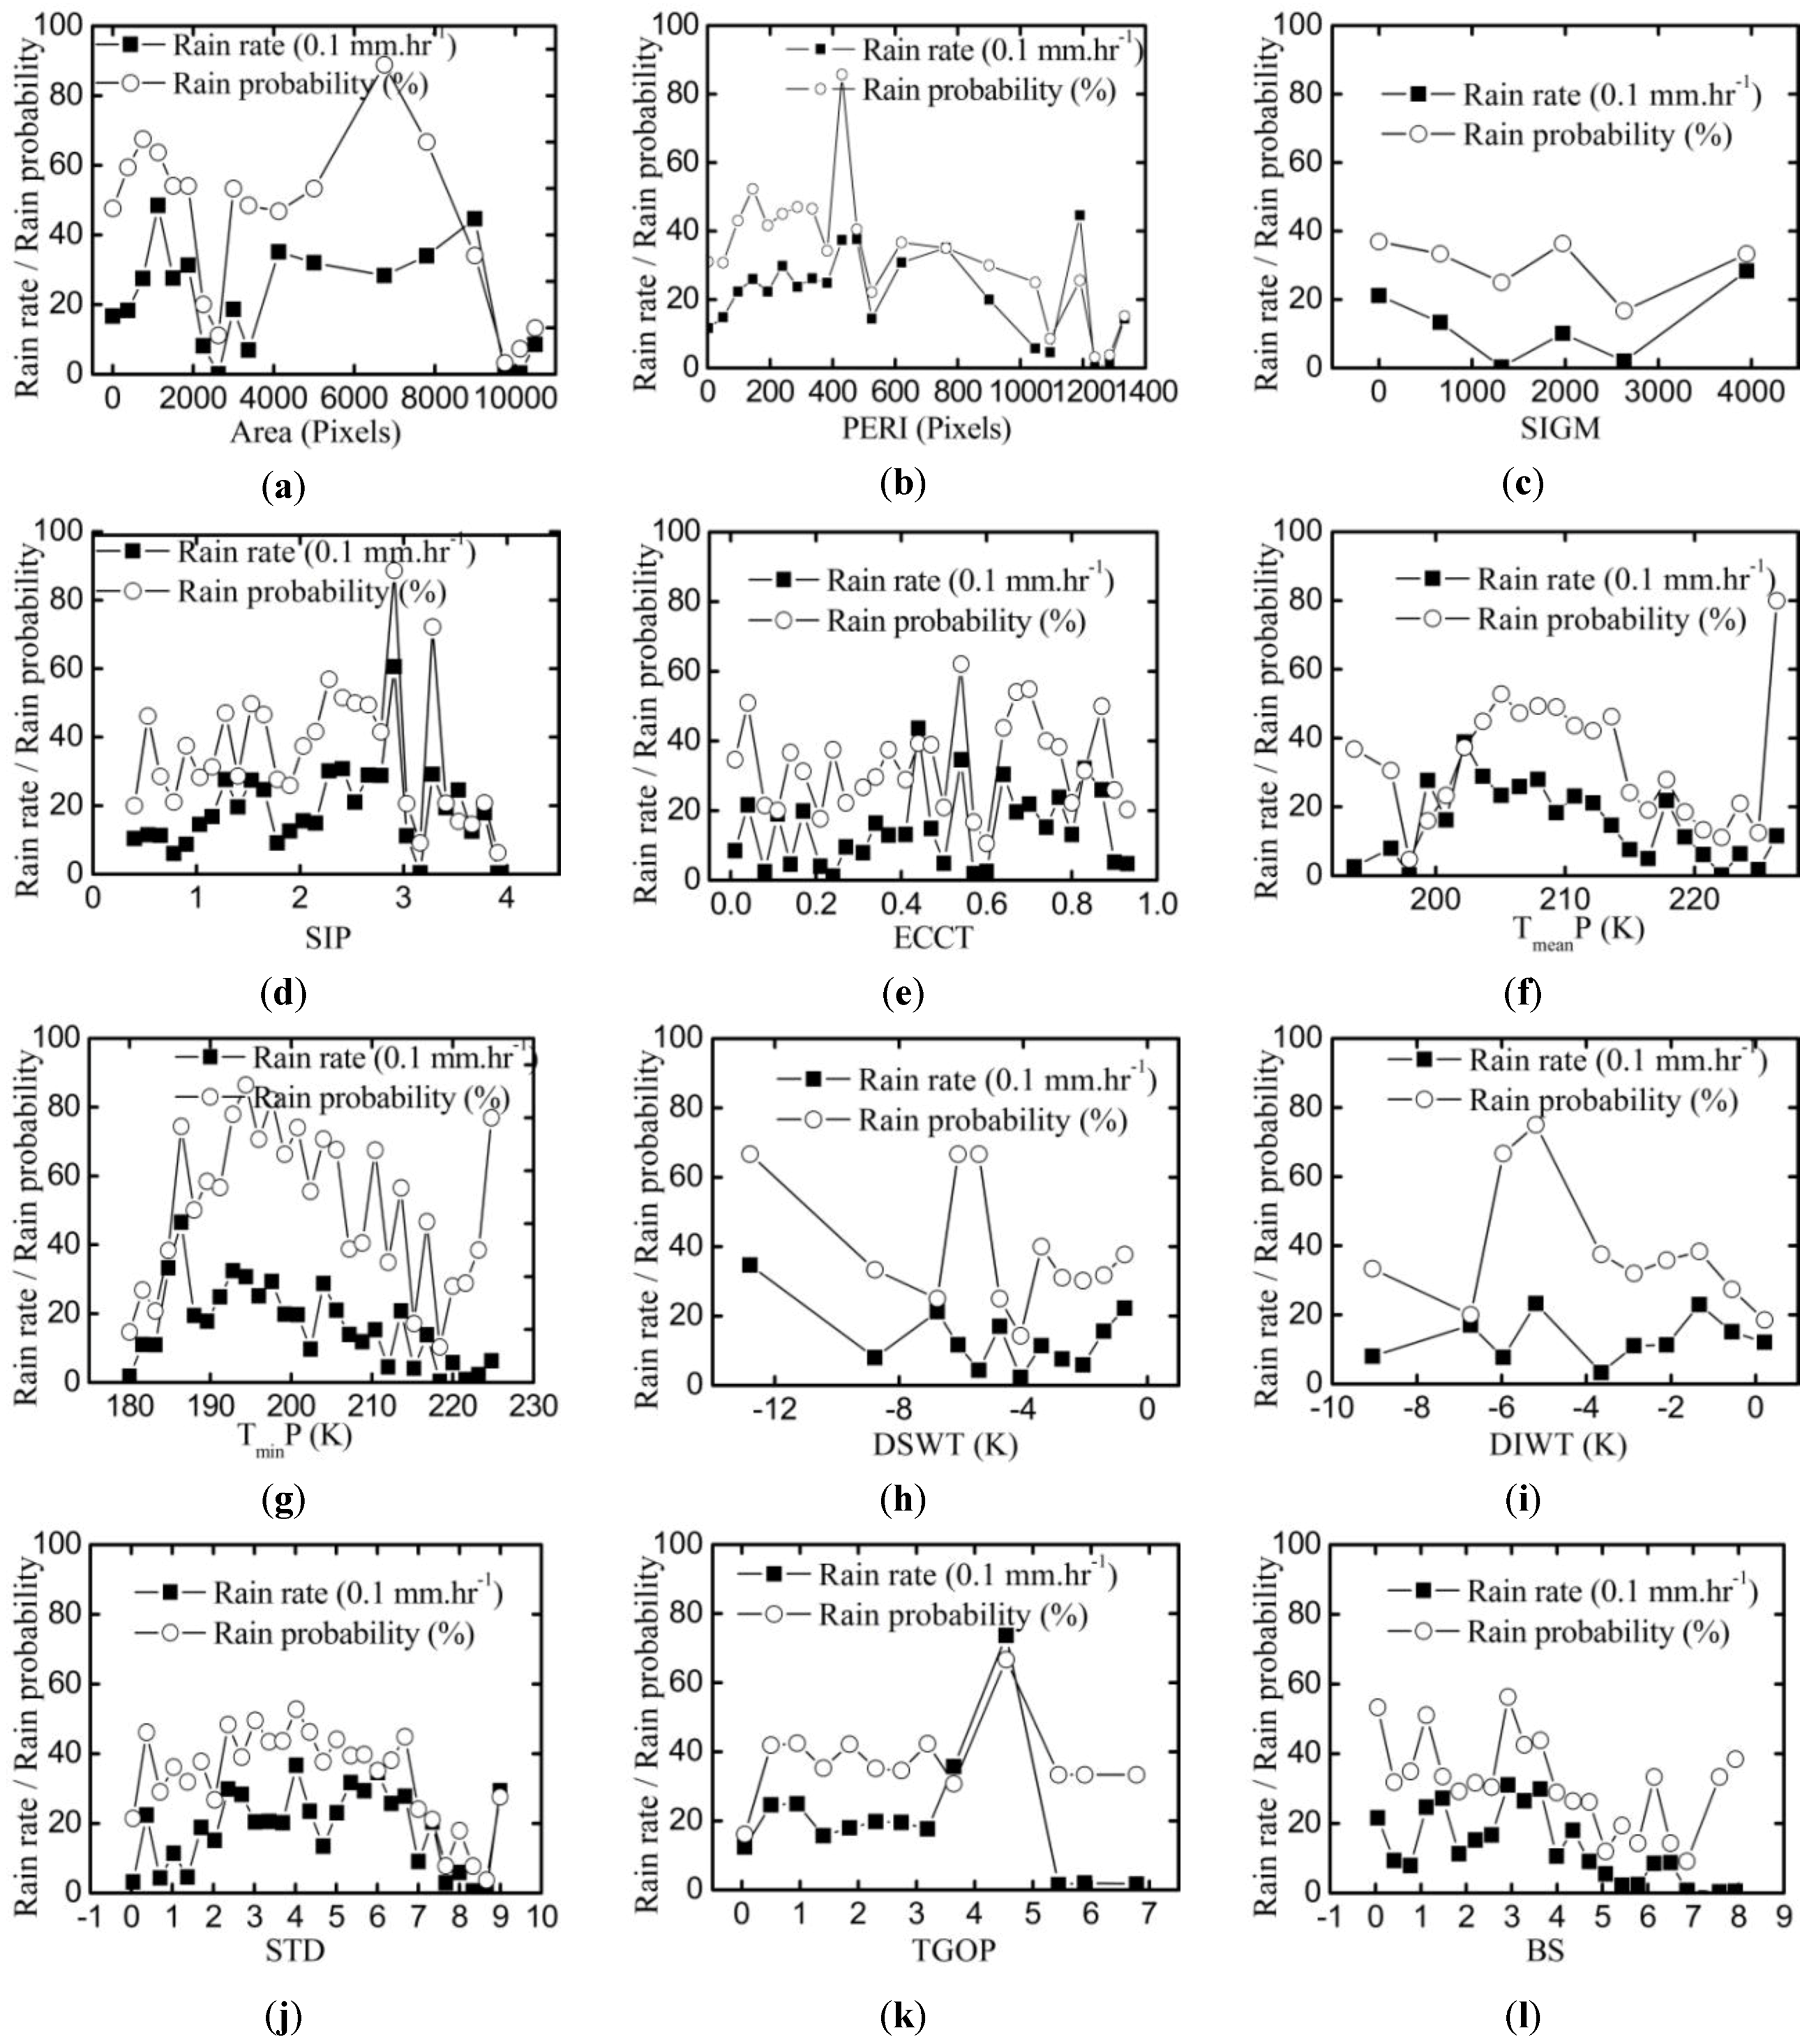
3.2. Relationship between Precipitation and the Cloud Patch Character
(1) Geometric Features

(2) Coldness Features
(3) Texture/Structure Features
(4) Dynamic features
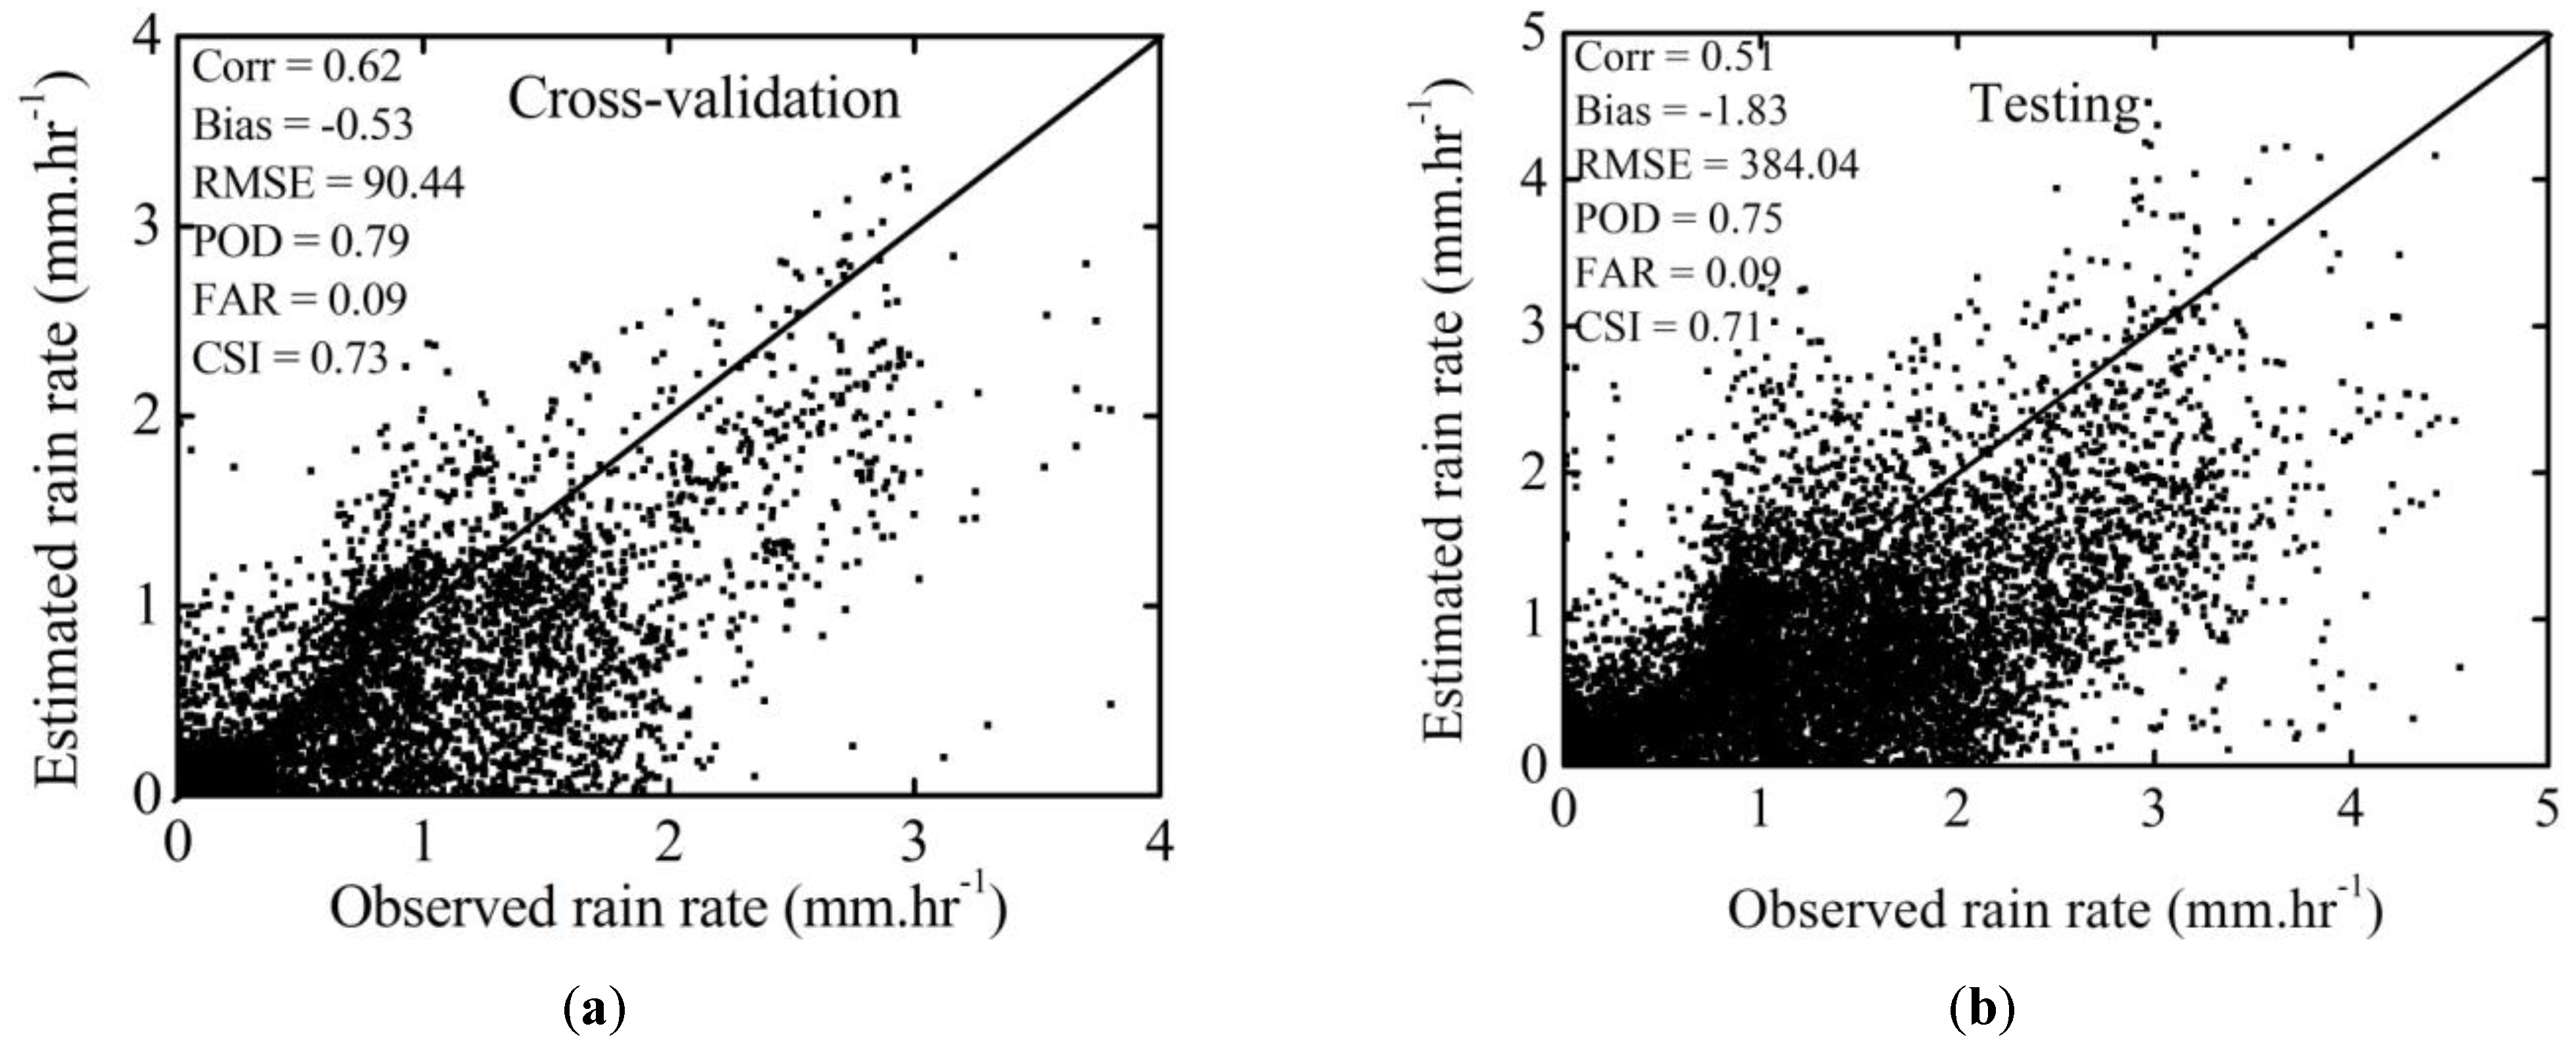
3.3. Application of the Rainfall Relationship in Precipitation Estimation
| Year | Month | Samples | Corr | Bias | RMSE | POD | FAR | CSI |
|---|---|---|---|---|---|---|---|---|
| Cross-validation | 6.2007 | 678 | 0.47 | −2.65 | 119.01 | 0.93 | 0.35 | 0.62 |
| 7.2007 | 3638 | 0.70 | −0.85 | 137.47 | 0.95 | 0.06 | 0.90 | |
| 8.2007 | 3221 | 0.69 | −0.50 | 61.69 | 0.83 | 0.04 | 0.80 | |
| 9.2007 | 1248 | 0.43 | 0.80 | 47.03 | 0.36 | 0.10 | 0.35 | |
| 10.2007 | 623 | 0.26 | 0.80 | 20.31 | 0.33 | 0.15 | 0.31 | |
| Average | 0.62 | −0.53 | 90.44 | 0.79 | 0.09 | 0.73 | ||
| 5.2007 | 204 | 0.41 | −42.58 | 434.80 | 0.88 | 0.53 | 0.45 | |
| Testing | 7.2008 | 9102 | 0.51 | −0.92 | 382.9 | 0.75 | 0.08 | 0.72 |
| Average | 0.51 | −1.83 | 384.04 | 0.75 | 0.09 | 0.71 |

4. Conclusions
Acknowledgments
Author Contributions
Conflict of Interest
References
- Xu, L.; Gao, X.; Sorooshian, S.; Arkin, P.A.; Imam, B. A microwave infrared threshold technique to improve the GOES precipitation index. J. Appl. Meteorol. 1999, 38, 569–579. [Google Scholar] [CrossRef]
- Kurino, T. A satellite infrared technique for estimating “deep/shallow” precipitation. Adv. Space Res. 1997, 19, 511–514. [Google Scholar] [CrossRef]
- Lu, N.M.; Wu, R.Z. Strong convective cloud characteristics derived from satellite cloud picture. (In Chinese)J. Appl. Meteorol. Sci. 1997, 8, 270–275. [Google Scholar]
- Arkin, P.A. The relationship between fractional coverage of high cloud and rainfall accumulations during GATE over the B-scale array. Mon. Weather Rev. 1979, 107, 1382–1387. [Google Scholar] [CrossRef]
- Hong, G.; Heygster, G.; Rodriguez, C.A.M. Effect of cirrus clouds on the diurnal cycle of tropical deep convective clouds. J. Geophys. Res. 2006. [Google Scholar] [CrossRef]
- Griffith, C.G.; Woodley, W.L.; Grube, P.G.; Martin, D.W; Stout, J.; Sikdar, D.N. Rain estimation from geosynchronous satellite imagery-visible and infrared studies. Mon. Weather Rev. 1978, 106, 1153–1171. [Google Scholar] [CrossRef]
- Negri, A.J.; Adler, R.F. Infrared and visible satellite rain estimation. Part II: A cloud definition approach. J. Clim. Appl. Meteorol. 1987, 26, 1565–1576. [Google Scholar] [CrossRef]
- Negri, A.J.; Adler, R.F.; Wetzel, P.J. Rain estimation from satellites: An examination of Griffith–Woodley technique. J. Clim. Appl. Meteorol. 1984, 23, 102–116. [Google Scholar] [CrossRef]
- Woodley, W.L.; Griffith, C.G.; Stroomatt, S.C. The inference of GATE convective rainfall from SMS-1 imagery. J. Appl. Meteorol. 1980, 19, 314–330. [Google Scholar]
- Laurent, H.; D'Amato, N.; Lebel, T. How important is the contribution of the mesoscale convective complexes to the Sahelian rainfall? Phys. Chem. Earth 1998, 23, 629–633. [Google Scholar] [CrossRef]
- Mathon, V.; Laurent, H.; Lebel, T. Mesoscale convective system rainfall in the Sahel. J. Appl. Meteorol. 2002, 41, 1081–1092. [Google Scholar] [CrossRef]
- Goyens, C.; Lauwaet, D.; Schroder, M.; Demuzere, M.; Van Lipziga, N.P.M. Tracking mesoscale convective systems in the Sahel: Relation between cloud parameters and precipitation. Int. J. Climatol. 2011, 32, 1921–1934. [Google Scholar]
- Vondou, D.A. Spatio-temporal variability of western central African convection from infrared observations. Atmosphere 2012, 3, 377–399. [Google Scholar] [CrossRef]
- Laing, A.G.; Carbone, R.E.; Levizzani, V. Cycles and propagation of deep convection over equatorial Africa. Mon. Weather Rev. 2011, 139, 2832–2853. [Google Scholar] [CrossRef]
- Zinner, T.; Mannstein, H.; Tafferner, A. Cb-TRAM: Tracking and monitoring severe convection from onset over rapid development to mature phase using multi-channel Meteosat-8 SEVIRI data. Meteorol. Atmos. Phys. 2008, 101, 191–210. [Google Scholar] [CrossRef]
- Machado, L.A.T.; Rossow, W.B.; Guedes, R.L.; Walker, A.W. Life cycle variations of mesoscale convective systems over the Americas. Mon. Weather Rev. 1998, 126, 1630–1654. [Google Scholar] [CrossRef]
- Machado, L.A.T.; Laurent, H. The Convective system area expansion over Amazonia and its relationships with convective system life duration and high-level wind divergence. Mon. Weather Rev. 2004, 132, 714–725. [Google Scholar] [CrossRef]
- Arnaud, Y.; Desbois, M.; Maizi, J. Automatic tracking and characterization of African convective systems on meteosat pictures. J. Appl. Meteorol. 1992, 31, 443–453. [Google Scholar] [CrossRef]
- Zhao, S.X.; Zhang, L.S.; Sun, J.H. Study of heavy rainfall and related mesoscale systems causing severe flood in Huaihe rixdver basin during the summer of 2007. (in Chinese). Clim. Environ. Res. 2007, 12, 713–727. [Google Scholar]
- Zhou, Y.S.; Li, B. Structural analyses of vortex causing torrential rain over the Changjiang-Huaihe River Basin during 8 and 9 July 2003. (in Chinese). Chin. J. Atmos. Sci. 2010, 34, 629–639. [Google Scholar]
- Jiao, M.Y.; Yao, X.X.; Zhou, B.; Yang, K.M. Analysis and Research of Heavy Rainfalls Causing Flood in Huaihe River in 2003; (in Chinese). Meteorological Press: Beijing, China, 2004; p. 215. [Google Scholar]
- Liu, Y.; Xia, J.; Hong, Y.; Shi, C.X. An improved cloud classification algorithm for China’s FY-2C multi-channel images using artificial neural network. Sensors 2009, 9, 5558–5579. [Google Scholar] [CrossRef]
- Liu, Y.; Li, Z.L.; Shi, C.X.; Tang, B.H.; Wu, H.; Liu, Q.C. Relation between cumulonimbus(Cb) precipitation and cloud dynamical features over Huaihe river Basin of China based on FY-2C image. In Proceedings of IEEE International Geoscience and Remote Sensing Symposium, Melbourne, VIC, Australia, 21–26 July 2013; pp. 554–557.
- Ebert, E.E. Results of the 3rd Algorithm Intercomparison Project (AIP-3) of the Global Precipitation Climatology Project (GPCP); Bureau of Meteorology Research Centre: Melbourne, VIC, Australia, 1996. [Google Scholar]
- King, P.W.S.; Hogg, W.D.; Arkin, P.A. The role of visible data in improving satellite rain-rate estimates. J. Appl. Meteorol. 1995, 34, 1608–1621. [Google Scholar] [CrossRef]
- Xie, P.P.; Chen, M.Y.; Yang, S.; Yatagai, A.; Hayasaka, T.; Fukushima, Y.; Liu, C.M. A gauge-based analysis of daily precipitation over East Asia. J. Hydrol. 2007, 8, 607–626. [Google Scholar]
© 2014 by the authors; licensee MDPI, Basel, Switzerland. This article is an open access article distributed under the terms and conditions of the Creative Commons Attribution license (http://creativecommons.org/licenses/by/3.0/).
Share and Cite
Liu, Y.; Xi, D.-G.; Li, Z.-L.; Shi, C.-X. Analysis and Application of the Relationship between Cumulonimbus (Cb) Cloud Features and Precipitation Based on FY-2C Image. Atmosphere 2014, 5, 211-229. https://doi.org/10.3390/atmos5020211
Liu Y, Xi D-G, Li Z-L, Shi C-X. Analysis and Application of the Relationship between Cumulonimbus (Cb) Cloud Features and Precipitation Based on FY-2C Image. Atmosphere. 2014; 5(2):211-229. https://doi.org/10.3390/atmos5020211
Chicago/Turabian StyleLiu, Yu, Du-Gang Xi, Zhao-Liang Li, and Chun-Xiang Shi. 2014. "Analysis and Application of the Relationship between Cumulonimbus (Cb) Cloud Features and Precipitation Based on FY-2C Image" Atmosphere 5, no. 2: 211-229. https://doi.org/10.3390/atmos5020211