Observed and Projected Precipitation Changes over the Nine US Climate Regions

1
Los Alamos National Laboratory, Earth and Environmental Sciences, Los Alamos, NM 87545, USA
2
Los Alamos National Laboratory, Theoretical Biology and Biophysics, Los Alamos, NM 87545, USA
3
Department of Physics, New Mexico State University, Las Cruces, NM 88003, USA
*
Author to whom correspondence should be addressed.
Atmosphere 2017, 8(11), 207; https://doi.org/10.3390/atmos8110207
Submission received: 27 July 2017
/
Revised: 19 October 2017
/
Accepted: 21 October 2017
/
Published: 25 October 2017
(This article belongs to the Special Issue Global Precipitation with Climate Change)
Abstract
:We analyze the past (1900–2015) temperature and precipitation changes in nine separate US climate regions. We find that the temperature increased in a statistically significant (95% confidence level equivalent to alpha level of 0.05) manner in all of these regions. However, the variability in the observed precipitation was much more complex. In the eastern US (east of Rocky Mountains), the precipitation increased in all five climate regions and the increase was statistically significant in three of them. In contract, in the western US, the precipitation increased in two regions and decreased in two with no statistical significance in any region. The CMIP5 climate models (an ensemble mean) were not able to capture properly either the large precipitation differences between the eastern and the western US, or the changes of precipitation between 1900 and 2015 in eastern US. The statistical regression model explains the differences between the eastern and western US precipitation as results of different significant predictors. The anthropogenic greenhouse gases and aerosol (GHGA) are the major forcing of the precipitation in the eastern part of US, while the Pacific Decadal Oscillation (PDO) has the major influence on precipitation in the western part of the US. Our analysis suggests that the precipitation over the eastern US increased at an approximate rate of 6.7%/K, in agreement with the Clausius-Clapeyron equation, while the precipitation of the western US was approximately constant, independent of the temperature. Future precipitation over the western part of the US will depend on the behavior of the PDO, and how it (PDO) may be affected by future warming. Low hydrological sensitivity (percent increase of precipitation per one K of warming) projected by the CMIP5 models for the eastern US suggests either an underestimate of future precipitation or an overestimate of future warming.
1. Introduction
Rising temperatures and variable precipitation over the 20th and the early 21st century have affected the hydrological cycle and vegetation over different parts of the USA unevenly. While temperatures have risen all over the continental US, the precipitation has increased largely over the eastern part and stayed constant or slightly decreased over the western part of the US. The implication of this includes increased flooding in the east, and periods of droughts and increased frequency of forest fires in the west.
Climate change studies that have been primarily performed by complex physics-based climate models [1] that require supercomputers to solve complicated equations and use parameterization of many small scale processes and feedbacks can be enriched by simple statistical regression model analyses that rely on observational data to provide new insights into the regional scale effects of natural variability and anthropogenic forcing [2,3,4,5,6,7,8,9,10]. Major changes in radiative forcing are due to greenhouse gases [11] and atmospheric aerosols [12,13].
Climate model simulations project further drying in many drought-prone parts of the world. In particular, they have predicted that the US southwest will transition to a more arid regime [14,15]. In contrast, regression models have suggested a return of more precipitation in the US southwest [16], which is in agreement with recent data. In this report we analyze the temperature and precipitation data in nine separate US climate regions (Figure 1) and use the CMIP5 climate models outputs, together with statistical regression models, to identify causes of the different climate trajectories over the eastern and western US.
2. Data
In our study we use the temperature and precipitation data for individual US climate regions provided by the NOAA National Centers for Environmental Information website at https://www.ncdc.noaa.gov/cag/. In the NOAA data the observations have been adjusted to account for artificial effects introduced into the climate record by factors such as instrument changes, station relocation, observer practice changes, and urbanization. The ensemble mean of the CMIP5 model simulations were downloaded and integrated over required regions using the software available at the KMNI (The Royal Netherlands Meteorological Institute) Climate Explorer website at http://climexp.knmi.nl/start.cgi. Radiative forcing due to anthropogenic greenhouse gases and aerosols, solar variability, volcanic aerosols, and oceanic indices are taken as specified in [6,7] and in the Annex II to the IPCC 2013 report [17].
3. Results
3.1. Observational Results 1900–2015 in Individual Climate Regions
To investigate the temperature changes within the 20th century we compare the averages of annual temperatures within the 21 year segments of years 1900–1920 and 1995–2015 in the nine individual climate regions. For simplicity of notation we refer to the first mean by its initial year (1900) and to the second mean by its final year (2015). For each of the time series (sequence of twenty one years), we have tested the hypothesis of a zero autocorrelation. In all 36 cases (18 temperature and 18 precipitation time series), the p-value against the null hypothesis was larger than 0.05. Thus the hypothesis of zero autocorrelation cannot be rejected and a simple statistics for equality of two means can be used. The results are summarized in the box diagrams (Figure 2) and in Table 1. The p-values in Table 1 are related to the hypothesis that the temperature means of 1900–1920 and 1995–2015 are the same (Welch two sample t-test).
We recognize that the t-statistics may lead to improper p-values if the parent distribution is not Gaussian. To investigate the impact of the Gaussian assumption, we considered the Mann Whitney rank sum test to test the null hypothesis of equality of the parent distributions. That test is a nonparametric test. The resulting p-values and confidence intervals are similar to the results reported by the t-test.
The temperature increased between 1900 and 2015 in all nine US climate regions, and the increases were statistically significant, as demonstrated by the p-values in Table 1. The smallest temperature increase of 0.58 °C occurred in the Southeast region, which had the highest mean temperature in 1900 (16.78 °C). The largest temperature increase of 1.33 °C is observed in the Northeast.
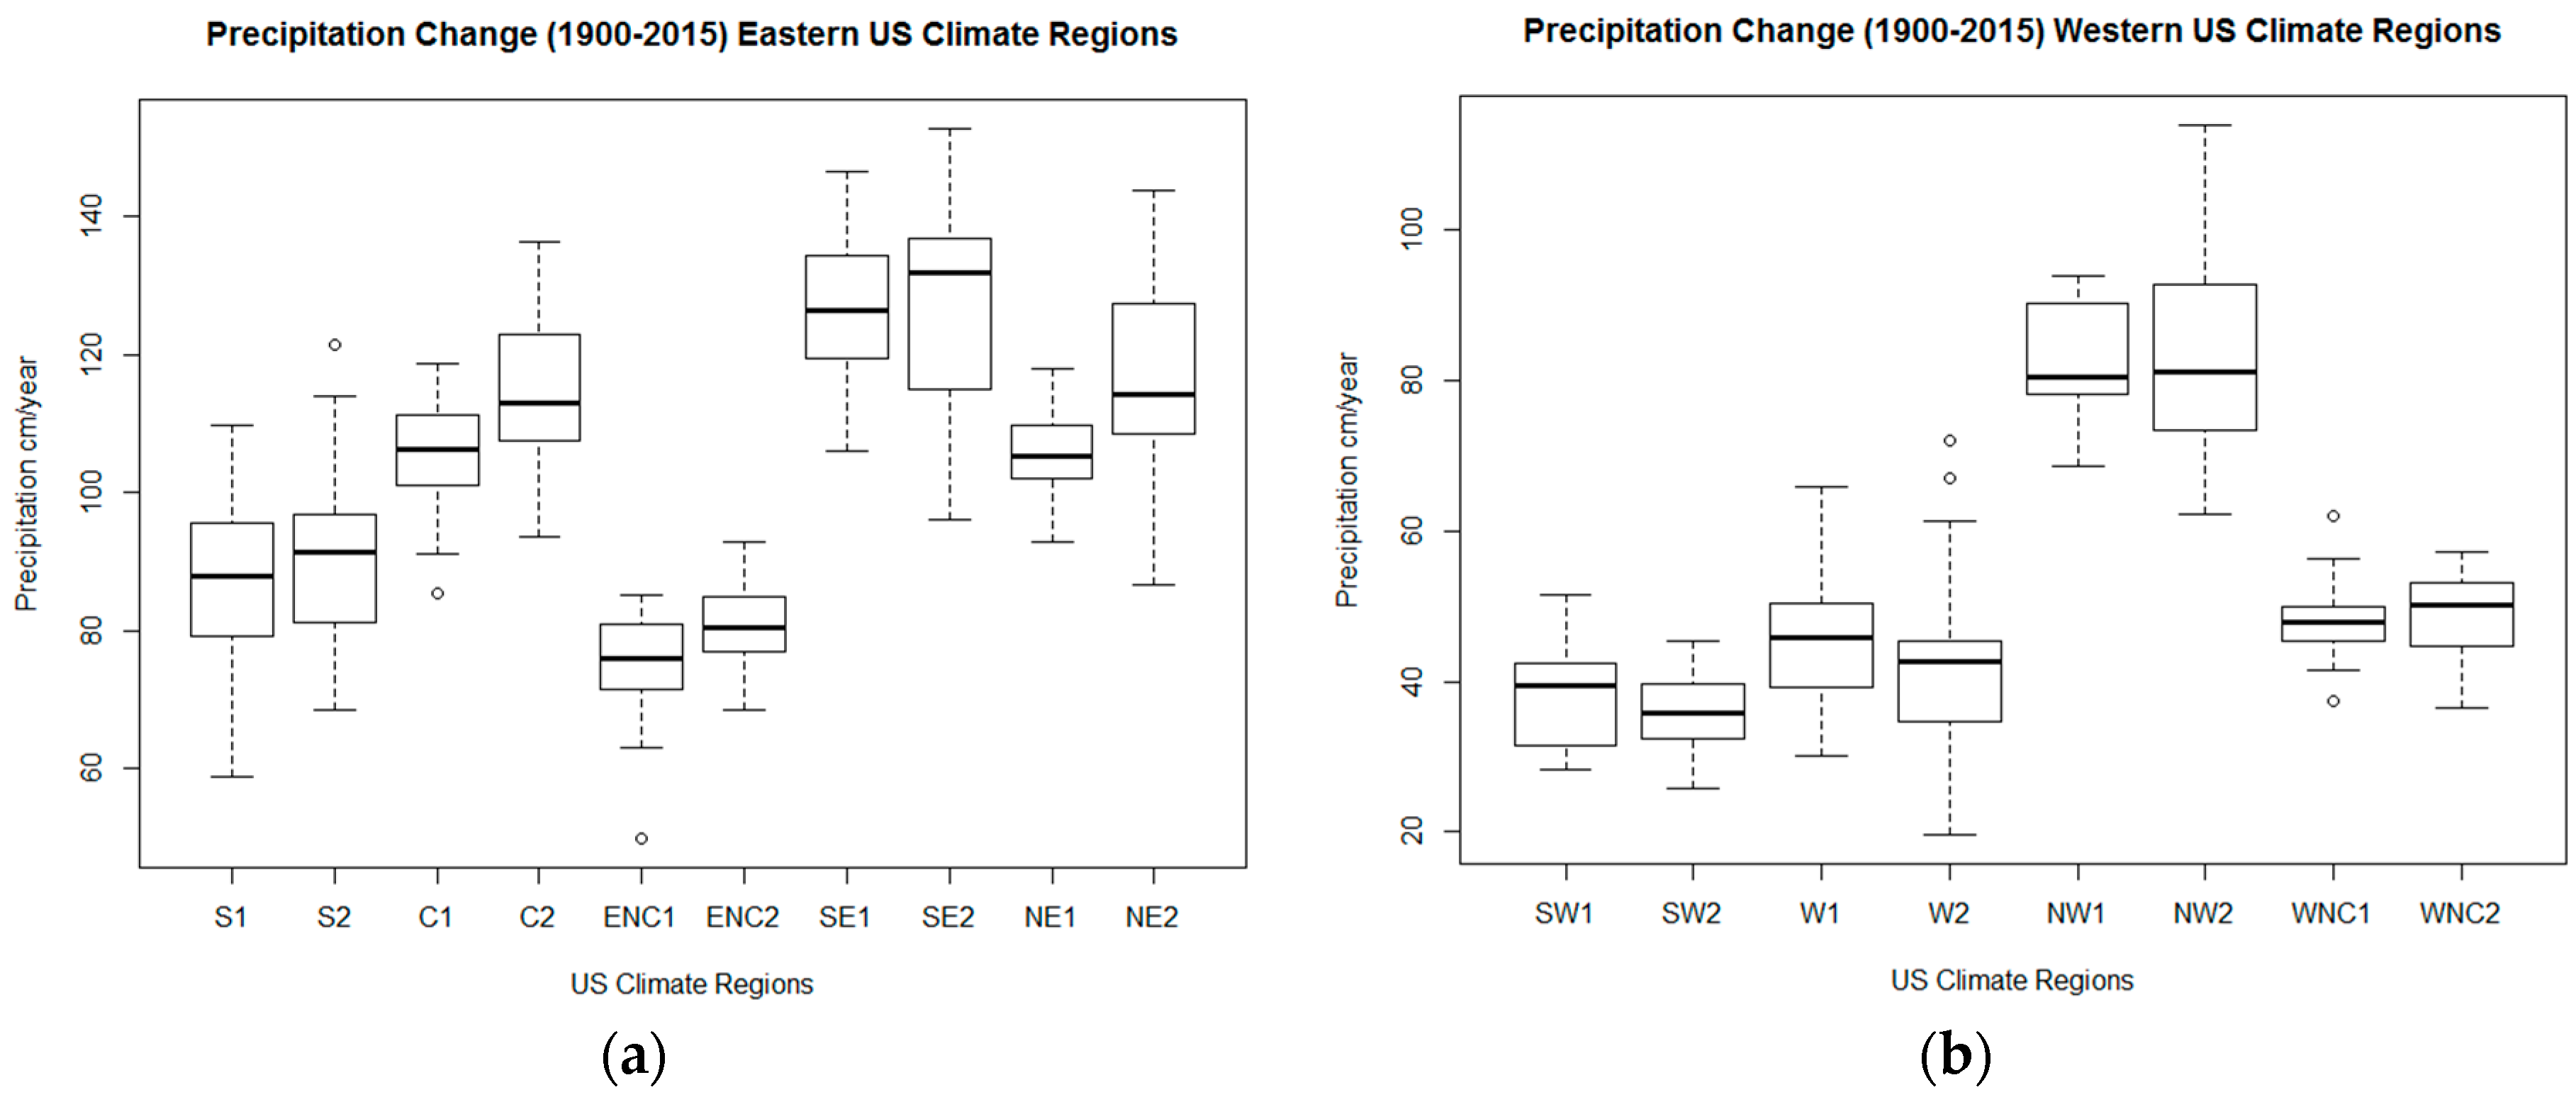
The results concerning precipitation in each of the climate regions are summarized in Figure 3 and in Table 2. The largest precipitation increase between 1900 and 2015 of 10.24 cm/year is observed in the Northeast, while the largest decrease (−2.05 cm/year) is in the Southwest region. The p-values in Table 2 are evaluations of the hypothesis that the precipitation means for 1900–1920 and 1995–2015 for annual precipitation are the same. We note that the precipitation increased in all regions, except in the Southwest and West regions (Figure 4). However, the precipitation changes were not statistically significant (at the 95% confidence level), except in the Central, East-North-Central, and Northeast regions. This means that in all other regions the observed precipitation changes could have been caused by chance, while the 1900–1920 and 1995–2015 means of annual precipitation were really the same. Even in the Southwest region where the precipitation decrease is quite large (5.39%), there is a 27% (p-value of 0.27) probability that this decrease is observed by chance while the means of 1900–1920 and 1995–2015 are in reality equal.
We also notice that the precipitation increases in the regions east of Rocky Mountains (eastern US) are always positive and, on average, considerably larger than increases in the western US. In addition, in five out of six eastern US climate regions, the precipitation increases per °C are close to or over the value of about 7%/°C given by the Clausius-Clapeyron equation [18]. This theoretical estimate results from the hypothesis that fractional changes in precipitation should be proportional to fractional changes in equilibrium vapor pressure, which, according to the Clausius-Clapeyron equation, results in those fractional changes being also approximately proportional to the change in temperature [19].
To summarize, we find that temperature increases between 1900 and 2015 are observed in all regions and the increases are statistically significant. Statistically significant precipitation (Figure 4) increases are observed in three (Central, East-North-Central, and the Northeast) out of five eastern US regions. Precipitation increase is also observed in the South, Southeast, Northwest, and West-North-Central regions, but these increases are not statistically significant at the 95% confidence level. Finally, a precipitation decrease is observed in the Southwest and the West regions, with neither of them being statistically significant.
3.2. Observational Results for 1900–2015 in the Eastern and Western US
On a larger scale there is a significant difference in precipitation variability between the climate east of the Rocky Mountains (called here the eastern US) and west of the Rocky Mountains (herein the western US). Thus, we consider it useful to look at the averages of temperature and precipitation over the eastern and western US. The eastern US temperature and precipitation is obtained as an area weighted average of the S, C, ENC, SE, and NE regions. Similarly, the data for the western part of the US is obtained as an average of the SW, NW, W and WNC regions. The results are summarized in Table 3.
The temperature increase in the western part was larger than in the eastern part of the USA (1.18 °C compared to 0.76 °C). A significant precipitation increase in the eastern part (5.07 cm/year) is contrasted with a slight (statistically not significant) decrease (−0.38 cm/year) in the western part of the USA.
The hydrological climate sensitivity, defined as the percentage change of precipitation per degree of warming, is close to 7% per 1 °C in the eastern part of the US (6.7%/°C), while it is far from that magnitude in the western part of the US (−0.6%/°C). We take this as an indication that, on average, systematically different processes leading to precipitation may occur in the eastern and the western parts of the US. Likely mechanisms are the role of the Pacific Ocean and the complex terrain in the western US. The average value of 3.5%/°C for the continental US does not mean an average response over all the continental US; rather, this is an average of two regions (western and eastern US) with vastly different responses.
3.3. CMIP5 Climate Models Simulations
For several decades, the physics-based climate models (General Circulation Models (GCM’s) or Earth System Models (ESM’s)) have provided one of the basic tools for use in our understanding of the past and current climate, as well as a tool for prediction (often called projection) of future climate changes. The current versions of climate models, the CMIP5 (the 5th phase of the Coupled Model Intercomparison Project) models, are quite successful in simulating the past global and continent-scale temperature patterns; however, the sub-continental temperature simulations are less reliable [20].
The models’ simulation of global precipitation is generally less accurate than that of temperature [21,22]. At regional scales, the simulation of precipitation is even more problematic, very likely due to large uncertainties in the modeling of aerosol and cloud processes. The CMIP5 models’ simulations are often used for downscaling [23,24], wherein the GCM simulations are used as boundary conditions for regional models. The regional models, however, have no mechanism for correcting uncertainties and possible errors introduced by global models’ simulations.
In spite of current uncertainties, especially with respect to simulated and predicted precipitation, the models’ projections are being used for the estimation of different climate variables on global as well as regional scales [25,26].
In order to assess the accuracy of the CMIP5 models as applied to the continental US, in the following we compare the observed and CMIP5-simulated precipitation and temperature patterns over the eastern and western parts of the US.
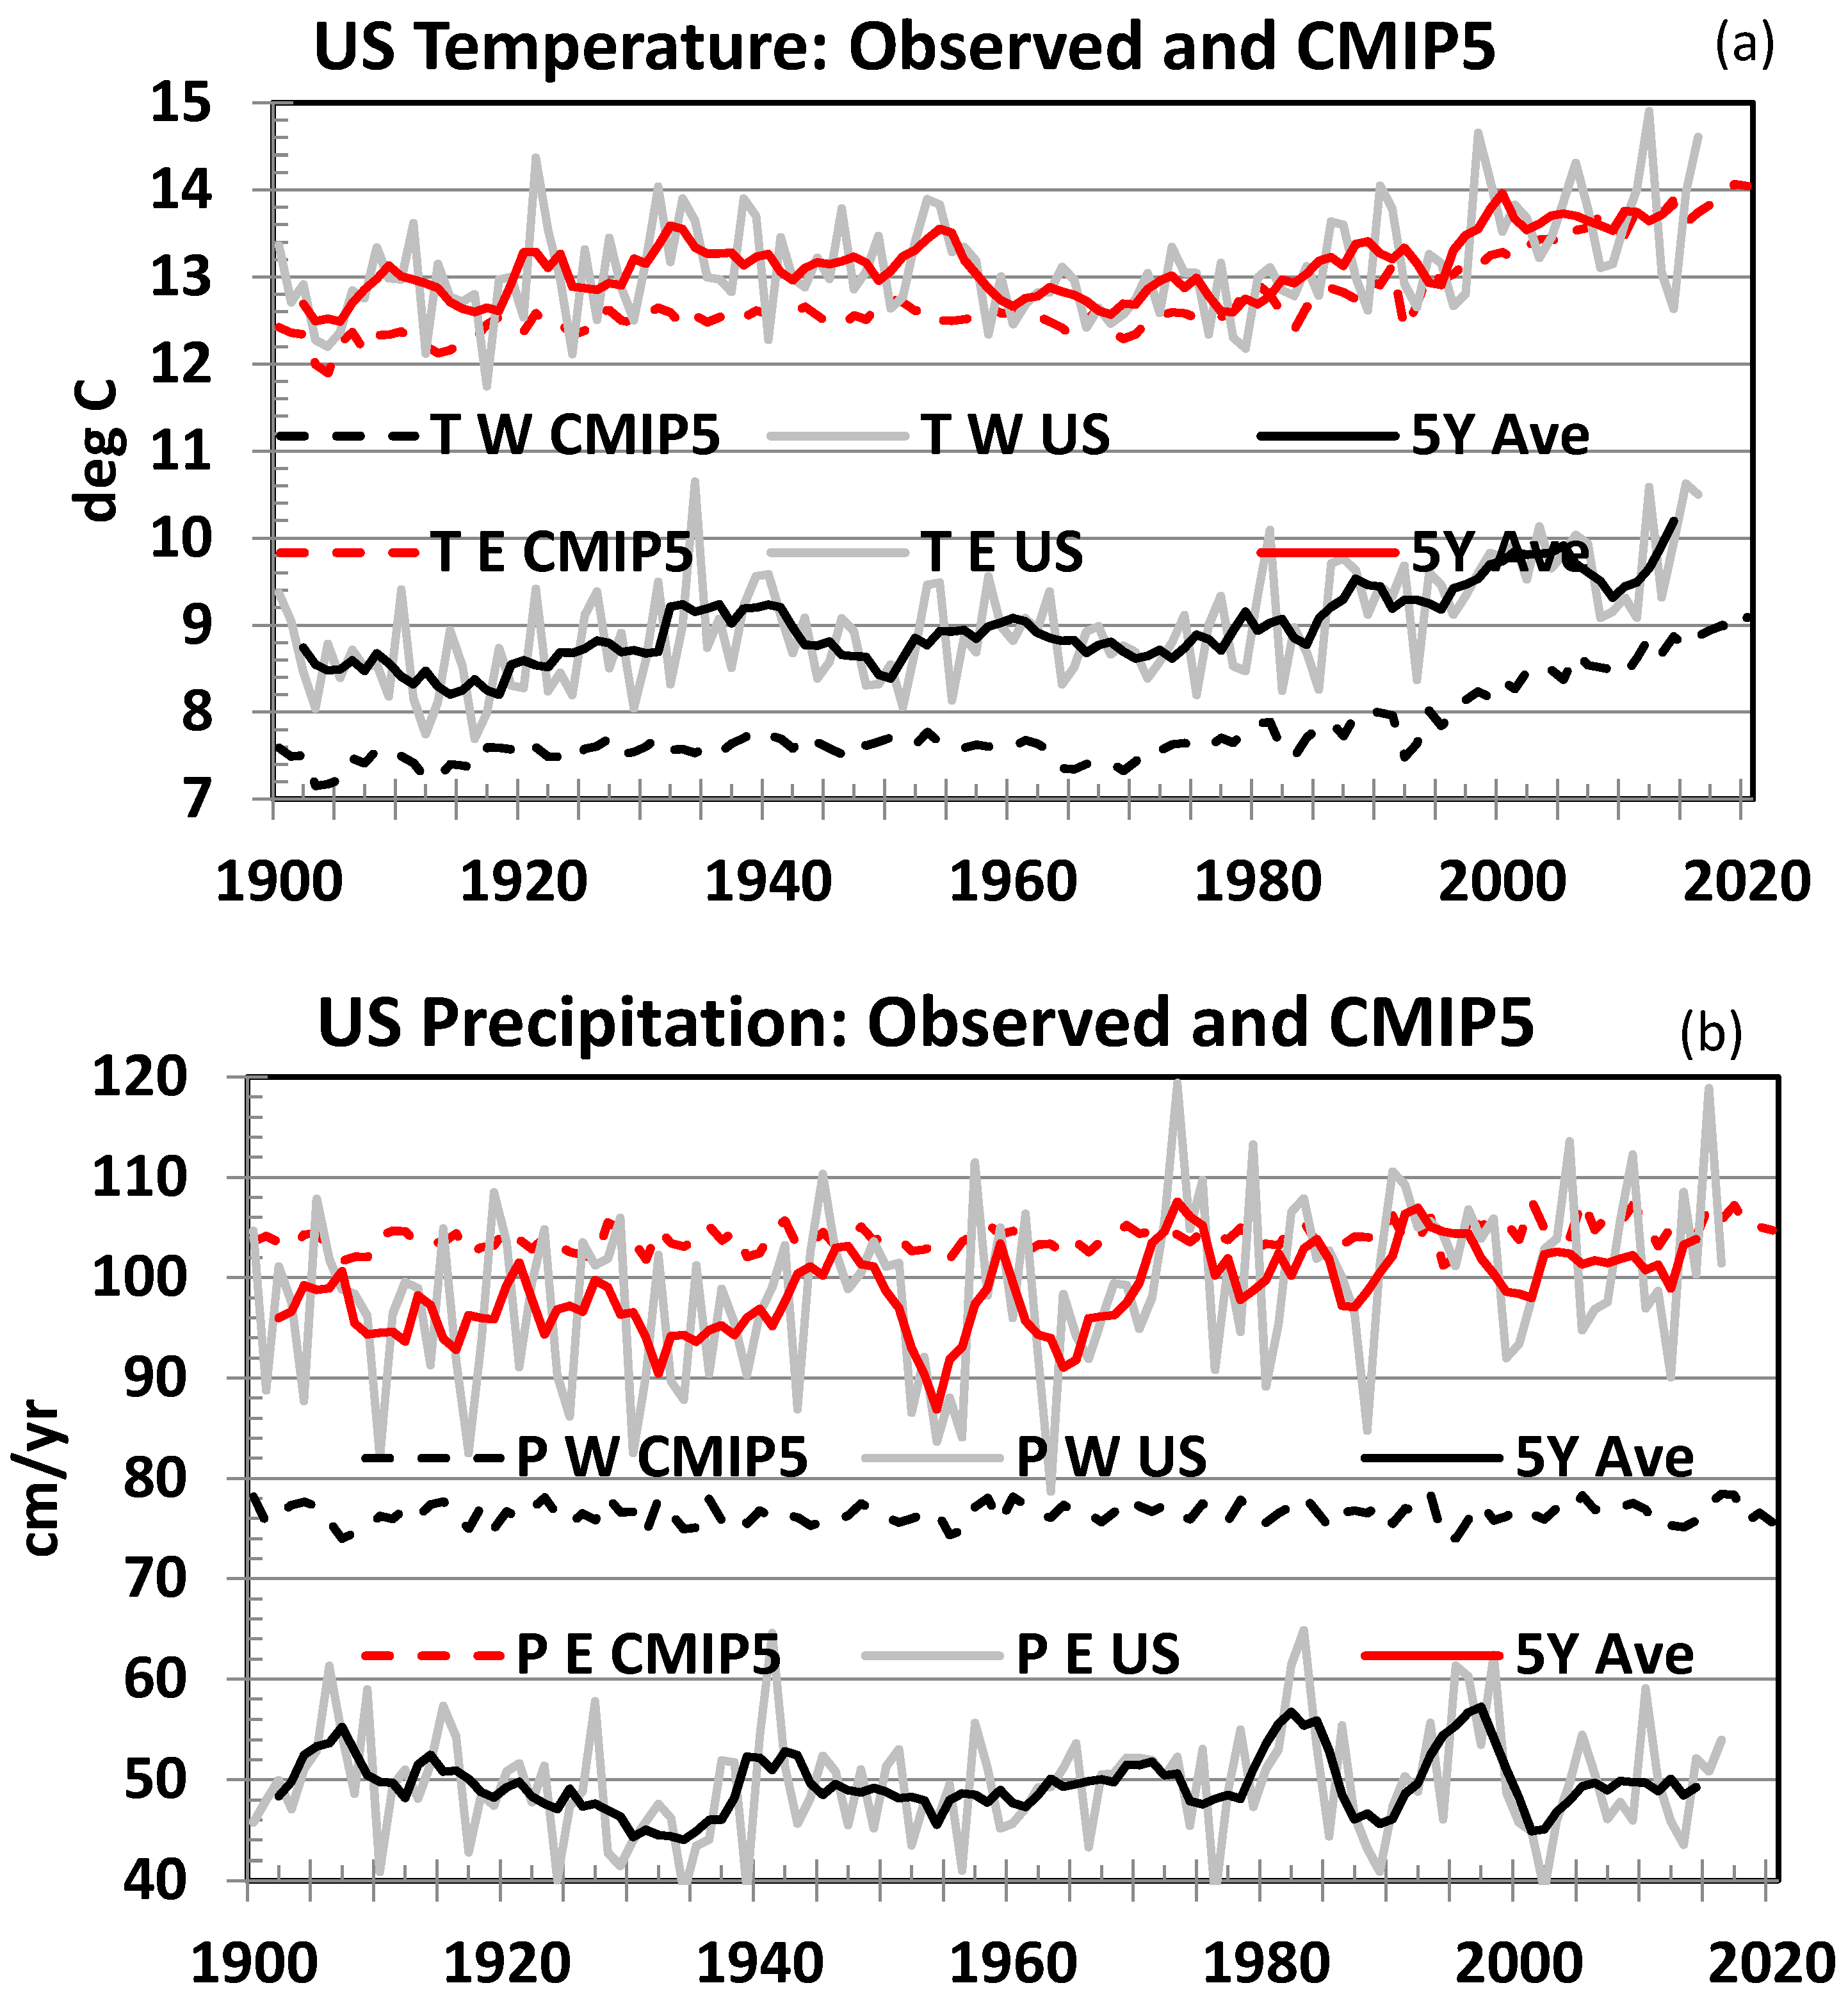
The ensemble mean of all CMIP5 simulations was downloaded from the KMNI (the Royal Netherlands Meteorological Institute) Climate Explorer website at http://climexp.knmi.nl/start.cgi and averaged over the eastern and the western part of the US using area weighted averaging. The 1900–2015 difference in precipitation is again defined as the difference between the annual averages of 1900–1920 and 1995–2015. The results are summarized in Table 4 and Figure 5. The ensemble mean of the CMIP5 model simulations reproduces reasonably well (within about 1 °C) the temperature variability of both the eastern and the western US temperature. However, the model simulations do not reproduce the observed precipitation values of the western part of the USA (models simulated about 76 cm/year comparted to observed 50 cm/year). The resulting hydrological climate sensitivity 1.41%/°C for the eastern part of the US is far from the observed values of 6.7%/°C, while the 0.03%/°C for the western US is consistent with observation indicating no significant change in precipitation with increasing temperature.
We conclude that the observed precipitation and the differences between the eastern and western parts of the US are not reproduced by the CMIP5 models (Figure 5 and Figure 6). The observed precipitation increase in the eastern US (Figure 6a) is underestimated (1.46 cm/year compared to observed 4.91 cm/year) by about a factor of three. Consequently, past studies of precipitation, vegetation growth, aridity, tree mortality, and similar climate change consequences based on CMIP5 models simulations are questionable and should be re-evaluated. The CMIP5 models’ inability to capture the precipitation character of the eastern (observed precipitation increases are about three times faster than the CMIP5 simulation) and western US (CMIP5 average value of precipitation about 50% higher than the observed one) also has likely implications for future climate change projections and its environmental and agricultural consequences.
For the future (2015–2100) CMIP5 climate models projection we use the RCP8.5 future scenario. The CMIP5 model temperature and the precipitation in both parts of the USA follow a similar path, in both the past-simulated (Figure 5) and future predicted time spans.
The CMIP5 models 2015–2100 predictions of the warming and precipitation are all statistically significant (Table 5). The eastern and western part of the US are supposed, according to the CMIP5 models, to experience about the same rate of temperature increase, about 4.6 °C warming between 2015 and 2100, under the RCP8.5 scenario.
Although the CMIP5 models project a considerable increase of precipitation, in the western and eastern parts of the US, during the rest of the 21st century (2.47 cm/year and 6.39 cm/year, respectively), this precipitation increase leads to essentially no change in projected hydrological climate sensitivity, ∆P (%)/∆T (K) = 0.7%/K for the western US, and 1.3%/K for the eastern US (Table 5). These low values of hydrological sensitivity are a consequence of the large increases in projected temperatures. To reconcile the eastern US to approach the past observed values (∆P (%)/∆T (K) = 6.7%/K in Table 3, which is close to the Clausius-Clapeyron estimate of 7%/°C), we would need to increase significantly the projected precipitation, or significantly decrease the projected warming.
Concerning the temperature, the CMIP5 models reproduced the past temperature increases reasonably well. However, as is known, reproduction of the past is no guarantee of reasonable predictions in the future. Agreement with the past warming is only a necessary, but not a sufficient, condition for reliable future projections. Many models that reproduce the past regional temperature similarly produce very different future projections [27,28].
3.4. Statistical Regression Models
Statistical regression is a simple but powerful tool used in many branches of science. The two basic applications of the regression models are inference and prediction. Regression climate models have been used in the analysis of global temperature, Arctic climate change, US southwestern climate, and in the analysis of many other climate indicators to complement climate models’ simulations of the past and future projections.
Here we use regression models to infer the main driver of precipitation and temperature over the continental USA using the observed data. We use the usual set of predictors which include the radiative forcing due to anthropogenic greenhouse gases and aerosols (GHGA), solar irradiance variability (SOL), and radiative forcing of volcanic aerosols (VOLC); oceanic influences characterized by the Atlantic Multi-decadal Oscillation (AMO) and Pacific Decadal Oscillation (PDO); and El Nino-Southern Oscillation (ENSO) represented by the MEI (Multivariate ENSO Index), available at the NOAA website https://www.esrl.noaa.gov/psd/enso/mei/. To identify statistically significant predictors we expand each climate region precipitation as a linear superposition of all the predictors, and we use a backward selection procedure [29] to eliminate one by one each of the nonsignificant predictors. The information concerning the predictors used and details of the backward selection procedure can be found in our earlier publications [6,7]. The results indicating the statistically significant predictors (at 95% confidence level) are summarized in Table 6.
Table 6 provides additional qualitative information concerning the US climate. Considering first the temperature in the eastern and western part of the US (Table 6, the last two lines), we see that both the radiative forcing due to anthropogenic GHGA and AMO make a statistically significant contribution with a positive sign to the temperature. Thus, both the GHGA and the AMO contributed to the warming during the last few decades of a positive AMO index. Since the individual physics-based CMIP5 models do not reproduce the AMO with a proper time phase, in their ensemble mean the AMO-like contributions are averaged out. To reproduce the past temperature reasonably well, the warming caused by the AMO has to be picked up by another warming agent, in this case by the GHGA, resulting in an overestimate of the GHGA warming effect. Consequently, the future temperature projections that are dominated by GHGA will be likely too high, and hydrological climate sensitivity (% of precipitation increase per degree of warming) too low.
Considering the precipitation in the eastern part of the US (S, ENC, C, SE, NE, and Eastern US), the contribution of the GHGA is again positive; however, the AMO contribution appears with a negative sign. Since the AMO is not reproduced by an ensemble of model simulations, the decreasing precipitation effect of the AMO leads to a decreased precipitation efficiency of the GHGA. Consequently, the future projections of precipitation in the eastern US will be likely underestimated by the CMIP5 models. Thus, our regression model suggests that the ensemble mean of the CMIP5 model simulations will likely overestimate future temperatures over the USA and underestimate precipitation over the eastern US.
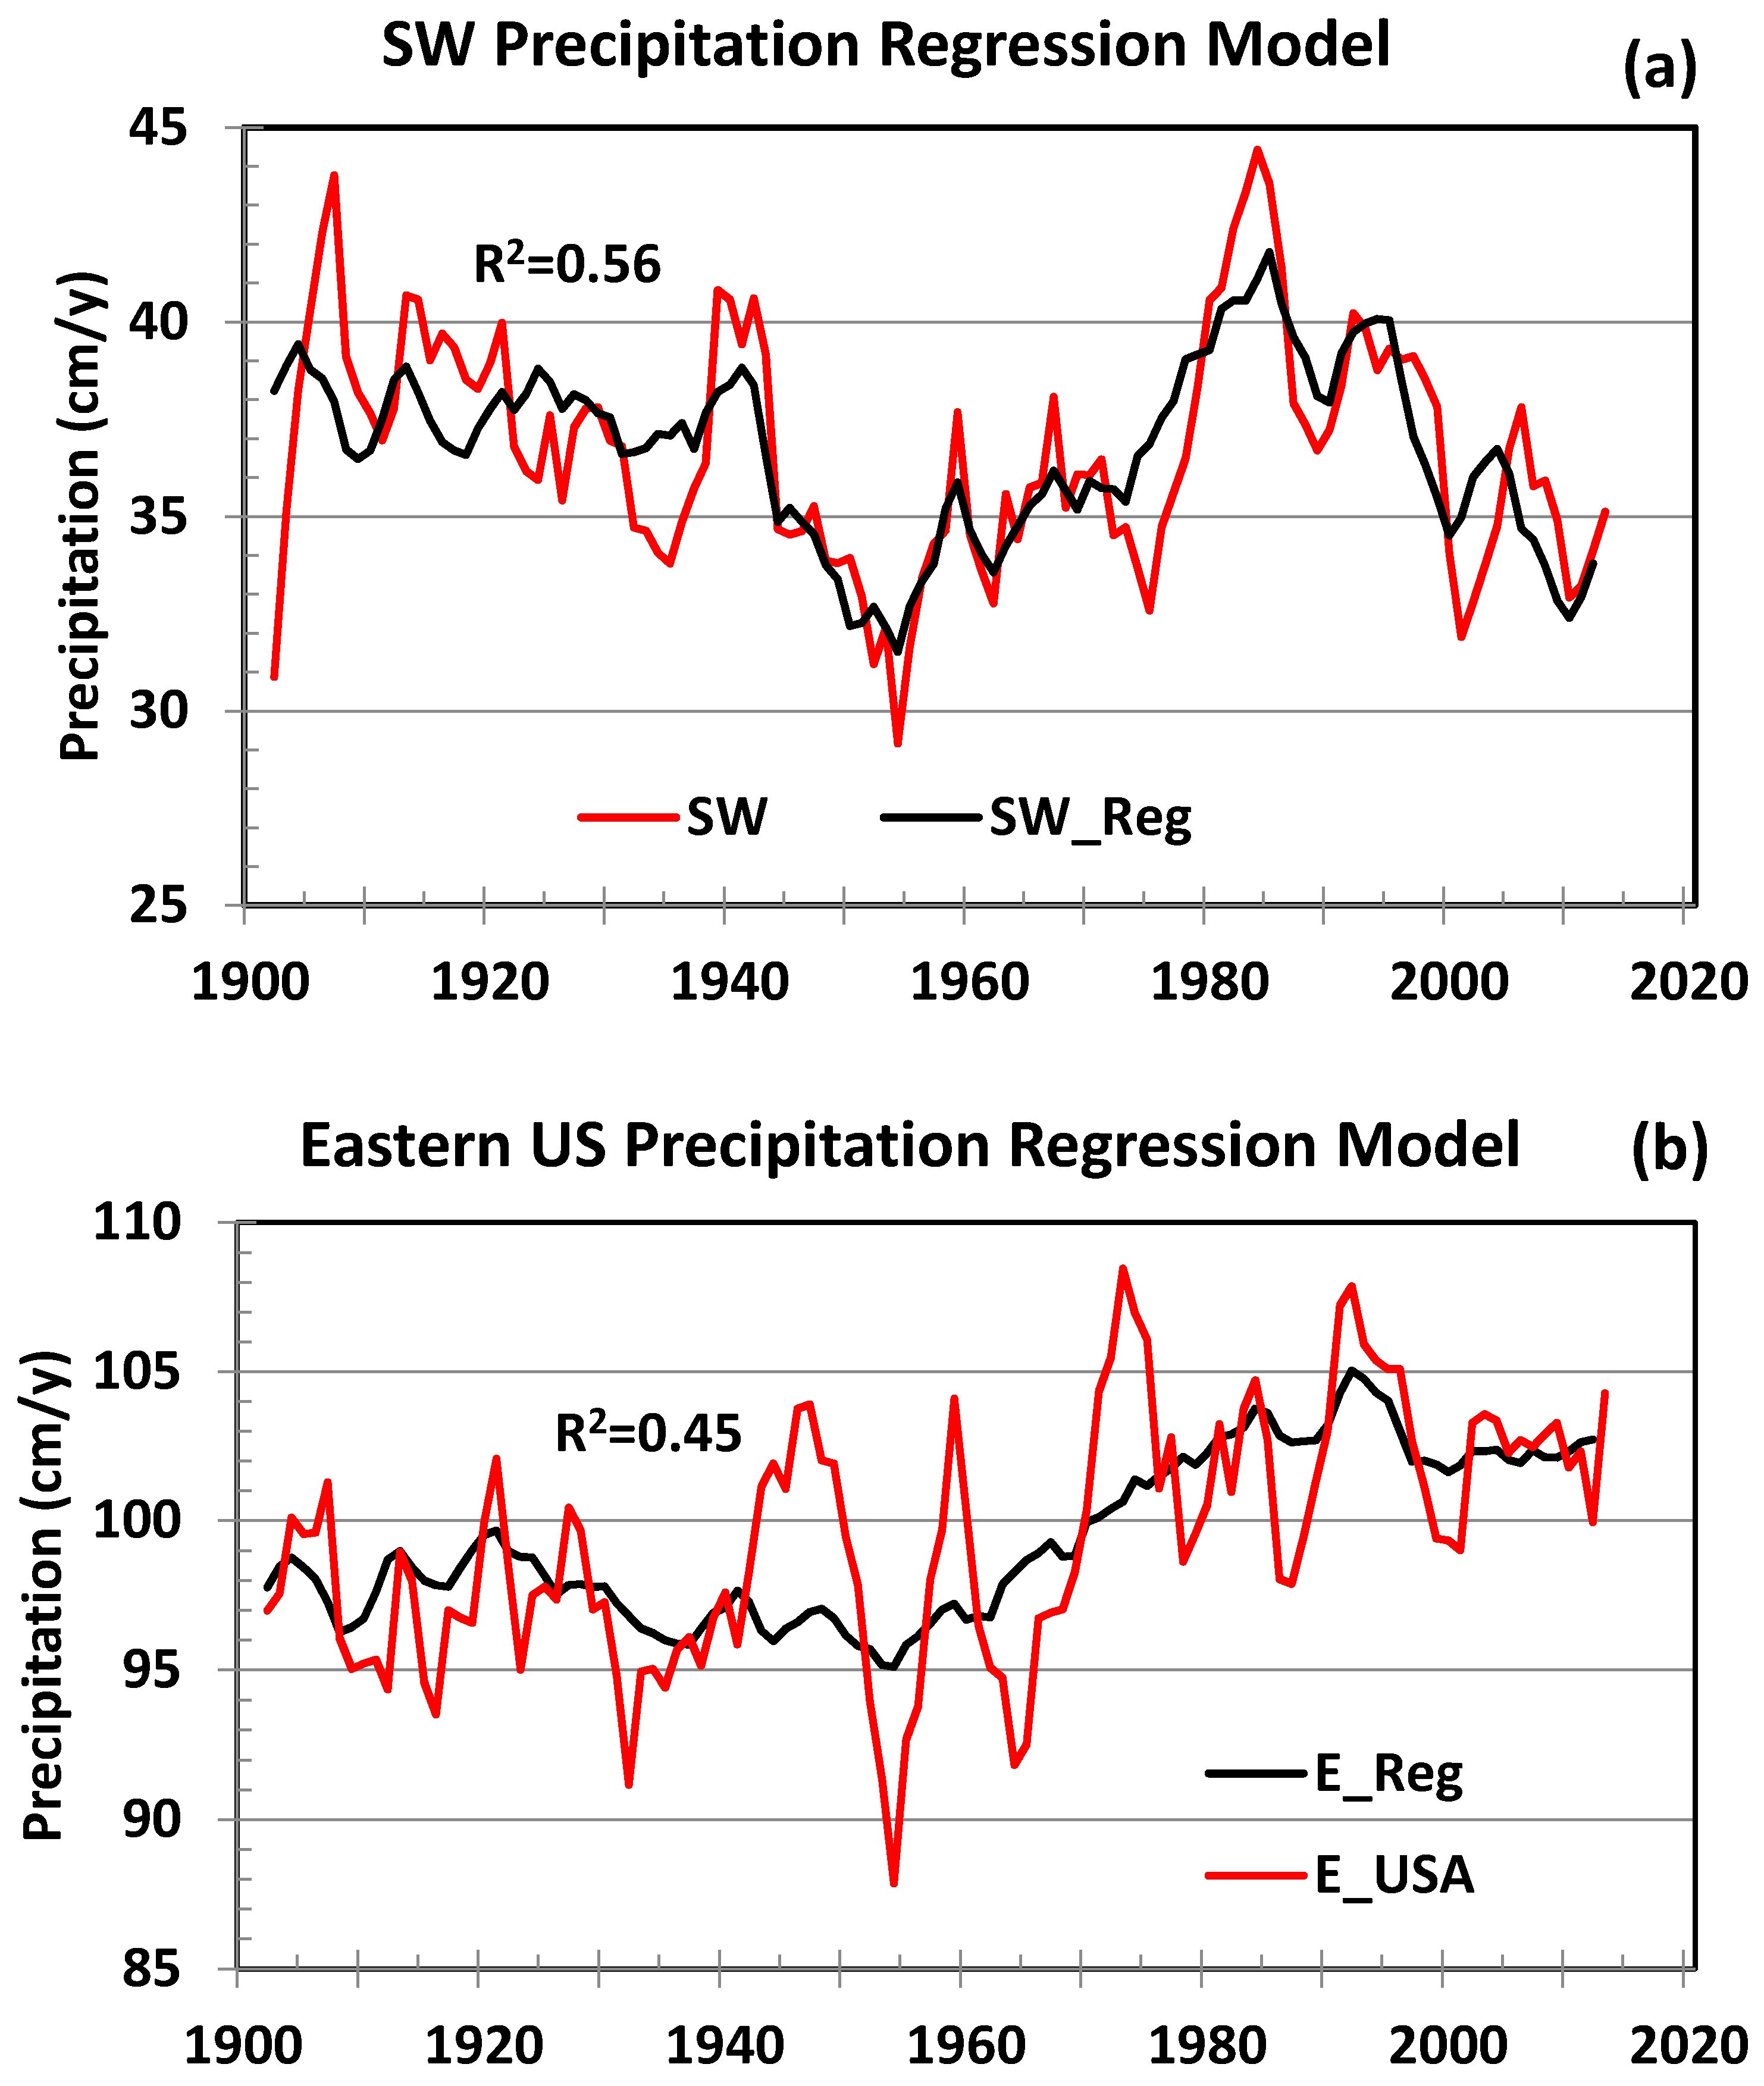
Examples of the regression model reconstruction of the precipitation in the Southwest climate region and the eastern US are shown in Figure 7.
We find that the PDO is a statistically significant predictor of precipitation in three out of four western US regions. It also affects the whole western US. On the other hand, the PDO is not affecting the precipitation in any of the eastern US regions. The anthropogenic effects (GHGA) have some influence on the precipitation only in the WNC region, and they do not influence the precipitation of the whole western US.
In the eastern US, the GHGA and AMO affect precipitation in four out of five regions, as well as the Eastern US as a whole. As far as the temperature is concerned, the GHGA and AMO are statistically significant predictors for both the western and the eastern US.
We note that the anthropogenic GHGA contribution to the precipitation or the temperature is always positive. This means that the GHGA (which can be considered just a proxy for a rising temperature) contributes always to an increase of precipitation or temperature.
On the other hand, the AMO contribution to the temperature appears always with a positive sign, while its contribution to precipitation has a negative sign. This means that the AMO during its positive phase acts to increase the temperature and to decrease the precipitation. Considering the CMIP5 climate models, in the ensemble mean the AMO-like contribution will be averaged out, since the models do not capture the AMO in proper time and with proper amplitude. Consequently, the positive AMO contribution towards the temperature increase within the last three to four decades will have to be picked up by the GHGA, leading to an enhanced (overestimated) GHGA warming effect. This will result in an overestimate of the current and future GHGA-produced warming. Within the last few decades this may have contributed to climate models failing to predict the actual warming slowdown [30,31,32,33,34]. Similarly, the absence of the AMO (negative) signal in the ensemble mean of the CMIP5 simulations of the eastern US precipitation will lead to a decreased GHGA precipitation influence in the eastern US, leading to an underestimate of the models’ projected precipitation over the eastern US.
4. Discussion and Conclusions
Our analysis of the temperature and precipitation data shows that all nine US climate regions experienced a significant warming during the 1900–2015 timespan. However, the precipitation varied differently in the eastern and the western parts of the continental US. Several regions in the east underwent a statistically significant increase in annual precipitation, while the West and Southwest regions underwent a precipitation decrease, although it was not statistically significant.
Although the physics-based CMIP5 climate models reproduce past temperature increases in the eastern and the western US reasonably well, they do not capture observed precipitation increases in the eastern US or absolute values of precipitation in the western US. A somewhat analogous study of climate model precipitation and temperature deficiencies with respect to sub-global scales, however, over oceanic regions, was also reported earlier [35,36].
The climate regression models identify the PDO as a major contributor to the western US precipitation, while the eastern precipitation is dominated by the anthropogenic greenhouse gases and aerosols (GHGA), with an additional contribution from the AMO. The GHGA forcing can be considered in regression models as primarily a proxy for an increasing temperature. Thus, as long as the temperature keeps increasing, we expect to have an increasing precipitation over the eastern US, approximately at the Clausius-Clapeyron rate of about 7%/K. This is close to the observed value of 6.7%/K during the 1900–2015 time span. In this case, more flooding than is projected by the current CMIP5 models will likely occur in the eastern part of the US. Future precipitation over the western US will depend in part on the future PDO trajectory that current models are not able to predict.
The future projections of regression models for the southwestern US temperature and precipitation were reported in an earlier publication [16]. Perhaps the lagged PDO/AMO correlation combined with a possible quasi-periodicity of AMO may be worth pursuing. Further research in the integration of regression and physics-based climate models may be useful in order to assess more reliably the future evolution of precipitation in the western and eastern US.
Acknowledgments
The authors thank the Editor and three reviewers for their help with revisions and improvements of the manuscript. Reported research LA-UR-17-25198 was not supported by any external funds.
Author Contributions
Petr Chylek designed the project, participated in the analysis of the data and writing the paper. Manvendra K. Dubey and James D. Klett participated in data analysis and contributed in writing and interpreting the results. Nicholas Hengartner performed statistical analysis.
Conflicts of Interest
The authors declare no conflict of interest.
References
- Stocker, T.F.; Qin, D.; Plattner, G.-K.; Alexander, L.V.; Allen, S.K.; Bindoff, N.L.; Bréon, F.-M.; Church, J.A.; Cubasch, U.; Emori, S.; et al. Technical Summary. In Climate Change 2013: The Physical Science Basis; Stocker, T.F., Qin, D., Plattner, G.-K., Tignor, M., Allen, S.K., Boschung, J., Nauels, A., Xia, Y., Bex, V., Midgley, P.M., Eds.; Contribution of Working Group I to the 5th AR of the IPCC; Cambridge University Press: Cambridge, UK, 2013. [Google Scholar]
- Lean, J.L.; Rind, D.H. How natural and anthropogenic influences alter global and regional surface temperatures: 1889 to 2006. Geophys. Res. Lett. 2008, 35, L18701. [Google Scholar] [CrossRef]
- Foster, G.; Rahmstorf, S. Global temperature evolution 1979–2010. Environ. Res. Lett. 2011, 6, 044022. [Google Scholar] [CrossRef]
- Zhou, J.; Tung, K.K. Deducing multidecadal anthropogenic warming trend using multiple regression analysis. J. Atmos. Sci. 2013, 70, 3–8. [Google Scholar] [CrossRef]
- Canty, T.; Mascioli, N.; Smarte, M.; Salawitch, R. An empirical model of global climate—Part 1: A critical evaluation of vol-canic cooling. Atmos. Chem. Phys. 2013, 13, 3997–4031. [Google Scholar] [CrossRef]
- Chylek, P.; Hengartner, N.; Lesins, G.; Klett, J.D.; Humlum, O.; Wyatt, M.; Dubey, M.K. Isolating the anthropogenic component of arctic warming. Geophys. Res. Lett. 2014, 41, 3569–3576. [Google Scholar] [CrossRef]
- Chylek, P.; Klett, J.D.; Lesins, G.; Dubey, M.K.; Hengartner, N. The Atlantic Multi-decadal Oscillation as a dominant factor of oceanic influence on climate. Geophys. Res. Lett. 2014. [Google Scholar] [CrossRef]
- Miksovsky, J.; Holtanova, E.; Pisoft, P. Imprints of climate forcings in global gridded temperature data. Earth Syst. Dyn. 2016, 7, 231–249. [Google Scholar] [CrossRef]
- Mascioli, N.; Canty, T.; Salawitch, R. An empirical model of global climate—Part 2: Implications for future temperature. Atmos. Chem. Phys. Discuss. 2012, 12, 23913–23974. [Google Scholar] [CrossRef]
- Wyatt, M.; Kravtsov, S.; Tsonis, A. Atlantic Multidecadal Oscillation and Northern Hemisphere’s climate variability. Clim. Dyn. 2012, 38, 929–949. [Google Scholar] [CrossRef]
- Hansen, J.; Sato, M.; Ruedy, R.; Lo, K.; Lea, D.W.; Medina-Elizade, M. Global temperature change. Proc. Natl. Acad. Sci. USA 2006, 103, 14288–14293. [Google Scholar] [CrossRef] [PubMed]
- Moosmuller, H.; Chakrabarty, R.; Arnott, W. Aerosol light absorption and its measurements: A review. J. Quant. Spectrosc. Radiat. Transf. 2009, 110, 844–878. [Google Scholar] [CrossRef]
- Videen, G.; Sun, W.; Gong, W. Advances in atmospheric light scattering theory and remote-sensing techniques. J. Quant. Spectrosc. Radiat. Transf. 2017, 188, 1–2. [Google Scholar] [CrossRef]
- Seager, R.; Ting, M.; Held, I.; Kushnir, Y.; Lu, J.; Vecchi, G.; Huang, H.-P.; Harnik, L.; Leetma, A.; Lau, N.-C.; et al. Model projections of an imminent transition to a more arid climate in southwestern North America. Science 2007, 316, 1181–1184. [Google Scholar] [CrossRef] [PubMed]
- Park Williams, A.; Allen, C.D.; Macalady, A.K.; Griffin, D.; Woodhouse, C.A.; Meko, D.M.; Swetnam, T.W.; Rauscher, S.A.; Seager, R.; Henri, D.; et al. Temperature as a potent driver of regional forest drought stress and tree mortality. Nat. Clim. Chang. 2012. [Google Scholar] [CrossRef]
- Chylek, P.; Dubey, M.K.; Lesins, G.; Li, J.; Hengartner, N. Imprint of the Atlantic multi-decadal oscillation and Pacific decadal oscillation on southwestern US climate: Past, present, and future. Clim. Dyn. 2014, 43, 119–128. [Google Scholar] [CrossRef]
- Intergovernmental Panel on Climate Change (IPCC). Annex II: Climate System Scenario Tables. In Climate Change 2013: The Physical Science Basis; Prather, M., Flato, G., Friedlingstein, P., Jones, C., Lamarque, J.-F., Liao, H., Rasch, P., Eds.; Contribution of Working Group I to the Fifth Assessment Report of the Intergovernmental Panel on Climate Change; Cambridge University Press: Cambridge, UK; New York, NY, USA, 2013. [Google Scholar]
- Salby, M. Fundamentals of Atmospheric Physics; Academic Press: Cambridge, MA, USA, 1996. [Google Scholar]
- Trenberth, K.; Dai, A.; Rasmussen, R.; Parsons, D. The changing character of precipitation. Bull. Am. Meteorol. Soc. 2003, 84, 1205–1217. [Google Scholar] [CrossRef]
- Flato, G.; Marotzke, J.; Abiodun, B.; Braconnot, P.; Chou, S.C.; Collins, W.; Cox, P.; Driouech, F.; Emori, S.; Eyring, V.; et al. Evaluation of Climate Models. In Climate Change 2013: The Physical Science Basis; Stocker, T.F., Qin, D., Plattner, G.-K., Tignor, M., Allen, S.K., Boschung, J., Nauels, A., Xia, Y., Bex, V., Midgley, P.M., Eds.; Contribution of Working Group I to the Fifth Assessment Report of the Intergovernmental Panel on Climate Change; Cambridge University Press: Cambridge, UK; New York, NY, USA, 2013. [Google Scholar]
- Hartmann, D.L.; Klein Tank, A.M.G.; Rusticucci, M.; Alexander, L.V.; Brönnimann, S.; Charabi, Y.; Dentener, F.J.; Dlugokencky, E.J.; Easterling, D.R.; Kaplan, A.; et al. Observations: Atmosphere and Surface. In Climate Change 2013: The Physical Science Basis; Stocker, T.F., Qin, D., Plattner, G.-K., Tignor, M., Allen, S.K., Boschung, J., Nauels, A., Xia, Y., Bex, V., Midgley, P.M., Eds.; Contribution of Working Group I to the Fifth Assessment Report of the Intergovernmental Panel on Climate Change; Cambridge University Press: Cambridge, UK; New York, NY, USA, 2013. [Google Scholar]
- Greve, P.; Seneviratne, S.I. Assessment of future changes in water availability and aridity. Geophys. Res. Lett. 2015, 42, 5493–5499. [Google Scholar] [CrossRef] [PubMed]
- Giorgi, F.; Gutowski, W.J. Regional Dynamical Downscaling and the CORDEX Initiative. Annu. Rev. Environ. Resour. 2015, 40, 467–490. [Google Scholar] [CrossRef]
- Rana, A.; Moradkhani, H.; Qin, Y. Understanding the joint behavior of temperature and precipitation for climate change impact studies. Theor. Appl. Climatol. 2017, 126, 321–339. [Google Scholar] [CrossRef]
- Zhao, S.; Deng, Y.; Black, R. Warm Season Dry Spell in the Central and Eastern Unites States Diverging Skills in Climate Model Representation. J. Clim. 2016, 29, 5617–5624. [Google Scholar] [CrossRef]
- Ahmadalipour, A.; Rana, A.; Moradkhani, H.; Sharma, A. Multi-criteria evaluation of CMIP5 GCMs for climate change impact analysis. Theor. Appl. Climatol. 2017, 128, 71–87. [Google Scholar] [CrossRef]
- Kiehl, J. Twentieth century climate model response and climate sensitivity. Geophys. Res. Lett. 2007, 34, L22710. [Google Scholar] [CrossRef]
- Chylek, P.; Vogelsung, T.; Klett, J.D.; Hengartner, N.; Higdon, D.; Lesins, G.; Dubey, M.K. Indirect Aerosol Effect Increases CMIP5 Models’ Projected Arctic Warming. J. Clim. 2016, 29, 1417–1428. [Google Scholar] [CrossRef]
- Wilks, D.S. Statistical Methods in the Atmospheric Sciences; Academic Press: Cambridge, UK, 2006. [Google Scholar]
- Kosaka, Y.; Xie, S.-P. Recent global warming hiatus tied to equatorial Pacific surface cooling. Nature 2013, 501, 403–407. [Google Scholar] [CrossRef] [PubMed]
- England, M.H.; McGregor, S.; Spence, P.; Meehl, G.A.; Timmermann, A.; Cai, W.; Gupta, A.S.; McPhaden, M.J.; Purich, A.; Santoso, A. Recent intensification of wind-driven circulation in the Pacific and the ongoing warming hiatus. Nat. Clim. Chang. 2014, 4, 222–227. [Google Scholar] [CrossRef]
- Fyfe, J.C.; Meehl, G.A.; England, M.H.; Mann, M.E.; Santer, B.D.; Flato, G.M.; Hawkins, E.; Gillett, N.P.; Xie, S.-P.; Kosaka, Y.; et al. Making sense of the early 2000 warming slowdown. Nat. Clim. Chang. 2016, 6, 224–228. [Google Scholar] [CrossRef]
- Steiman, B.; Mann, M.; Miller, S. Atlantic and Pacific multidecadal oscillation and Northern Hemisphere temperature. Science 2015, 347, 988–991. [Google Scholar] [CrossRef] [PubMed]
- Santer, B.D.; Fyfe, J.C.; Pallotta, G.; Flato, G.M.; Meehl, G.A.; England, M.H.; Hawkins, E.; Mann, M.E.; Painter, J.F.; Bonfils, C.; et al. Causes of differences in model and satellite tropospheric warming rates. Nat. Geosci. 2017, 10, 478–485. [Google Scholar] [CrossRef]
- Stephens, G.; L’Ecuyer, T.; Forbes, R.; Gettlemen, A.; Golaz, J.; Bodas-Salcedo, A.; Suzuki, K.; Gabriel, P.P.; Haynes, A.J. Dreary state of precipitation in global models. J. Geophys. Res. 2010, 115, D24211. [Google Scholar] [CrossRef]
- Power, S.; Delage, F.; Wang, G.; Smith, I.; Kociuba, G. Apparent limitations in the ability of CMIP5 climate models to simulate recent Multi-decadal changes in surface temperature: Implication for global temperature projections. Clim. Dyn. 2017, 49, 53–69. [Google Scholar] [CrossRef]
Figure 1.
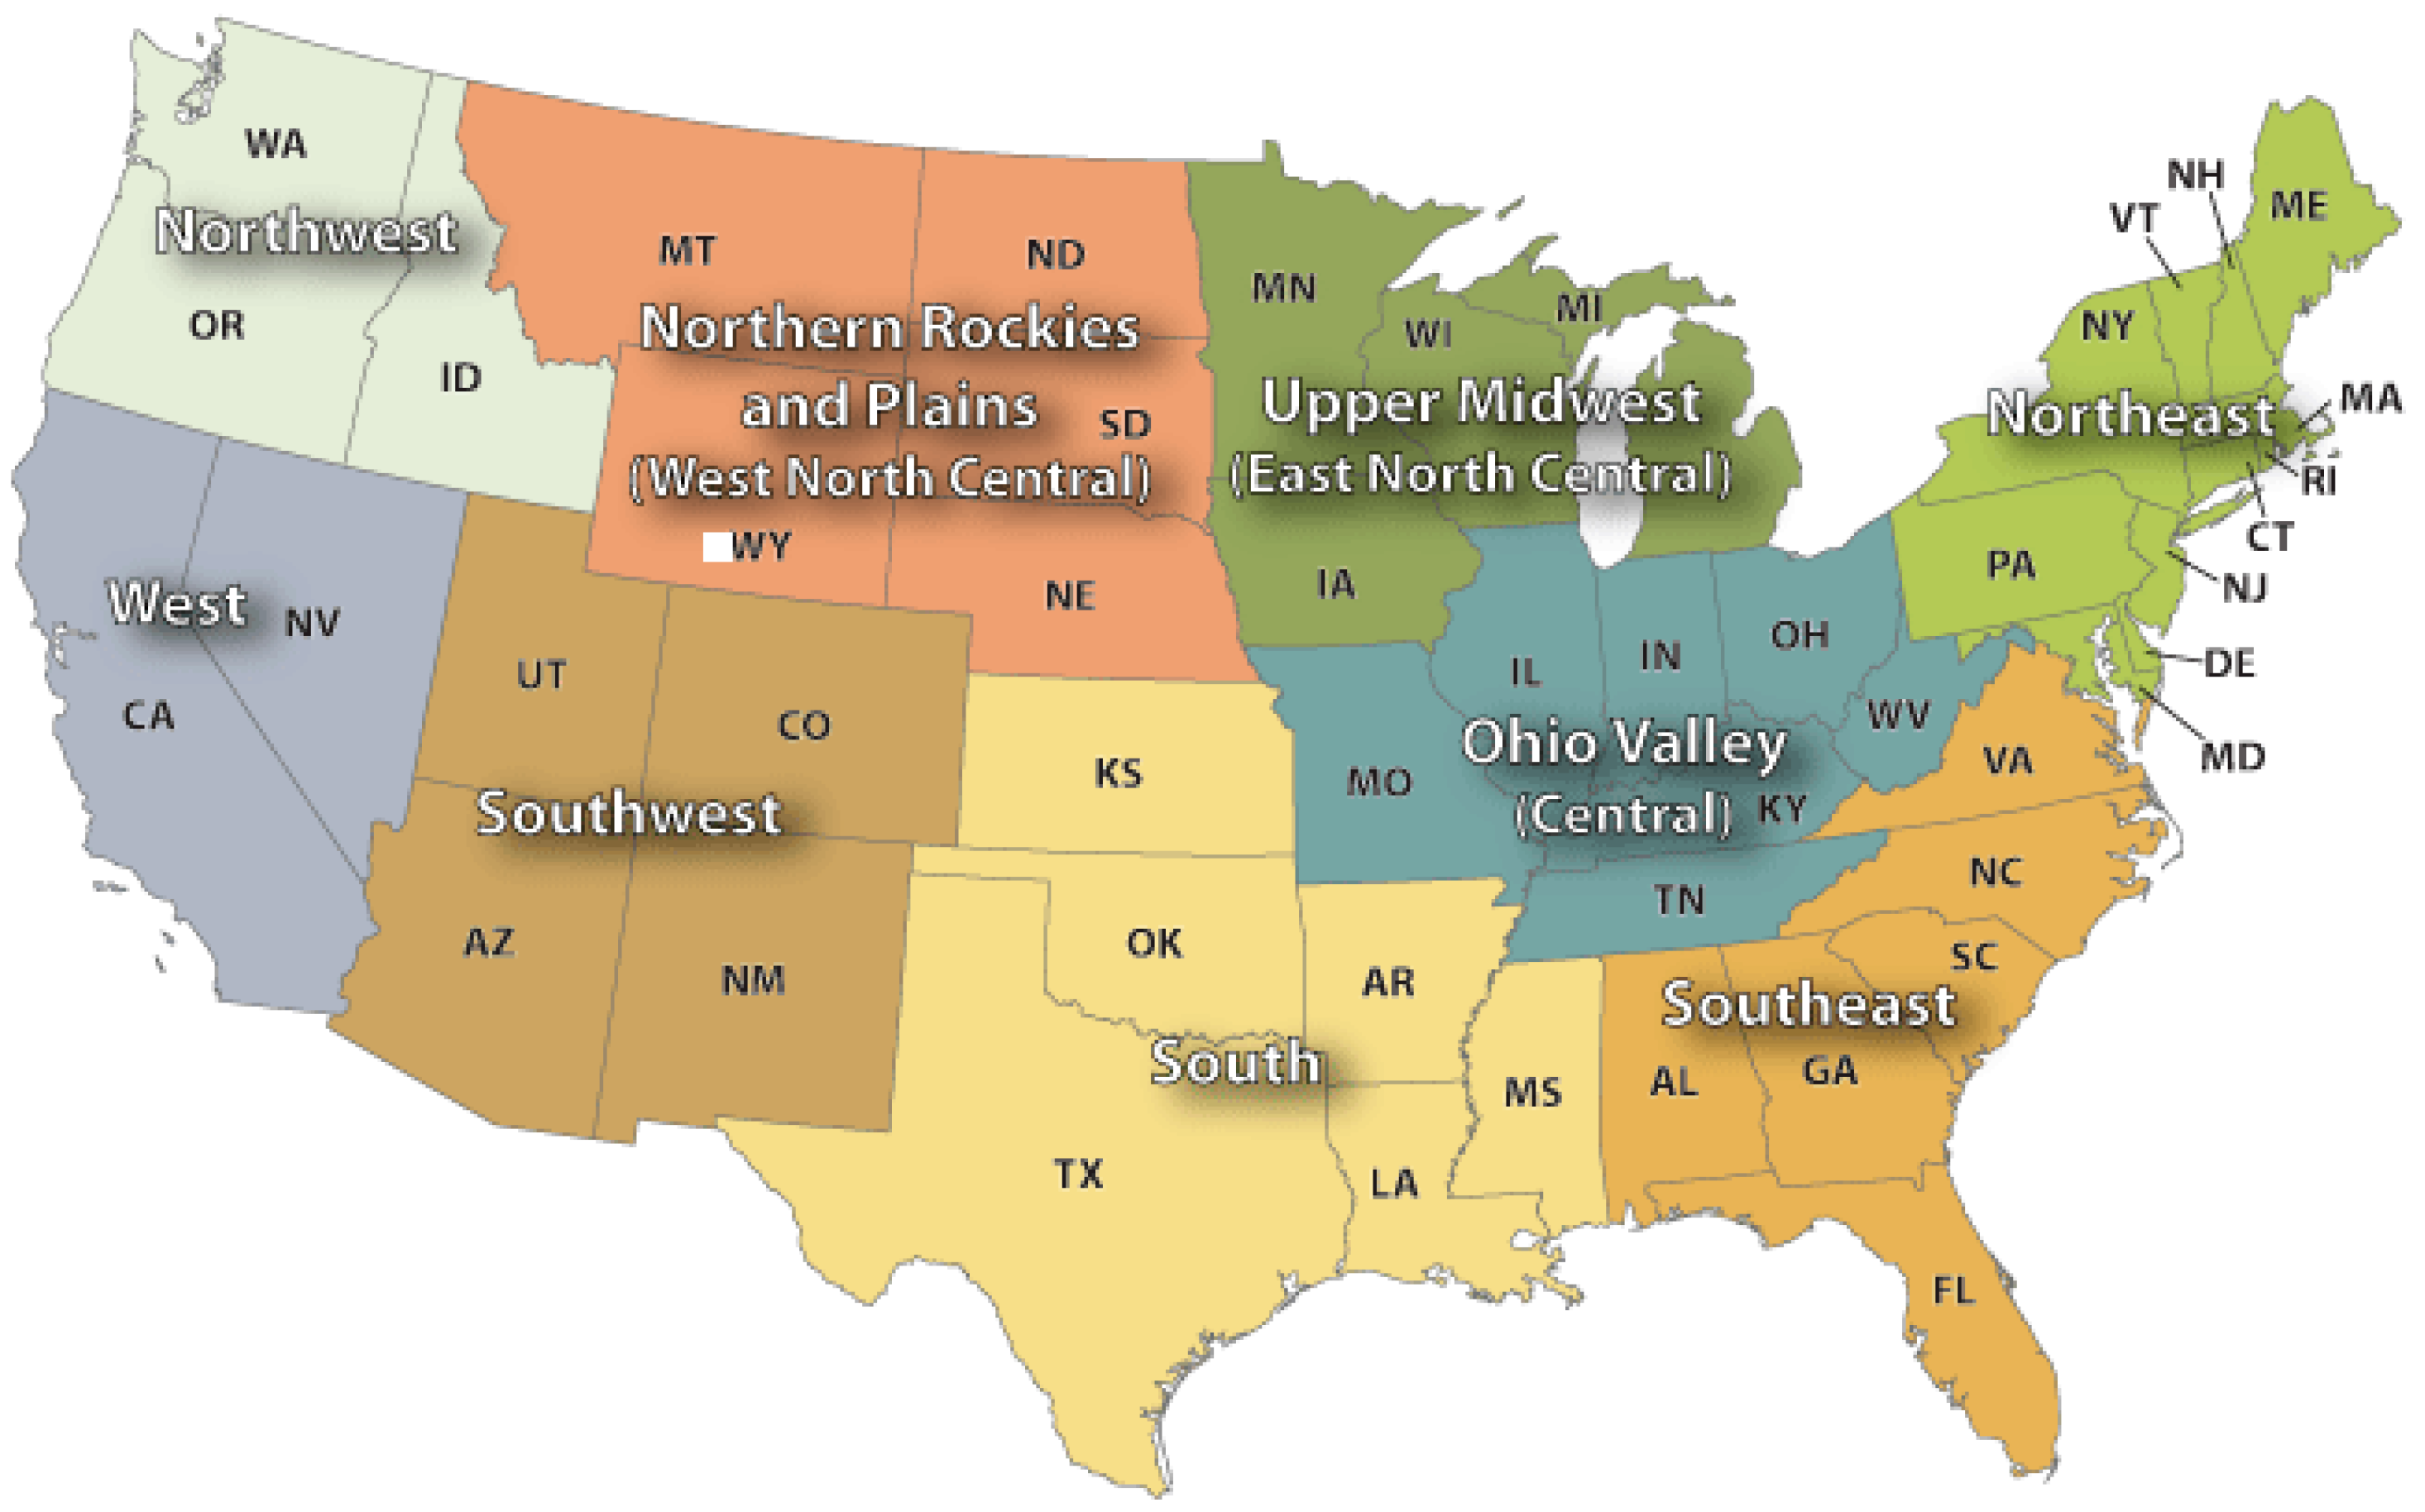
Nine US climate regions (figure after NOAA National Centers for Environmental Information (NCEI)—Asheville) as defined by the National Oceanic and Atmospheric Administration (available online: https://www.ncdc.noaa.gov/monitoring-references/maps/us-climate-regions.php). In the following we use the notation NW for the Northwest, WNC for the West-North-Central, W for West, SW for Southwest, S for South, ENC for East-North-Central, C for Central, SE for Southeast, and NE for the Northeast region.
Figure 1.
Nine US climate regions (figure after NOAA National Centers for Environmental Information (NCEI)—Asheville) as defined by the National Oceanic and Atmospheric Administration (available online: https://www.ncdc.noaa.gov/monitoring-references/maps/us-climate-regions.php). In the following we use the notation NW for the Northwest, WNC for the West-North-Central, W for West, SW for Southwest, S for South, ENC for East-North-Central, C for Central, SE for Southeast, and NE for the Northeast region.

Figure 2.
(a) Boxplots of the eastern US climate regions temperature differences between annual means of 1900–1920 and 1995–2015. (b) Same for the western US climate regions. All temperature differences are statistically significant at 95% confidence level (significance at alpha level of 0.05). The letter designations of the regions follow the names shown in Figure 1. Index 1 or 2 after the letter designation indicates the years 1900–1920 and 1995–2015, respectively.
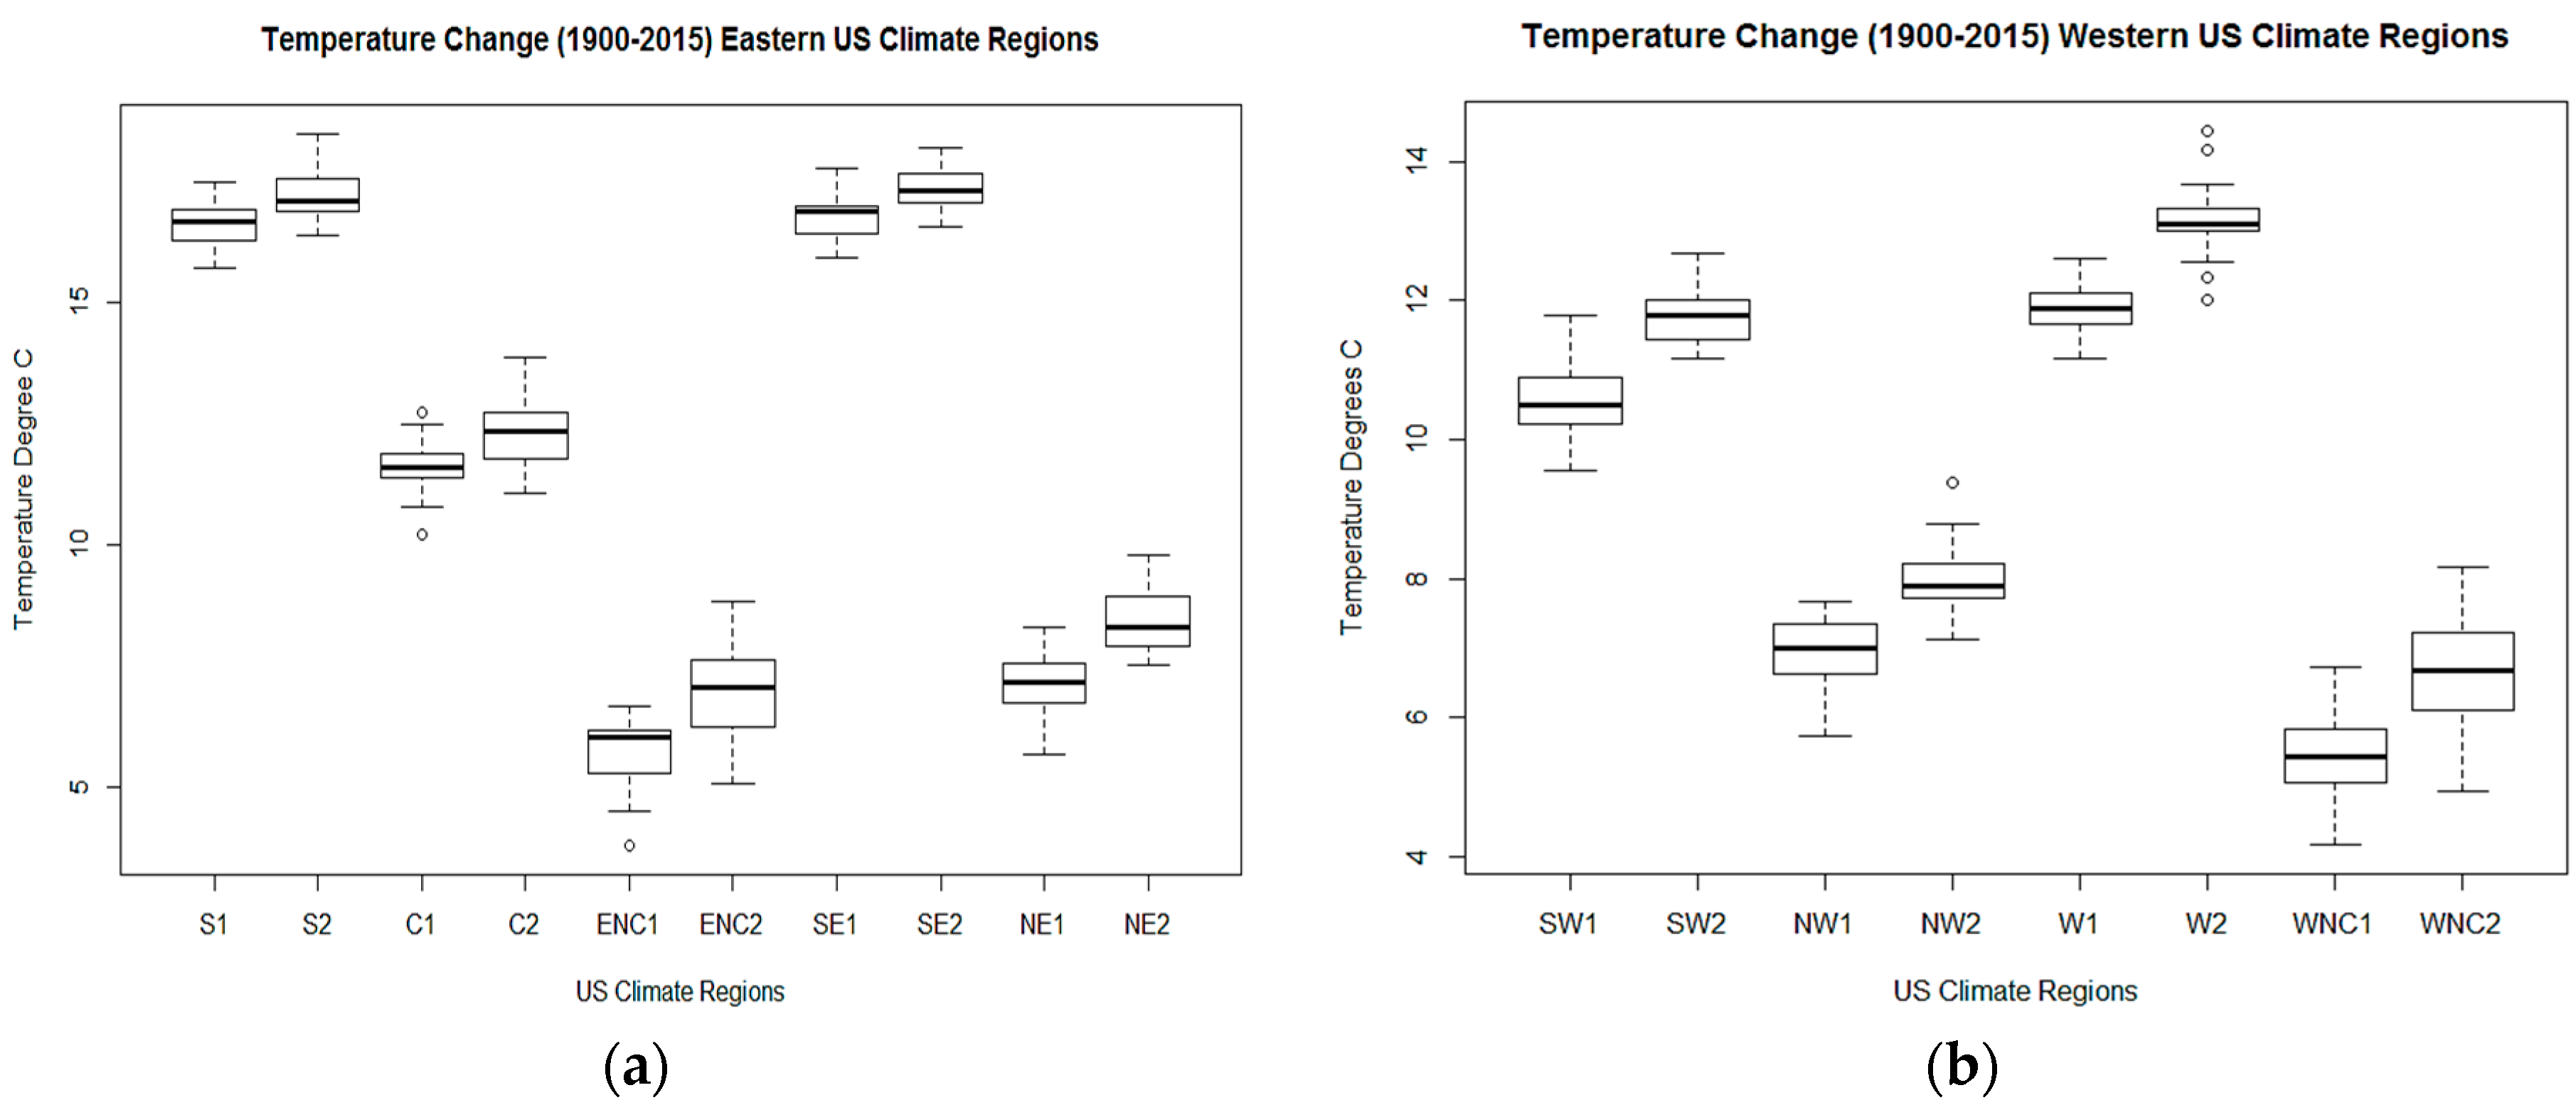
Figure 3.
(a) Boxplots of precipitation changes within the eastern US climate regions. Precipitation increased in all climate regions of the eastern US, but increases in the South and Southeast regions were not statistically significant. (b) In the western US precipitation increased in the Northwest and West-North-Central and decreased in the West and Southwest regions. There is no statistically significant change of precipitation in any region within the western US. We also note a considerable increase in variance between 1900–1920 and 1995–2015, especially in Southeast, Northeast, and Northwest regions.

Figure 4.
A graphical representation of the precipitation changes in the nine US climate regions between the means of years 1900–1920 and 1995–2015. Red arrows indicate statistically significant increases of precipitation, blue arrows indicate increases, but are not statistically significant. Yellow arrows stand for statistically not significant decreases of precipitation.
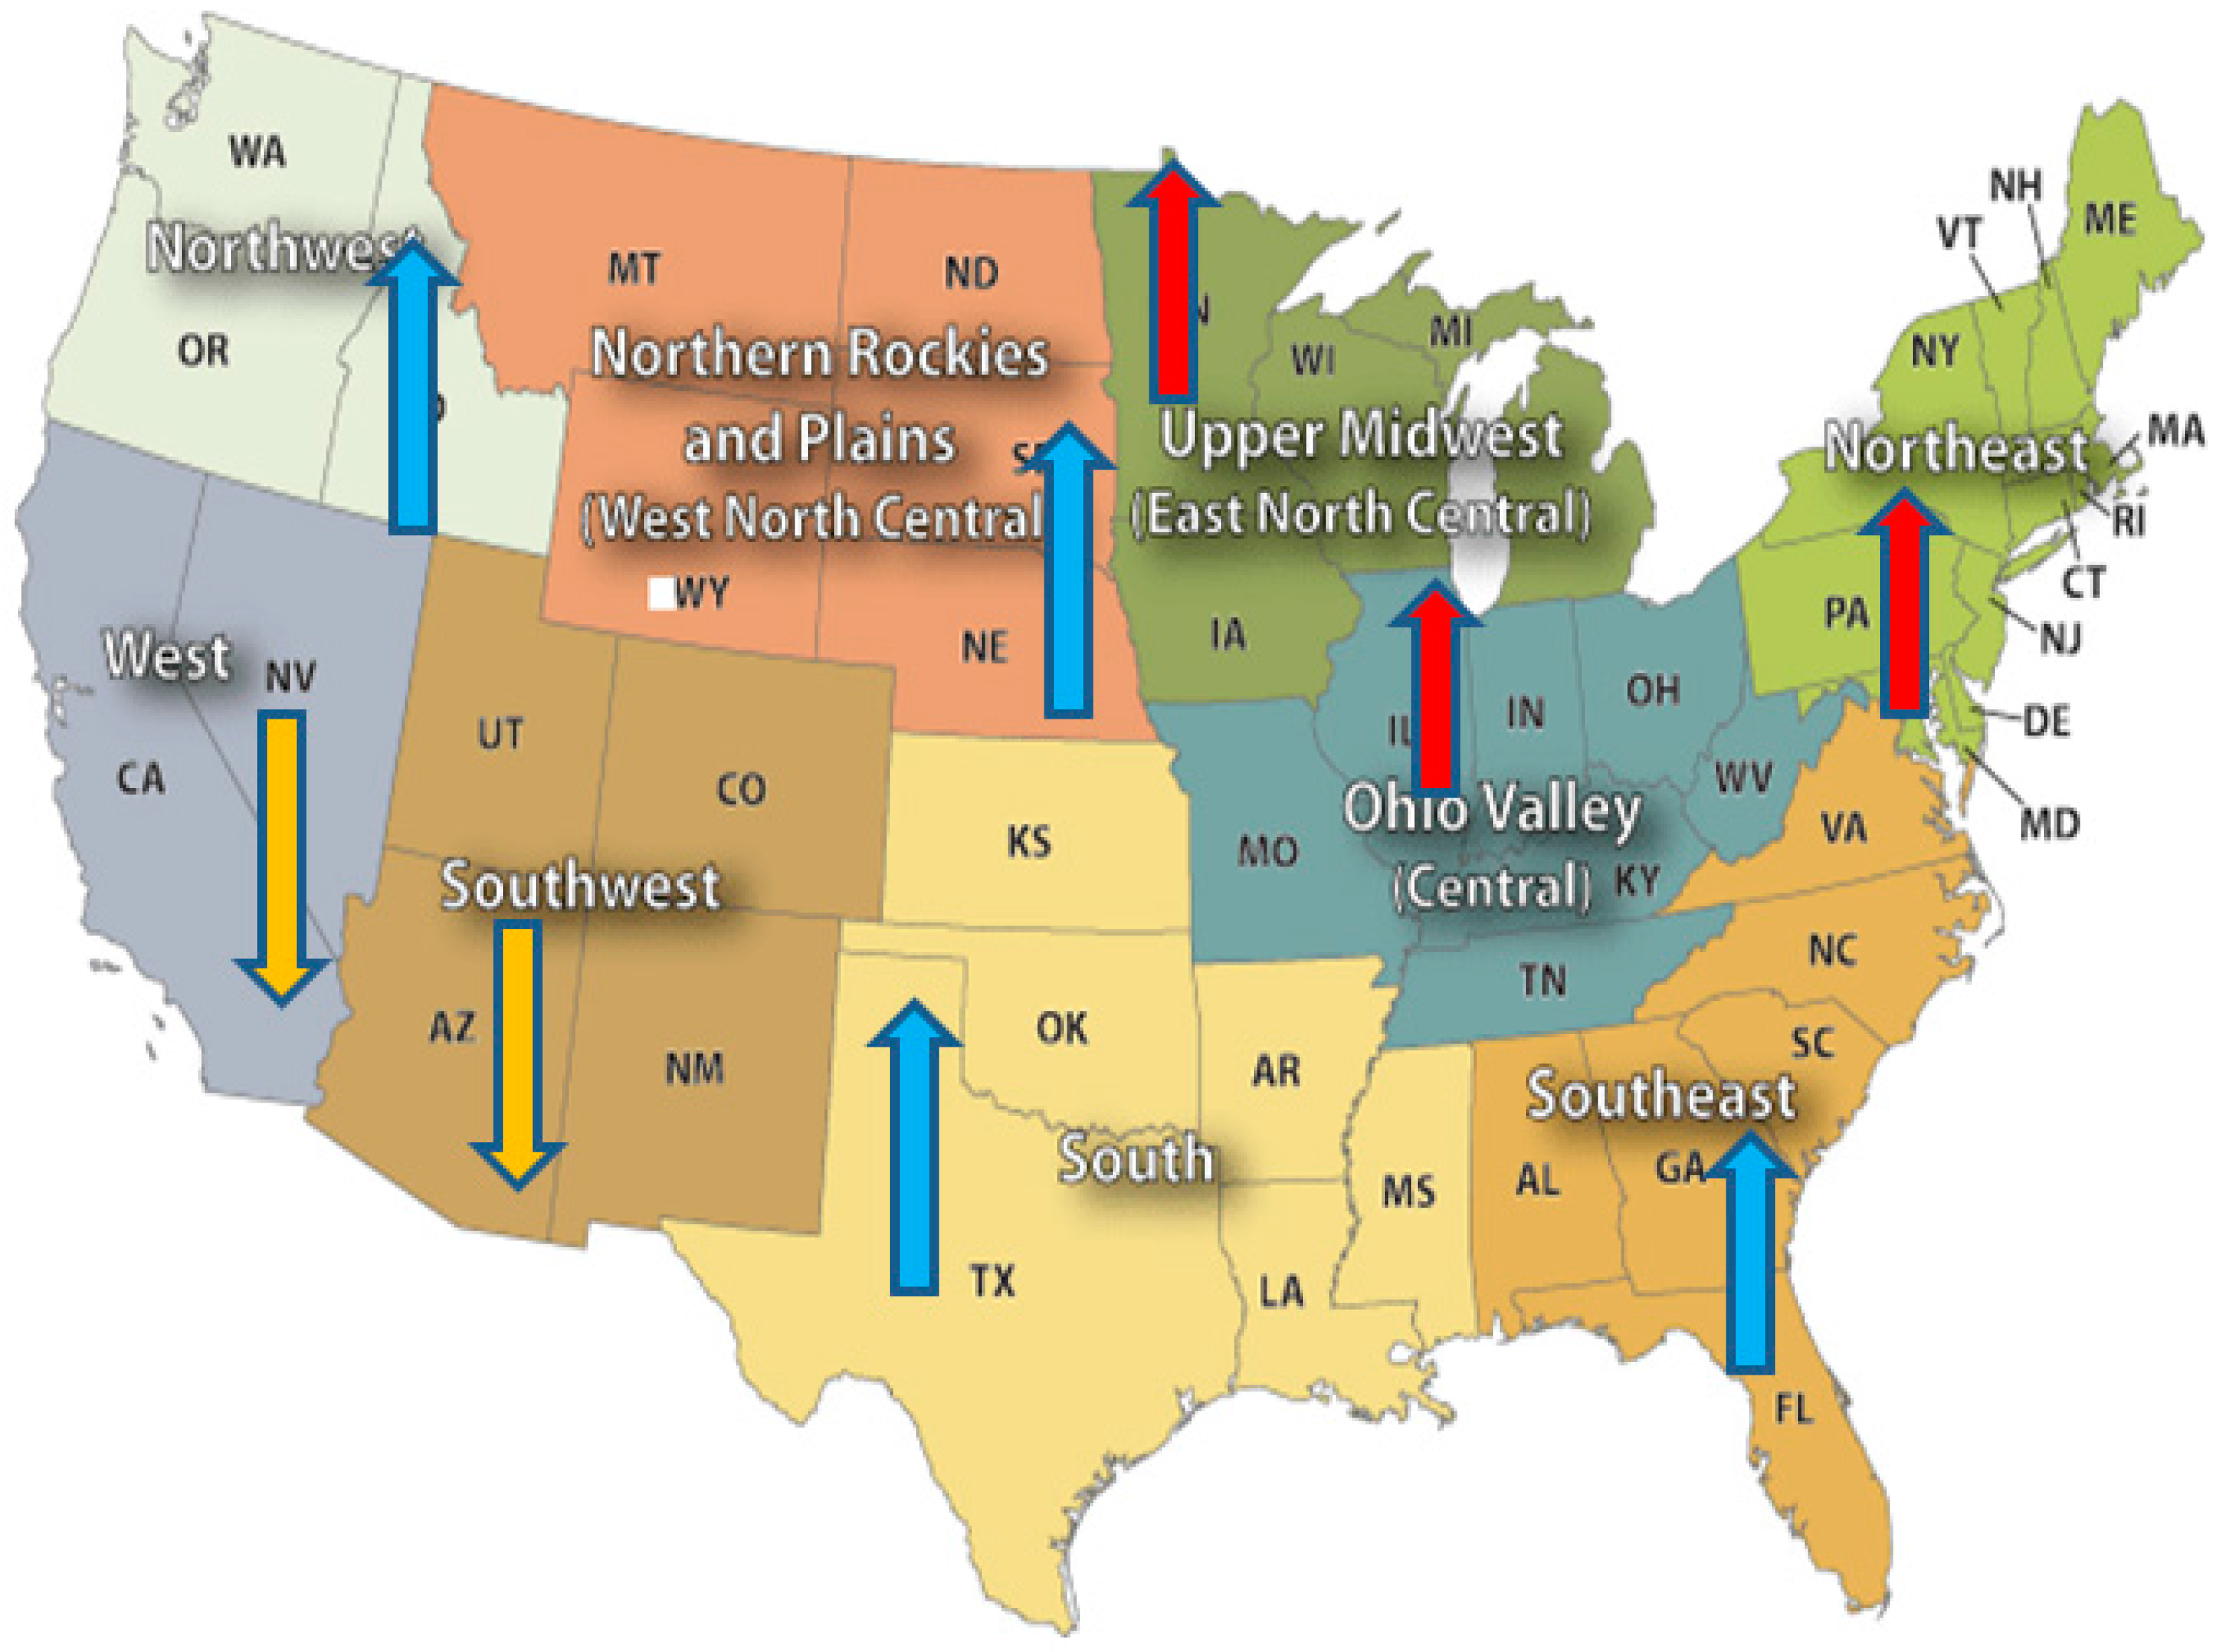
Figure 5.
The observed and CMIP5 simulated mean US temperature (a) and precipitation (b). The observed data (annual in gray and five year moving averages in red and black) are in solid red lines for eastern US and solid black for the western US. The climate model simulations (ensemble mean of CMIP5 models) are in dashed lines. The CMIP5 models do not capture properly the large differences in precipitation between the western and the eastern US.

Figure 6.
Observed and CMIP5 model ensemble mean simulated precipitation (a,b) and temperature (c,d) changes between years 1900–1920 (denoted by the number 1), 1995–2015 (denoted by the number 2), and 2080–2100 projections (denoted by the number 3) in the eastern (a,c) and the western (b,d) US. The observations are denoted W1US, W2US, E1US, and E2US, while models simulations are indicated by the CMIP5 after region (E or W) and the indicated time span (1, 2, or 3).
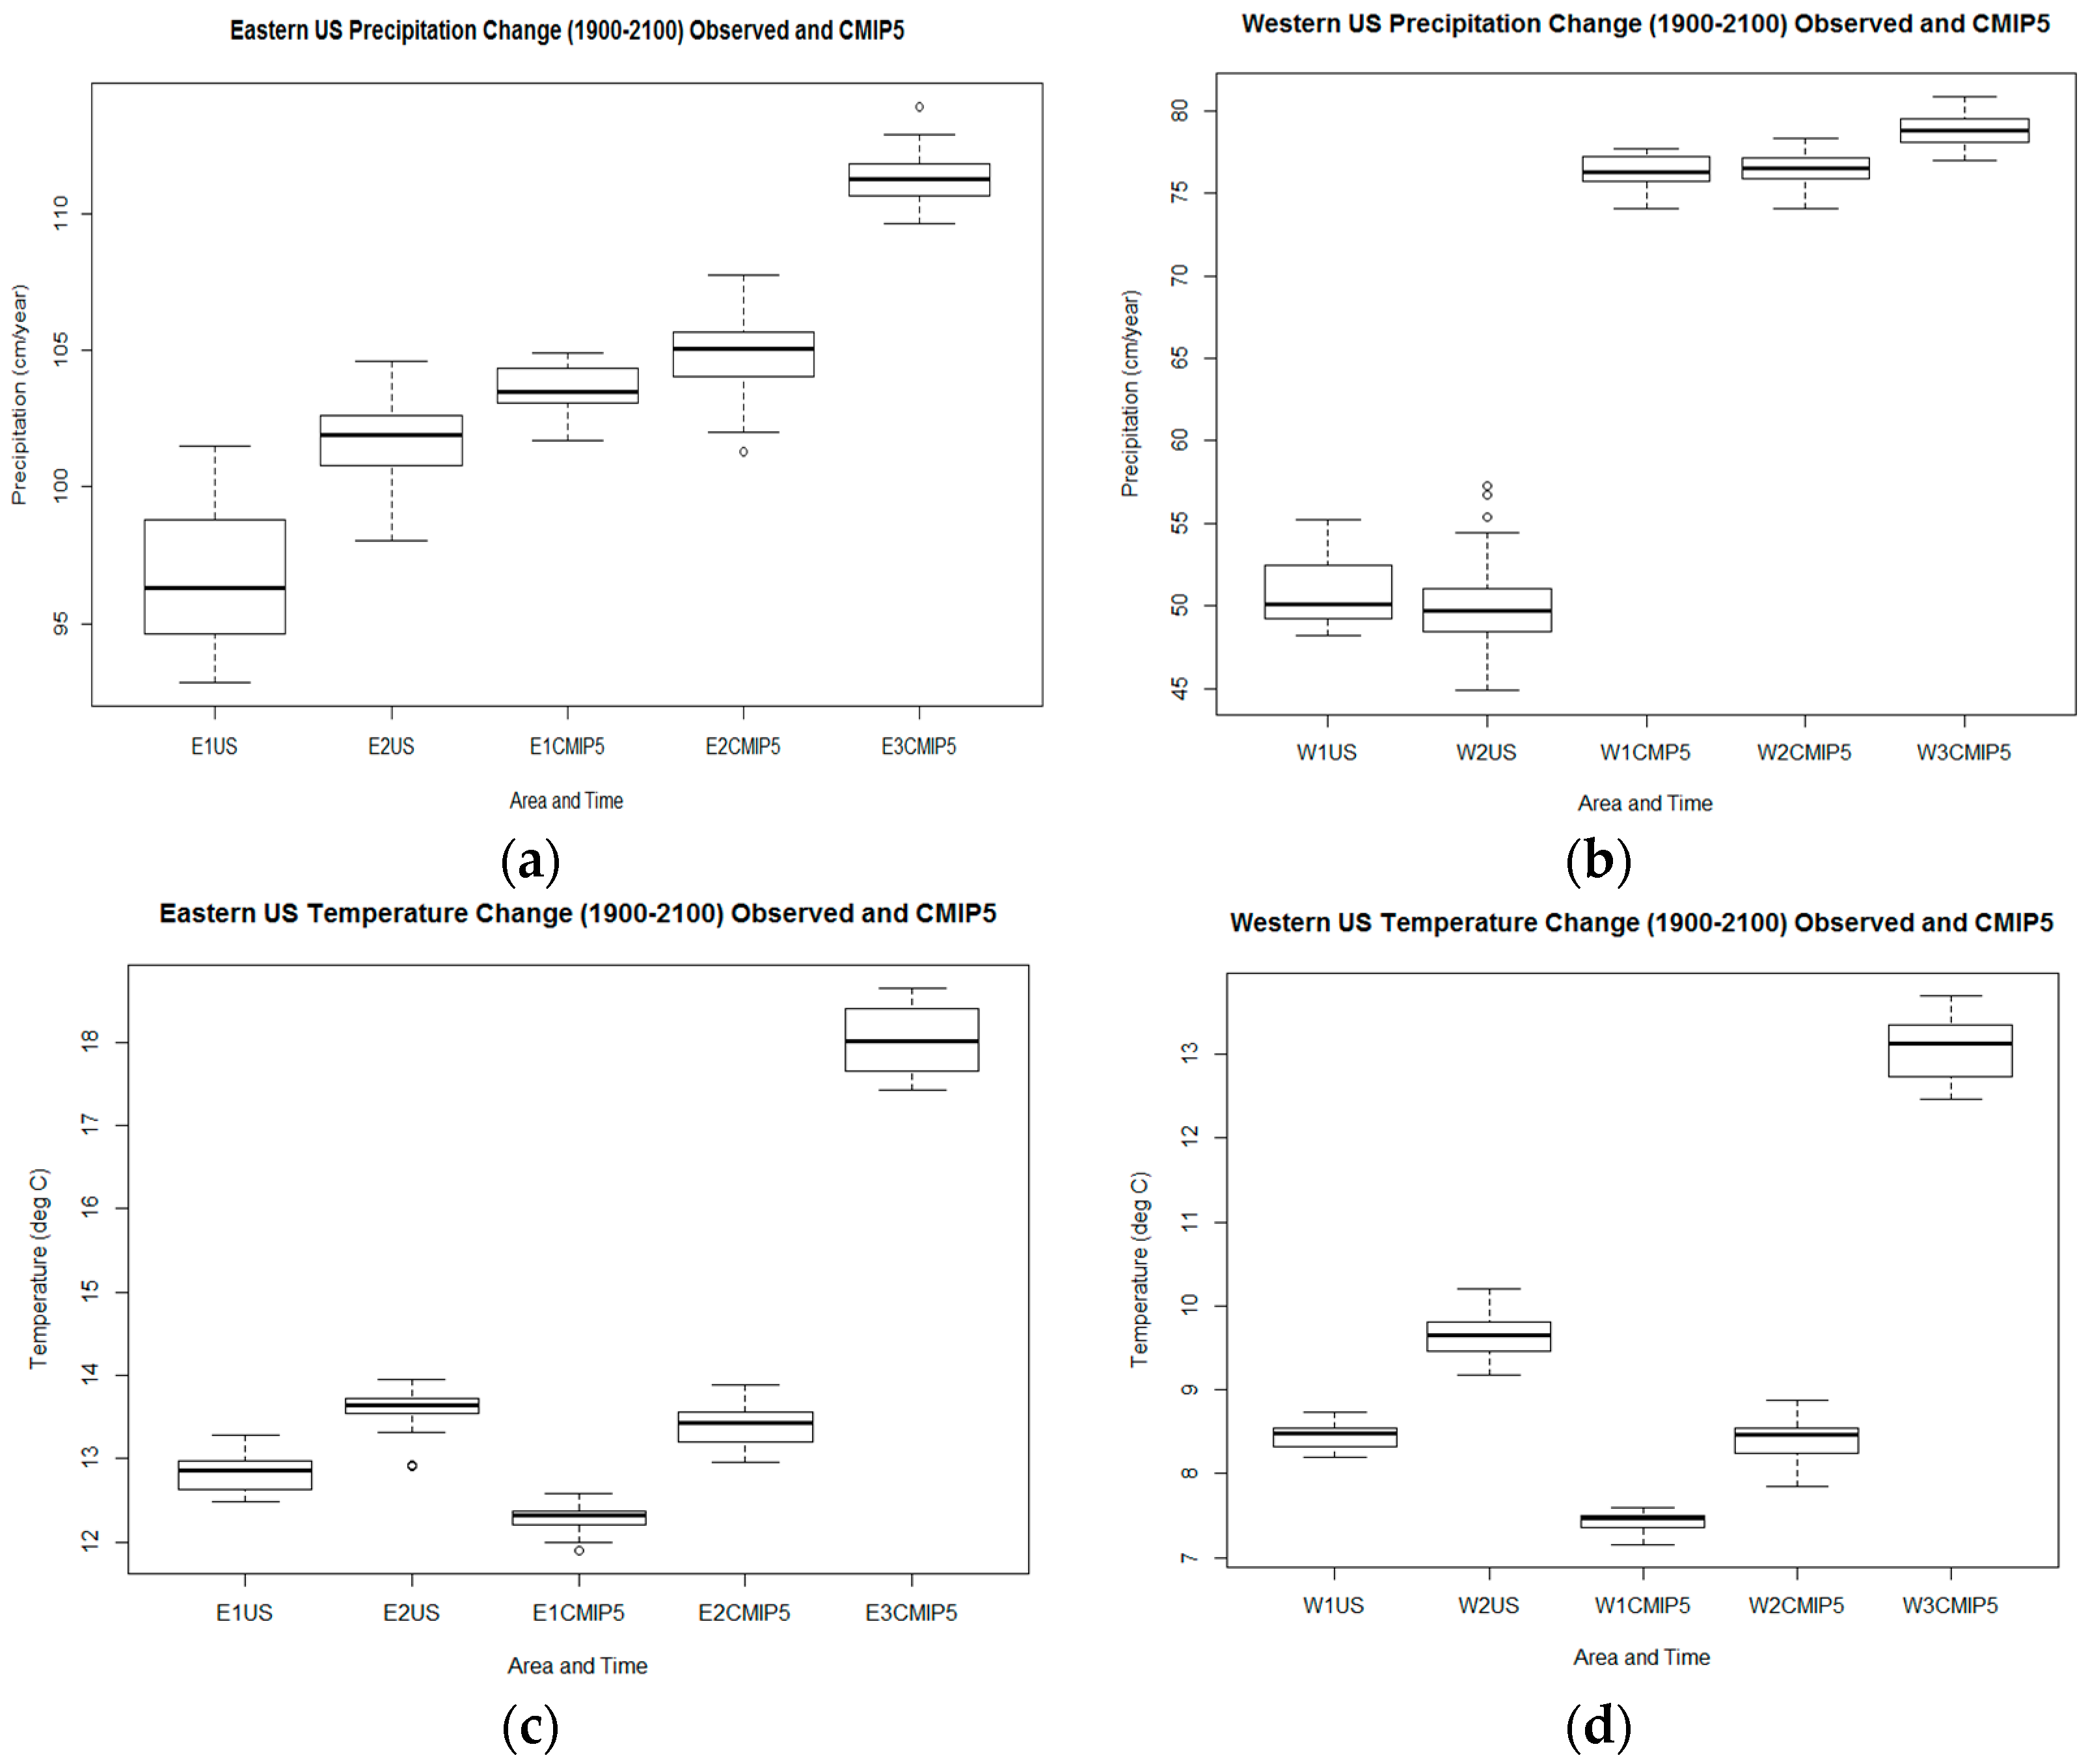
Figure 7.
Regression model simulations of (a) the US Southwest precipitation, and (b) the eastern US precipitation. The observed precipitation (SW and E_USA) are in red, the regression model (SW_Reg and E_Reg) in black.
Figure 7.
Regression model simulations of (a) the US Southwest precipitation, and (b) the eastern US precipitation. The observed precipitation (SW and E_USA) are in red, the regression model (SW_Reg and E_Reg) in black.


Table 1.
Temperature changes for the period 1900–2015 in individual USA climate regions. The labels 1900–1920 and 1995–2015 stand for the mean of annual temperatures within the given time periods. ∆T (°C) is then the difference between the 1995–2015 and 1900–1920 means. The trends are in °C/decade. The p-value is the probability that the means for 1900–1920 and 1995–2015 are equal. All temperatures are in °C. The letter designation of the climate regions follow the convention introduced in Figure 1.
| Temp (°C) | SW | NW | W | WNC | S | C | ENC | SE | NE |
|---|---|---|---|---|---|---|---|---|---|
| 1900–1920 | 10.54 | 6.92 | 11.90 | 5.44 | 16.59 | 11.67 | 5.71 | 16.78 | 7.07 |
| 1995–2015 | 11.77 | 7.98 | 13.16 | 6.67 | 17.26 | 12.33 | 6.95 | 17.36 | 8.39 |
| ∆T (°C) | 1.22 | 1.07 | 1.26 | 1.22 | 0.67 | 0.66 | 1.24 | 0.58 | 1.33 |
| Trend (°C/dec) | 0.104 | 0.097 | 0.113 | 0.107 | 0.037 | 0.040 | 0.105 | 0.036 | 0.116 |
| p-value | <0.05 | <0.05 | <0.05 | <0.05 | <0.05 | <0.05 | <0.05 | <0.05 | <0.05 |
Table 2.
Precipitation changes for 1900–2015 in individual USA climate regions. Notation is the same as in Table 1, but for precipitation. The change in precipitation is also given as the percent increase from the mean of 1900–1920, and the ratio ∆P/∆T, in %/°C, is calculated. Trends are in cm/year per decade.
| Prec (cm/year) | SW | NW | W | WNC | S | C | ENC | SE | NE |
|---|---|---|---|---|---|---|---|---|---|
| 1900–1920 | 37.97 | 81.45 | 45.50 | 48.00 | 86.84 | 105.38 | 75.08 | 127.78 | 105.73 |
| 1995–2015 | 35.93 | 83.63 | 43.95 | 49.23 | 90.88 | 114.13 | 80.58 | 127.91 | 115.97 |
| ∆P (cm/year) | −2.05 | 2.19 | −1.56 | 1.23 | 4.04 | 8.75 | 5.50 | 0.13 | 10.24 |
| ∆P (%) | −5.39 | 2.68 | −3.42 | 2.57 | 4.65 | 8.30 | 7.32 | 0.10 | 9.68 |
| Trend | −0.04 | 0.32 | −0.07 | 0.19 | 0.64 | 0.90 | 0.81 | 0.17 | 1.07 |
| p-value | 0.27 | 0.52 | 0.67 | 0.49 | 0.33 | <0.05 | <0.05 | 0.97 | <0.05 |
| ∆P (%)/∆T (°C) | −4.40 | 2.51 | −2.72 | 2.10 | 6.90 | 12.55 | 5.90 | 0.18 | 7.29 |
Table 3.
The observed temperature (T) and precipitation (P) changes in the eastern (EUS), the western (WUS) section of the USA, and the whole 48 US states (US). Precipitation changes in the western part of US are not statistically significant.
Table 3.
The observed temperature (T) and precipitation (P) changes in the eastern (EUS), the western (WUS) section of the USA, and the whole 48 US states (US). Precipitation changes in the western part of US are not statistically significant.
| Temp (°C) | T-WUS | T-EUS | T-US | Precip (cm/year) | P-WUS | P-EUS | P-US |
|---|---|---|---|---|---|---|---|
| 1900-20 | 8.45 | 12.83 | 10.81 | 1900-20 | 50.65 | 96.76 | 75.78 |
| 1995-15 | 9.63 | 13.59 | 11.81 | 1995-15 | 50.27 | 101.67 | 78.47 |
| ∆T (°C) | 1.18 | 0.76 | 1 | ∆P(cm/year) | −0.38 | 4.91 | 2.69 |
| p-value | <0.05 | <0.05 | <0.05 | p-value | 0.92 | <0.05 | 0.12 |
| ∆P (%) | −0.75 | 5.07 | 3.55 | ||||
| ∆P (%)/∆T (°C) | −0.6 | 6.7 | 3.5 |
Table 4.
CMIP5 Climate Models Simulations of the 1900–2015 Temperature and Precipitation in the Eastern and Western USA. T-WUS designates the temperature in the western part of the US; similarly, P-WUS for the precipitation, and a similar notation for the eastern part of the US.
Table 4.
CMIP5 Climate Models Simulations of the 1900–2015 Temperature and Precipitation in the Eastern and Western USA. T-WUS designates the temperature in the western part of the US; similarly, P-WUS for the precipitation, and a similar notation for the eastern part of the US.
| Temp | T-WUS | T-EUS | Precip | P-WUS | P-EUS |
|---|---|---|---|---|---|
| 1900-20 | 7.42 | 12.29 | 1900-20 | 76.31 | 103.47 |
| 1995-15 | 8.41 | 13.42 | 1995-15 | 76.33 | 104.93 |
| ∆T (°C) | 0.99 | 1.13 | ∆P (cm/year) | 0.02 | 1.46 |
| p-value | <0.05 | <0.05 | p-value | 0.75 | <0.05 |
| ∆P (%) | 0.03 | 1.41 | |||
| ∆P (%)/∆T (°C) | 0.03 | 1.25 |
Table 5.
The CMIP5 ensemble mean 2015 to 2100 projection of the western and the eastern US temperature and precipitation under the RCP8.5 scenario. Climate models predict a very similar warming (∆T) and similarly low hydrological climate sensitivities (∆P/∆T) for the western and eastern US, in contradiction to the past observation of very different hydrological sensitivity (Table 3).
| Temp (°C) | T-WUS | T-EUS | Precip (cm/year) | P-WUS | P-EUS |
|---|---|---|---|---|---|
| 2080–2100 | 13.05 | 18.01 | 2080–2100 | 78.79 | 111.32 |
| 1995–2015 | 8.41 | 13.42 | 1995–2015 | 76.33 | 104.93 |
| ∆T (°C) | 4.64 | 4.59 | ∆P (cm/year) | 2.46 | 6.39 |
| p-value | <0.05 | <0.05 | p-value | <0.05 | <0.05 |
| ∆P (%) | 3.2 | 6.1 | |||
| ∆P (%)/∆T (°C) | 0.7 | 1.3 |
Table 6.
Regression models of precipitation and temperature in individual climate regions and for the western and eastern US. The R2 represents the fraction of variance accounted for by the regression model. Only statistically significant predictors are listed for each case.
Table 6.
Regression models of precipitation and temperature in individual climate regions and for the western and eastern US. The R2 represents the fraction of variance accounted for by the regression model. Only statistically significant predictors are listed for each case.
| Precipitation | R2 | GHGA | SOL | VOLC | AMO | PDO | MEI |
|---|---|---|---|---|---|---|---|
| SW | 0.57 | -AMO | PDO | MEI | |||
| W | 0.18 | -VOLC | PDO | ||||
| WNC | 0.16 | GHGA | -AMO | PDO | |||
| NW | 0.11 | SOL | VOLC | MEI | |||
| Western US | 0.15 | -VOLC | PDO | ||||
| S | 0.40 | GHGA | SOL | -AMO | MEI | ||
| ENC | 0.52 | GHGA | -VOLC | ||||
| C | 0.47 | GHGA | VOLC | -AMO | |||
| SE | 0.14 | SOL | -AMO | ||||
| NE | 0.52 | GHGA | -AMO | ||||
| Eastern US | 0.47 | GHGA | SOL | -AMO | MEI | ||
| Temperature | |||||||
| Western US | 0.86 | GHGA | AMO | PDO | |||
| Eastern US | 0.68 | GHGA | -SOL | VOLC | AMO |
© 2017 by the authors. Licensee MDPI, Basel, Switzerland. This article is an open access article distributed under the terms and conditions of the Creative Commons Attribution (CC BY) license (http://creativecommons.org/licenses/by/4.0/).
Share and Cite
MDPI and ACS Style
Chylek, P.; Dubey, M.K.; Hengartner, N.; Klett, J.D. Observed and Projected Precipitation Changes over the Nine US Climate Regions. Atmosphere 2017, 8, 207. https://doi.org/10.3390/atmos8110207
AMA Style
Chylek P, Dubey MK, Hengartner N, Klett JD. Observed and Projected Precipitation Changes over the Nine US Climate Regions. Atmosphere. 2017; 8(11):207. https://doi.org/10.3390/atmos8110207
Chicago/Turabian StyleChylek, Petr, Manvendra K. Dubey, Nicholas Hengartner, and James D. Klett. 2017. "Observed and Projected Precipitation Changes over the Nine US Climate Regions" Atmosphere 8, no. 11: 207. https://doi.org/10.3390/atmos8110207
Note that from the first issue of 2016, this journal uses article numbers instead of page numbers. See further details here.