Impact of Biomass Home Heating, Cooking Styles, and Bread Toasting on the Indoor Air Quality at Portuguese Dwellings: A Case Study

 ,
, 

Abstract
:1. Introduction
2. Experiments
2.1. Selection of the Studied Conditions
- (1)
- 57% of the participants sleep with the bedroom door closed;
- (2)
- 8% of the participants stated that someone smokes indoors;
- (3)
- 92% use the toaster daily and 60% use scented products at home;
- (4)
- 63% stated that they spend between 8 h and 13 h at home (with only 16% stating that spend less than 8 h at home);
- (5)
- 76% usually open the windows between six to seven times per week;
- (6)
- 71% of owners clean the house once a week while the remaining do it more often;
- (7)
- Grilled (38%), fried (35%), boiled (13%), stewed (8%), and roasted (5%) meals represent the most frequent cooking styles;
- (8)
- The most commonly used energy sources to cook are natural gas (37%), bottled propane gas (23%), electricity (19%), and others (22%).
- (9)
- The four main heating systems in detached houses are open fireplace (37%), which is followed by air conditioning (29%), fireplace insert (28%), and oil heater (26%) while, in apartments, the main heating systems are oil heaters (28%), air conditioning (17%), fireplace insert (12%), and open fireplaces (10%).
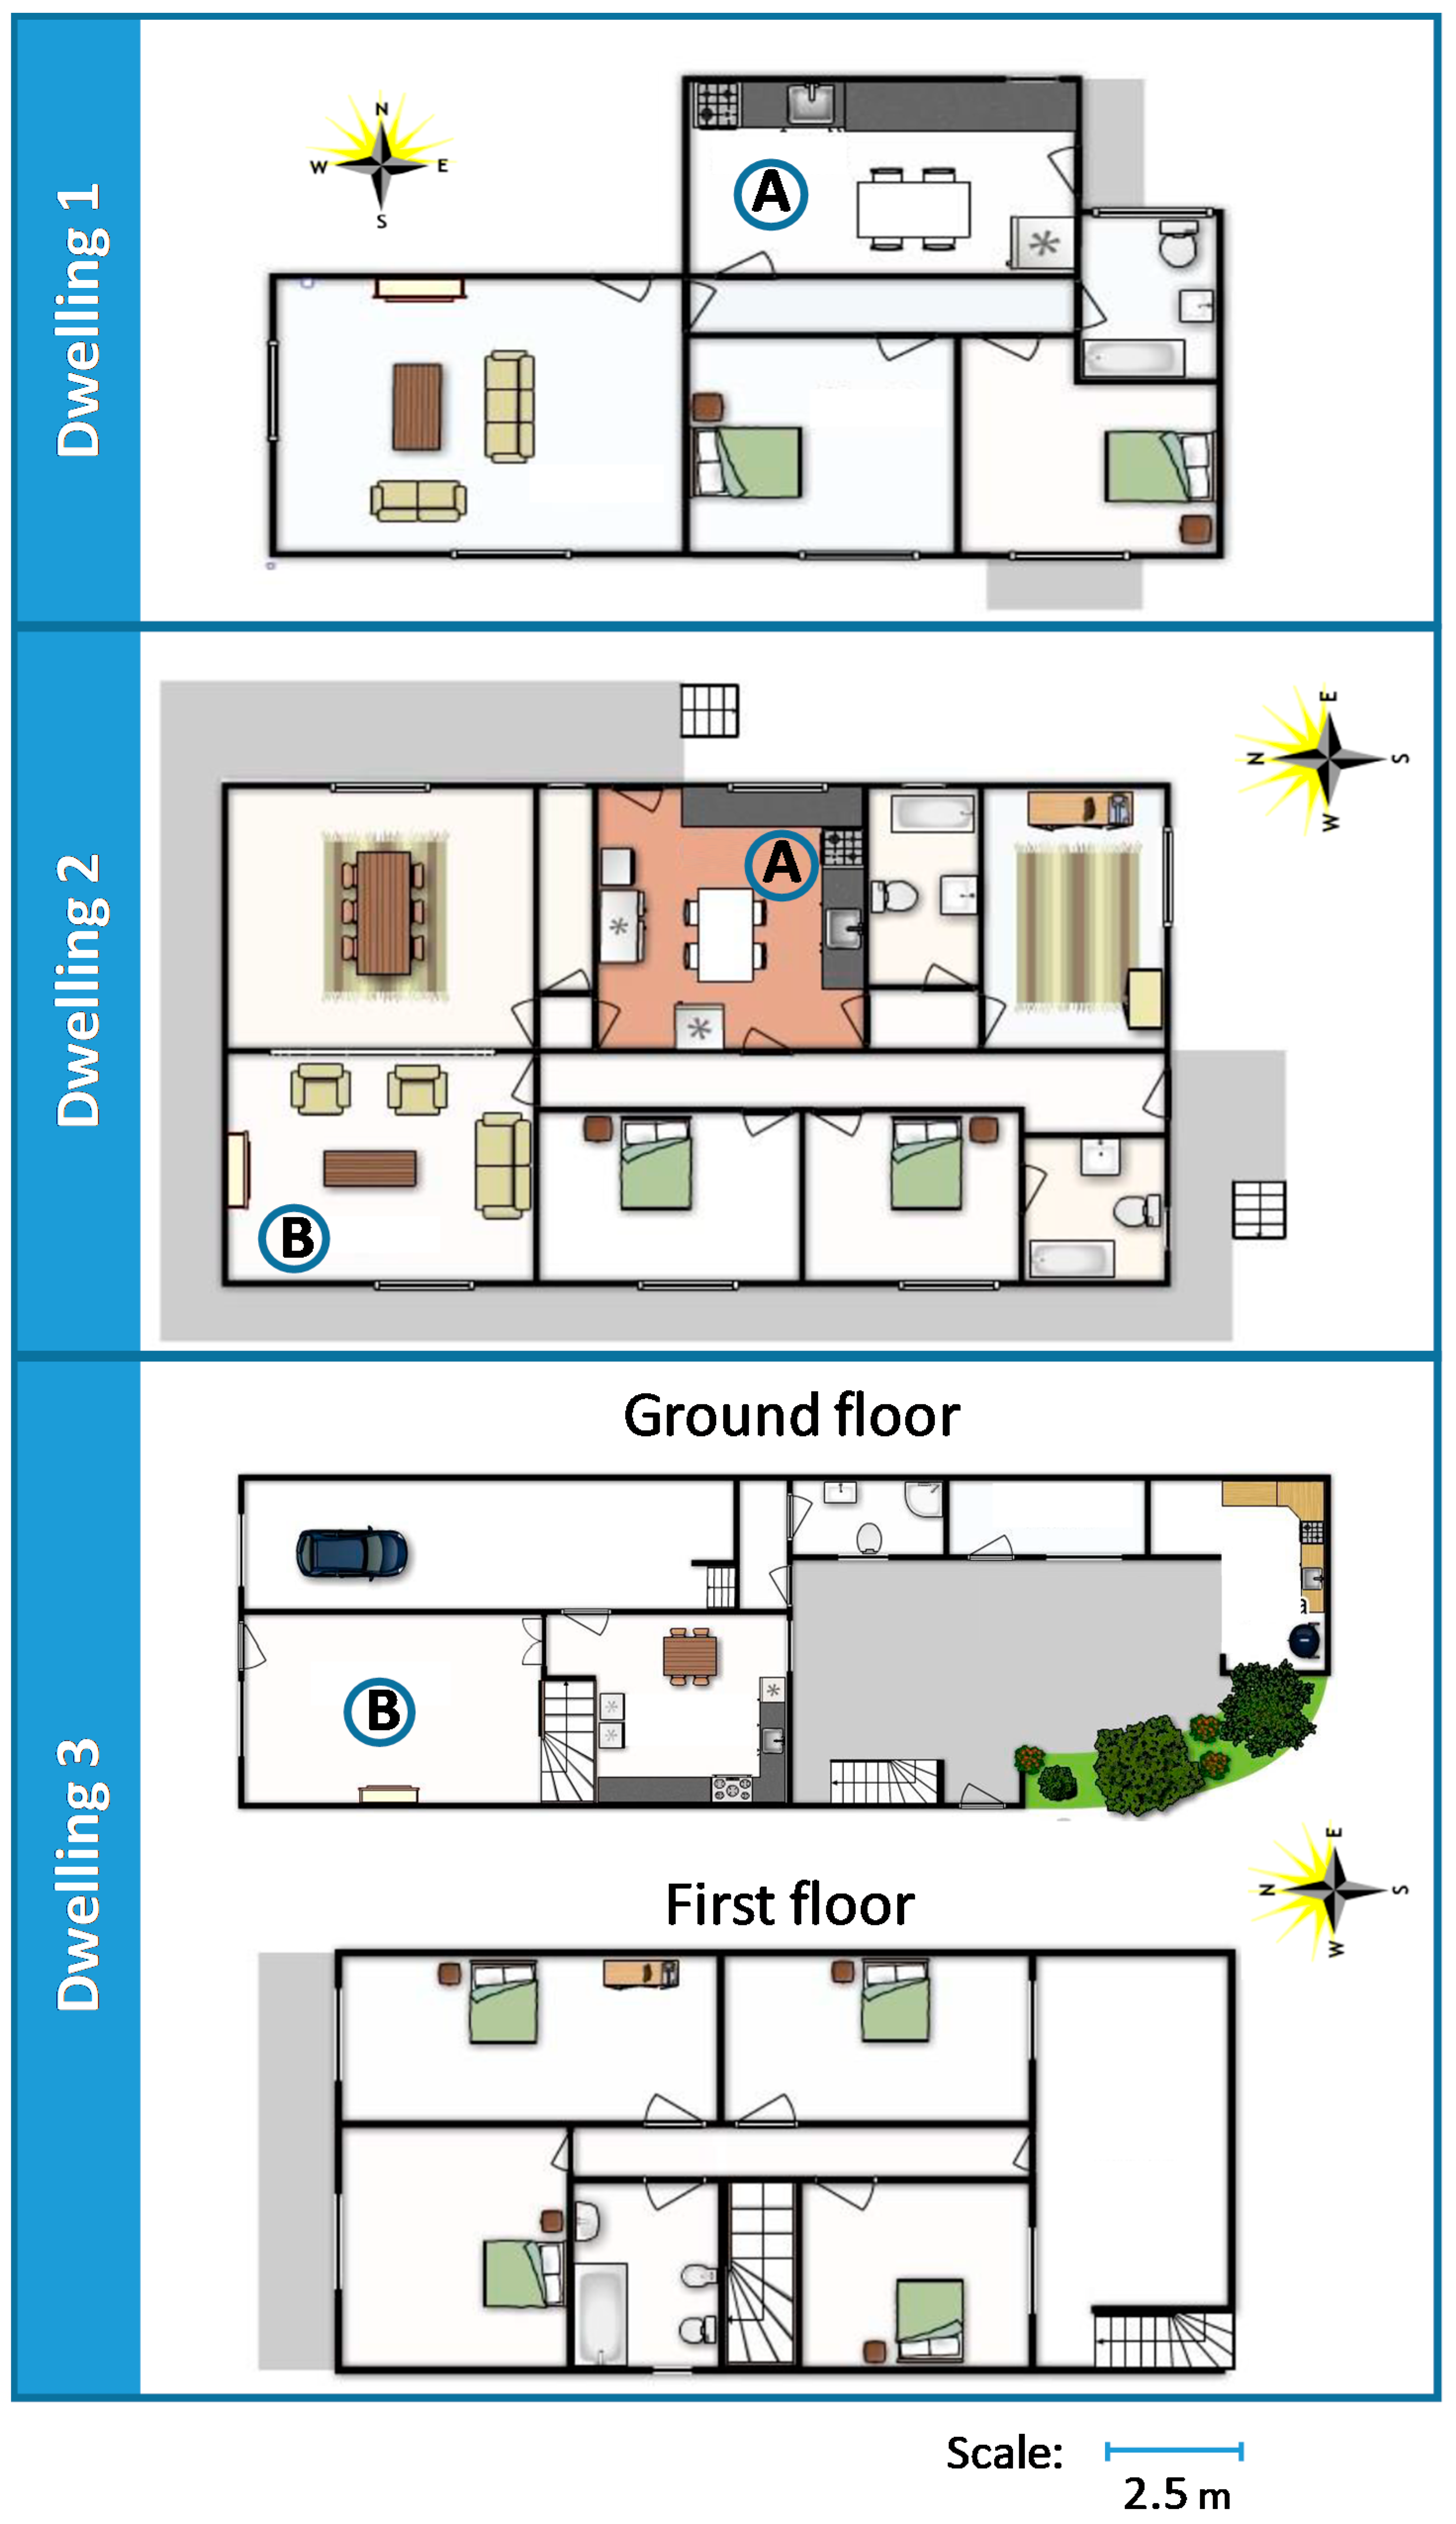
2.2. Study Site
Characterization of the Monitored Rooms
2.3. Domestic Activities
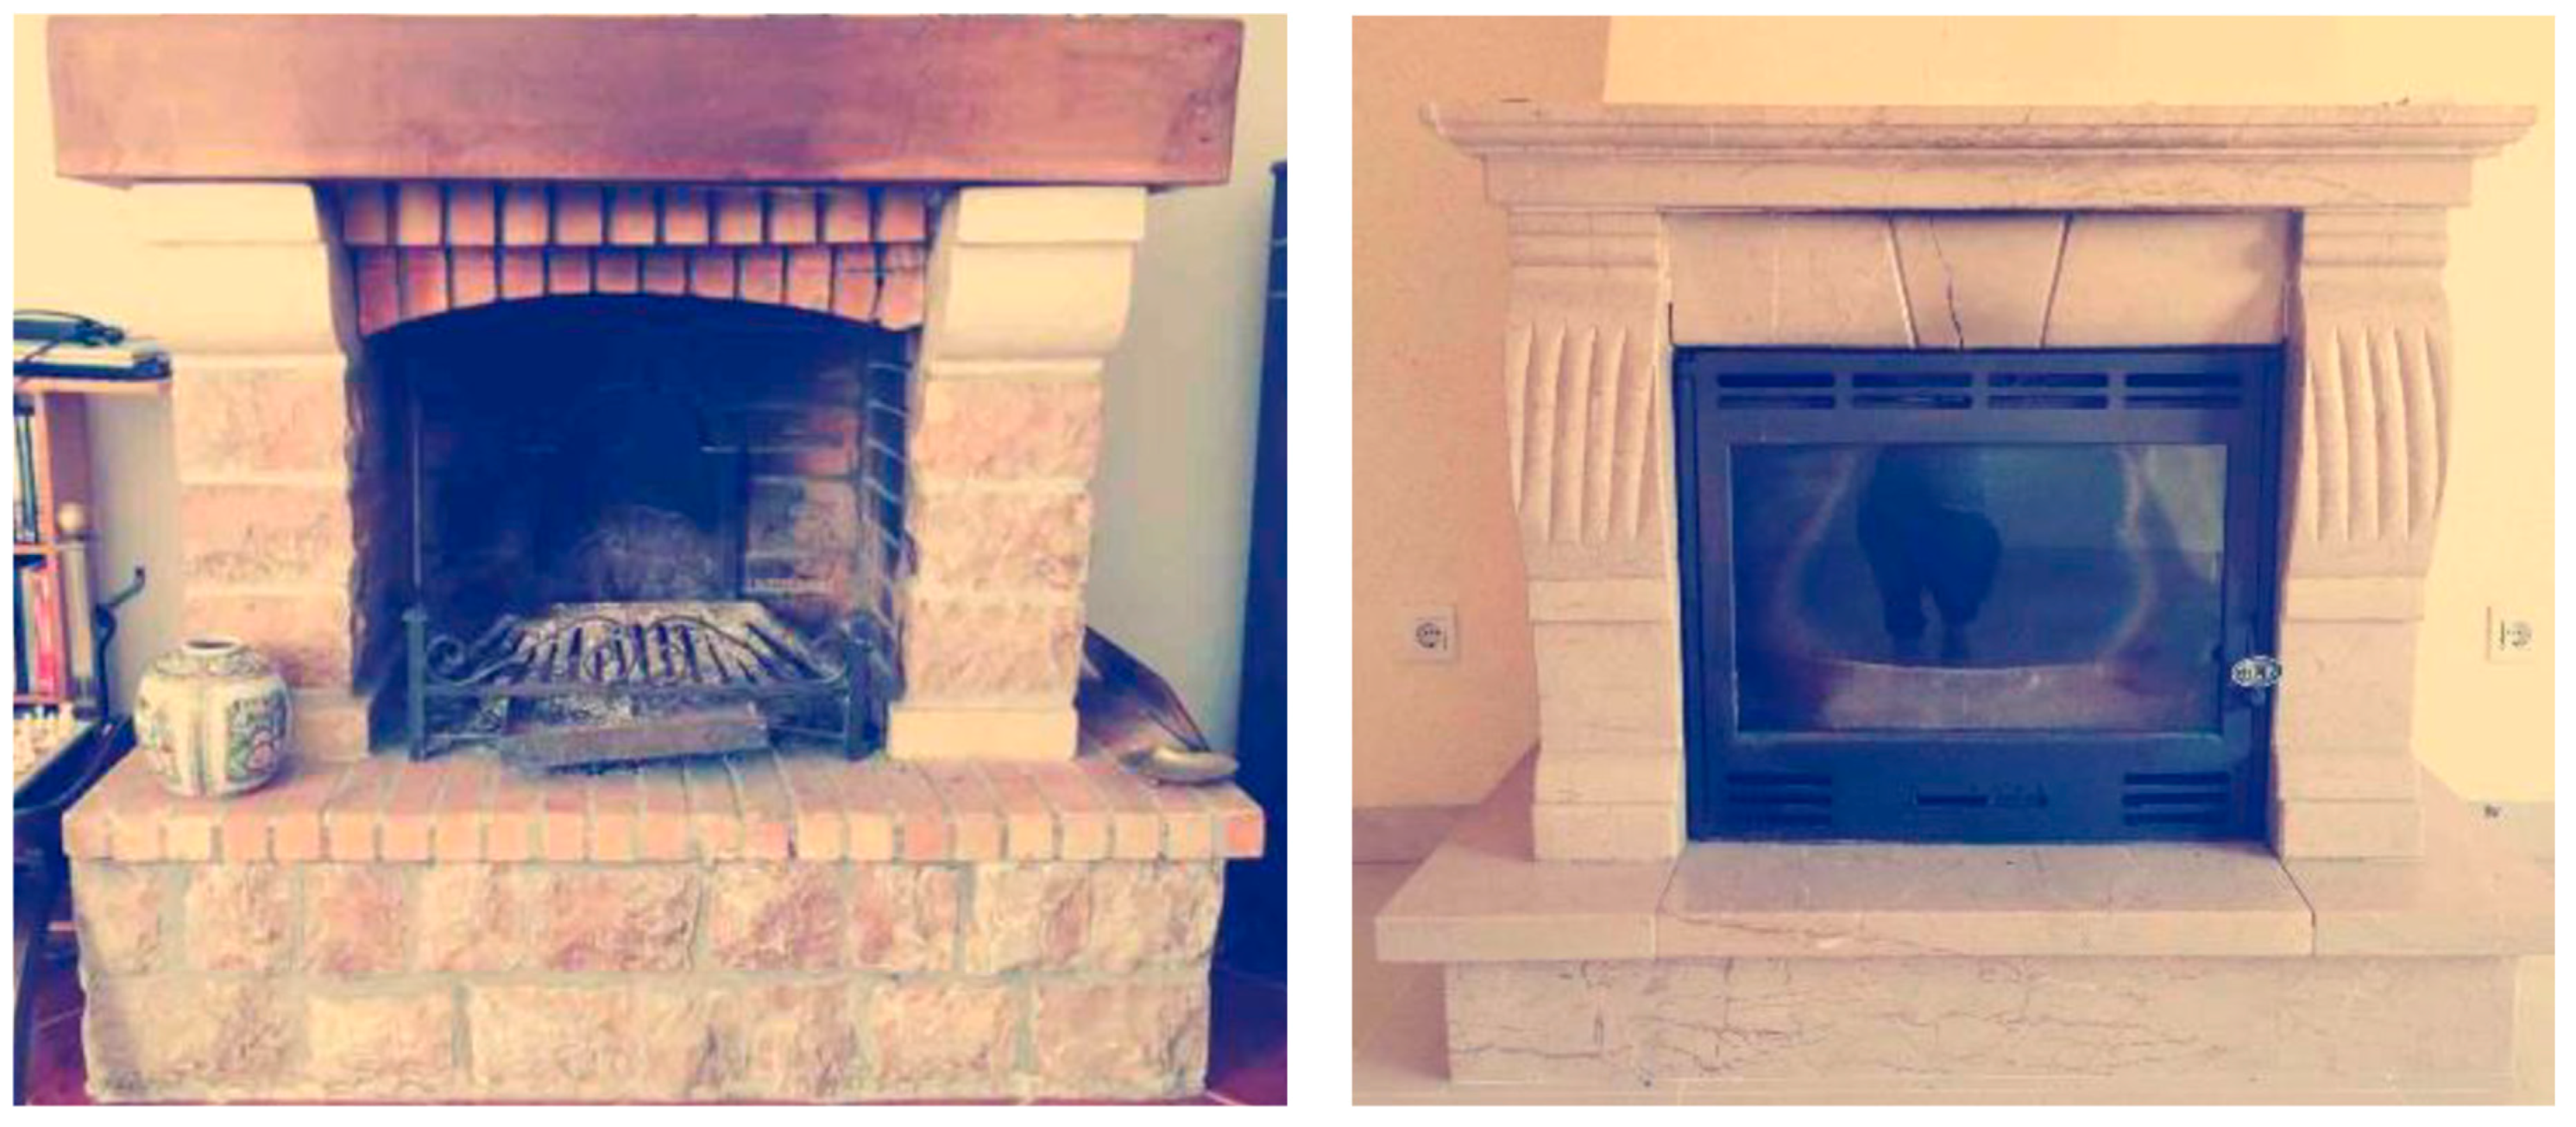
2.3.1. Biomass Burning Emissions
2.3.2. Cooking Emissions
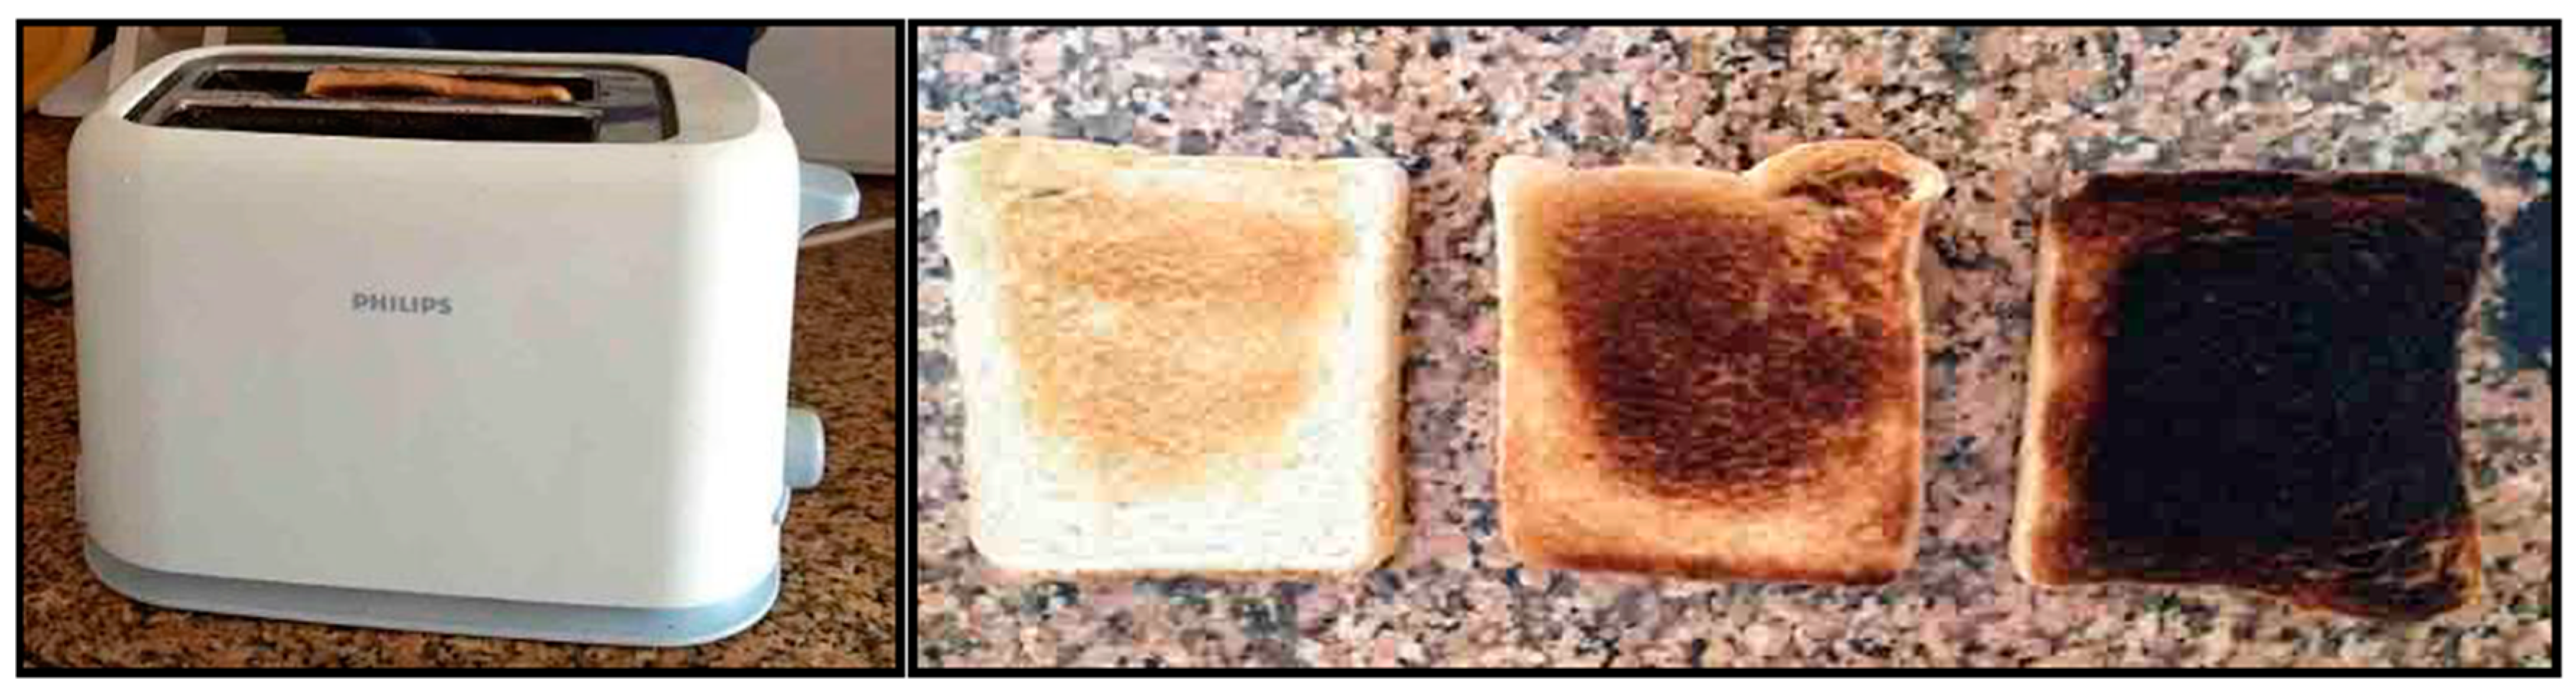
2.3.3. Emissions from Toasting
2.4. Indoor Air Quality Monitoring
- Graywolf (IQ-610 probe, WolfSense Solutions, Shelton, CT, USA) to measure CO2 (measuring range: 0 to 5000 ppm, accuracy: ±3% of reading +50 ppm), total volatile organic compounds—VOCs (measuring range: 5 to 20,000 ppb, resolution of 1 ppb), CO (measuring range: 0 to 500 ppm, accuracy: ±2 ppm < 50 ppm, ±3% reading > 50 ppm), temperature (measuring range: −25 °C to 70 °C, accuracy: ±0.3 °C) and relative humidity—RH (range: 0 to 100%, accuracy: ±2% < 80 %, ±3% > 80%);
- Formaldemeter (htV-M, PPM Technology, Wales, UK) to measure formaldehyde—CH2O (measuring range: 0–10 ppm, accuracy: 10% at 2 ppm);
- DustTrak monitor (8530 model, TSI, Shoreview, MN, USA) to measure PM10, PM2.5, and PM1 (measuring range: 0.001 mg·m−3 to 400 mg·m−3, resolution of ±0.1% for readings of 0.001 mg·m−3).
2.5. Statistical Analysis
3. Results and Discussion
3.1. Fireplaces and Biofuel Type
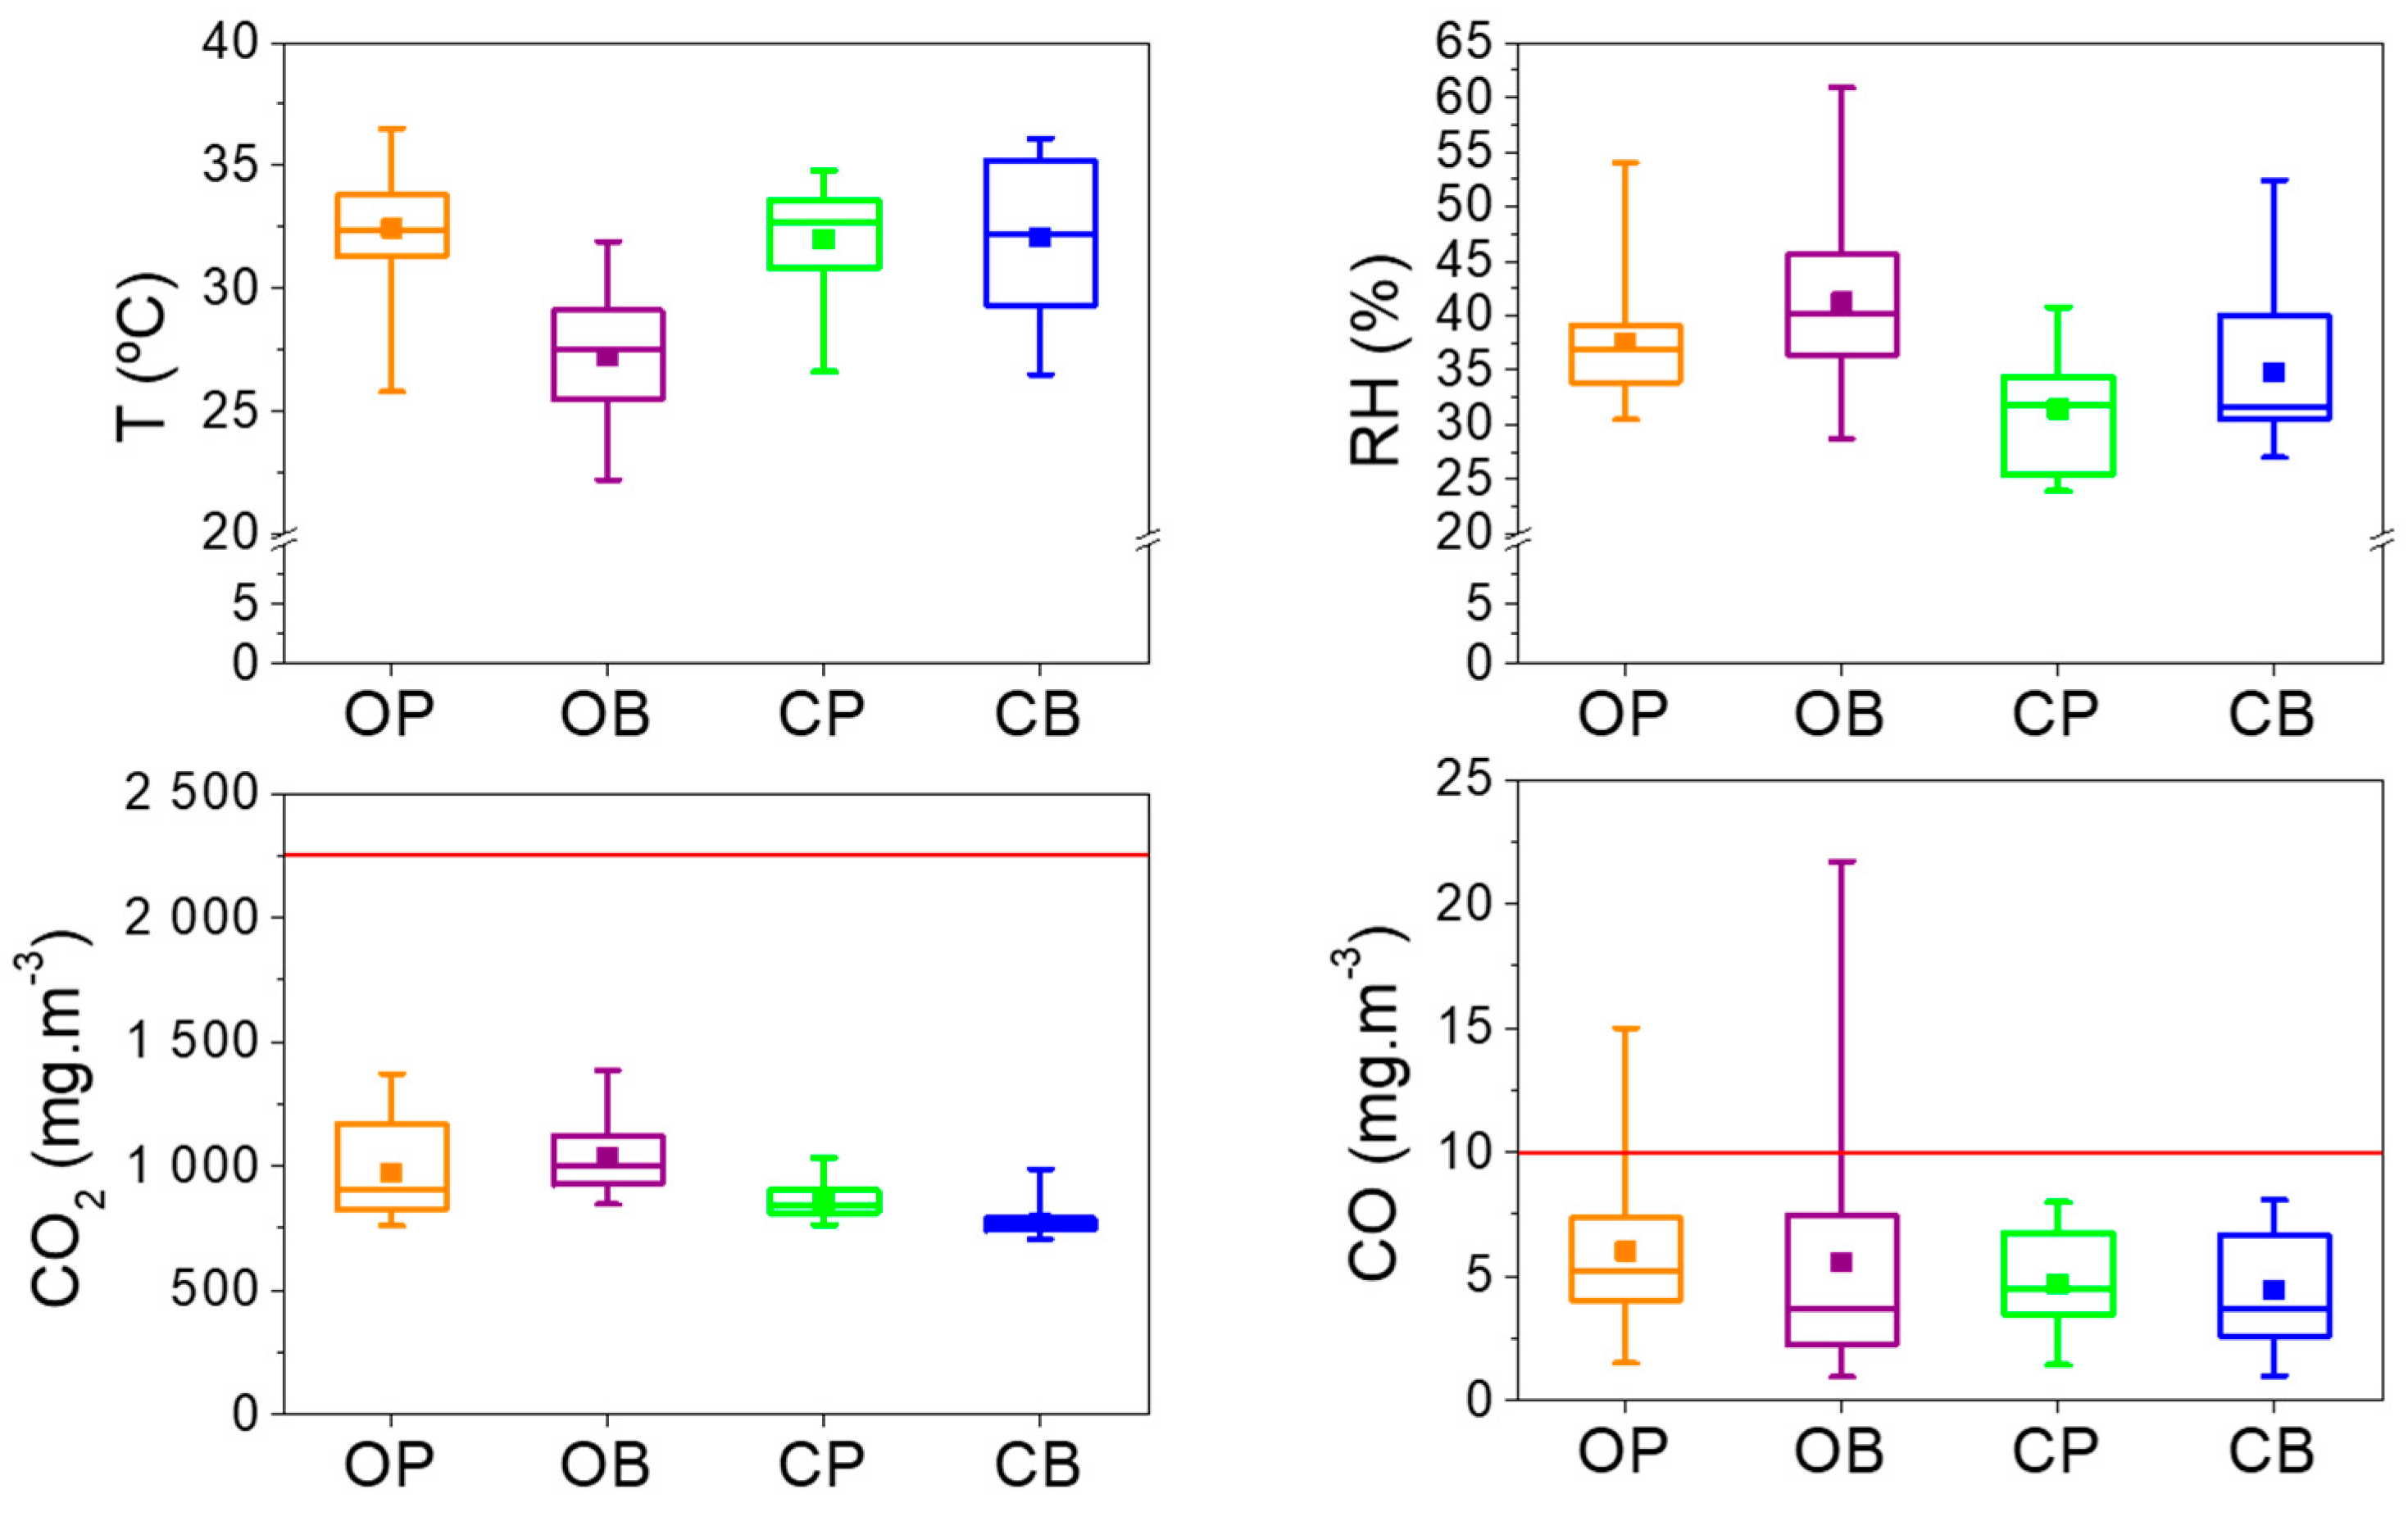
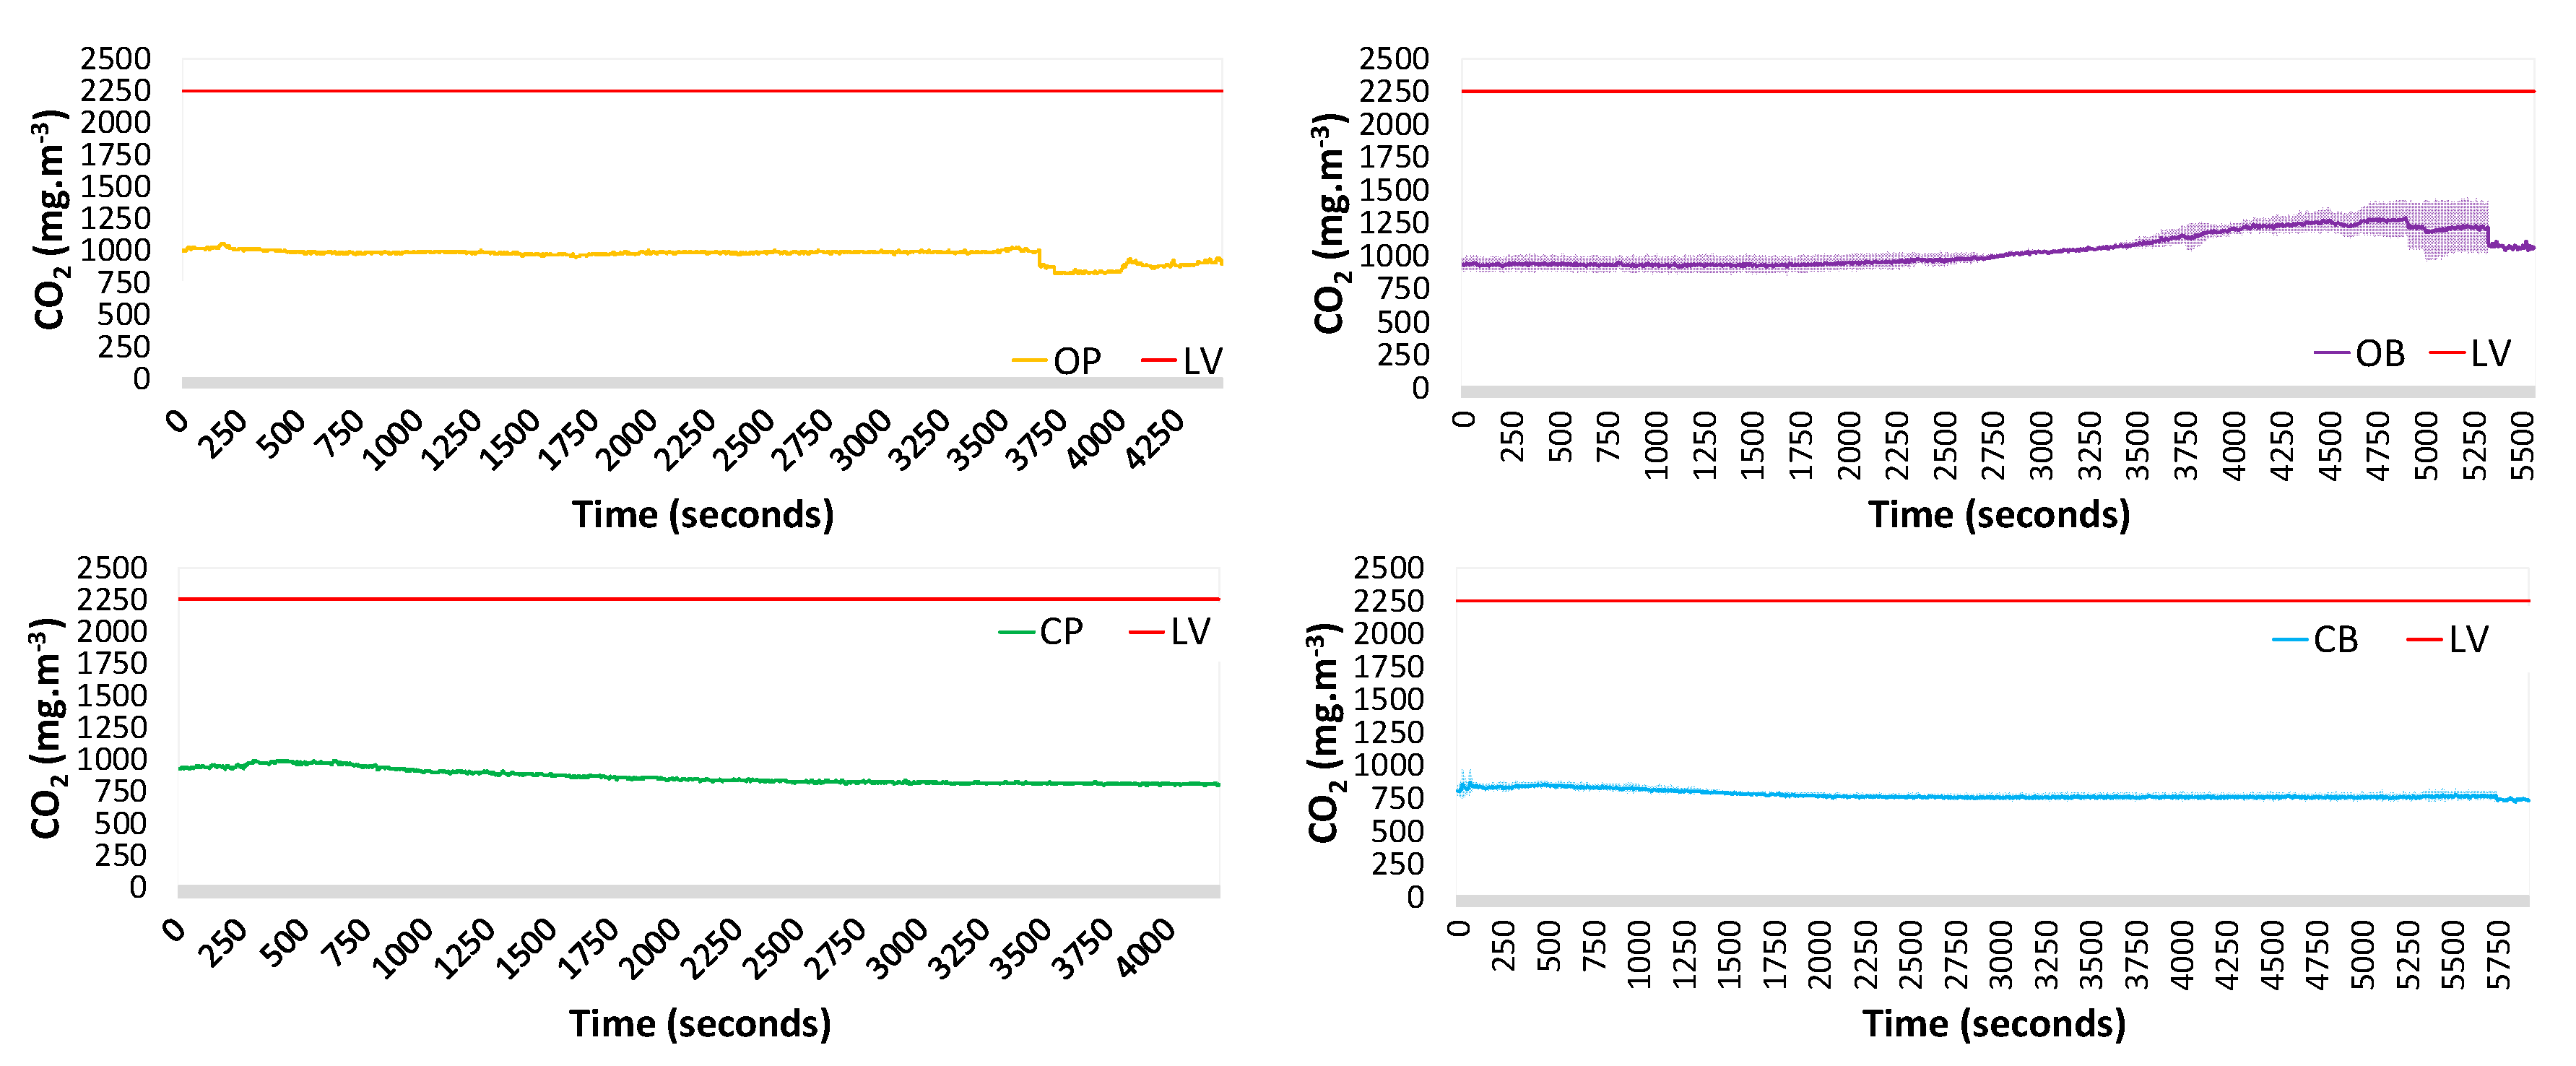
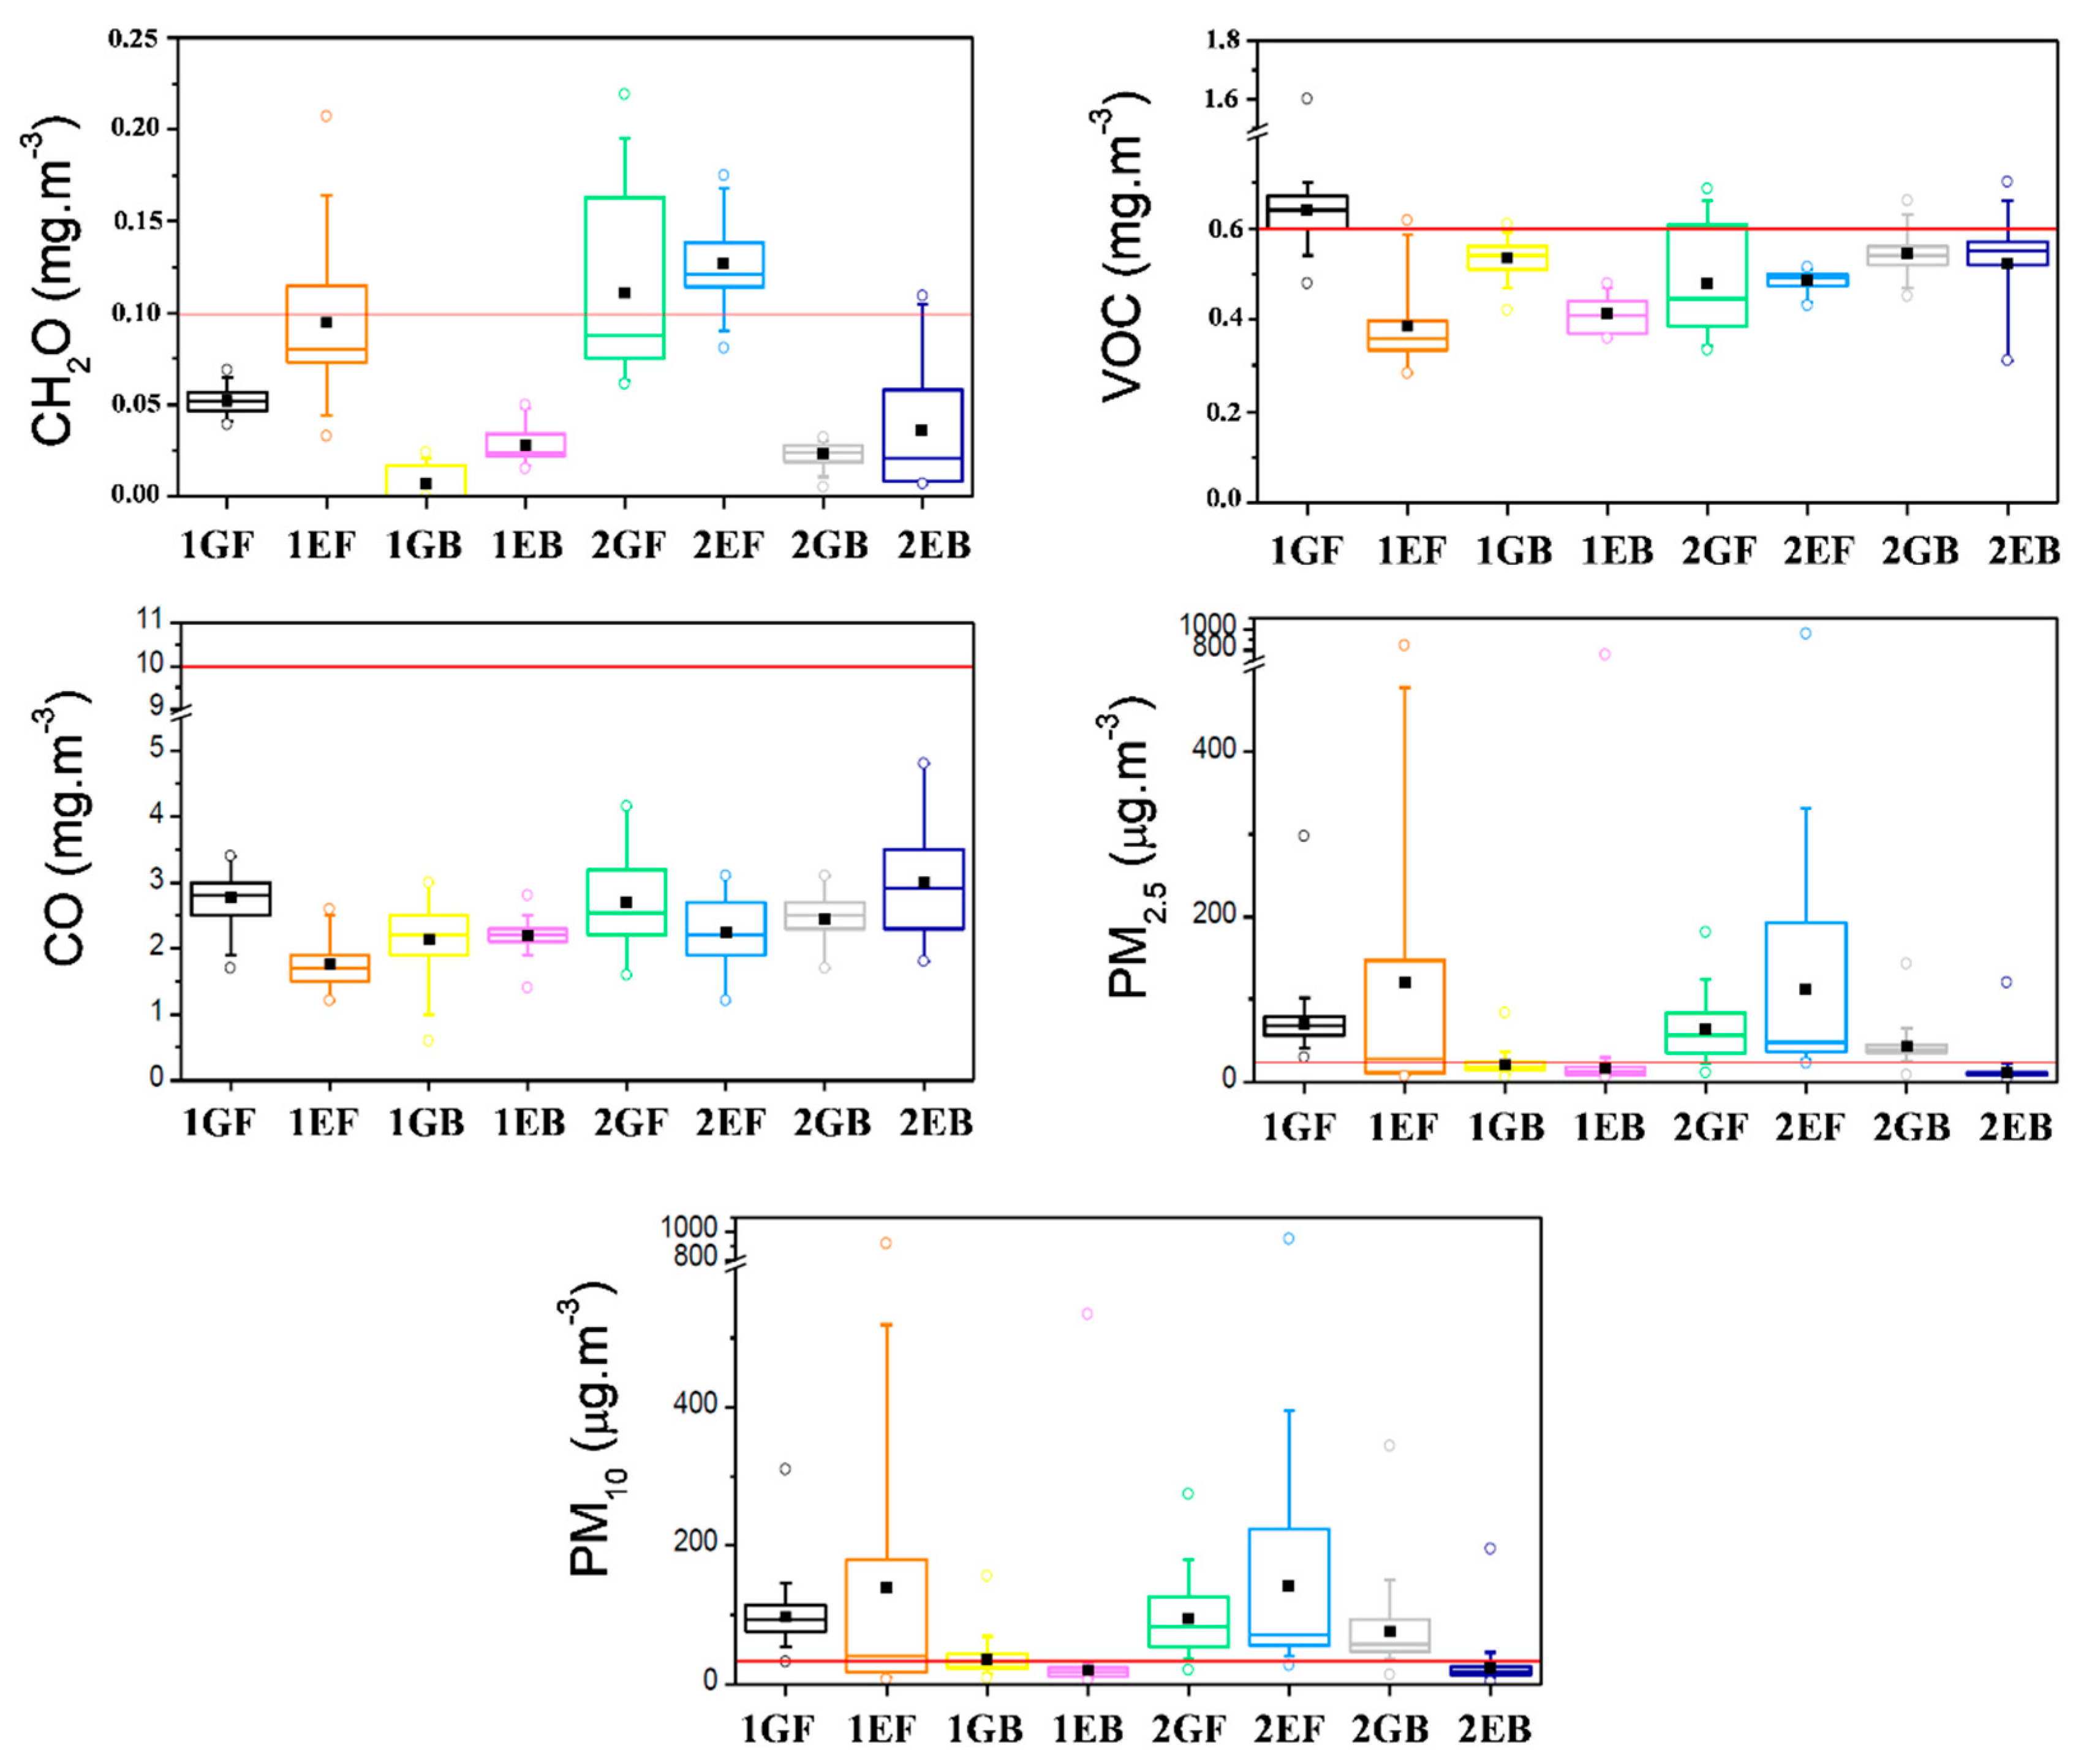
3.1.1. Carbon Dioxide
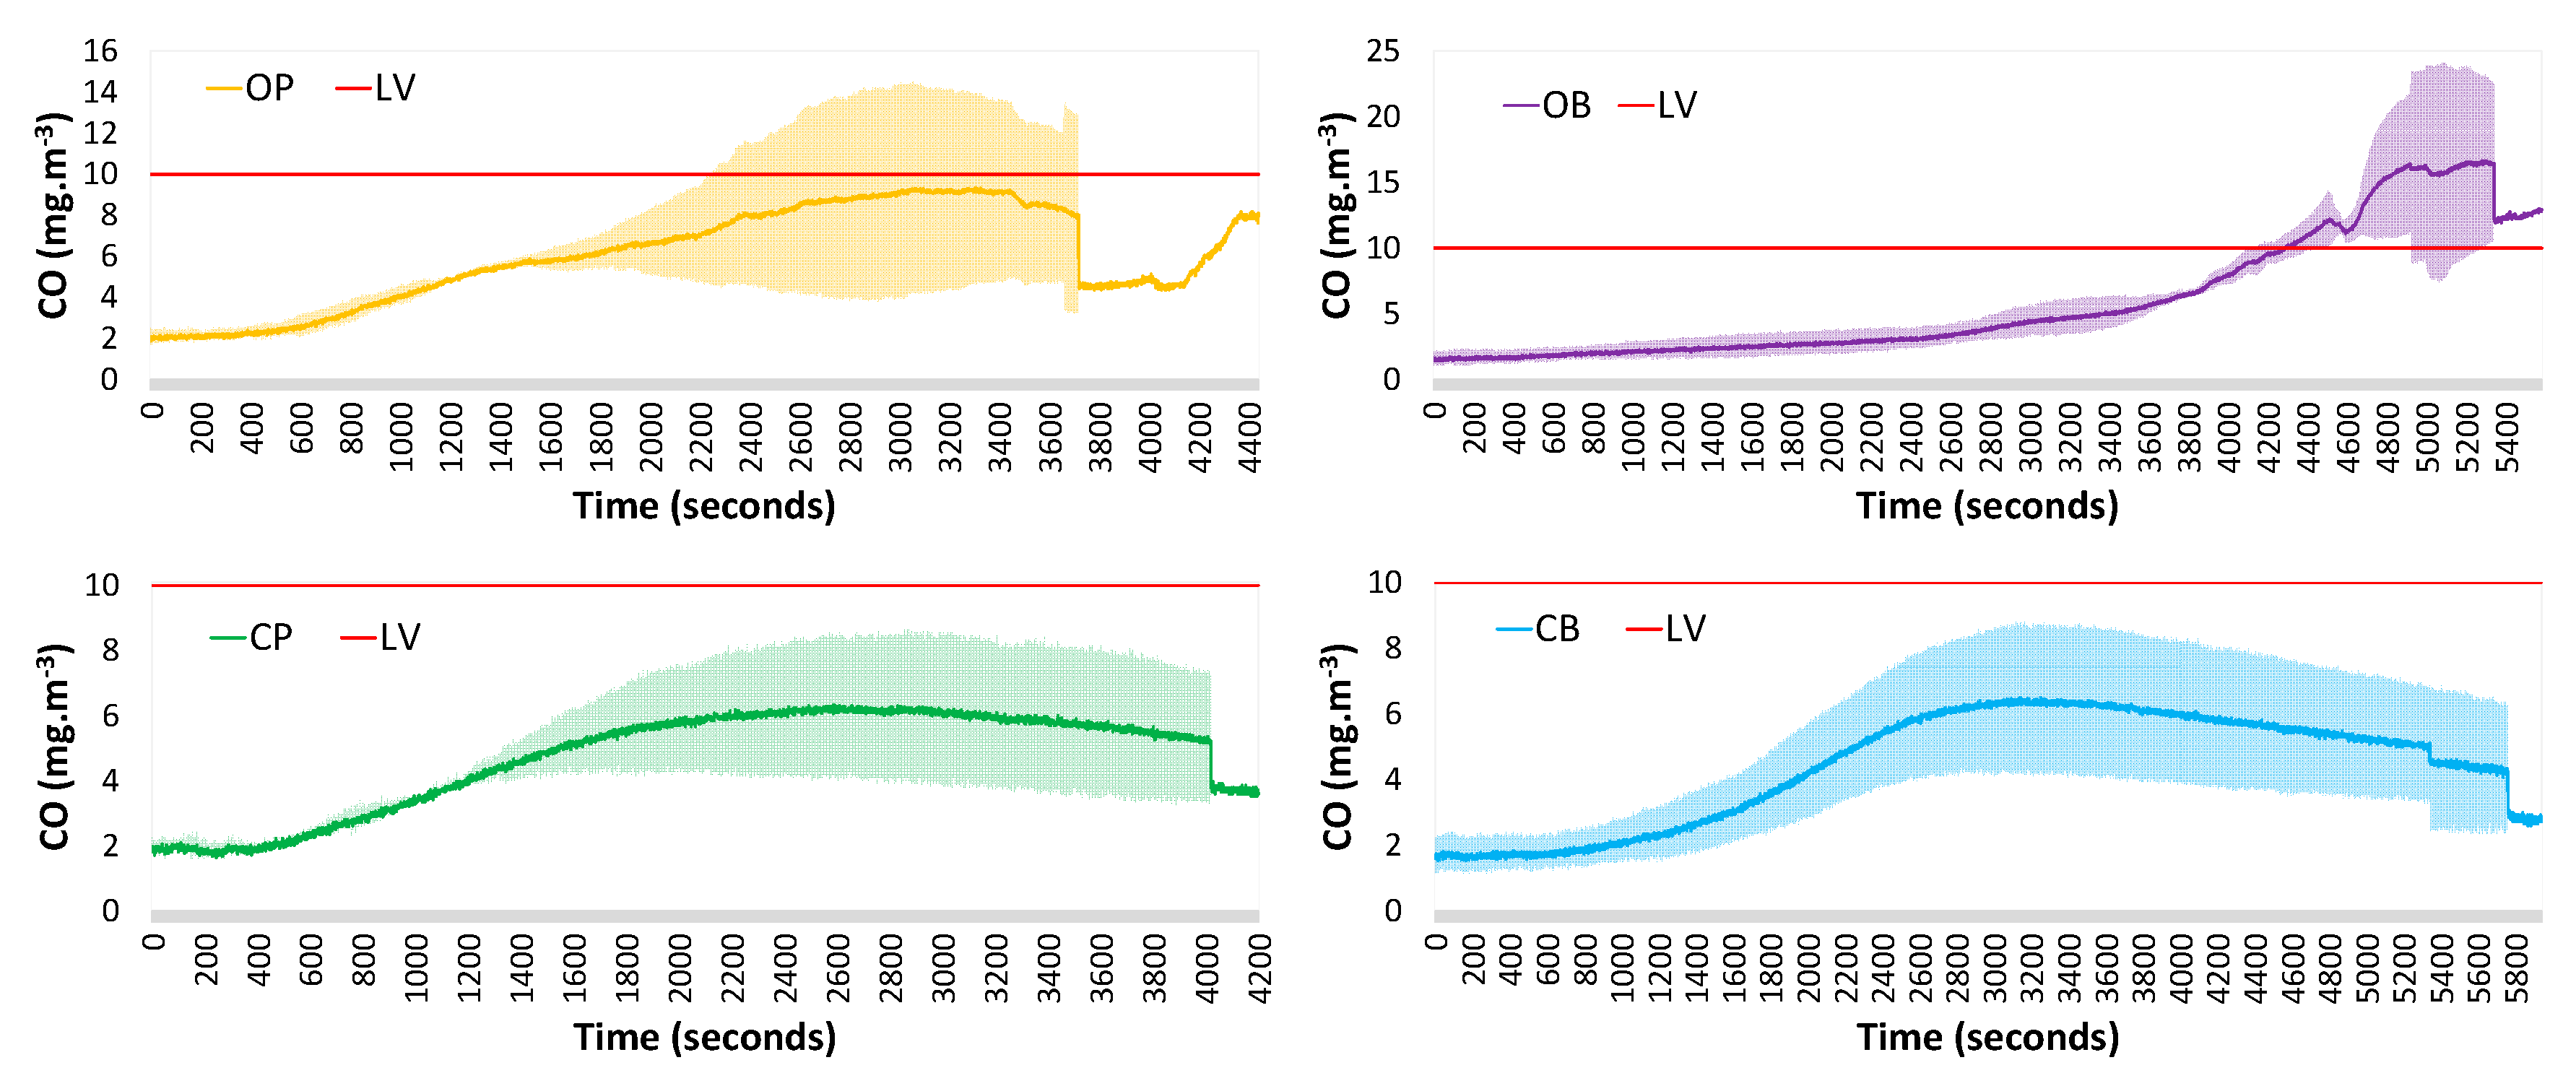
3.1.2. Carbon Monoxide
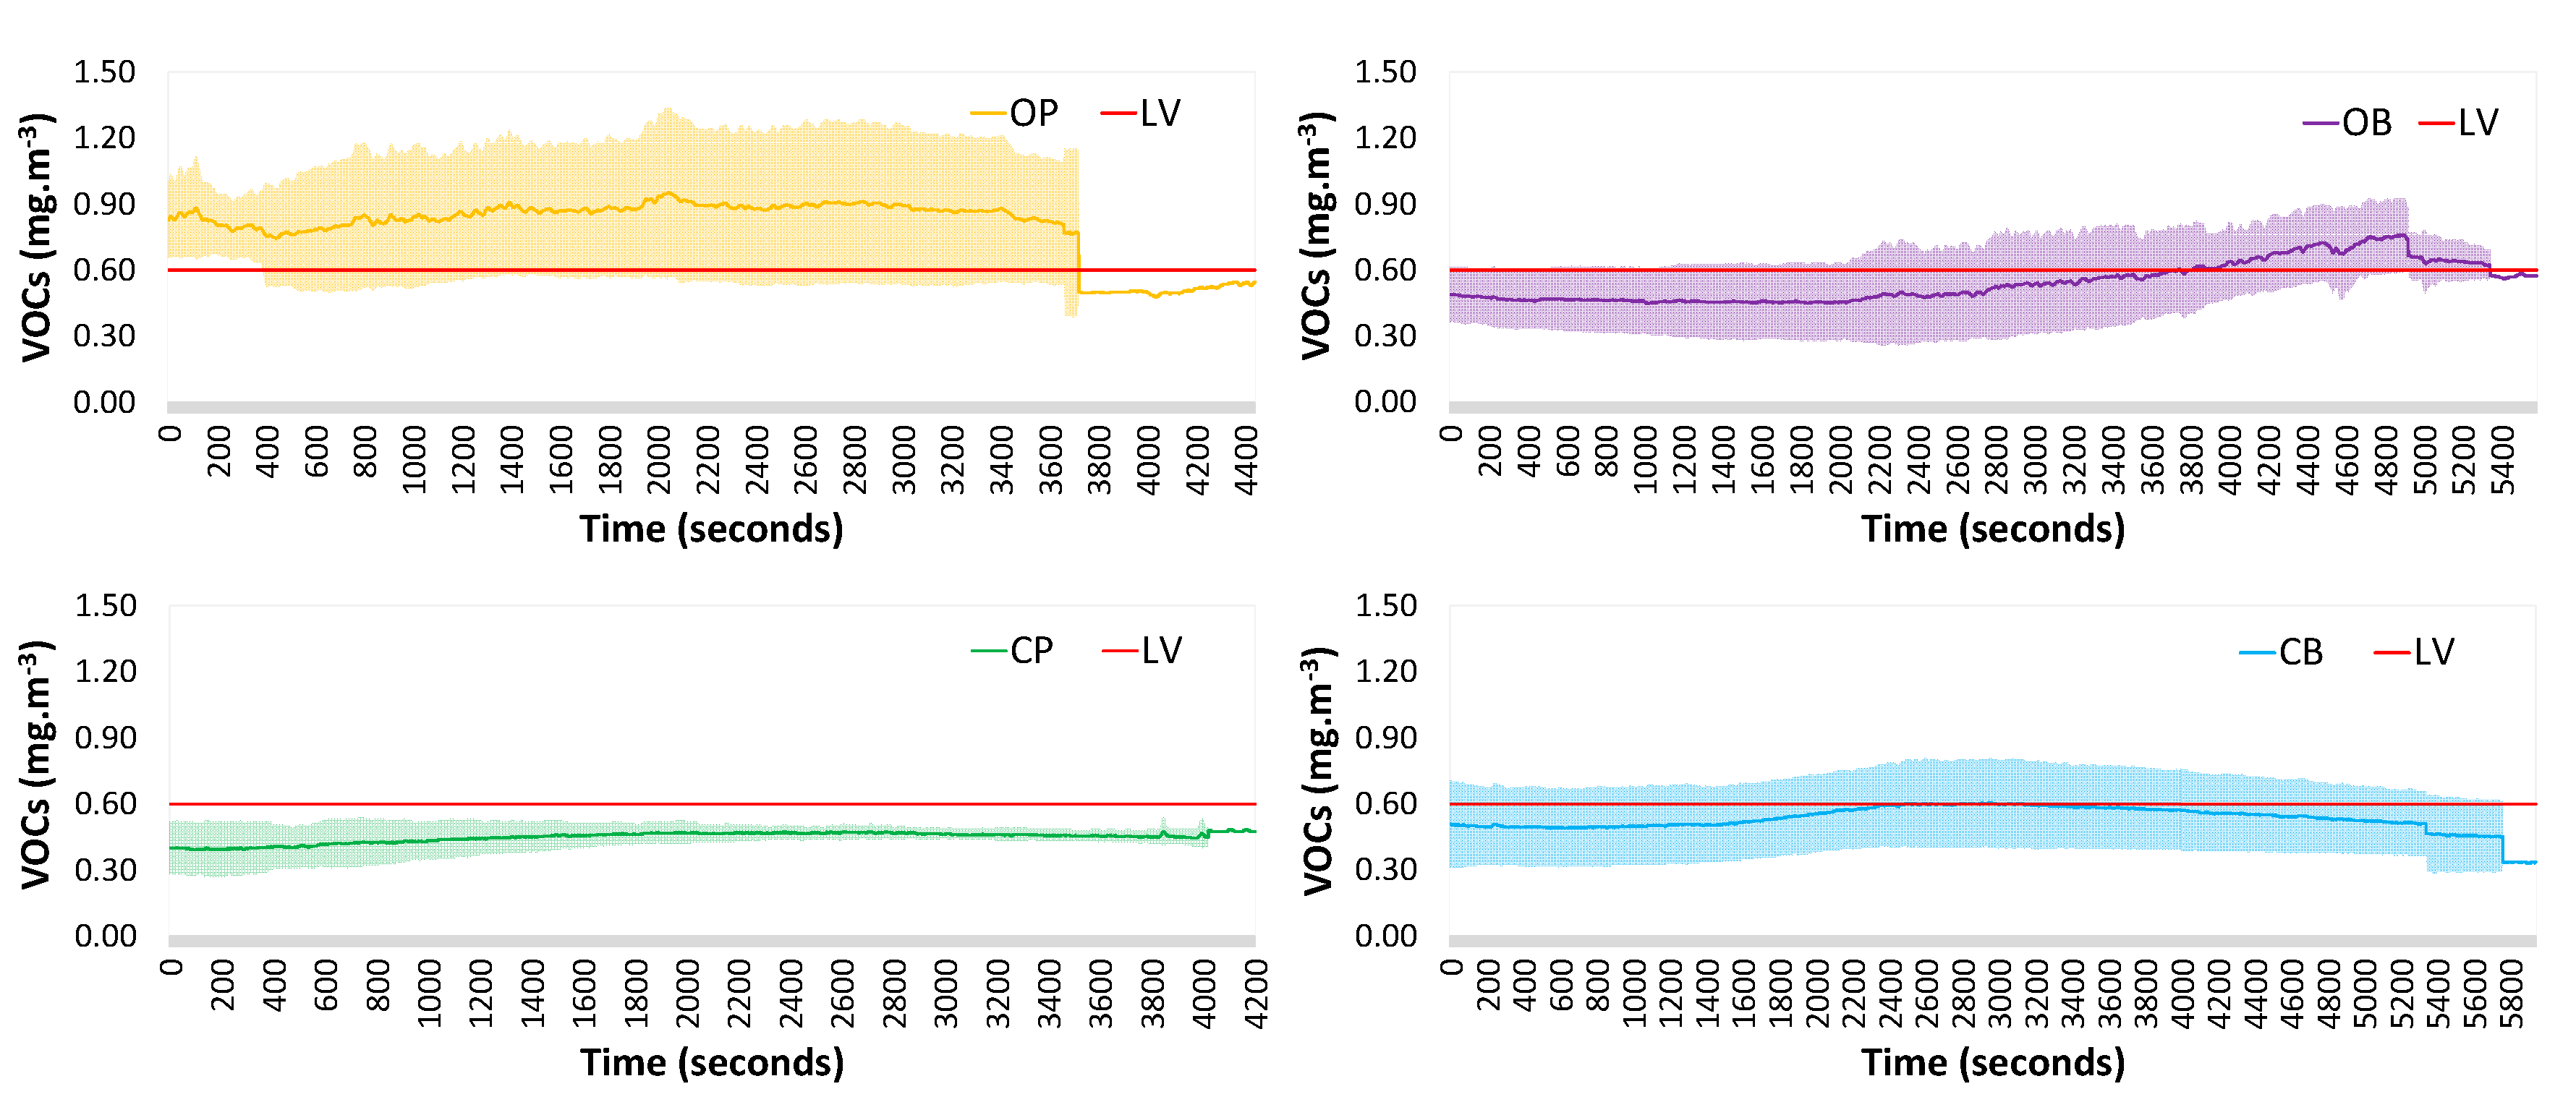
3.1.3. Volatile Organic Compounds
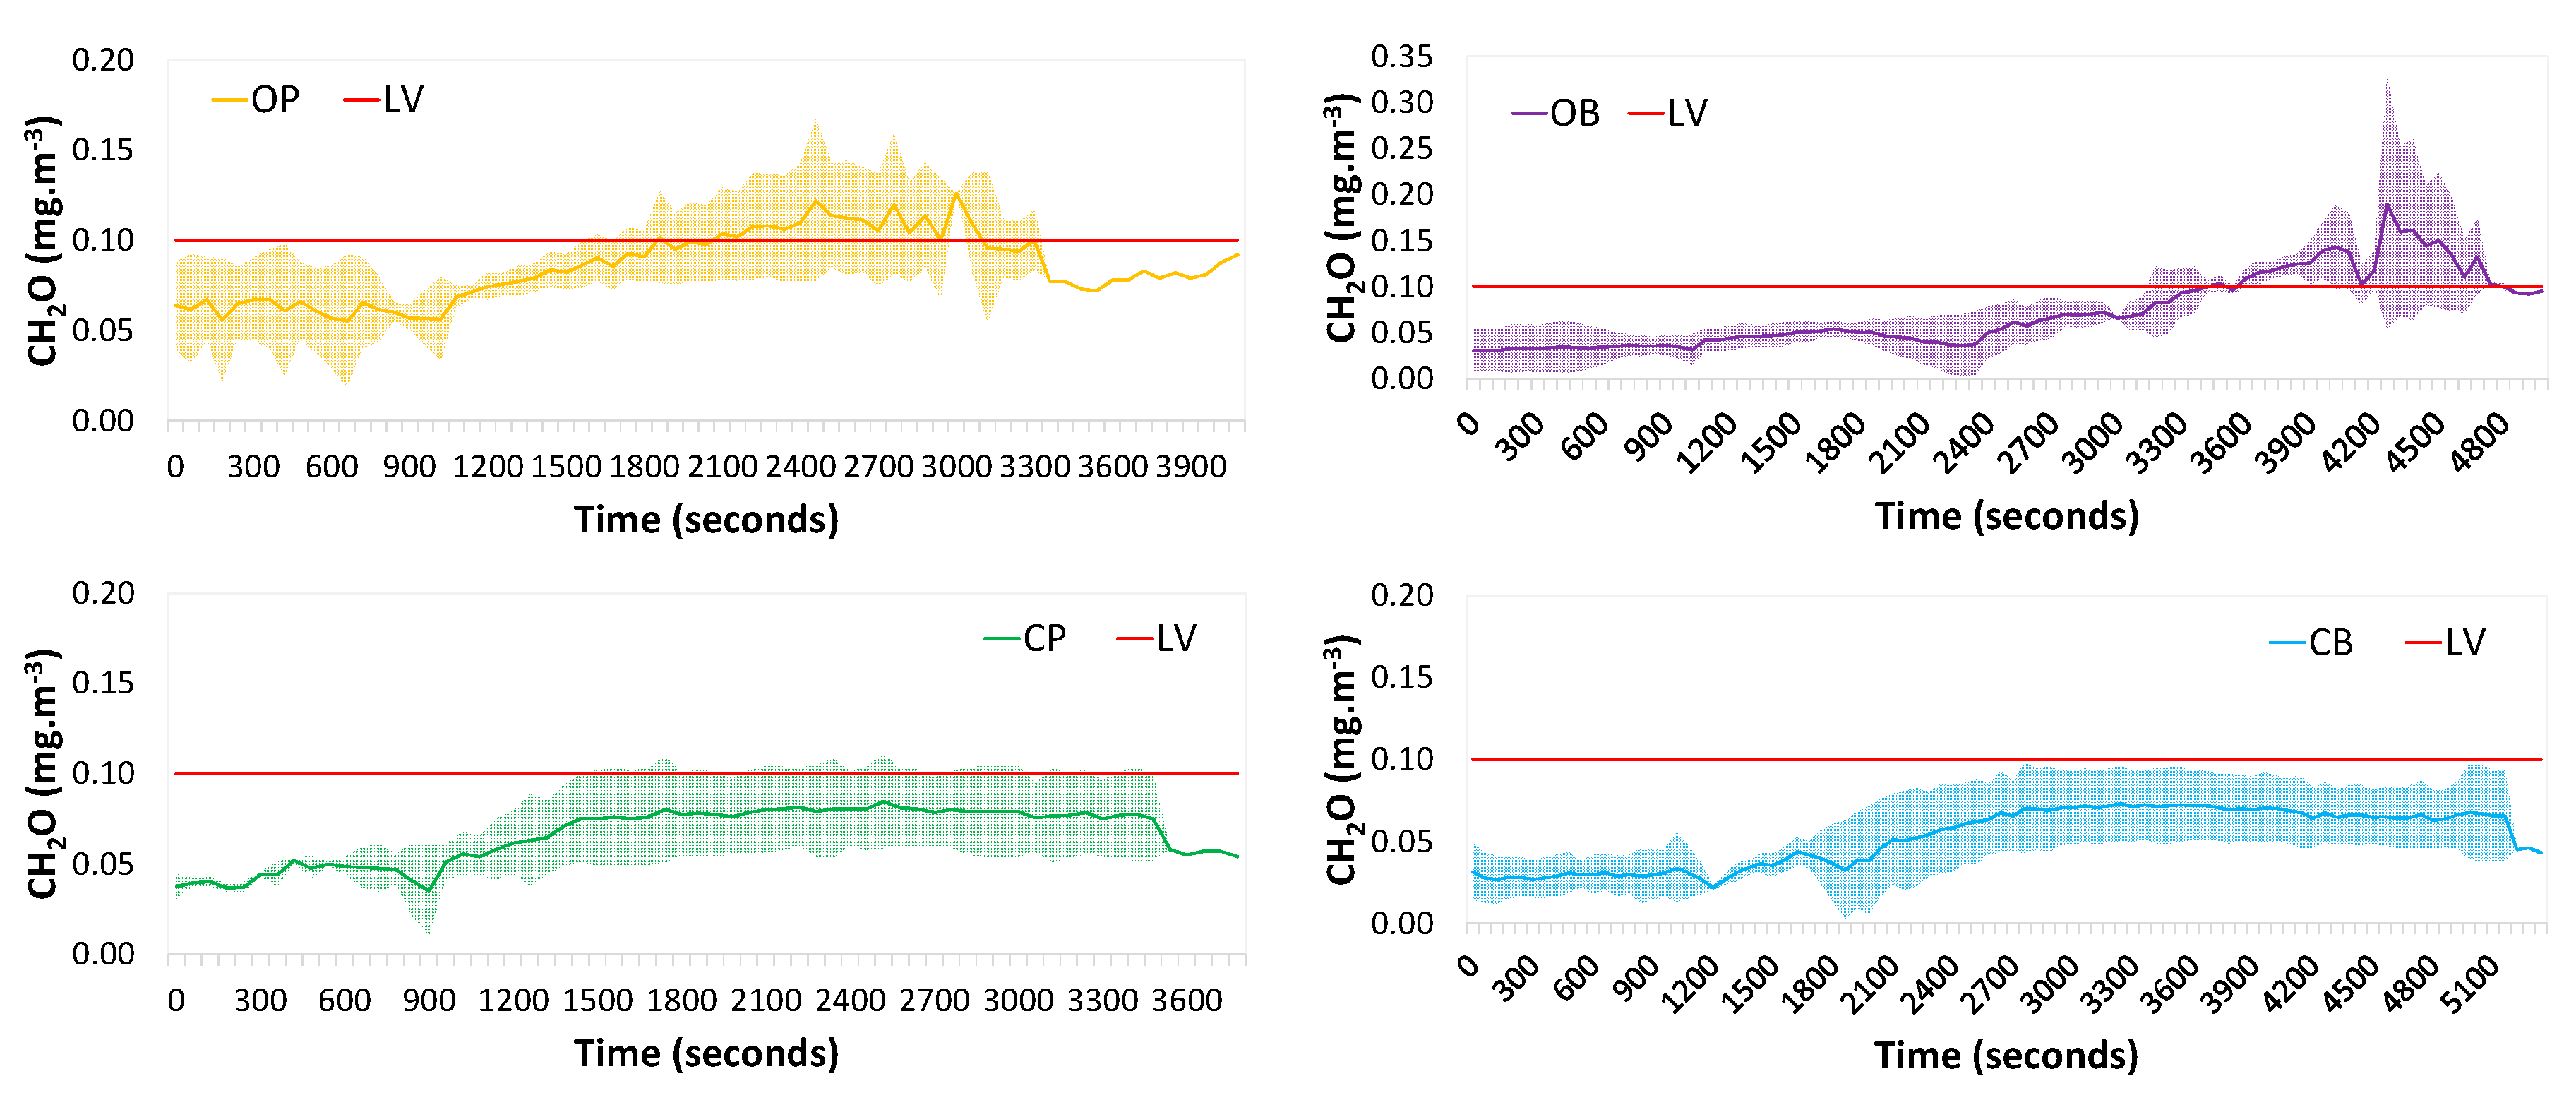
3.1.4. Formaldehyde
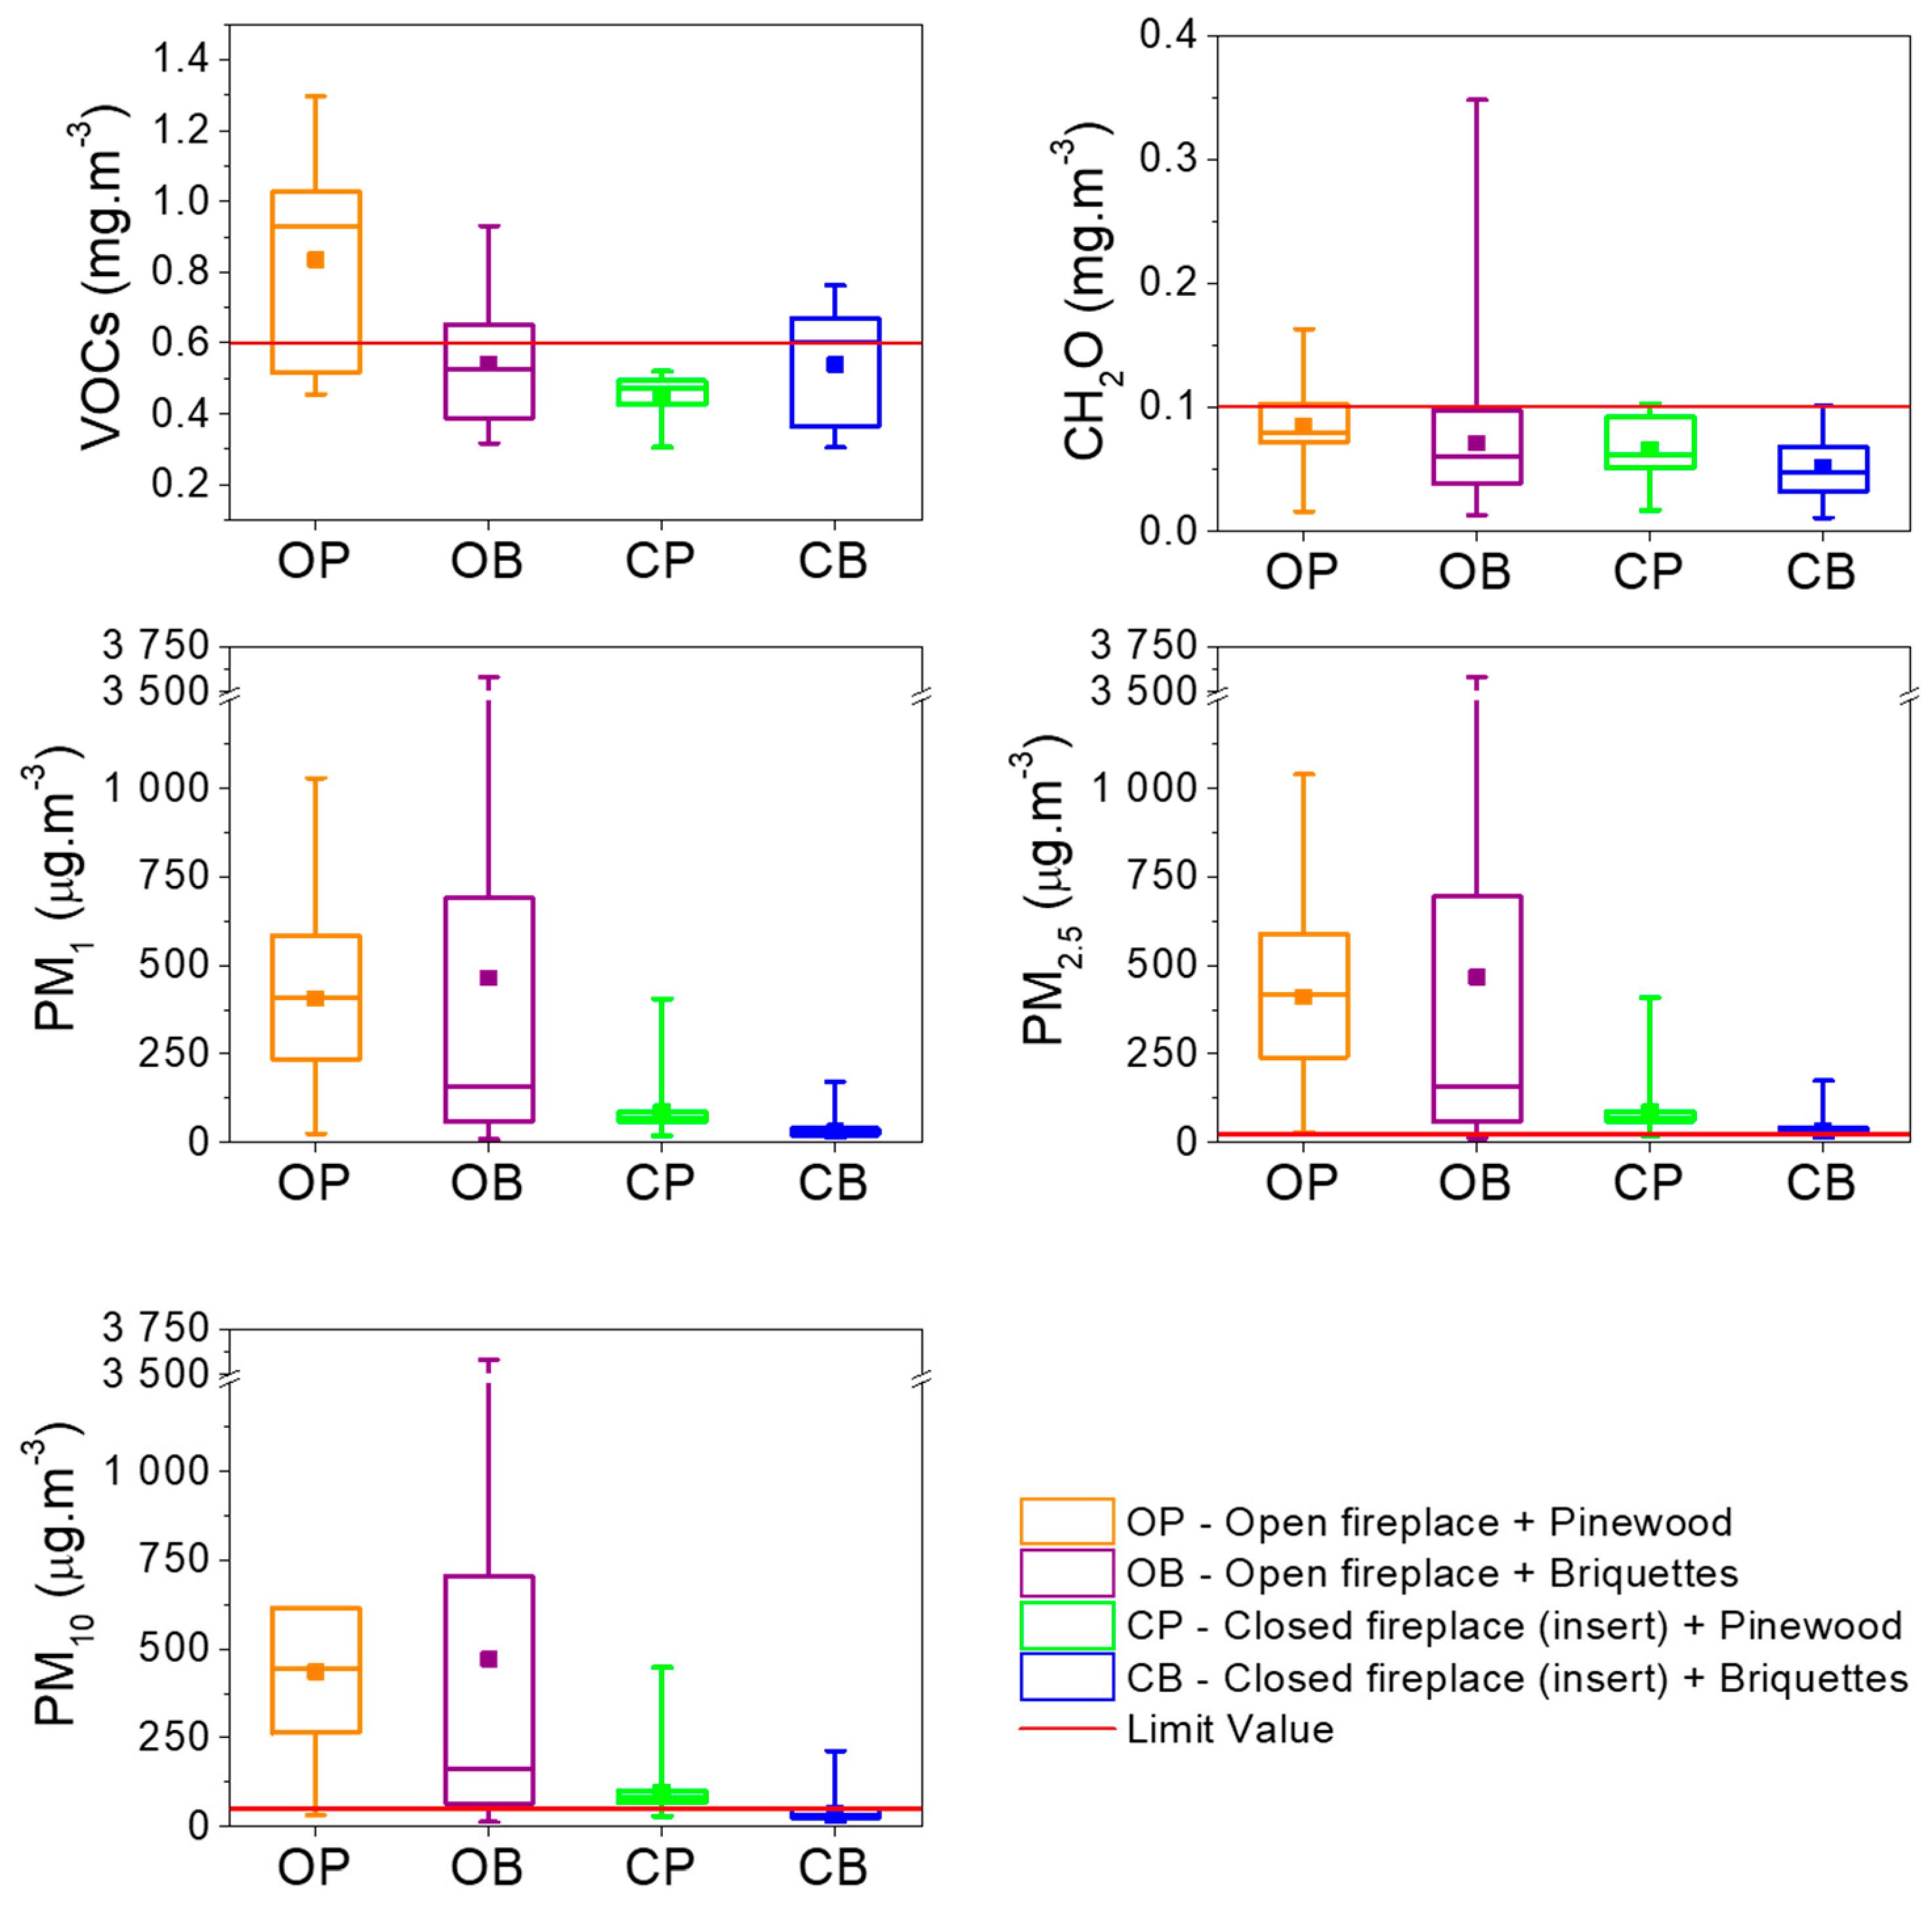
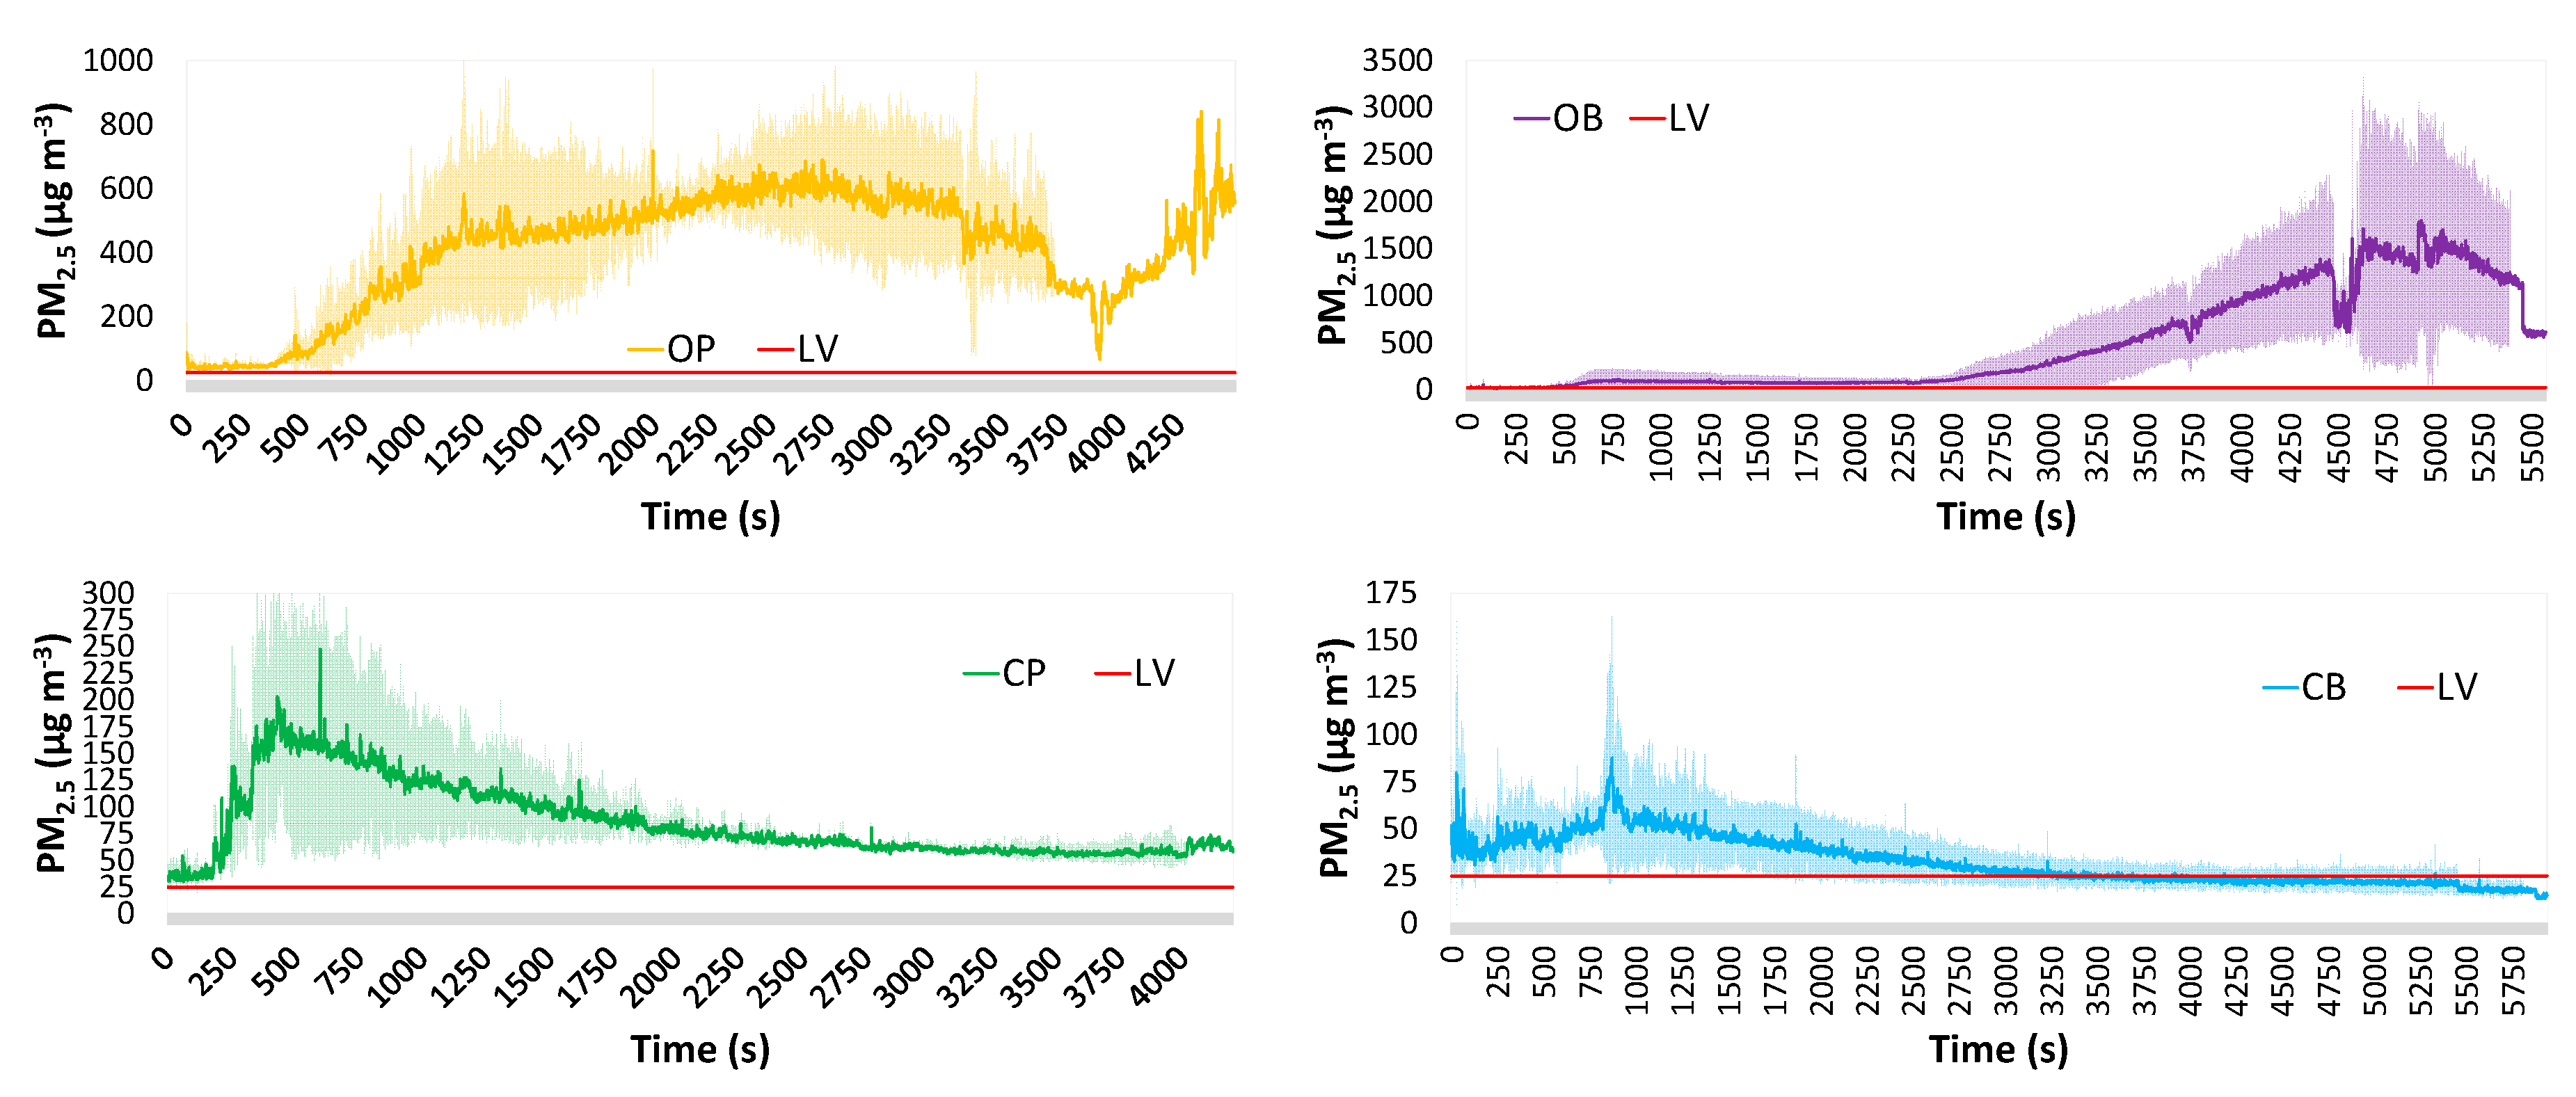
3.1.5. Particulate Matter
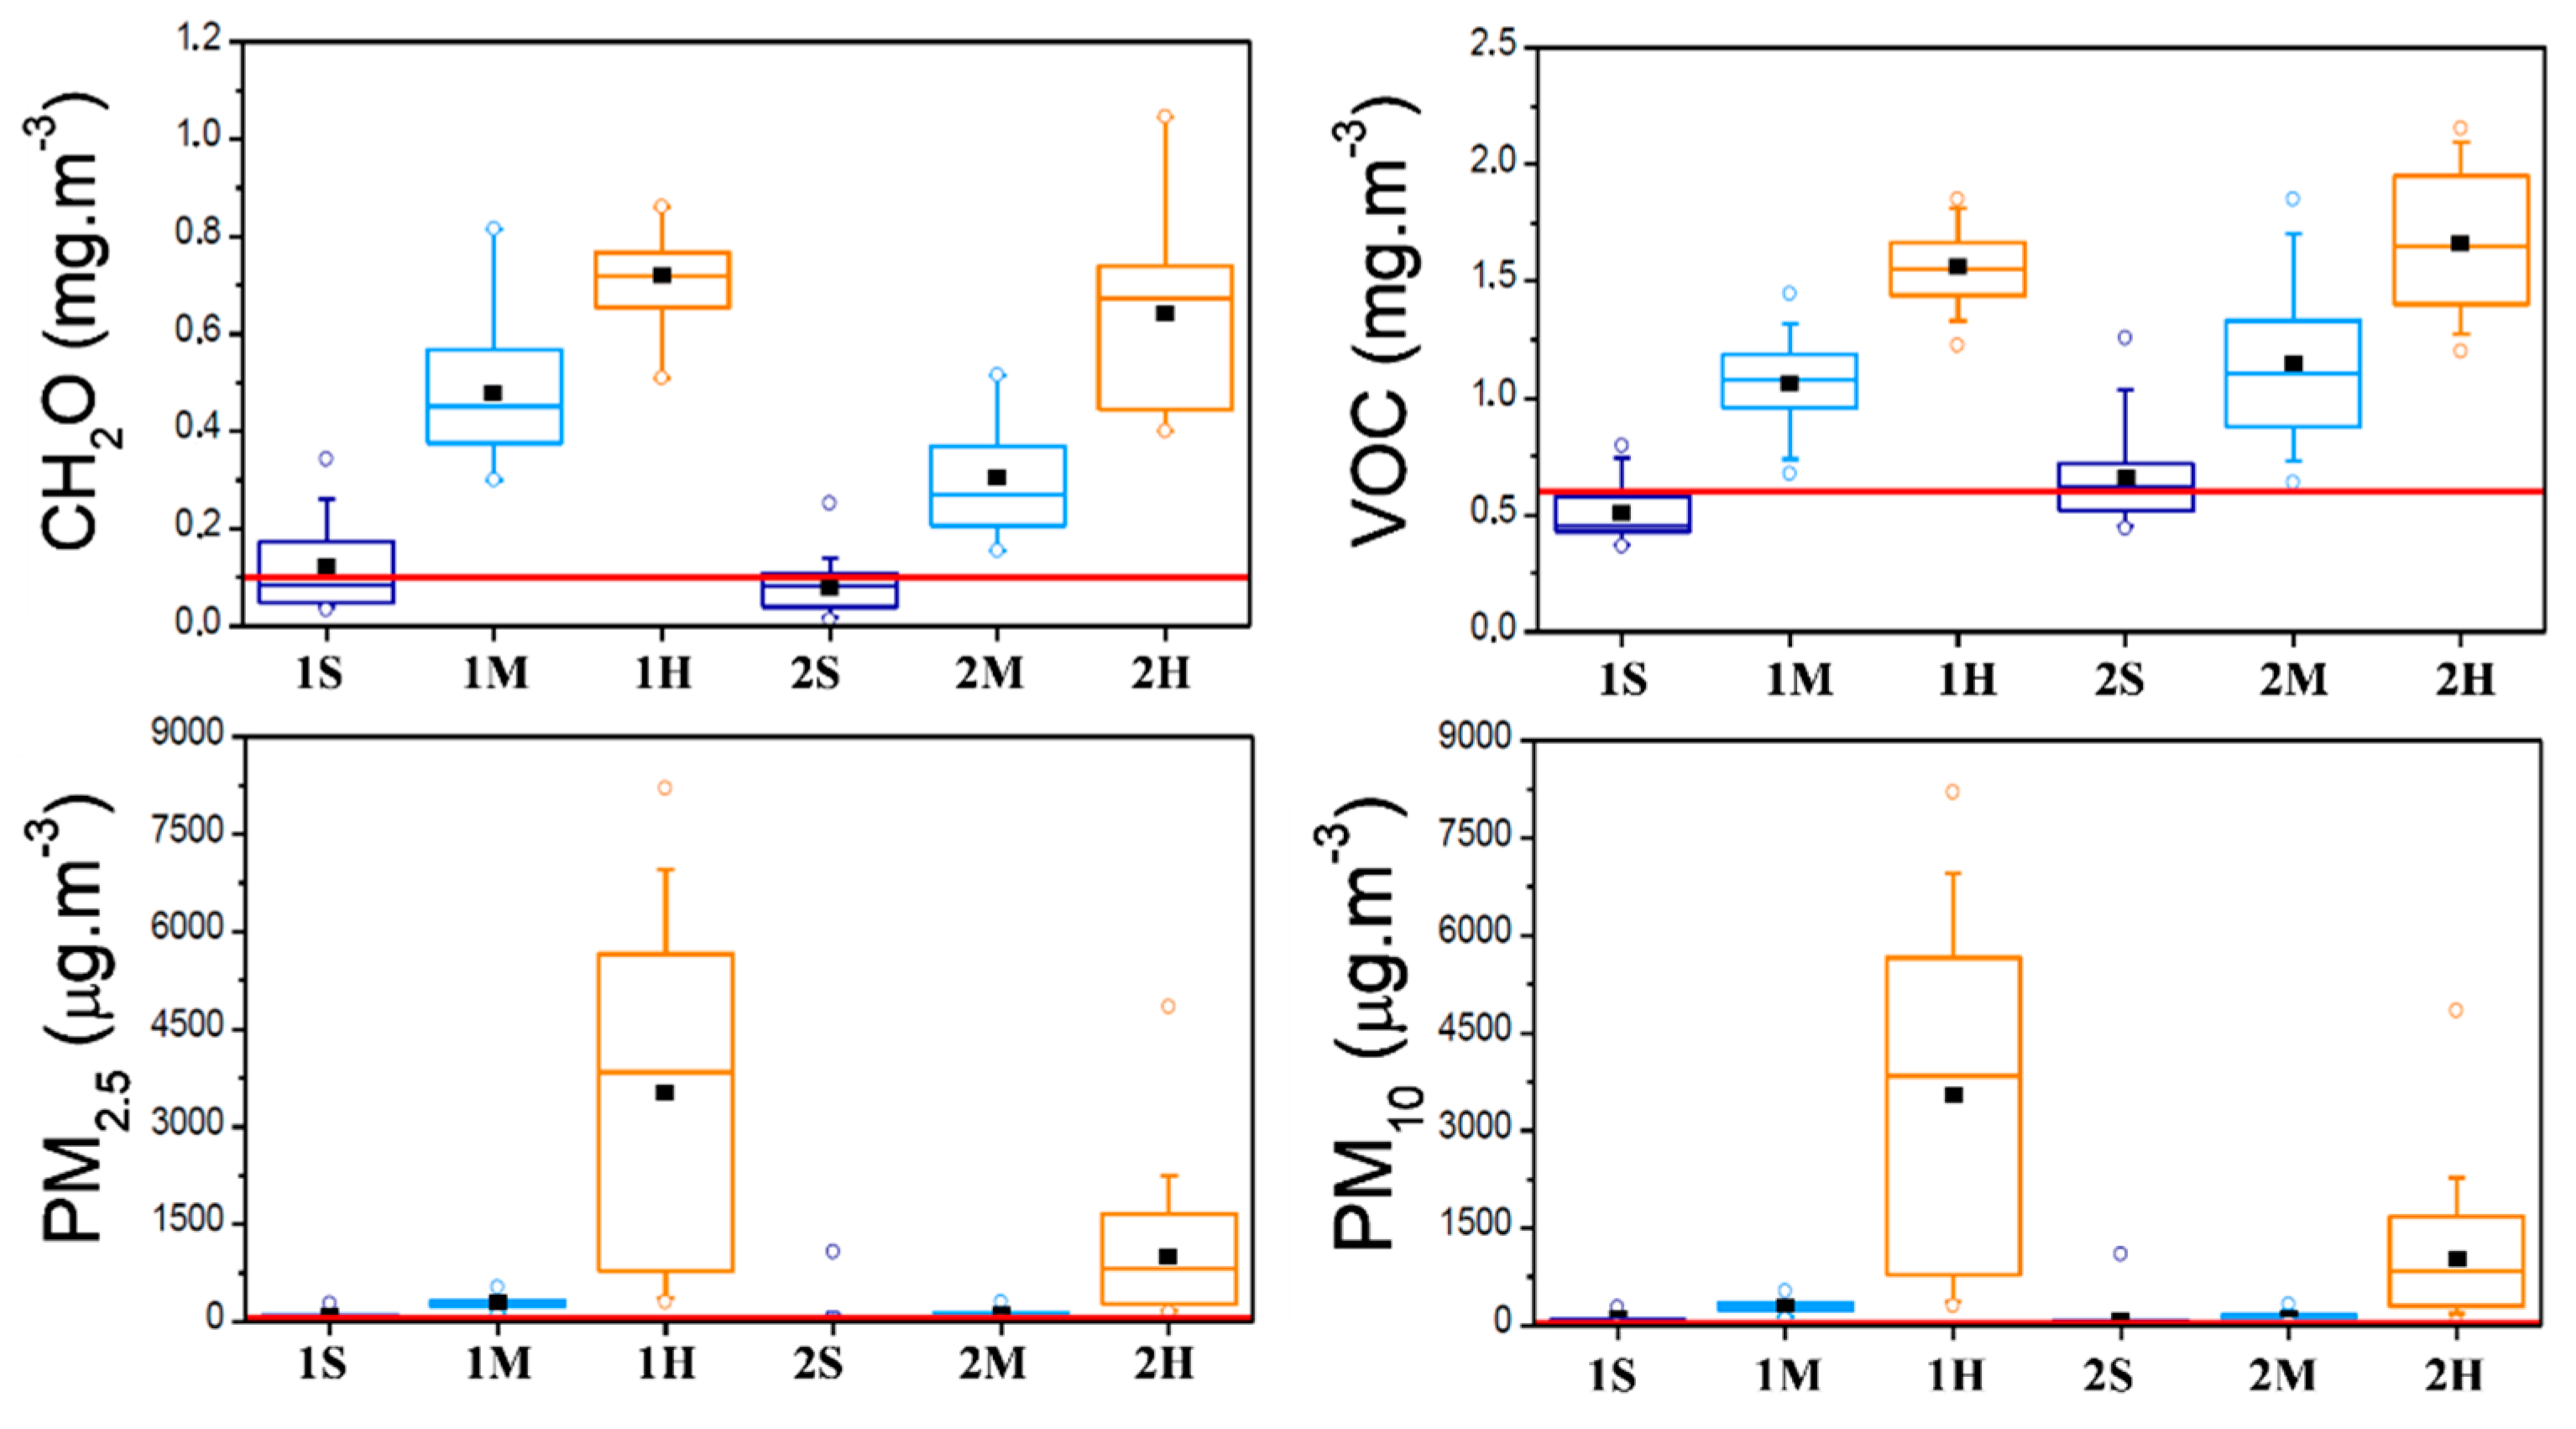
3.2. Cooking Emissions
3.3. Emissions from Toasting
3.4. Discussion
4. Conclusions
Author Contributions
Acknowledgments
Conflicts of Interest
Appendix A

| Setting | ||||
|---|---|---|---|---|
| Open Fireplace | Fireplace Insert | |||
| Parameter | Pinewood | Briquettes | Pinewood | Briquettes |
| Temperature (°C) | 27.6 ± 2.2; 28.8 (23.0–29.7) | 22.4 ± 1.8; 21.8 (20.0–25.9) | 28.0 ± 0.7; 27.5 (27.2–28.9) | 26.5 ± 0.3; 26.5 (25.9–27.1) |
| Relative Humidity (%) | 51.6 ± 6.3; 50.7 (44.2–66.2) | 58.5 ± 7.4; 60.5 (45.8–71.3) | 39.8 ± 0.7; 39.5 (38.7–41.1) | 47.9 ± 4.1; 47.4 (42.0–54.6) |
| CO2 (mg·m−3) | 990 ± 186; 884 (794–1308) | 949 ± 51; 973 (850–1155) | 956 ± 45; 946 (913–1288) | 812 ± 43; 820 (734–922) |
| CO (mg·m−3) | 1.62 ± 0.56; 1.81 (0.00–2.42) | 1.05 ± 0.54; 0.96 (0.00–2.35) | 1.94 ± 0.13; 1.95 (1.43–2.29) | 1.52 ± 0.41; 1.48 (0.71–2.40) |
| VOCs (mg·m−3) | 0.838 ± 0.186; 0.898 (0.576–1.411) | 0.486 ± 0.098; 0.471 (0.359–0.630) | 0.399 ± 0.077; 0.345 (0.315–0.491) | 0.538 ± 0.184; 0.519 (0.315–0.806) |
| CH2O (mg·m−3) | 0.056 ± 0.020; 0.053 (0.026–0.097) | 0.029 ± 0.014; 0.021 (0.016–0.055) | 0.040 ± 0.010; 0.044 (0.015–0.049) | 0.031 ± 0.013; 0.025 (0.016–0.050) |
| PM1 (µg·m−3) | 34.7 ± 8.7; 32.0 (23.0–168.0) | 19.5 ± 9.3; 14.0 (10.0–75.0) | 34.3 ± 8.6; 37.0 (18.0–114.0) | 34.5 ± 9.7; 37.0 (14.0–86.0) |
| PM2.5 (µg·m−3) | 38.5 ± 9.4; 36.0 (27.0–175.0) | 21.1 ± 9.6; 16.0 (11.0–77.0) | 35.8 ± 8.5; 38.0 (19.0–116.0) | 37.4 ± 10.1; 40.0 (16.0–89.0) |
| PM10 (µg·m−3) | 57.0 ± 23.6; 47.0 (30.0–267.0) | 28.1 ±14.3; 22.0 (11.0–102.0) | 56.4 ± 13.0; 55.0 (28.0–159.0) | 64.8 ± 22.0; 57.0 (26.0–167.0) |
| Ratio PM2.5/PM10 | 0.72 ± 0.15 | 0.78 ± 0.11 | 0.65 ± 0.14 | 0.61 ± 0.17 |
References
- Sundell, J. On the history of indoor air quality and health. Indoor Air 2004, 14, 51–58. [Google Scholar] [CrossRef] [PubMed]
- Mandin, C.; Trantallidi, M.; Cattaneo, A.; Canha, N.; Mihucz, V.G.; Szigeti, T.; Mabilia, R.; Perreca, E.; Spinazzè, A.; Fossati, S.; et al. Assessment of indoor air quality in office buildings across Europe—The OFFICAIR study. Sci. Total Environ. 2017, 579, 169–178. [Google Scholar] [CrossRef] [PubMed]
- Faria, T.; Silva, M.A.; Dias, A.; Almeida, S.M. Indoor air quality in urban office buildings. Int. J. Environ. Technol. Manag. 2016, 19, 236. [Google Scholar] [CrossRef]
- Canha, N.; Mandin, C.; Ramalho, O.; Wyart, G.; Ribéron, J.; Dassonville, C.; Derbez, M. Exposure assessment of allergens and metals in settled dust in French nursery and elementary schools. Atmosphere 2015, 6, 1676–1694. [Google Scholar] [CrossRef]
- Hänninen, O.; Canha, N.; Kulinkina, A.V.; Dume, I.; Deliu, A.; Mataj, E.; Lusati, A.; Krzyzanowski, M.; Egorov, A.I. Analysis of CO2 monitoring data demonstrates poor ventilation rates in Albanian schools during the cold season. Air Qual. Atmos. Health 2017, 10, 773–782. [Google Scholar] [CrossRef]
- Canha, N.; Martinho, M.; Silva, M.A.; Almeida, S.M.; Pegas, P.; Alves, C.; Pio, C.; Trancoso, M.A.; Sousa, R.; Mouro, F.; et al. Indoor air quality in primary schools. Int. J. Environ. Pollut. 2012, 50, 396. [Google Scholar] [CrossRef] [Green Version]
- Langer, S.; Ramalho, O.; Derbez, M.; Ribéron, J.; Kirchner, S.; Mandin, C. Indoor environmental quality in French dwellings and building characteristics. Atmos. Environ. 2016, 128, 82–91. [Google Scholar] [CrossRef]
- Ramos, C.A.; Reis, J.F.; Almeida, T.; Alves, F.; Wolterbeek, H.T.; Almeida, S.M. Estimating the inhaled dose of pollutants during indoor physical activity. Sci. Total Environ. 2015, 527–528, 111–118. [Google Scholar] [CrossRef] [PubMed]
- Almeida-Silva, M.; Wolterbeek, H.T.; Almeida, S.M. Elderly exposure to indoor air pollutants. Atmos. Environ. 2014, 85, 54–63. [Google Scholar] [CrossRef]
- Ramos, C.A.; Wolterbeek, H.T.; Almeida, S.M. Exposure to indoor air pollutants during physical activity in fitness centers. Build. Environ. 2014, 82, 349–360. [Google Scholar] [CrossRef]
- Almeida, S.M.; Ramos, C.A.; Almeida-Silva, M. Exposure and inhaled dose of susceptible population to chemical elements in atmospheric particles. J. Radioanal. Nucl. Chem. 2016, 309, 309–315. [Google Scholar] [CrossRef]
- Almeida-Silva, M.; Almeida, S.M.; Pegas, P.N.; Nunes, T.; Alves, C.A.; Wolterbeek, H.T. Exposure and dose assessment to particle components among an elderly population. Atmos. Environ. 2015, 102, 156–166. [Google Scholar] [CrossRef] [Green Version]
- Canha, N.; Lage, J.; Candeias, S.; Alves, C.; Almeida, S.M. Indoor air quality during sleep under different ventilation patterns. Atmos. Pollut. Res. 2017, 8, 1132–1142. [Google Scholar] [CrossRef]
- Hwang, Y.; Lee, K. Contribution of microenvironments to personal exposures to PM10 and PM2.5 in summer and winter. Atmos. Environ. 2018, 175, 192–198. [Google Scholar] [CrossRef]
- Manigrasso, M.; Guerriero, E.; Avino, P. Ultrafine Particles in Residential Indoors and Doses Deposited in the Human Respiratory System. Atmosphere 2015, 6, 1444–1461. [Google Scholar] [CrossRef] [Green Version]
- Zhang, N.; Han, B.; He, F.; Xu, J.; Zhao, R.; Zhang, Y.; Bai, Z. Chemical characteristic of PM 2.5 emission and inhalational carcinogenic risk of domestic Chinese cooking. Environ. Pollut. 2017, 227, 24–30. [Google Scholar] [CrossRef] [PubMed]
- Morawska, L.; Afshari, A.; Bae, G.N.; Buonanno, G.; Chao, C.Y.H.; Hänninen, O.; Hofmann, W.; Isaxon, C.; Jayaratne, E.R.; Pasanen, P.; et al. Indoor aerosols: From personal exposure to risk assessment. Indoor Air 2013, 23, 462–487. [Google Scholar] [CrossRef] [PubMed] [Green Version]
- Soppa, V.J.; Schins, R.P.F.; Hennig, F.; Hellack, B.; Quass, U.; Kaminski, H.; Kuhlbusch, T.A.J.; Hoffmann, B.; Weinmayr, G. Respiratory effects of fine and ultrafine particles from indoor sources—A randomized sham-controlled exposure study of healthy volunteers. Int. J. Environ. Res. Public Health 2014, 11, 6871–6889. [Google Scholar] [CrossRef] [PubMed]
- Salthammer, T.; Schripp, T.; Wientzek, S.; Wensing, M. Impact of operating wood-burning fireplace ovens on indoor air quality. Chemosphere 2014, 103, 205–211. [Google Scholar] [CrossRef] [PubMed]
- Alves, C.; Gonçalves, C.; Fernandes, A.P.; Tarelho, L.; Pio, C. Fireplace and woodstove fine particle emissions from combustion of western Mediterranean wood types. Atmos. Res. 2011, 101, 692–700. [Google Scholar] [CrossRef]
- Calvo, A.I.; Tarelho, L.A.C.; Alves, C.A.; Duarte, M.; Nunes, T. Characterization of operating conditions of two residential wood combustion appliances. Fuel Process. Technol. 2014, 126, 222–232. [Google Scholar] [CrossRef]
- Moriske, H.J.; Drews, M.; Ebert, G.; Menk, G.; Scheller, C.; Schöndube, M.; Konieczny, L. Indoor air pollution by different heating systems: Coal burning, open fireplace and central heating. Toxicol. Lett. 1996, 88, 349–354. [Google Scholar] [CrossRef]
- Amouei Torkmahalleh, M.; Gorjinezhad, S.; Unluevcek, H.S.; Hopke, P.K. Review of factors impacting emission/concentration of cooking generated particulate matter. Sci. Total Environ. 2017, 586, 1046–1056. [Google Scholar] [CrossRef] [PubMed]
- Sysoltseva, M.; Winterhalter, R.; Frank, A.; Matzen, W.; Fembacher, L.; Scheu, C.; Fromme, H. Physicochemical characterization of aerosol particles emitted by electrical appliances. Sci. Total Environ. 2018, 619–620, 1143–1152. [Google Scholar] [CrossRef] [PubMed]
- Mečiarová, L.; Vilčeková, S.; Burdová, E.K.; Kiselák, J. Factors effecting the total volatile organic compound (TVOC) concentrations in slovak households. Int. J. Environ. Res. Public Health 2017, 14, 1443. [Google Scholar] [CrossRef] [PubMed]
- De Gennaro, G.; Dambruoso, P.R.; Di Gilio, A.; di Palma, V.; Marzocca, A.; Tutino, M. Discontinuous and continuous indoor air quality monitoring in homes with fireplaces orwood stoves as heating system. Int. J. Environ. Res. Public Health 2015, 13, 78. [Google Scholar] [CrossRef] [PubMed]
- Vicente, E.D.; Vicente, A.M.; Musa Bandowe, B.A.; Alves, C.A. Particulate phase emission of parent polycyclic aromatic hydrocarbons (PAHs) and their derivatives (alkyl-PAHs, oxygenated-PAHs, azaarenes and nitrated PAHs) from manually and automatically fired combustion appliances. Air Qual. Atmos. Health 2016, 9, 653–668. [Google Scholar] [CrossRef]
- Wan, M.-P.; Wu, C.-L.; Sze To, G.-N.; Chan, T.-C.; Chao, C.Y.H. Ultrafine particles, and PM 2.5 generated from cooking in homes. Atmos. Environ. 2011, 45, 6141–6148. [Google Scholar] [CrossRef]
- INE—Instituto Nacional de Estatística. Estatísticas da Construção e Habitação—2016; INE—Instituto Nacional de Estatística | Statistics: Lisboa, Portugal, 2017; ISBN 978-989-25-0394-3. [Google Scholar]
- INE—Instituto Nacional de Estatística Censos. 2011. Available online: http://censos.ine.pt (accessed on 12 March 2018).
- Statistical Software & Data Analysis Add-on for Excel—XLSTAT. Available online: www. xlstat.com (accessed on 11 January 2018).
- Ordinance No. 353-A/2013 (Portaria n.o 353-A/2013)—Regulamento de Desempenho Energético dos Edifícios de Comércio e Serviços (RECS)—Requisitos de Ventilação e Qualidade do ar Interior; Ministério do Ambiente, Ordenamento do Território e Energia, da Saúde e da Solidariedade, Emprego e Segurança Social: Lisboa, Portugal, 2013; p. 9.
- ISO 7730—Ergonomics of the Thermal Environment—Analytical Determina-Tion and Interpretation of Thermal Comfort Using Calculation of the PMV and PPD Indices and Local Thermal Comfort Criteria; International Organization for Standardization: Geneva, Switzerland, 2005.
- Ruas, F.; Mendonça, M.C.; Real, F.C.; Vieira, D.N.; Teixeira, H.M. Carbon monoxide poisoning as a cause of death and differential diagnosis in the forensic practice: A retrospective study, 2000–2010. J. Forensic Leg. Med. 2014, 24, 1–6. [Google Scholar] [CrossRef] [PubMed]
- Braubach, M.; Algoet, A.; Beaton, M.; Lauriou, S.; Héroux, M.E.; Krzyzanowski, M. Mortality associated with exposure to carbon monoxide in WHO European Member States. Indoor Air 2013, 23, 115–125. [Google Scholar] [CrossRef] [PubMed]
- Lippi, G.; Rastelli, G.; Meschi, T.; Borghi, L.; Cervellin, G. Pathophysiology, clinics, diagnosis and treatment of heart involvement in carbon monoxide poisoning. Clin. Biochem. 2012, 45, 1278–1285. [Google Scholar] [CrossRef] [PubMed]
- Sa, M.C.; Rodrigues, R.P.; Moura, D. Carbon monoxide intoxications in Portugal. Acta Med. Port 2011, 24, 727–734. [Google Scholar] [CrossRef] [PubMed]
- Vicente, E.D.; Alves, C.A. An overview of particulate emissions from residential biomass combustion. Atmos. Res. 2018, 199, 159–185. [Google Scholar] [CrossRef]
- Sarigiannis, D.A.; Karakitsios, S.P.; Gotti, A.; Liakos, I.L.; Katsoyiannis, A. Exposure to major volatile organic compounds and carbonyls in European indoor environments and associated health risk. Environ. Int. 2011, 37, 743–765. [Google Scholar] [CrossRef] [PubMed]
- Mcnamara, M.L.; Thornburg, J.; Semmens, E.O.; Ward, T.J.; Noonan, C.W. Reducing indoor air pollutants with air filtration units in wood stove homes. Sci. Total Environ. 2017, 592, 488–494. [Google Scholar] [CrossRef] [PubMed]
- Semmens, E.O.; Noonan, C.W.; Allen, R.W.; Weiler, E.C.; Ward, T.J. Indoor particulate matter in rural, wood stove heated homes. Environ. Res. 2015, 138, 93–100. [Google Scholar] [CrossRef] [PubMed] [Green Version]
- Nasir, Z.A.; Colbeck, I. Particulate pollution in different housing types in a UK suburban location. Sci. Total Environ. 2013, 445–446, 165–176. [Google Scholar] [CrossRef] [PubMed] [Green Version]
- Canha, N.; Lopes, I.; Vicente, E.D.; Vicente, A.M.; Bandowe, B.A.M.; Almeida, S.M.; Alves, C.A. Mutagenicity assessment of aerosols in emissions from domestic combustion processes. Environ. Sci. Pollut. Res. 2016, 23, 10799–10807. [Google Scholar] [CrossRef] [PubMed] [Green Version]
- Abdullahi, K.L.; Delgado-Saborit, J.M.; Harrison, R.M. Emissions and indoor concentrations of particulate matter and its specific chemical components from cooking: A review. Atmos. Environ. 2013, 71, 260–294. [Google Scholar] [CrossRef]
- He, C.; Morawska, L.; Hitchins, J.; Gilbert, D. Contribution from indoor sources to particle number and mass concentrations in residential houses. Atmos. Environ. 2004, 38, 3405–3415. [Google Scholar] [CrossRef] [Green Version]
- Castro, A.; Calvo, A.I.; Blanco-Alegre, C.; Oduber, F.; Alves, C.; Coz, E.; Amato, F.; Querol, X.; Fraile, R. Impact of the wood combustion in an open fireplace on the air quality of a living room: Estimation of the respirable fraction. Sci. Total Environ. 2018, 628–629, 169–176. [Google Scholar] [CrossRef] [PubMed]
- Naeher, L.P.; Smith, K.R.; Leaderer, B.P.; Neufeld, L.; Mage, D.T. Carbon monoxide as a tracer for assessing exposures to particulate matter in wood and gas cookstove households of highland Guatemala. Environ. Sci. Technol. 2001, 35, 575–581. [Google Scholar] [CrossRef] [PubMed]
- Canha, N.; Mandin, C.; Ramalho, O.; Wyart, G.; Ribéron, J.; Dassonville, C.; Hänninen, O.; Almeida, S.M.; Derbez, M. Assessment of ventilation and indoor air pollutants in nursery and elementary schools in France. Indoor Air 2016, 26, 350–365. [Google Scholar] [CrossRef] [PubMed]
- Strøm-Tejsen, P.; Zukowska, D.; Wargocki, P.; Wyon, D.P. The effects of bedroom air quality on sleep and next-day performance. Indoor Air 2016, 26, 679–686. [Google Scholar] [CrossRef] [PubMed]


| Characteristic | Dwelling 1 | Dwelling 2 | Dwelling 3 |
|---|---|---|---|
| Type | Apartment—two bedrooms | Detached house with four bedrooms | Terraced house with four bedrooms |
| Floor | Third | Ground | Ground and first |
| Area (m2) | 110 | 166 (within a private land of 5500 m2) | 180 with a small backyard |
| Height (m) | 2.80 | 2.80 | 2.80 |
| Construction year | 1999 | 1983 | 1990 |
| Walls | Brick with thermal isolation (air box) | Brick without any isolation | Brick without any isolation |
| Windows | Single-hung aluminum windows | Single-hung wood windows | Single-hung aluminum windows |
| Floor | Tiles (living room, hallway and kitchen) and parquet wood (bedrooms) | Tiles | Tiles |
| Gas | Piped natural gas | Bottled butane | Piped natural gas |
| Ventilation | Natural | Natural | Natural |
| Surroundings | Urban area, located near a moderate traffic street and with a restaurant on the ground floor | Semi-urban area, located near a low traffic street | Semi-urban area, located near a low traffic street |
| Use | Inhabited by 2 persons | Inhabited by 2 persons | Uninhabited and without furniture |
| Room | Dwelling | Characteristics |
|---|---|---|
| Kitchen | Dwelling 1 |
|
Dwelling 2 |
| |
| Living room | Dwelling 2 |
|
Dwelling 3 |
|
| Parameter | Limit Value |
|---|---|
| CO2 | 2250 mg·m−3 |
| CO | 10 mg·m−3 |
| VOCs | 0.6 mg·m−3 |
| CH2O | 0.1 mg·m−3 |
| PM10 | 50 µg·m−3 |
| PM2.5 | 25 µg·m−3 |
| Combustion Conditions | ||||
|---|---|---|---|---|
| Open Fireplace | Fireplace Insert | |||
| Pinewood | Briquettes | Pinewood | Briquettes | |
| Ratio PM2.5/PM10 | 0.85 ± 0.14 | 0.95 ± 0.07 | 0.89 ± 0.07 | 0.86 ± 0.10 |
© 2018 by the authors. Licensee MDPI, Basel, Switzerland. This article is an open access article distributed under the terms and conditions of the Creative Commons Attribution (CC BY) license (http://creativecommons.org/licenses/by/4.0/).
Share and Cite
Canha, N.; Lage, J.; Galinha, C.; Coentro, S.; Alves, C.; Almeida, S.M. Impact of Biomass Home Heating, Cooking Styles, and Bread Toasting on the Indoor Air Quality at Portuguese Dwellings: A Case Study. Atmosphere 2018, 9, 214. https://doi.org/10.3390/atmos9060214
Canha N, Lage J, Galinha C, Coentro S, Alves C, Almeida SM. Impact of Biomass Home Heating, Cooking Styles, and Bread Toasting on the Indoor Air Quality at Portuguese Dwellings: A Case Study. Atmosphere. 2018; 9(6):214. https://doi.org/10.3390/atmos9060214
Chicago/Turabian StyleCanha, Nuno, Joana Lage, Catarina Galinha, Susana Coentro, Célia Alves, and Susana Marta Almeida. 2018. "Impact of Biomass Home Heating, Cooking Styles, and Bread Toasting on the Indoor Air Quality at Portuguese Dwellings: A Case Study" Atmosphere 9, no. 6: 214. https://doi.org/10.3390/atmos9060214