The Impacts of Taklimakan Dust Events on Chinese Urban Air Quality in 2015


1
SKLLQG, Institute of Earth Environment, Chinese Academy of Sciences, 97 Yanxiang Road, Xi’an 710061, China
2
College of Resources and Environment, University of Chinese Academy of Sciences, 19 Yuquan Road, Beijing 100049, China
3
College of Earth Science, University of Chinese Academy of Sciences, 19 Yuquan Road, Beijing 100049, China
4
Department of Environmental & Ocean Sciences, University of San Diego, 5998 Alcalá Park, San Diego, CA 92110, USA
*
Authors to whom correspondence should be addressed.
Atmosphere 2018, 9(7), 281; https://doi.org/10.3390/atmos9070281
Submission received: 5 July 2018
/
Revised: 14 July 2018
/
Accepted: 17 July 2018
/
Published: 19 July 2018
(This article belongs to the Special Issue Air Quality in China: Past, Present and Future)
Abstract
:Aerosols are an important factor affecting air quality. As the largest source of dust aerosol of East Asia, the Taklimakan Desert in Northwest China witnesses frequent dust storm events, which bring about significant impacts on the downstream air quality. However, the scope and timing of the impacts of Taklimakan dust events on Chinese urban air quality have not yet been fully investigated. In this paper, based on multi-source dust data including ground observations, satellite monitoring, and reanalysis products, as well as air quality index (AQI) and the mass concentrations of PM10 and PM2.5 at 367 urban stations in China for 2015, we examined the temporal and spatial characteristics of the impacts of the Taklimakan dust events on downstream urban air quality in China. The results show that the Taklimakan dust events severely affected the air quality of most cities in Northwest China including eastern Xinjiang, Hexi Corridor and Guanzhong Basin, and even northern Southwest China, leading to significant increases in mass concentrations of PM10 and PM2.5 in these cities correlating with the occurrence of dust events. The mass concentrations of PM10 on dust days increased by 11–173% compared with the non-dust days, while the mass concentration of PM2.5 increased by 21–172%. The increments of the mass concentrations of PM10 and PM2.5 on dust days decreased as the distances increased between the cities and the Taklimakan Desert. The influence of the Taklimakan dust events on the air quality in the downstream cities usually persisted for up to four days. The mass concentrations of PM10 and PM2.5 increased successively and the impact duration shortened gradually with increasing distances to the source area as a strong dust storm progressed toward the southeast from the Taklimakan Desert. The peaks of the PM10 concentrations in the downstream cities of eastern Xinjiang, the Hexi Corridor and the Guanzhong Basin occurred on the second, third and fourth days, respectively, after the initiation of the Taklimakan dust storm.
1. Introduction
In recent years, global air quality and atmospheric pollution and their impacts on climate and environment have received extensive attention [1]. In East Asia, particulate air pollutants, including PM10 and PM2.5 (particulate matter with aerodynamic diameter less than 10 mm and 2.5 mm, respectively), and various gaseous pollutants such as sulfur dioxide (SO2), nitrogen dioxide (NO2) [2,3,4], which have arisen from accelerating economic growth and urbanization, have brought about a series of environmental problems [5,6]. Besides anthropogenic pollution sources like industrial production, transportation and human domestic activities, the air pollution sources also include natural sources, especially aeolian dust. As a type of aerosol, aeolian dust is not only an important source of atmospheric particulate matter (PM), a natural factor influencing the concentration of air pollutants through a series of chemical reactions in the downstream areas [7,8], but also a significant risk factor for human health, which is closely associated with the morbidity of respiratory and cardiovascular diseases [9,10,11]. Under the condition of a favorable large-scale circulation background and superimposed weather systems of different scales in arid and semi-arid regions, severe dust storms can develop into disastrous events and have seriously affected the air quality of the source and downstream regions [12,13,14], human health [15,16,17], cloud microphysics [18], climate system [19,20], and even marine ecosystems [21,22].
Global dust emission estimates range from 1000 Tg year−1 to 2000 Tg year−1, and the atmospheric load is estimated as 8–36 Tg [20,23]. The Gobi Desert in Mongolia and the Taklimakan and Badain Juran Desert in northwestern China contribute approximately 70% of the total Asian dust emissions [24]. Each year, about 800 Tg of desert dust in China is emitted into the atmosphere, and approximately 30% of it is redeposited back onto the deserts and 20% is transported to various regions in East Asia, while the remaining 50% is the long-range transport to the Pacific Ocean and beyond [25]. Dust materials from the Taklimakan Desert can be transported more than one circle around the globe in two weeks in the upper troposphere around 8–10 km above the earth’s surface [26].
Most dust storms in China originate from the Taklimakan Desert, the Hexi Corridor, and the desert regions in the central and western Inner Mongolia [27,28,29] (Figure 1a). The Taklimakan Desert is located in the Tarim Basin in southern Xinjiang, China, and it is a main dust storm center and a source of loess sediments in China [30]. Results from a simulation study show that the Taklimakan Desert contributes 21% of the total dust emissions in Asia [24]. Due to the abundant material supplied on the underlying surface, the dry climate and lack of vegetation, as well as strong cold air activities in winter and spring seasons, the frequency of dust events in the Taklimakan region is very high [31]. According to the China Meteorological Administration (CMA) [32], dust events can be divided into three categories: blowing dust, floating dust, and dust storms that can be further classified into moderate and strong events. Wang et al. [33] pointed out that dust events occurred most frequently in the Southern Xinjiang Basin: the 47-year (1954–2000) mean annual occurrence of dust storms was 13.6 days, blowing dust 41.4 days, and floating dust 94.4 days. In particular, the dust storms and floating dust events occur with a higher frequency in the Southern Xinjiang Region than in other areas of China.
For decades since the initial research on the impacts of the Saharan dust in North Africa on the PM10 and total suspended particle concentrations and the environmental processes in North America and Europe [34,35], many studies have been carried out on dust pollution in urban areas [36,37], including the impacts of East Asian dust minerals on air quality in the local and downstream regions [38,39,40,41,42]. These studies showed that dust events in China had a great influence on the urban air quality in the source and downstream impact areas. The occurrence of dust events was often accompanied with the increases in the Air Pollution Index (API), aerosol optical depth (AOD), and the mass concentration of PM10, and a decrease in visibility in the affected areas [38,39,40]. For example, the mass concentration of PM10 (PM2.5) in Beijing during dust events could reach 5–10 (~4) times that of non-dust days, and the period of high concentration of PM10 could last for about 14 h [41]. The PM10 mass concentration on dust days in Lanzhou in northwestern China was significantly higher than that on non-dust days and the averages of the spring season [42]. In addition, dust aerosols from the arid and semi-arid regions of China and Mongolia could be transported to the east over long distances by the westerly circulation, thus affecting the atmospheric environmental quality in Taiwan, Korea, Japan, and the North Pacific [43,44,45,46]. A recent study also revealed that the mass concentrations of PM10 in Taipei and Kaohsiung of Taiwan during Asian dust events were 3–5 times those of non-dust days [47]. Zhao et al. [48] found that trans-Pacific transport of Asian dust may even affect the ambient PM levels in North America. Their results indicated that the number of dust storms in China has a high correlation with the variability in background PM10 concentration over western North America.
Due to the availability of observational data, many previous studies have been dedicated to specific case studies of one dust event and its impact on the urban air quality, or the effects of several dust processes on air pollution of a city, such as Lanzhou [42], or Shanghai [49]. Few studies have analyzed the overall impacts, especially the temporal and spatial characteristics, of several dust events on urban air quality over wide areas in China. Guan et al. [50] selected a massive dust storm in 2014 and comprehensively analyzed the changes in the PM concentration from west to east in Gansu Province during this dust event. There were dramatic increases in PM10 and PM2.5 concentration with the arrival of dust events, but the increment and magnitude of PM2.5 concentration were much smaller than those of PM10. With the improvement of atmospheric environmental monitoring in China, especially the nationwide monitoring of PM2.5 since 2014, we now have access to the nationwide urban air quality data, including the mass concentrations of PM10, PM2.5, SO2, CO, NO2 and O3 that serve as the basis for the calculation of the air quality index (AQI). Meanwhile, we also have various sources of dust data, including the observational weather data from meteorological stations, AOD from satellites, and dust concentration data from model reanalysis. By using these multi-source dust data and abundant air quality data, we can systematically analyze the impact of dust activities in the Taklimakan region in 2015 on the air quality in major Chinese cities, with a focus on the spatial extent of the impacts, time-lag relationship, and the differences among cities in various geographic areas. Through such analyses, we can reveal the patterns of the timing and spatial scope of the effects of major dust events from the source region on the air quality across mainland China.
2. Materials and Methods
2.1. Dust Data
In this study, we use three sources of dust data during the whole year of 2015, including dust weather phenomena and visibility from ground meteorological stations, satellite-obtained AOD, and dust concentration from a reanalysis system, to describe dust events in the Taklimakan Desert in 2015.
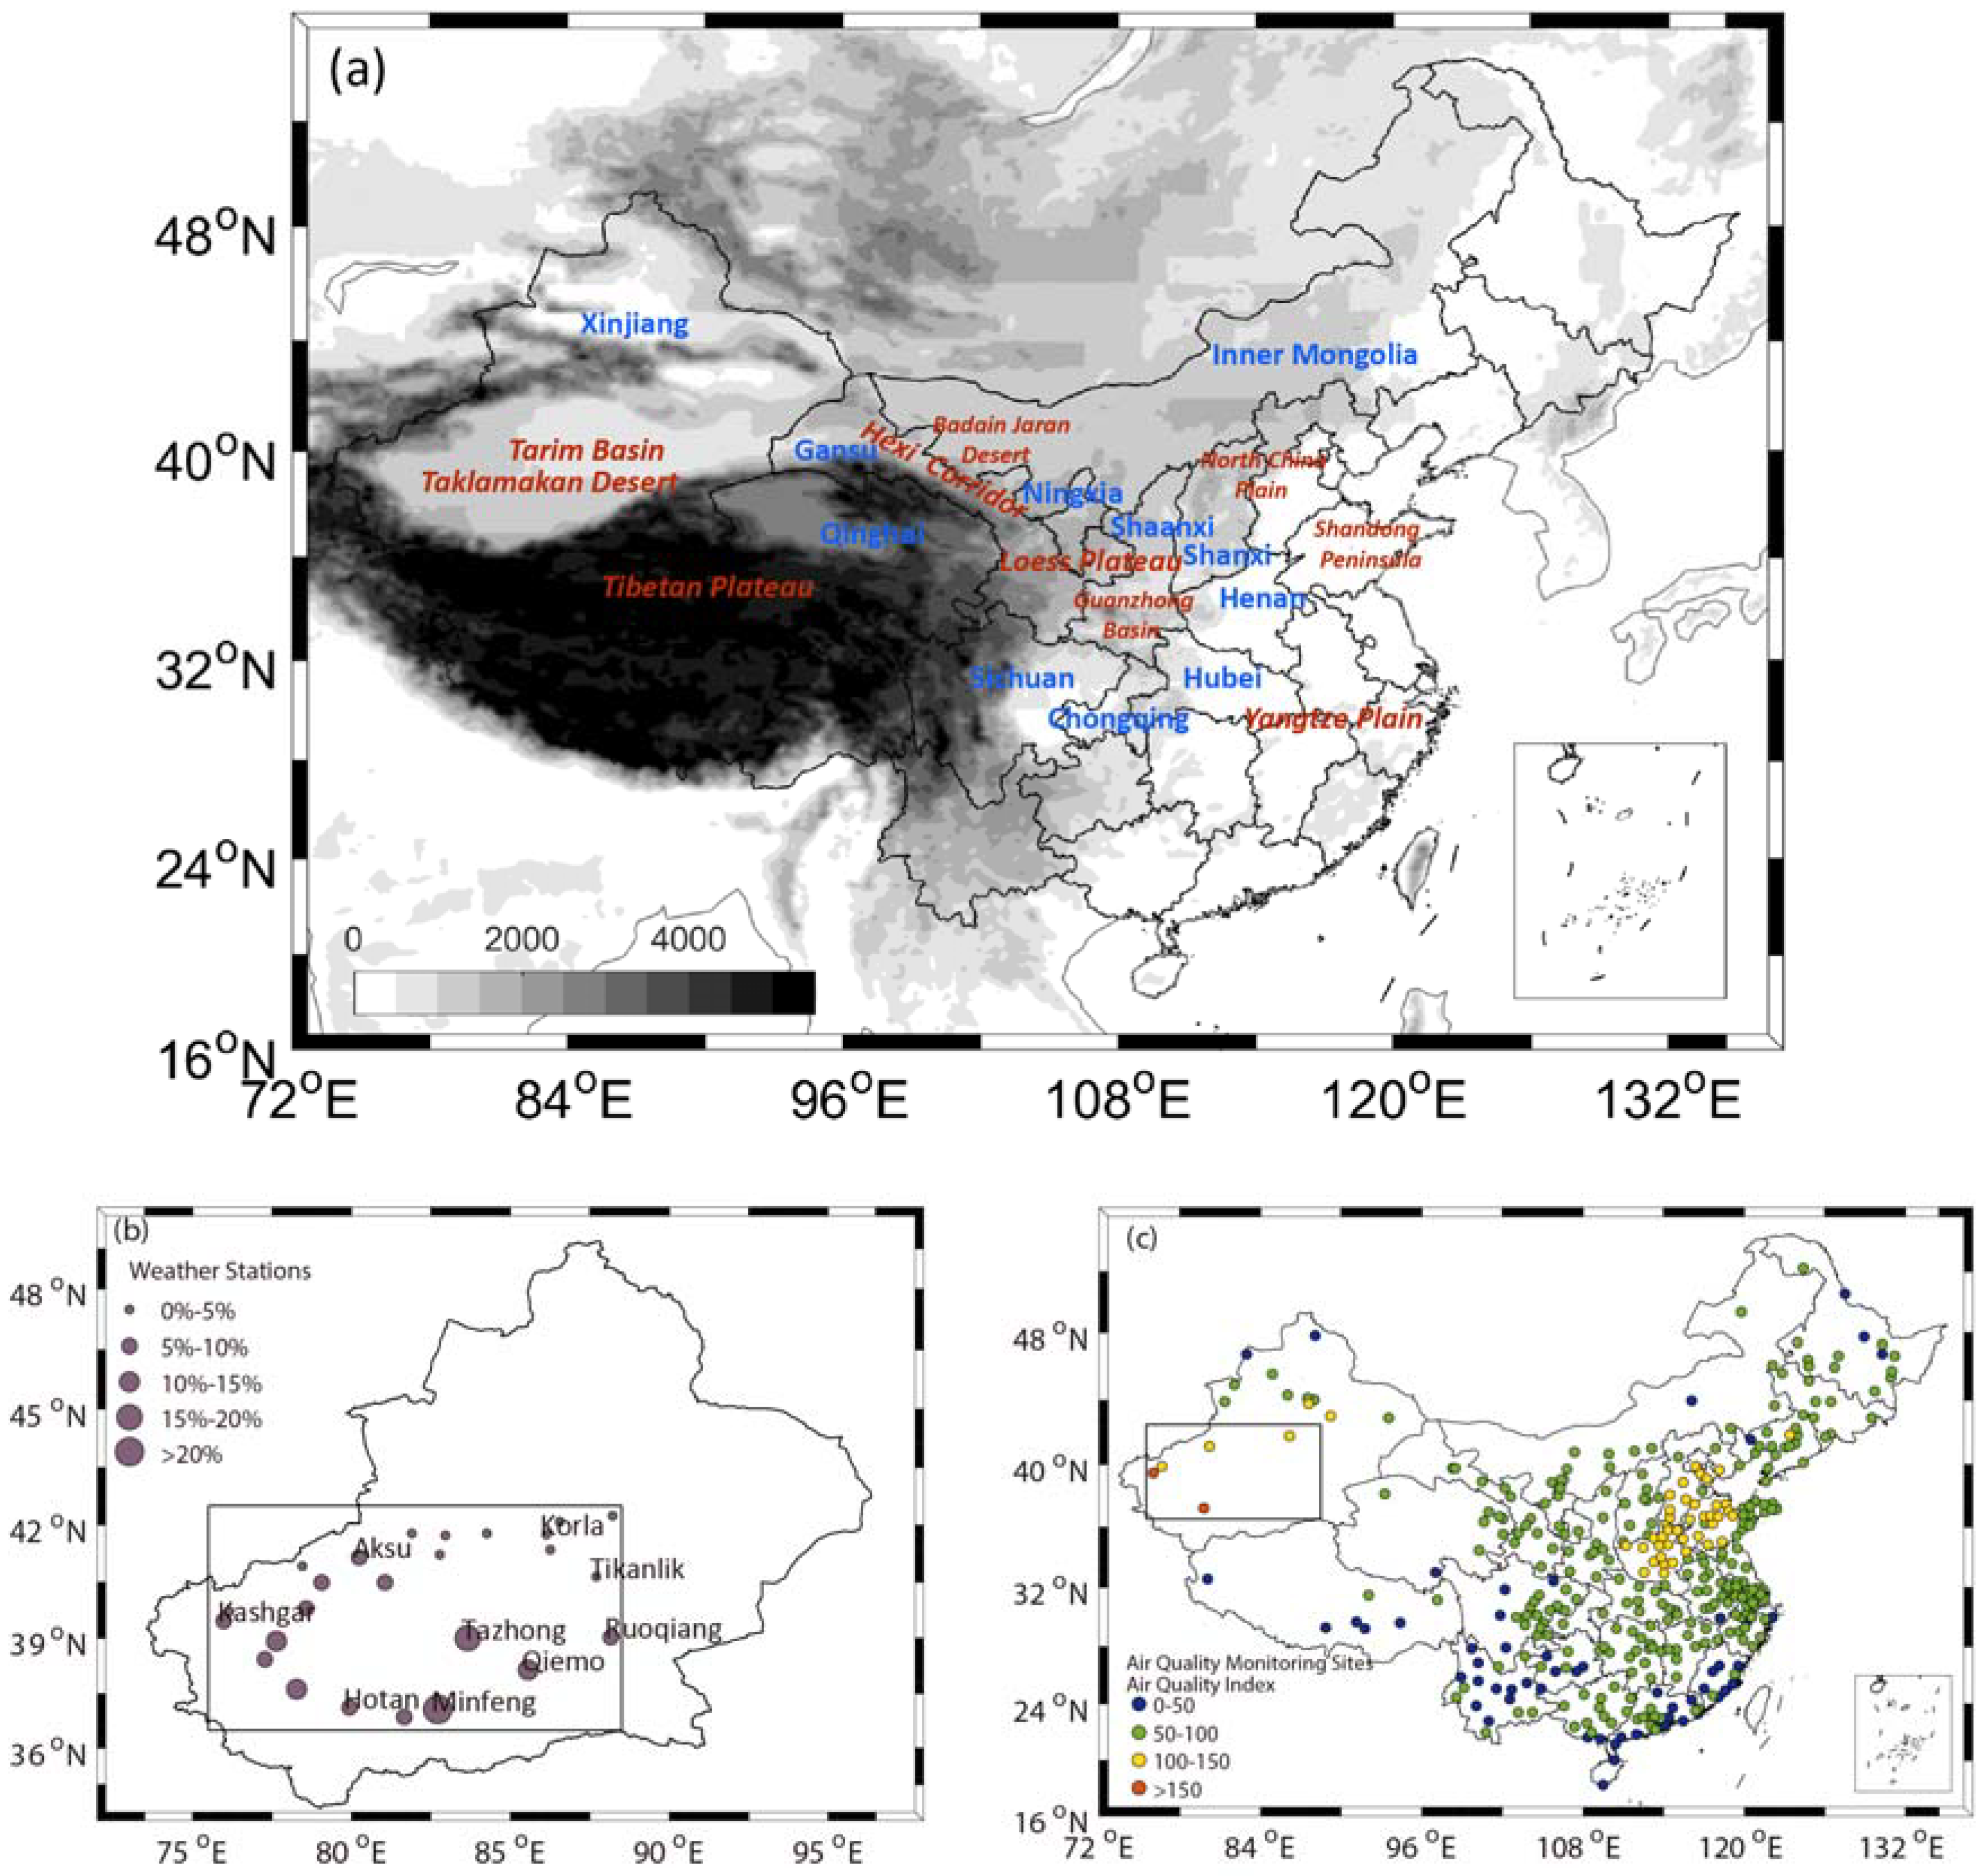
The observed 3-hourly dust weather phenomena (floating dust, blowing dust, sandstorm, and strong sandstorm) and visibility are collected from the ground meteorological stations of CMA (http://data.cma.cn/). There are 25 meteorological stations in the Taklimakan region (75.5°–88.5° E, 36.5°–42.5° N). Figure 1b shows the locations of the 25 stations and the corresponding frequencies of dust events that occurred in 2015. For any given site, the frequency of occurrence of all dust events is defined by the percent of the number of observations of dust events to the total number of weather records. Minfeng (82.71° E, 37.06° N) is the city where dust events occurred most frequently, with a frequency exceeding 20%.
The 550 nm AOD data are taken from the Level-3 Moderate Resolution Imaging Spectroradiometer (MODIS) Collection – 6: Atmosphere Daily Global Products of the Aqua platform with the spatial resolution of 1.0° × 1.0° (https://modaps.modaps.eosdis.nasa.gov/services/about/products/c61/MYD08_D3.html). The Deep Blue aerosol retrieval algorithm provides the information about aerosol optical properties over bright-reflecting land surfaces, such as desert, semiarid, and urban regions, especially the properties of dust aerosol near surface [51,52]. The C6 algorithm improves the estimate of surface reflectance and adds thermal infrared channels to develop a better dust aerosol selection scheme [53]. Hence, we use the MODIS C6 deep blue 550 nm AOD product as an indicator of the occurrence of dust events in the Taklimakan Desert.
Dust concentration data used in this study are obtained from the Modern-Era Retrospective Analysis for Research and Applications, version 2 (MERRA-2), which is the latest atmospheric reanalysis of the modern satellite era produced by NASA’s Global Modeling and Assimilation Office [54]. Aerosols in MERRA-2 are simulated with a radiatively coupled version of the Goddard Chemistry, Aerosol, Radiation and Transport Model and includes assimilation of AOD from various ground- and space-based remote sensing platforms. MERRA-2 provides aerosol mass concentration, optical properties, and other aerosol diagnostics [55]. Previous studies have shown that the daily-mean dust surface concentration of MERRA-2 has a high degree of correlation with the observed dust surface mass concentration and the long-term dust surface concentration seasonal cycle in Sahara is well simulated [56]. In this paper, we use the daily dust surface concentration in 2015 offered by the MERRA-2 aerosol products with the horizontal resolution of 0.5° latitude × 0.625° longitude.
2.2. Air Quality Data
The air quality data come from the China National Environmental Monitoring Centre (http://www.cnemc.cn), including the hourly AQI, and the mass concentrations of PM2.5 and PM10 of 367 cities in China in 2015. The AQI quantifies the air quality status by integrating the maximum values of the component air quality indices of individual pollutants (with ranges of 0–500), including PM2.5, O3, PM10, SO2, NO2, and CO, into a comprehensive dimensionless index. The detailed calculation method and level classification are based on the Technical Regulation on Ambient Air Quality Index (on trial) HJ 633-2012 issued by the Ministry of Environmental Protection of China (http://kjs.mep.gov.cn/hjbhbz/bzwb/jcffbz/201203/t20120302_224166.shtml) [57]. Figure 1c shows the distribution of air quality monitoring stations and the mean AQI in 2015. The two regions with high AQI values are the Taklimakan Desert and North China, which correspond to intense dust emission in the source region and strong anthropogenic pollution at the regional scale, respectively.
2.3. Data of the Atmospheric Circulation
To analyze the atmospheric circulation processes associated with the dust events, wind field datasets are obtained from the European Centre for Medium-Range Weather Forecasts (ECMWF) global atmospheric reanalysis dataset ERA-Interim [58]. This paper only took 700 hPa level wind data in 2015, which are updated every six hours per day (00, 06, 12, 18 UTC) with a spatial resolution of 1.5° × 1.5°.
2.4. Definition of Dust Index
We defined the Taklimakan Dust Index (DI) based on existing literature and the observational dust weather phenomena. McTainsh et al. [59] and Loingsigh et al. [60] provided a composite Dust Storm Index to measure the frequency and intensity of wind erosion events in Australia. According to the weather codes defined by World Meteorological Organization, dust events were divided into severe dust storms, moderate dust storms, and local dust events. Then, each of the three types was assigned a weight based on the measured dust concentrations in relation to visibility [60]. Based on the observational fact that near-surface total suspended particulates rapidly increased with decreasing visibility, Shao et al. [61] estimated dust concentration (C) from visibility using an empirical relationship in northeast Asia:
where is dust concentration in μg m−3, and is visibility in km. A similar approach was used by Song et al. [62] to calculate mass concentration of PM10 based on visibility data.
Using Shao’s method, we estimated the near-ground dust concentration of the Taklimakan region with the station-observed visibility data during four different types of dust events (Floating Dust, Blowing Dust, Dust Storm, and Strong Dust Storm) in 2015. The classification of dust events was based on the codes of present weather phenomena defined by the CMA [63]. These calculations give the dust event weightings (, , and ) used in the Taklimakan DI equation, as shown in (3):
where is the daily Dust Index based on the total meteorological stations recording a dust event for each day in the Taklimakan region. , , , and represent the times of Floating Dust, Blowing Dust, Dust Storm, and Strong Dust Storm recorded in one day, respectively, for the -th station.
2.5. Statistical Methods
Pearson correlation analysis [64] is used to determine whether air quality in the downstream areas is related to the dust events from the Taklimakan source region. To examine whether the dust emission and transport processes would produce any lagged effects on the downstream regions, we also conducted correlation analysis by lagging the downstream air quality data by 1 to 3 days from the Taklimakan dust events. The strongest dust event in spring of 2015 was used as an example to illustrate the relationship between the Taklimakan dust events and air quality of the downstream cities. Additionally, we constructed a composite dust event by averaging the AQI and mass concentrations of PM10 and PM2.5 of the downstream cities for the first 5 days of the individual major dust events in the Taklimakan region during spring of 2015, which allows us to examine the general pattern of the responses of air quality in the downstream areas to a composite dust event.
3. Results
3.1. Taklimakan Dust Events in 2015
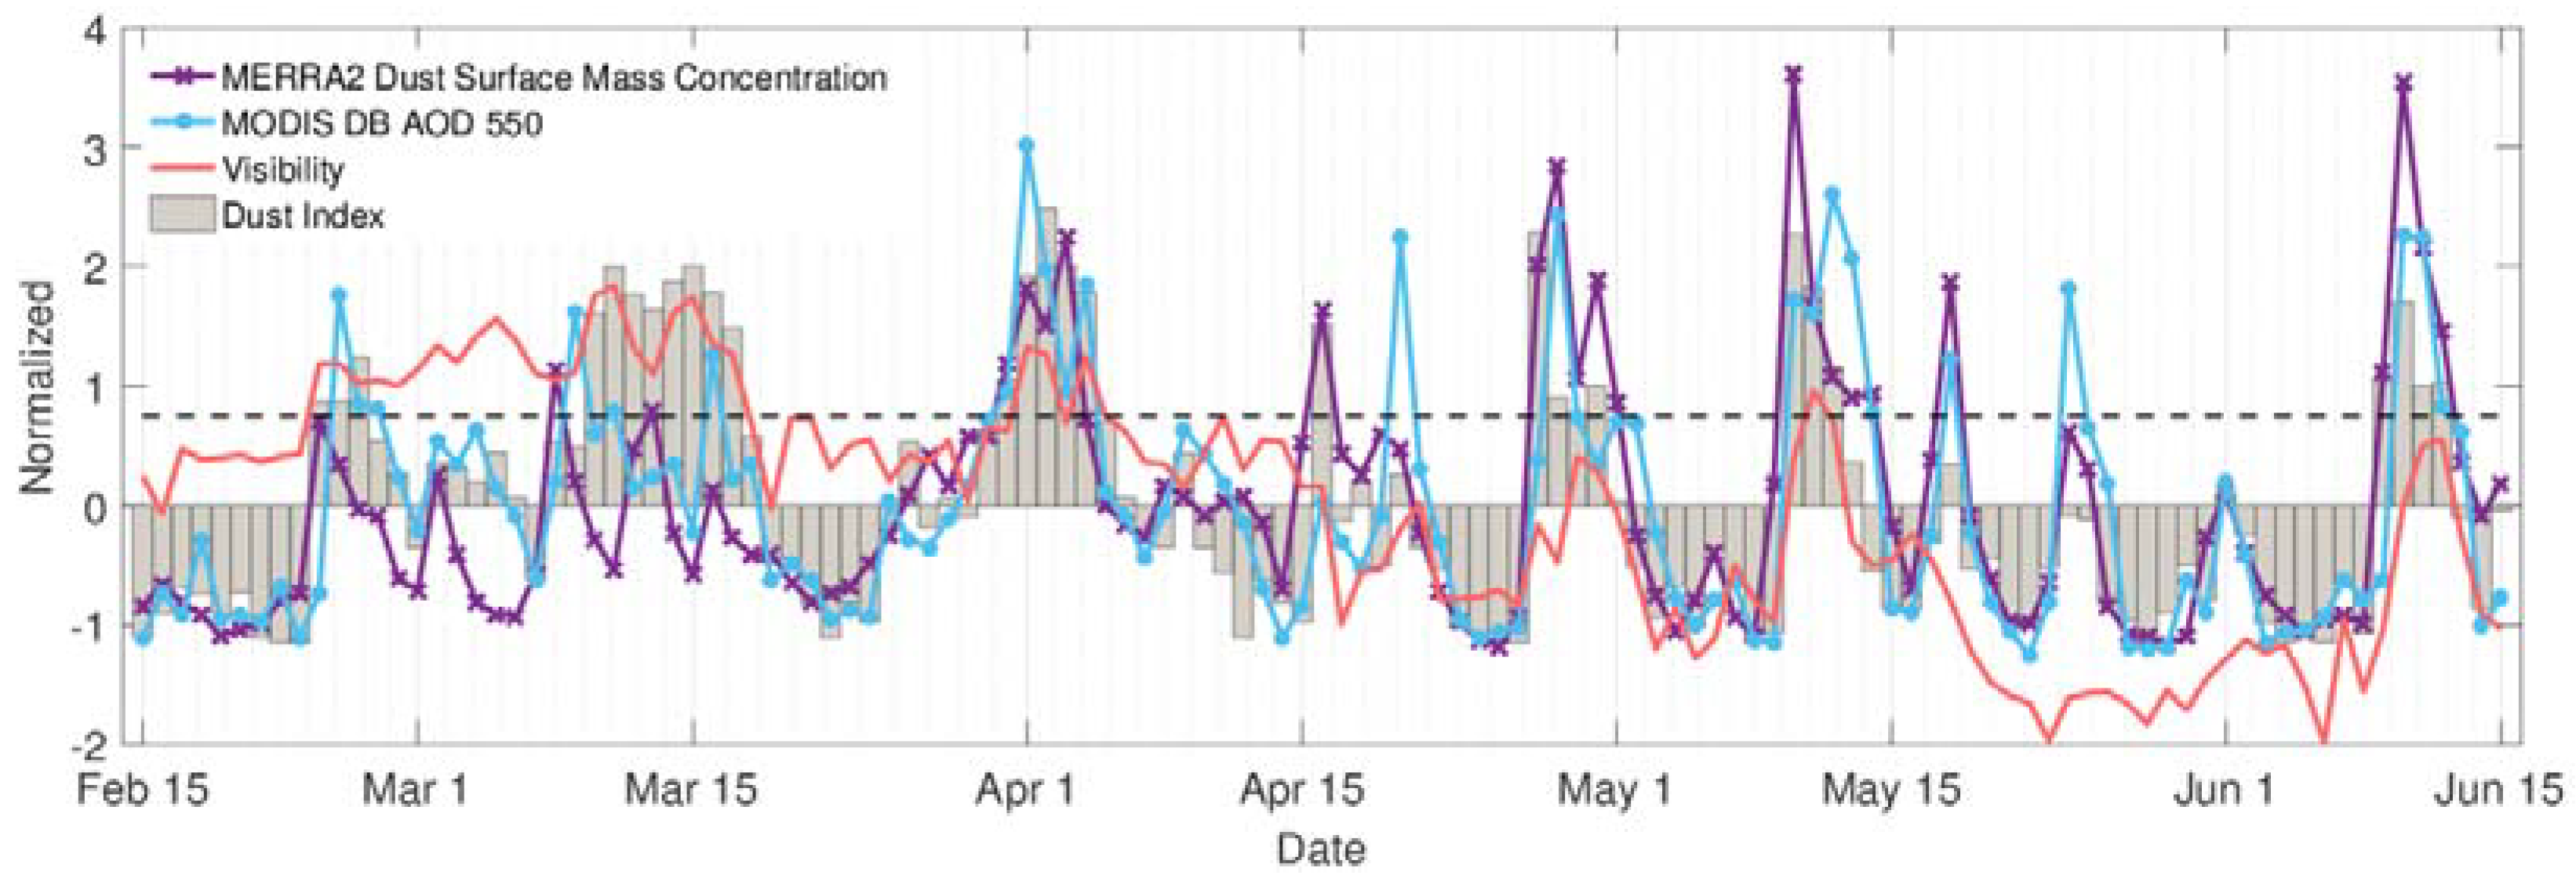
Typical dust events in the Taklimakan region can be defined with the various sources of dust information as described above. Considering that dust events mainly occurred in the spring [40], four independent types of data: the daily Taklimakan DI, mean visibility of all weather stations in the Taklimakan region, MODIS Deep Blue 550 nm AOD, and MERRA-2 dust surface mass concentration from February 15 to June 15 were compared (Figure 2). It can be seen that the fluctuations of the normalized series of DI, AOD, dust concentration and visibility were consistent with each other. Correlation analysis indicated that the normalized DI had a positive relationship with AOD and surface dust concentration (R = 0.73 and 0.70 respectively), and a negative relationship with visibility (R = −0.58). Thus, the DI series should well reflect the dust activities in the Taklimakan source region.
In the following we determine dust days in the source region on the basis of the normalized DI. Dust days was defined as those with the normalized value of the DI exceeding 0.75 (DI values larger than 45.32). There were 27 dust days during the study time period totally, with six relatively well-defined dust events (Figure 2 and Table 1), which corresponded well to the dust weather processes of southern Xinjiang in 2015 identified by CMA [65]. The longest duration of dust events was 8 days from March 10 to March 17. The maximum of DI was 86.76, which occurred on April 2 belonging to the strongest dust event lasting from March 31 to April 4 in the spring of 2015 in the Taklimakan Desert. Although there was a high value of DI on April 15 (Figure 2), it was not considered a dust event since it lasted for only one day and was not accompanied by low visibility and high AOD levels in the Taklimakan region.
3.2. Correlation Analysis between the Taklimakan DI and Downstream Air Quality
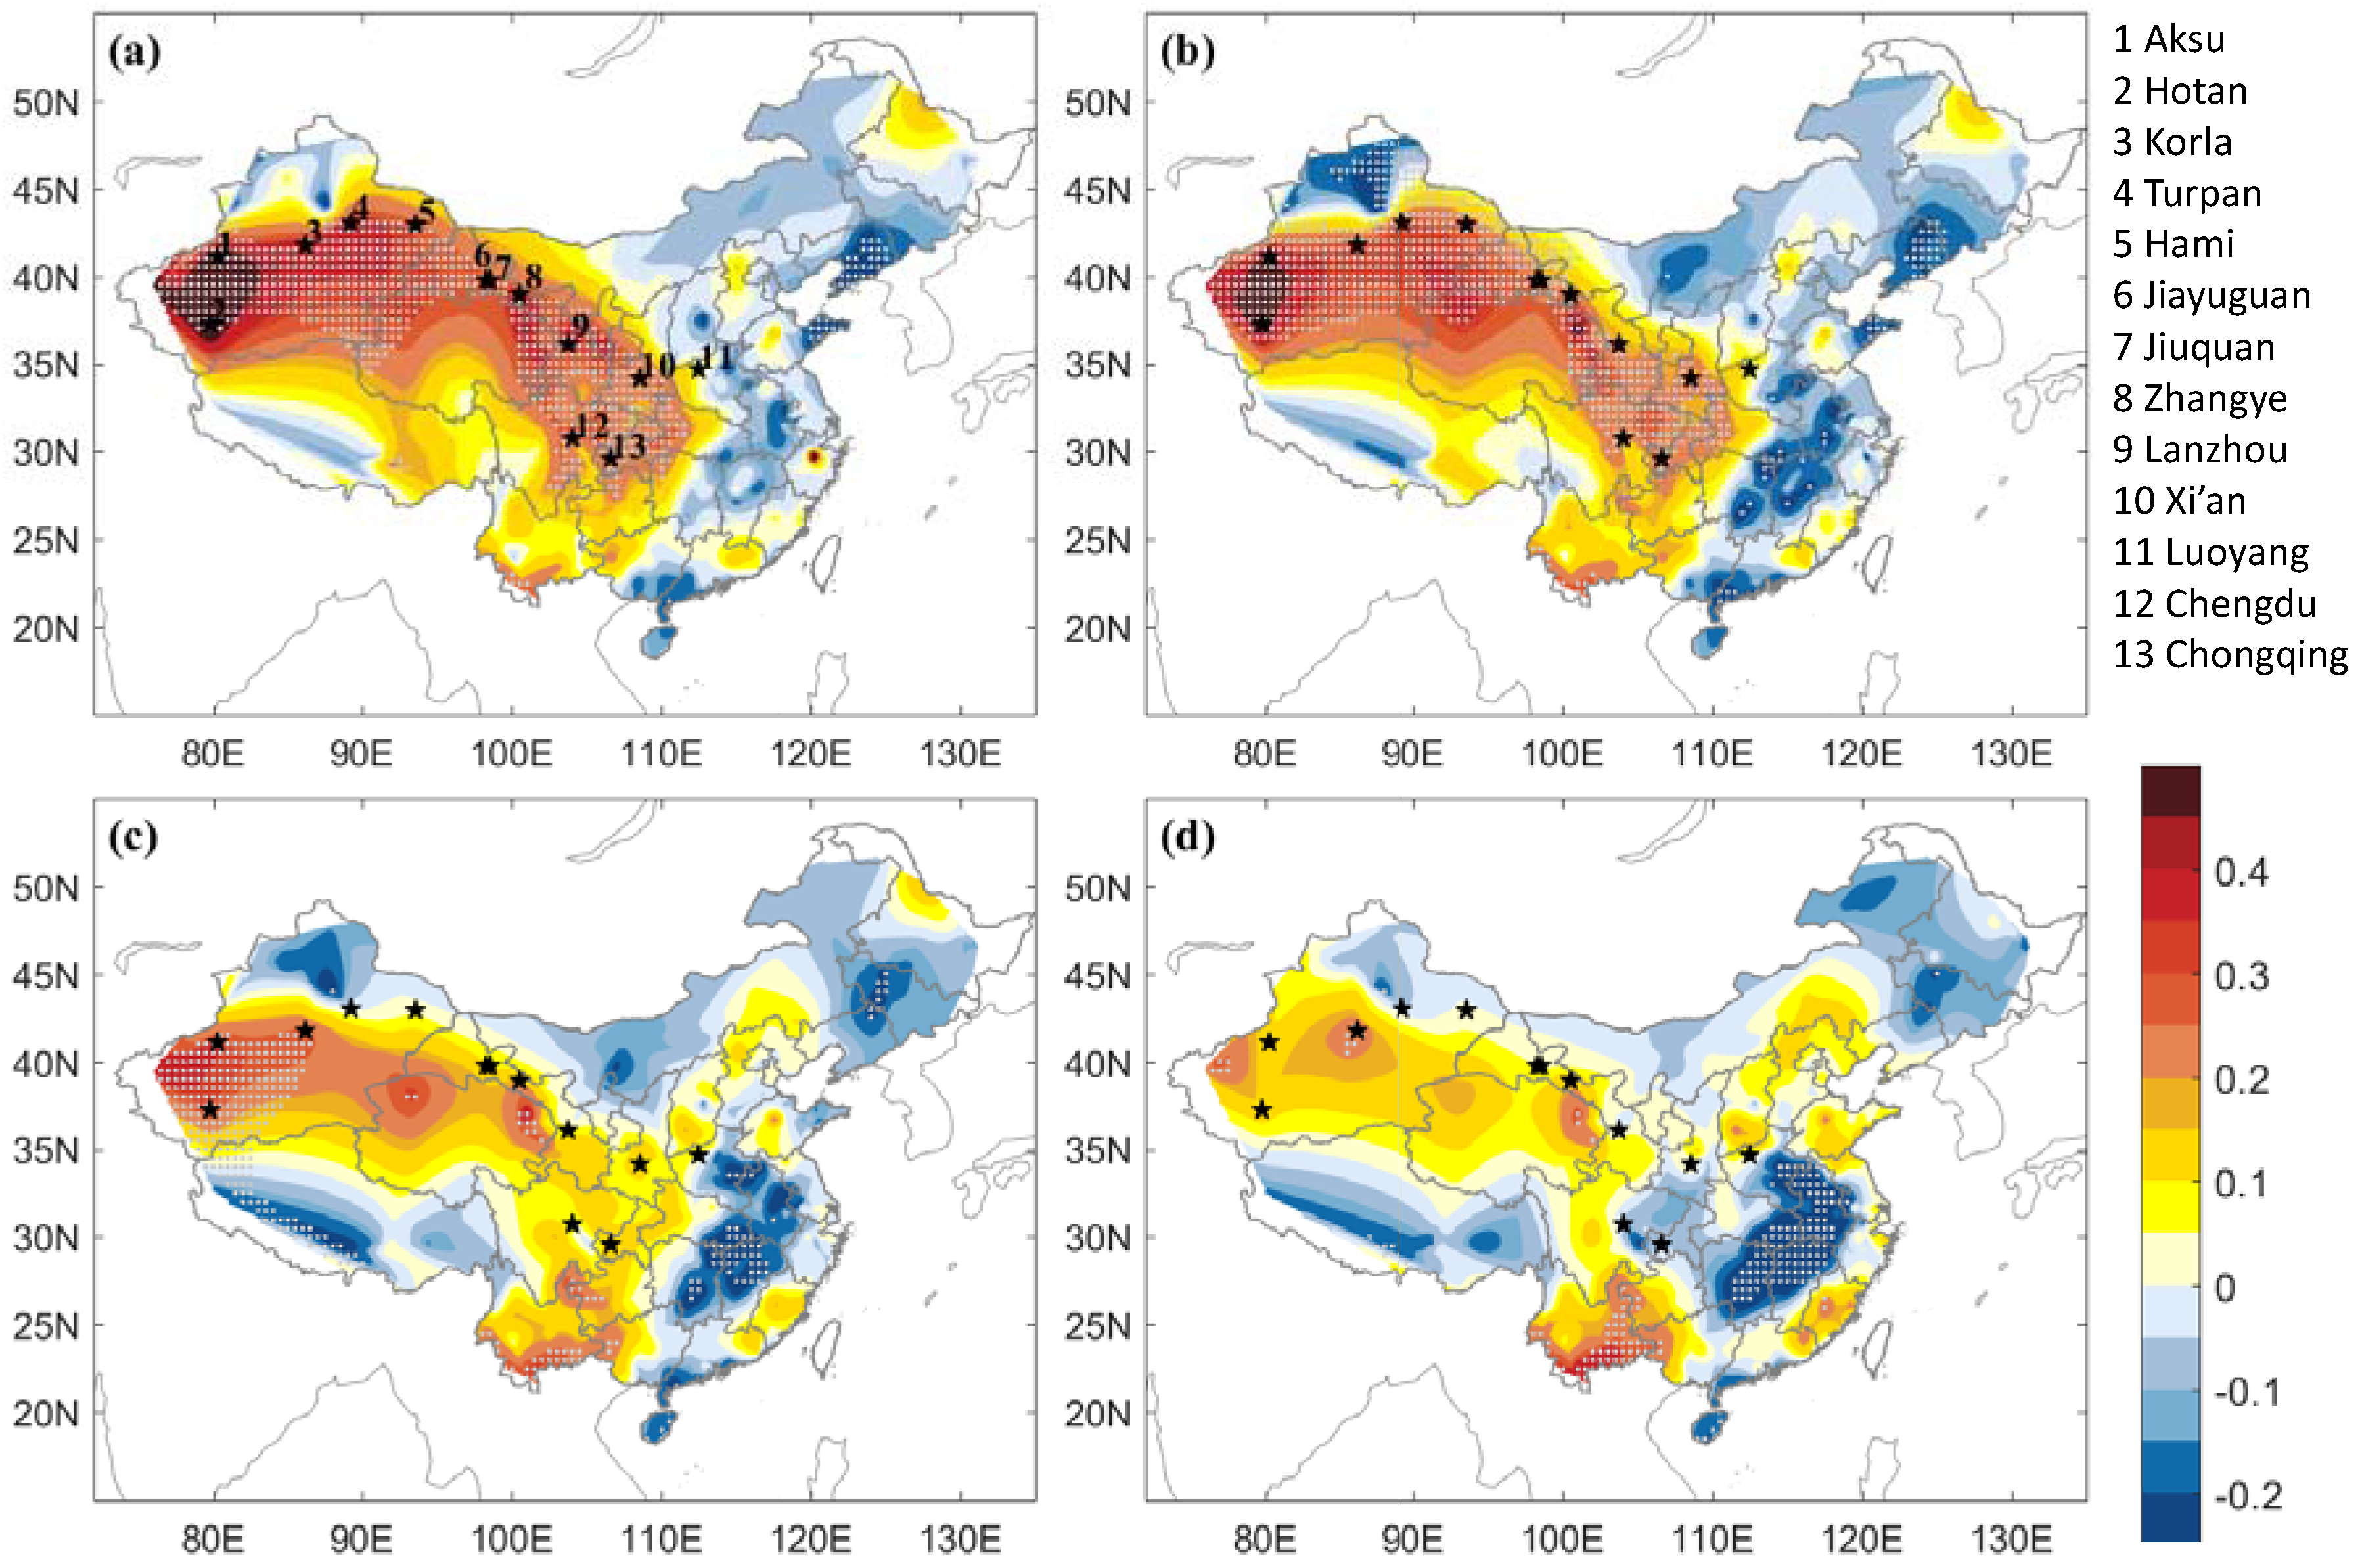
The relationship between Taklimakan dust activities and variations of air quality in Chinese cities can be shown through correlation analysis. From the distribution of simultaneous correlation coefficients between the daily DI in the Taklimakan Desert and daily mean mass concentration of PM10 in Chinese cities for 121 days from February 15 to June 15 (Figure 3a), air quality of many cities shows high correlations with the dust in the source area. There was a maximum area of correlation in the western Taklimakan Desert, with positive correlation coefficients exceeding 0.45. High correlations were also found in eastern Xinjiang, Hexi Corridor, and eastern Qinghai. The high correlation areas above the 95% confidence level extended along the northeastern edge of the Tibetan Plateau to the northeast of Sichuan, Chongqing, southern Shaanxi, and western Hubei. This suggests that the PM10 concentrations in these areas were closely related to the variation of the DI in the source area. In other words, the intensification of dust activity in the Taklimakan area would lead to the increases in the mass concentration of PM10 in the downstream cities of northwestern China, and also possibly affected some areas in southwestern and central China. However, it has a relatively small impact on most parts of eastern China.
By examining the spatial distributions of lag correlation coefficients between the DI and PM10 mass concentration, we found that the Taklimakan dust activity also had significant effects on the air quality lagging behind for several days. The spatial distribution of the 1-day lagged correlation coefficients (Figure 3b) is approximately similar to that of the simultaneous correlations (Figure 3a). There existed a region of high positive coefficients in the western Taklimakan, while new high-correlation centers occurred in the downstream areas. The correlation coefficients exceeded 0.35 in eastern Xinjiang, eastern Qinghai and northern Sichuan, while the positive correlations in the eastern parts of northwestern China such as Gansu, Ningxia and Shaanxi all decreased. Correlations with 2-day (Figure 3c) and 3-day (Figure 3d) lags indicated that the scope and strength of positive correlations in the northwest reduced with time, although areas of positive correlations without passing the 95% confidence level appeared in Shanxi and parts of northern China. In fact, the correlations between the DI and the mass concentration of PM10 in the downstream areas lagged for more than 3 days later were very weak (figures omitted).
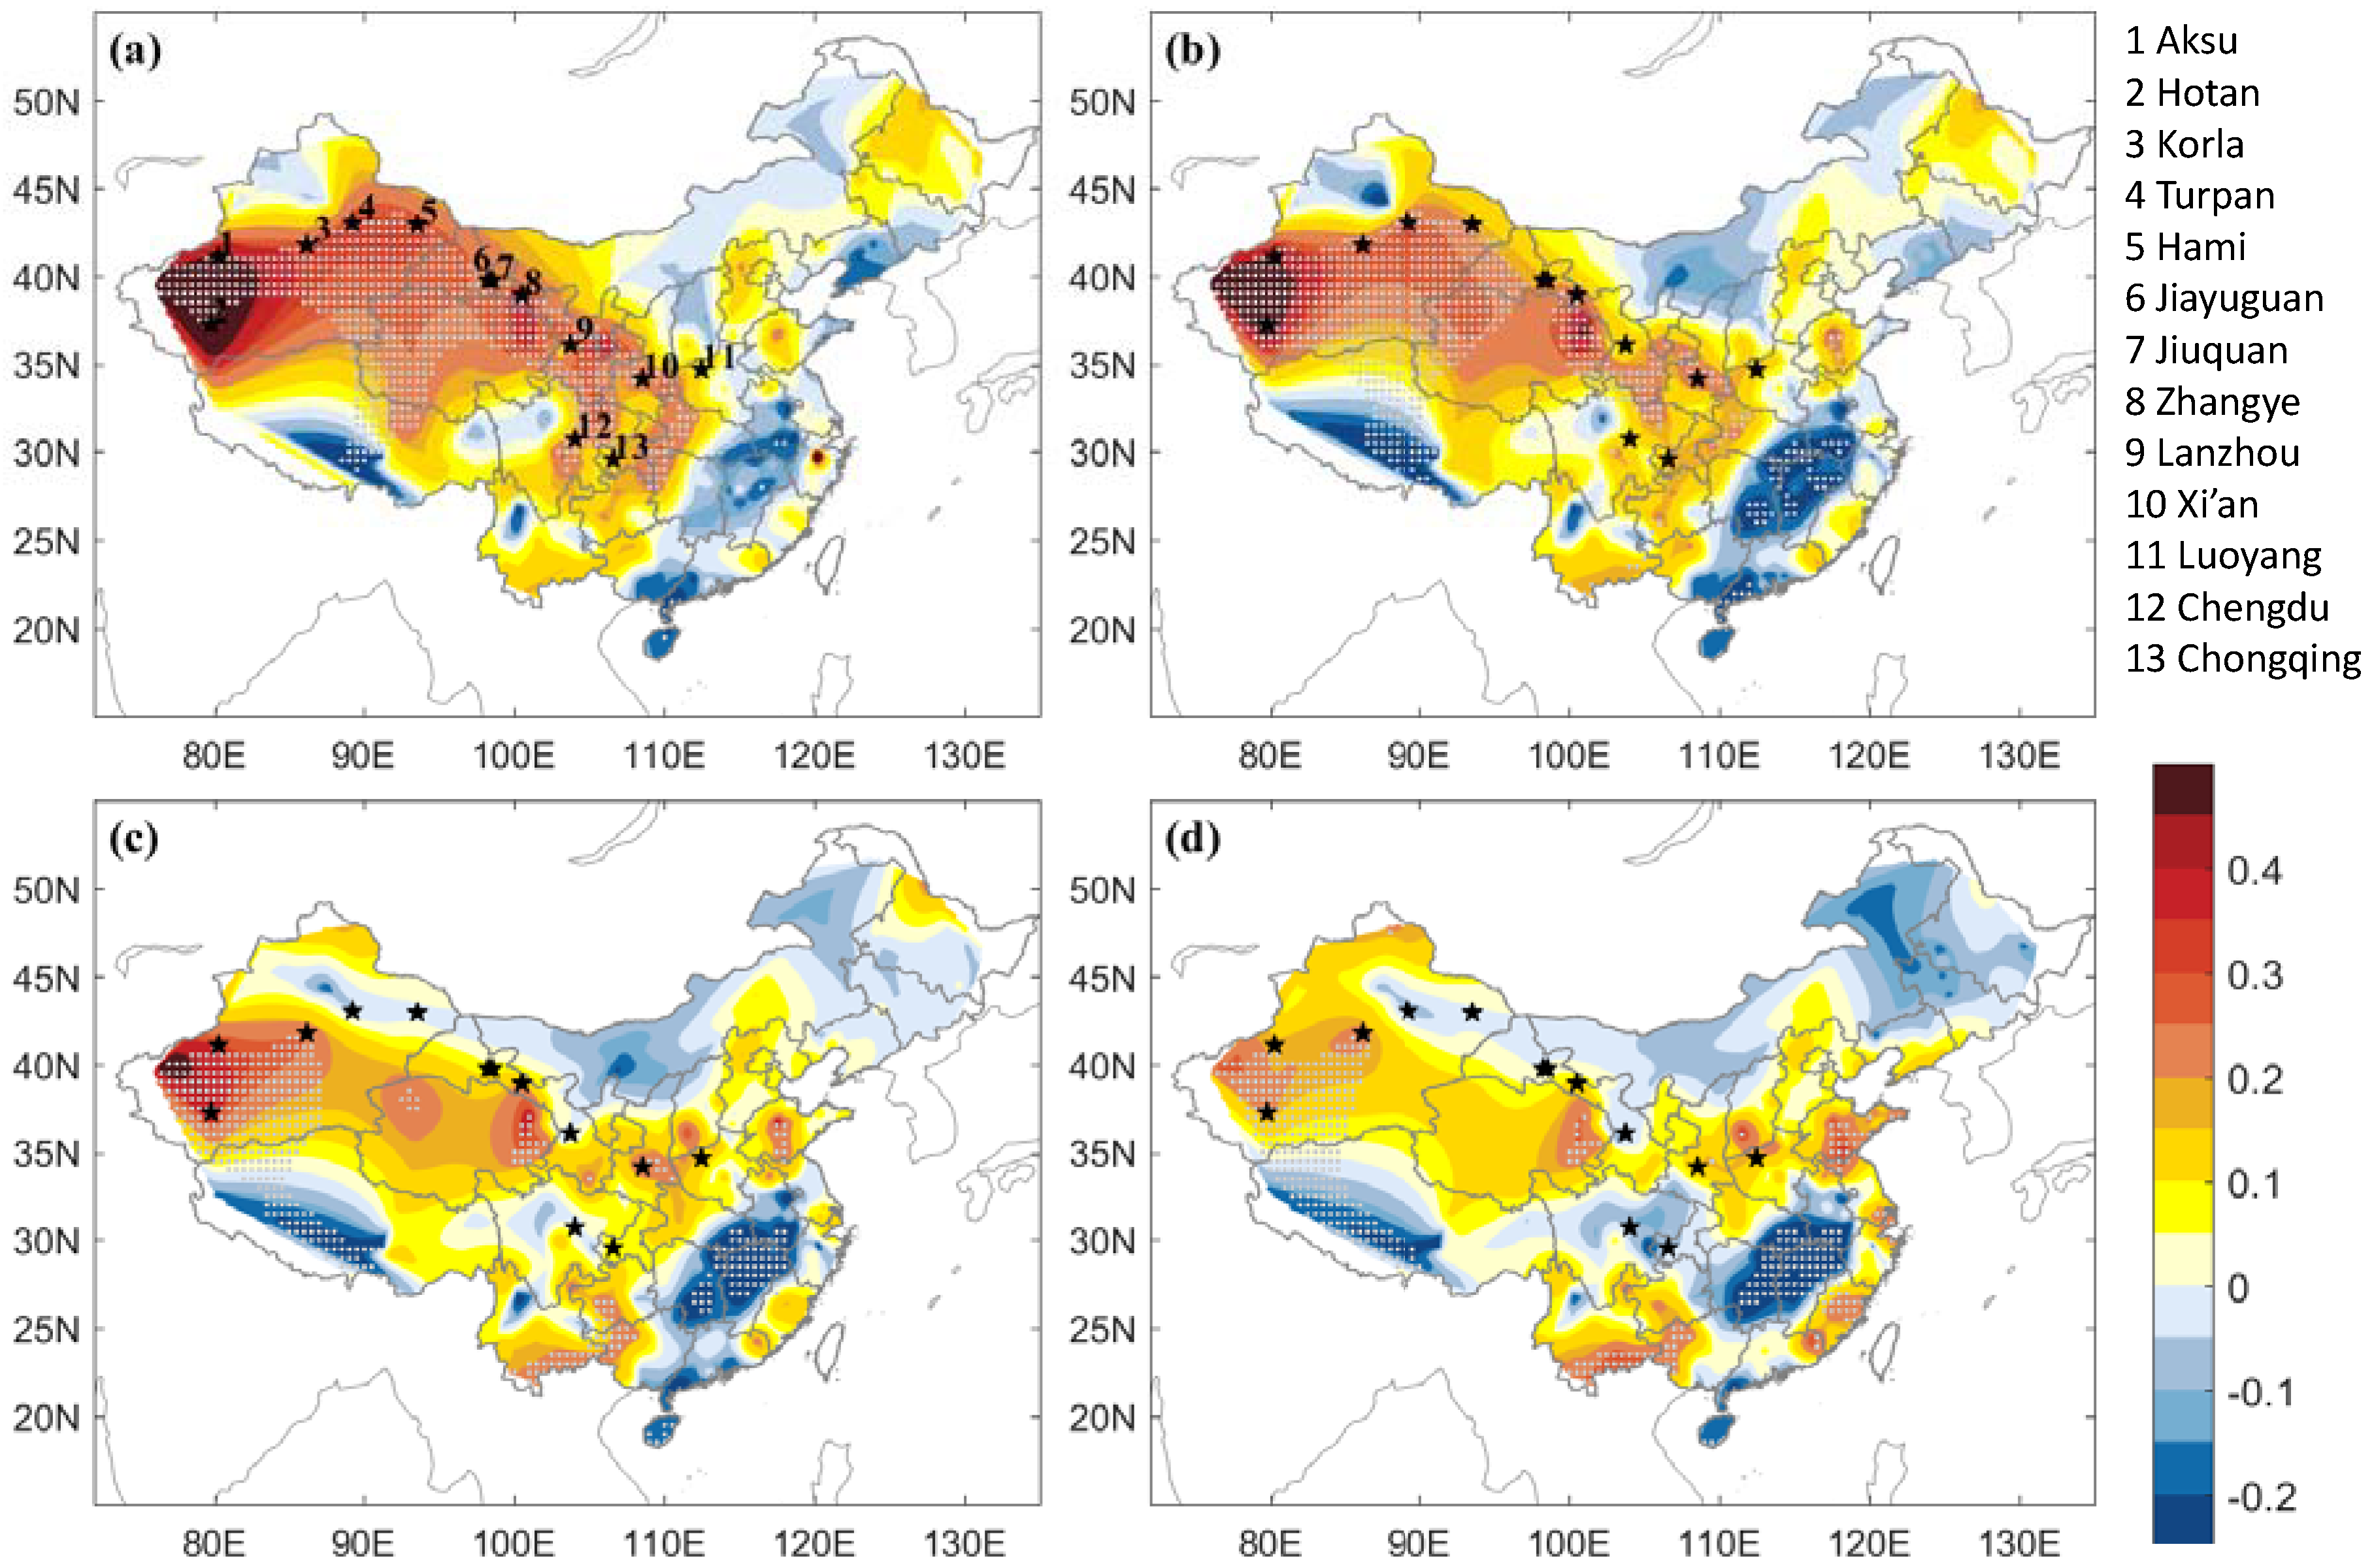
The DI was also closely related to the mass concentration of PM2.5. Figure 4 shows the spatial distribution of simultaneous and lagged correlation coefficients between the Taklimakan DI and the mass concentration of PM2.5. Similar to Figure 3a,b, correlations of the DI with the simultaneous (Figure 4a) and 1-day lagged (Figure 4b) PM2.5 concentration had a maximum positive center (R > 0.45) in the western Taklimakan region, including Aksu and Hotan. Except for a small region of northern Xinjiang, areas with positive correlations were seen in most parts of northwestern China, which revealed that when the DI reached a high value in Taklimakan, the mass concentration of PM2.5 would correspondingly increase not only in the source region but also in the downstream areas extended eastward to Shaanxi and southward to Chongqing. Correlations with 2- (Figure 4c) and 3-day lags (Figure 4d) showed that the areas with positive correlation exceeding the 95% confidence level only appeared in the source region, eastern Qinghai, southern part of Shaanxi and Shanxi, and the Shandong Peninsula. Similarly, the impacts of the Taklimakan dust on the downstream PM2.5 levels were very weak beyond 3 days. It is noteworthy that there was a stable negative correlation area in southeastern China, especially for the correlations with 2- and 3-day lags (Figure 3 and Figure 4), which might be the result of mid-latitude cold air activity that is associated with both the occurrence of dust storms in the Taklimakan Desert and generation of spring rains in the south of the Yangtze River [66] under a favorable circulation background.
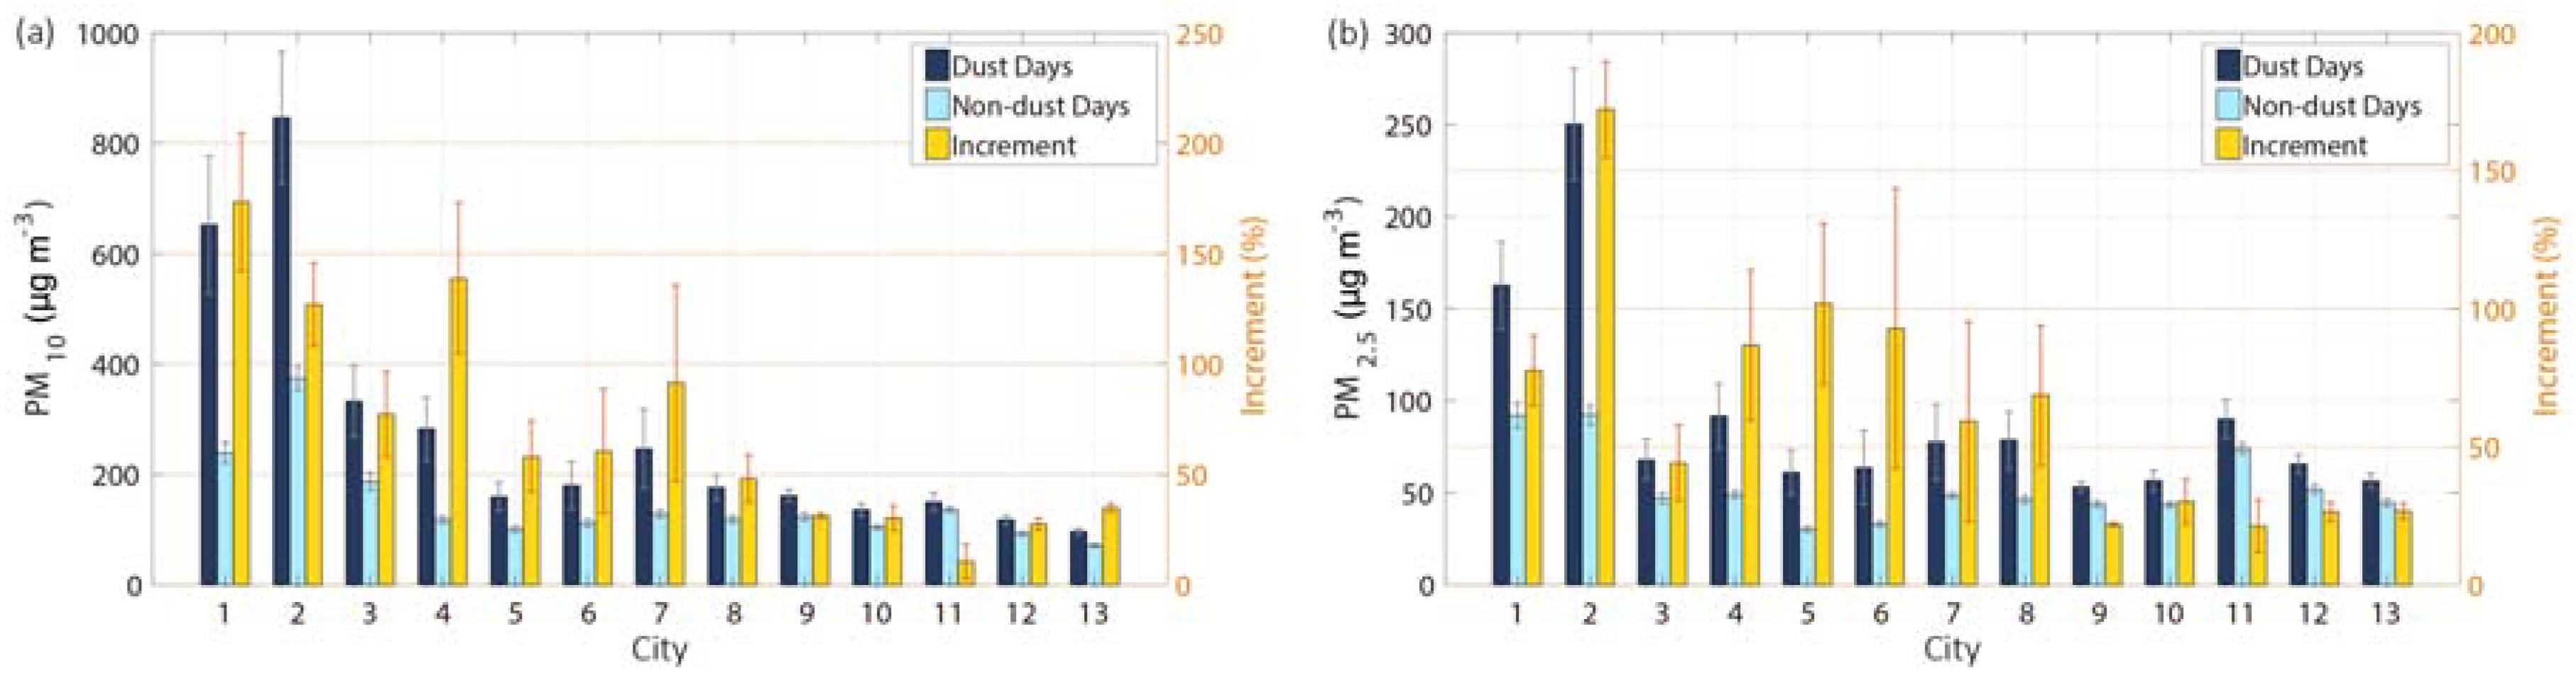
There were significant differences in the urban air quality levels between the Taklimakan dust days and non-dust days in western China. We selected 13 cities with high positive correlation coefficients between the DI and mass concentration of PM10 (PM2.5) in different distances to the source region, and found that the mass concentrations of PM10 and PM2.5 in all the cities were higher during the Taklimakan dust days than those during the non-dust days (Figure 5). The mass concentrations of PM10 on the dust days increased by 14–473 μg m−3 (11–173%), and those of PM2.5 increased by 10–158 μg m−3 (21–172%) compared with the non-dust day levels. It is noted that the mass concentrations of PM10 and PM2.5 in Aksu and Hotan were maintained at high levels even during the non-dust days. The mass concentrations of PM10 in Aksu on the dust days reached 846 μg m−3, while the mass concentrations of PM2.5 in Hotan reached 250 μg m−3 on dust days with an increase of 172% compared to the non-dust days. As the distances between the cities and the Taklimakan Desert increased, the increments of PM10 and PM2.5 on dust days decreased. For example, the mass concentrations of PM10 and PM2.5 in the Jiayuguan, Jiuquan, and Zhangye in the Hexi Corridor increased by 48–93% relative to the non-dust days. In comparison, for those cities further downstream, such as Lanzhou, Xi’an, Chengdu and Chongqing, the increases in the mass concentrations of PM10 and PM2.5 were usually less than 30% from the non-dust days, where the background mass concentrations of PM10 and PM2.5 were also lower. Based on the air quality guidelines of World Health Organization (WHO) [67] as well as the Ambient Air Quality Standards issued by the Ministry of Environmental Protection of China [68], the daily average concentrations of PM10 during dust days exceeded the standard of 150 µg m−3 in most selected cities. Specifically, the PM10 concentration in Aksu was 5.6 times that of the standard. Meanwhile, the daily average concentrations of PM2.5 exceeded the standard of 75 µg m−3 in Aksu, Hotan, Turpan, Jiuquan, Zhangye, and Luoyang during dust days. The serious excess of the daily standard concentrations of PM during the dust events would cause harm to human health, lead to increased number of hospitalizations and respiratory mortality, and affect normal outdoor activities [69,70].
3.3. Transport of Taklimakan Dust
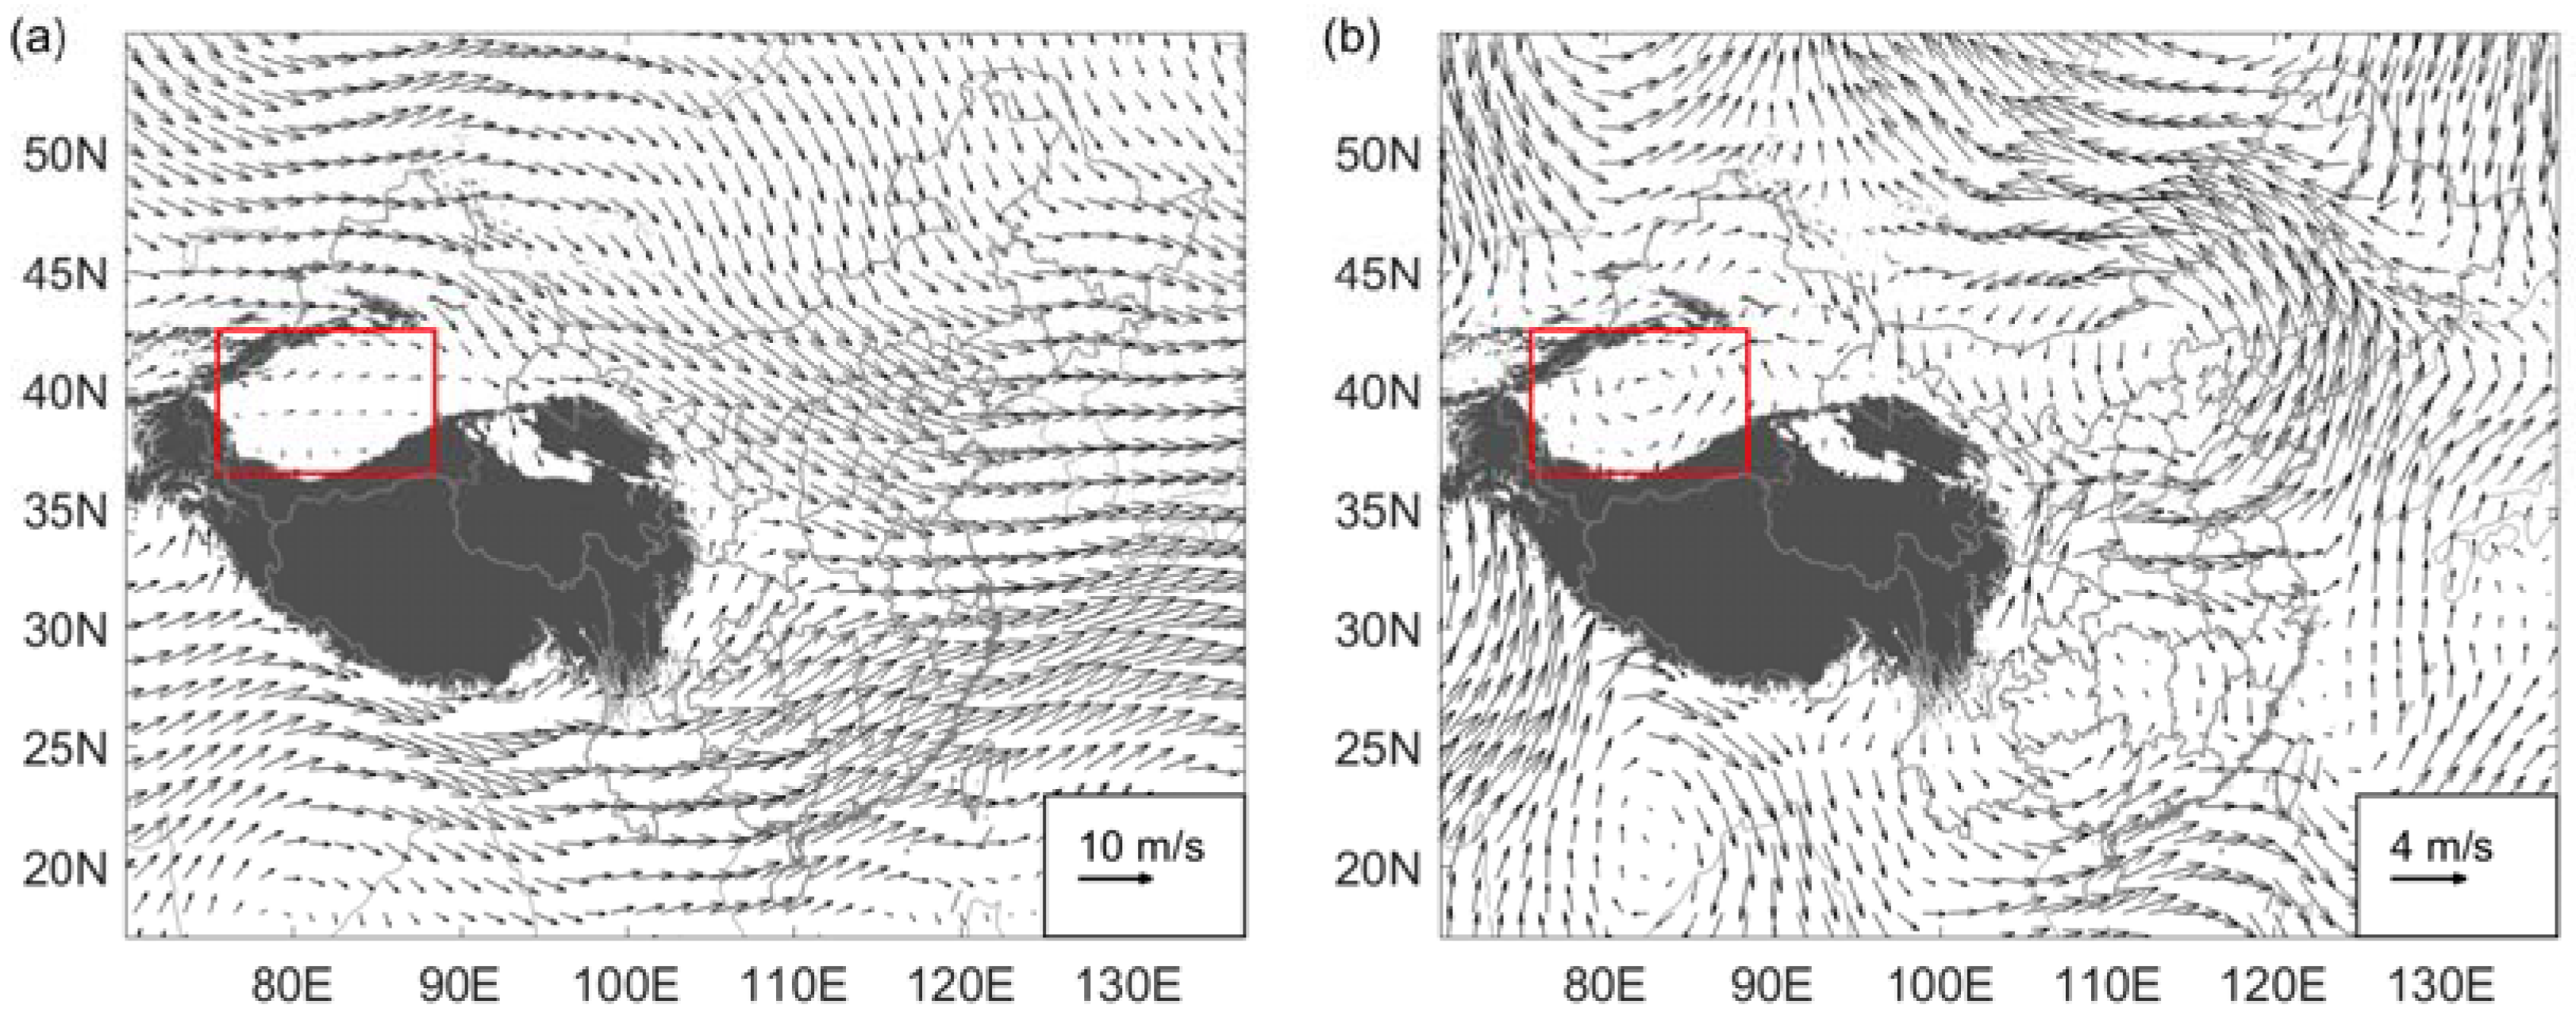
The linkage between the air quality of downstream cities and the source region’s dust activity can be explained by the dust transport processes. For this reason, we analyzed the 700 hPa wind fields for the dust and non-dust days during the study period to determine the transport mechanisms of the Taklimakan dust aerosols to the downstream areas. This level was selected based on previous studies on the dust emission processes in the Taklimakan, in which trans-regional and long-distance transport of aeolian dust mostly occurs after the desert dust is lifted to the mid-tropospheric level by strong local winds and convection [30]. During dust days (Figure 6a), there was a strong southeastward flow in the Hexi Corridor, located over the east of Xinjiang and the northeast of the Tibetan Plateau. The dust aerosols were transported from the source toward the southeast by the mid-tropospheric circulation. Thus, the air quality in the downstream areas is affected by the settlement during the transport process. The difference of 700 hPa wind fields between the dust days and non-dust days is shown in Figure 6b. To exclude the effects of seasonal changes in the general circulation patterns, the non-dust days was selected for the same length of period as the dust days after the end of each dust events. Compared with the non-dust days, there was an enhanced northwesterly circulation over the Hexi Corridor northeastern of the Tibetan Plateau, which was in favor of the dust transport from the Taklimakan to the eastern part of Northwest China (Figure 6b). Moreover, on the southeastern margin of the plateau, the anomalous strong southwesterly wind produced the convergence in the central and southern parts of Gansu and Shaanxi Province, which led to the accumulation of dust particles and in turn affected the air quality in these downstream areas. In southeastern China, there is a strong southwesterly circulation during the dust days (Figure 6a), which corresponds to the presence of the pre-monsoon rainy belt associated with the mid-latitude cold air outbreak southward in spring [66,71] and explains the area of negative correlations seen in Figure 3 and Figure 4. It should be pointed out that it took a certain time for dust aerosols to be transported from the source to the downstream cities, which led to a lagged effect on the urban air quality as shown in the above lagged correlation analyses (Figure 3 and Figure 4).
3.4. Case Study for the Influence of the Taklimakan Dust Storm Process on the Air Quality
Dust events with different intensities and paths tend to have different impacts on the mass concentration of PM10 in the downstream cities [40]. According to the above analyses of the dust events in the Taklimakan region in spring, 2015, the strongest dust storm occurred from 31 March to 4 April, with the maximum peak of daily DI value and also the highest mean daily DI compared to other dust events during the spring of 2015 (Table 1). We selected this event as an example to further illustrate the effects of the Taklimakan dust events on air quality of the downstream cities in China.
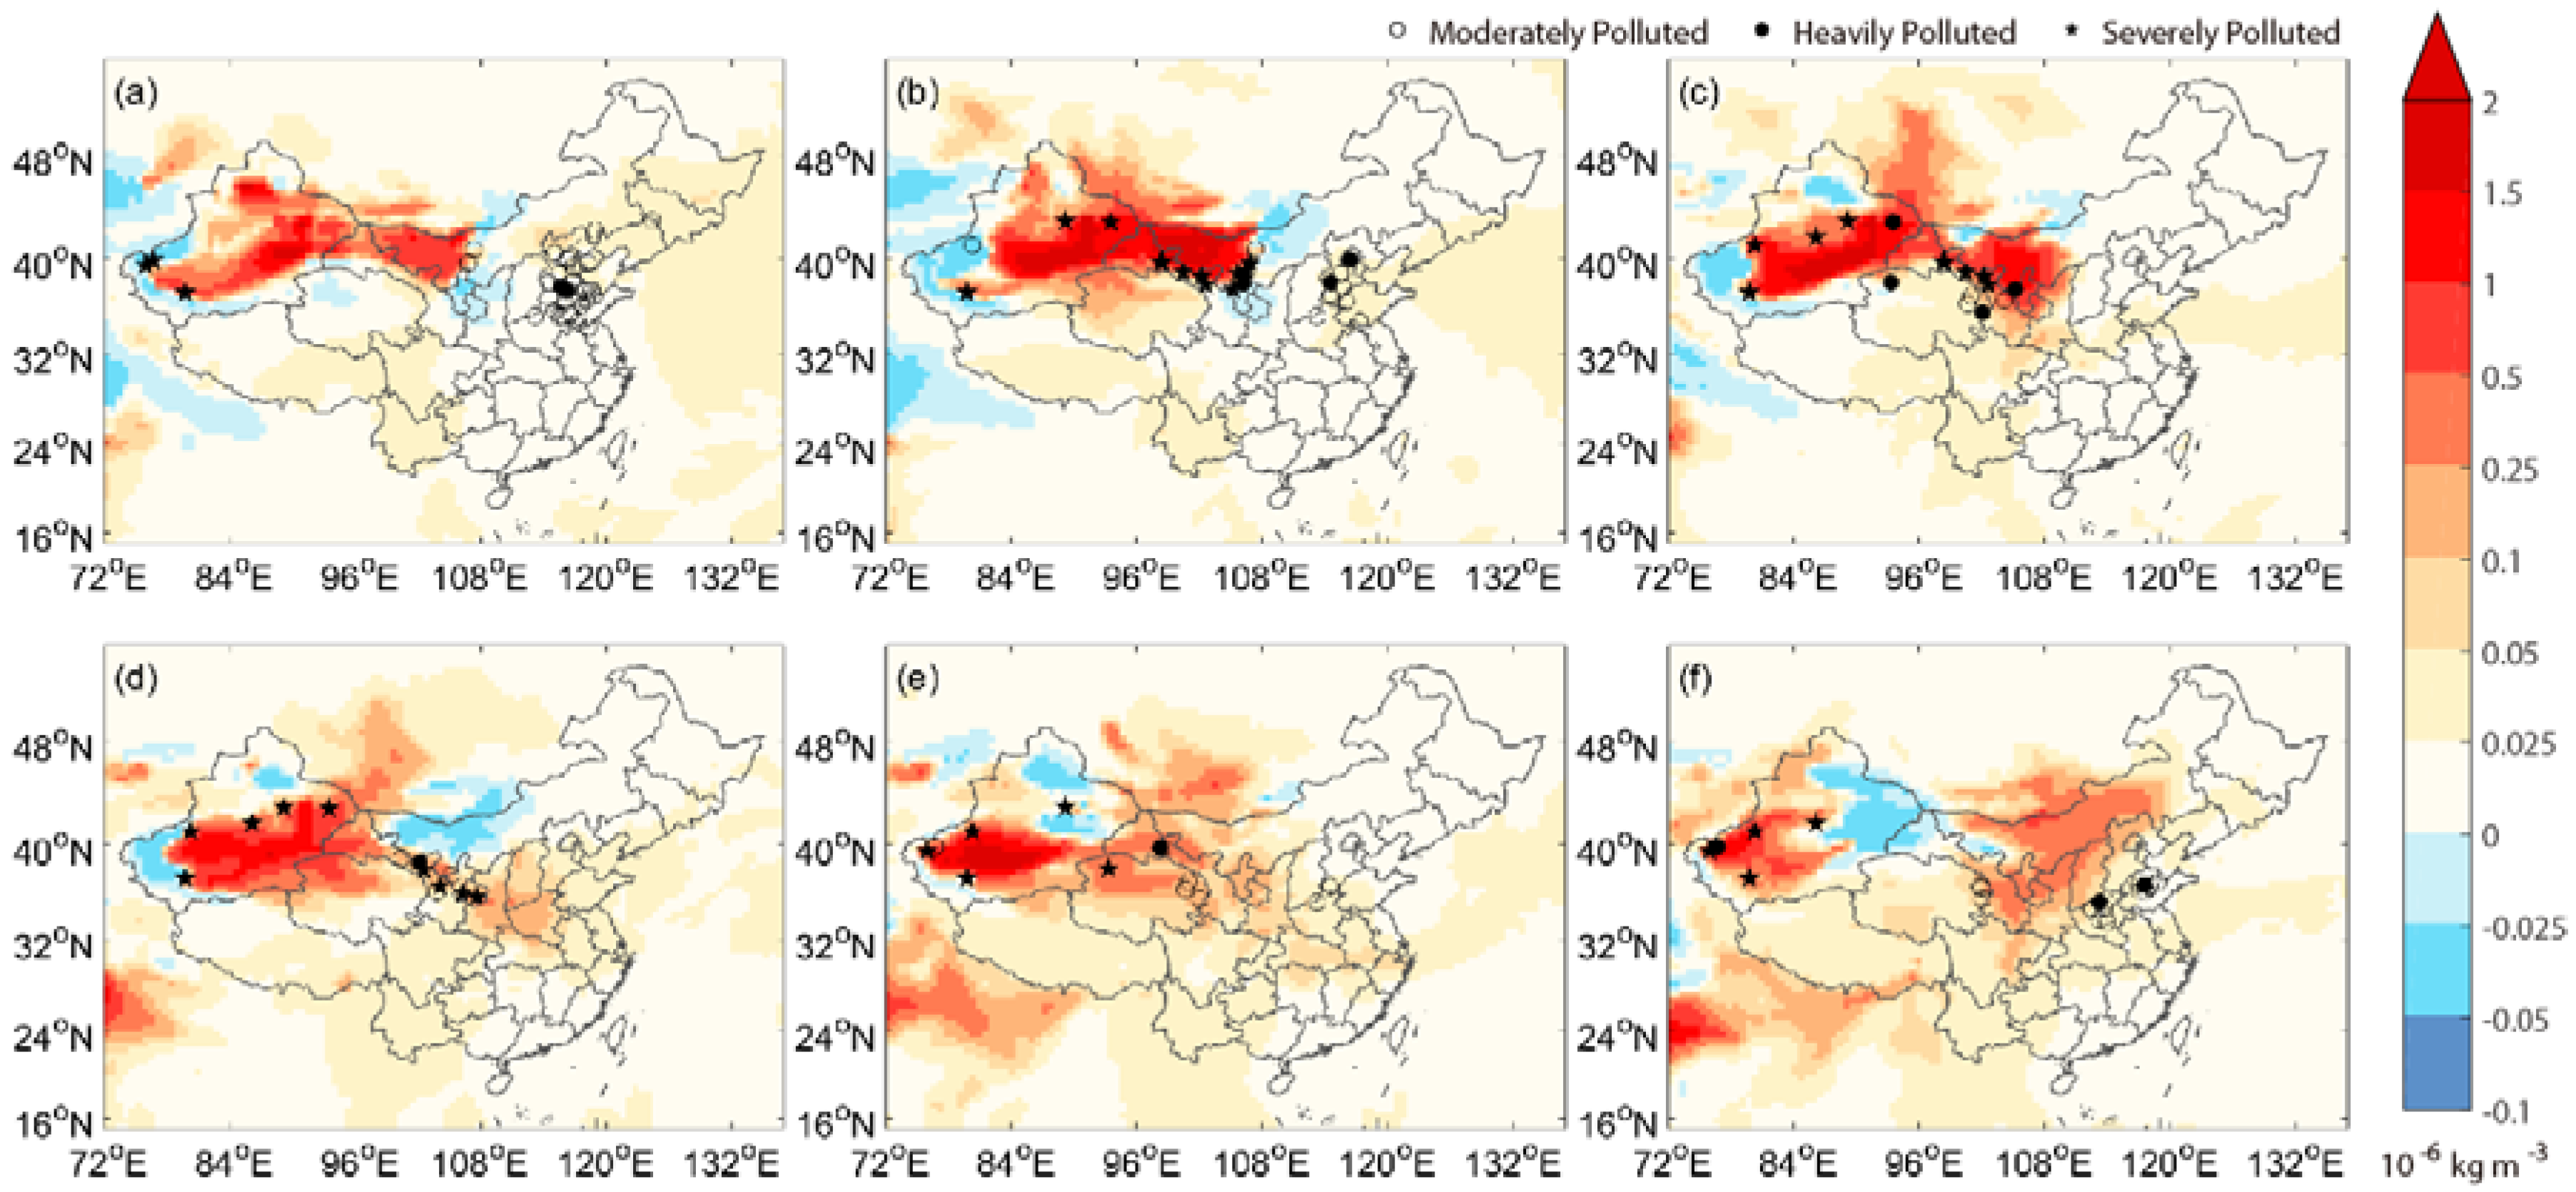
According to the weather phenomenon data from the meteorological stations (see Figure 1b for the station locations), a strong dust storm occurred in Tikanlik, Xinjiang on 31 March at 20:00 (UTC+8, the same below). Dust storms were observed in Tazhong and Qiemo on 1 April at 20:00, Alar on 2 April at 20:00, and Tazhong on 3 April at 14:00. The minimum visibility occurred in Ruoqiang, Xinjiang, which was 0.1 km on 31 March at 11:00. Based on the daily surface dust mass concentrations from MERRA-2, we observed the movement of local dust events. In Figure 7, hollow circles, solid circles and stars respectively marked the cities with AQI values of moderate pollution (150 < AQI ≤ 200), heavy pollution (200 < AQI ≤ 300), and severe pollution (AQI > 300) from 30 March to 4 April, while the color scale represents the dust concentration anomalies as the departure from the means of 2015. It can be seen that the cities where the daily AQI reached moderate degree of pollution at the minimum were in good agreement with the high anomaly areas of the MERRA-2 surface dust concentrations.
Figure 7 also reveals a close relationship between the dispersion of dust and the evolution of air pollution levels over time in various regions. On 30 March, the areas with high positive anomalies of dust concentrations were mostly found in the Taklimakan Desert, eastern Xinjiang, and western Inner Mongolia (Figure 7a). Meanwhile, the cities where AQI reached severe pollution levels were found in the western Taklimakan Desert with PM10 as the largest contributor to the local AQI among the indexed pollutants. There were also a large number of moderately and a few heavily polluted cities in North China, where the primary pollutants were PM10 and PM2.5, probably resulting from a blowing dust process in North China from 27 to 29 March. The high anomaly regions (exceeding 10−6 kg m−3) were located in the eastern Taklimakan, eastern Xinjiang, the Hexi Corridor, and western Inner Mongolia. On 31 March, there were higher positive anomalies compared with those on the day before, while the spatial extent of high dust concentrations moved eastward. Similarly, the cities with severe pollution appeared in areas of high dust concentrations, such as Hami, Jiuquan, and Jiayuguan (Figure 7b). On 1 and 2 April, the high positive anomaly areas of the MERRA-2 surface dust concentration continued to expand along the Hexi Corridor toward the southeast, gradually affecting central Gansu, Ningxia, Shaanxi and parts of western Henan. On 2 April, besides the source region, cities in western Gansu and Ningxia also experienced severe pollution, with high mass concentrations of PM10 (Figure 7d). On 3 and 4 April, areas of high dust concentration anomalies were mainly located in the Taklimakan source region, and the AQI of Hotan and Aksu surpassed 300 indicating severe pollution. In the meantime, North China experienced moderate levels of dust concentration whereas the remote downstream areas such as the Yangtze River Basin and Southeast China saw little impact. On 4 April, the AQI of Zhangqiu and Jiaozuo in Henan Province was greater than 200, reaching the heavy pollution level with PM2.5 as the primary pollutant, which might be caused by local pollution.
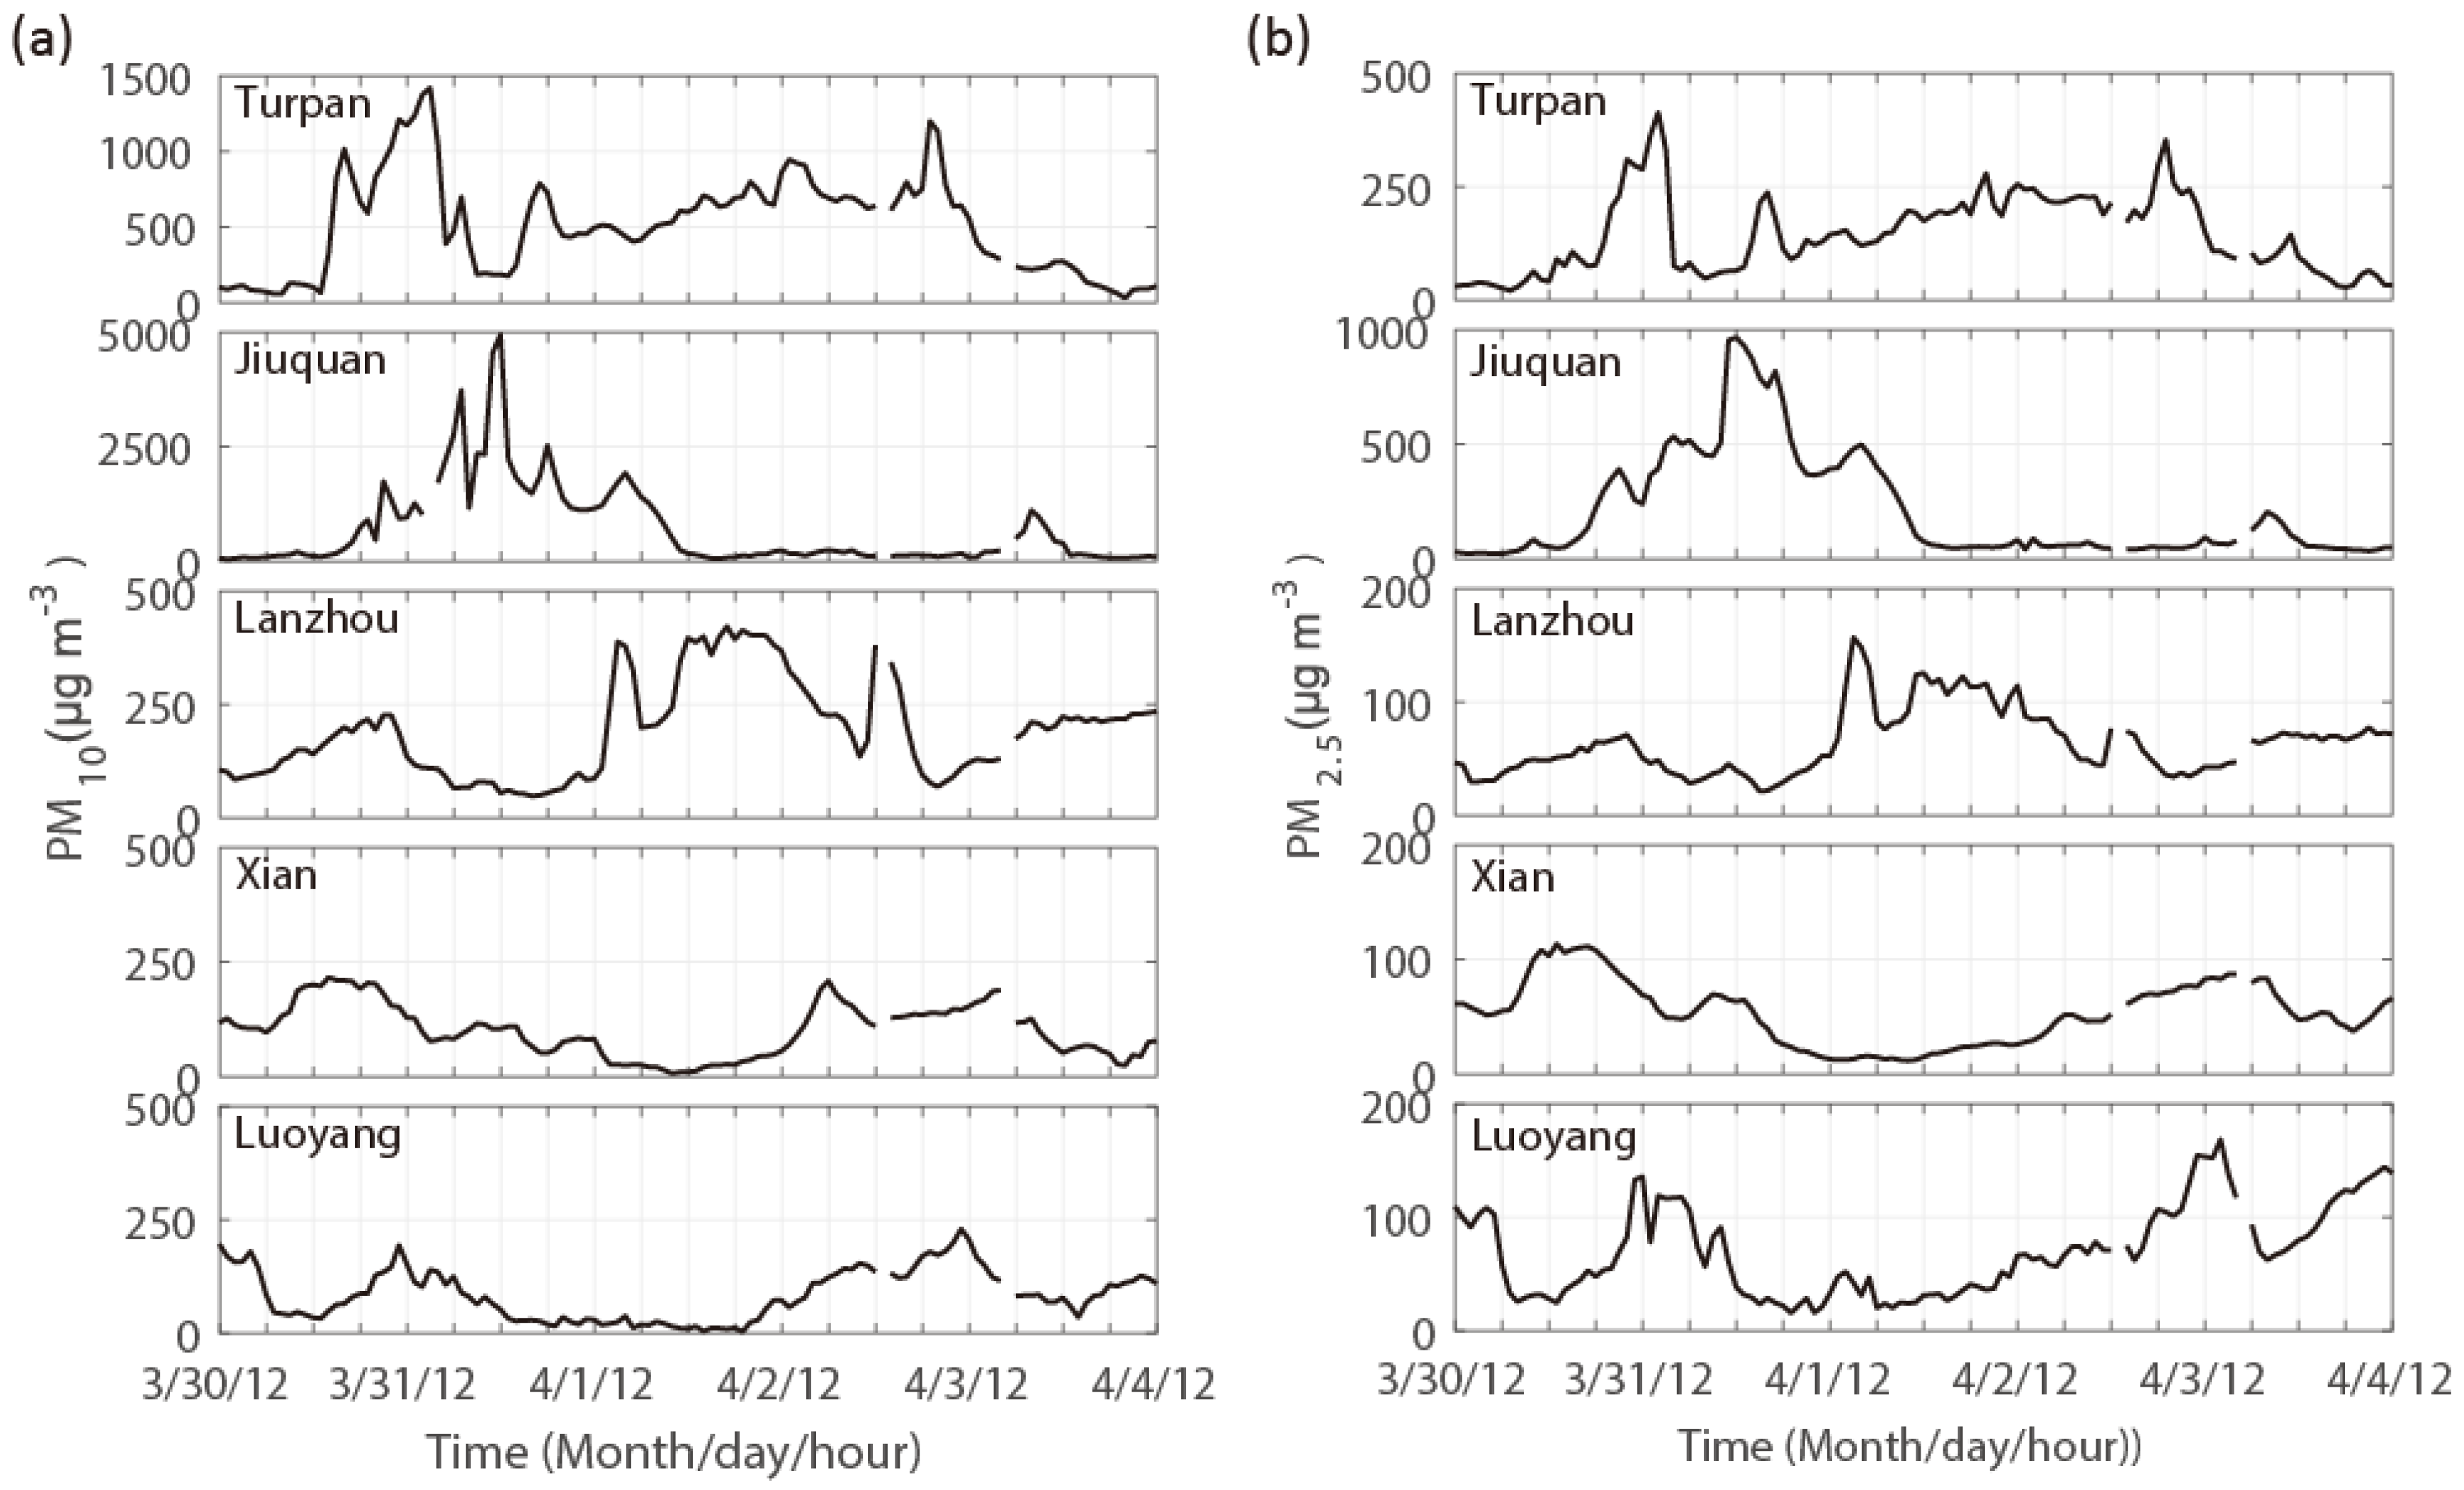
Five representative cities from west to east were selected for the analysis on the impact of this dust storm process on the local PM10 (Figure 8a) and PM2.5 (Figure 8b) of the downstream areas: Turpan, Jiayuguan, Lanzhou, Xi’an, and Luoyang, which were different distances from the Taklimakan. The mass concentration of PM10 (PM2.5) increased significantly since 00:00 on 31 March in Turpan, which is closest to the source region, with the maximum of 1422 (413) μg m−3. The peak PM10 and PM2.5 concentrations occurred at about 00:00 on 1 April in Jiuquan, which was probably related to the underlying surface and local circulation that were conducive to the dust emission processes in the Hexi Corridor. Lanzhou experienced high concentrations of PM10 and PM2.5 from 12:00 on 1 April to 12:00 on 2 April with the mean of 334 μg m−3 and 108 μg m−3, respectively. In the farther city of Xi’an, the mass concentration of PM10 began to rise after 12:00 on 2 April and was maintained at high levels until 18:00 on 3 April, but the increment of the mass concentration of PM2.5 was not dramatic. Luoyang reached the maximum concentrations of PM10 (PM2.5) of 230 (168) μg m−3 on 3 April. Overall, as the dust storm progressed toward the southeast, the mass concentrations of PM10 and PM2.5 increased successively in the five cities with their distances to the source area from near to far. The most significant changes of the mass concentration of PM10 (PM2.5) occurred in Jiuquan. With the increases of the distances between the cities to the Taklimakan region, the occurrence time for the peaks of mass concentrations of PM10 (PM2.5) in the downstream cities became more and more delayed and the peak values subsided gradually.
3.5. Composite Analysis of the Taklimakan Dust Effect on Chinese Air Quality
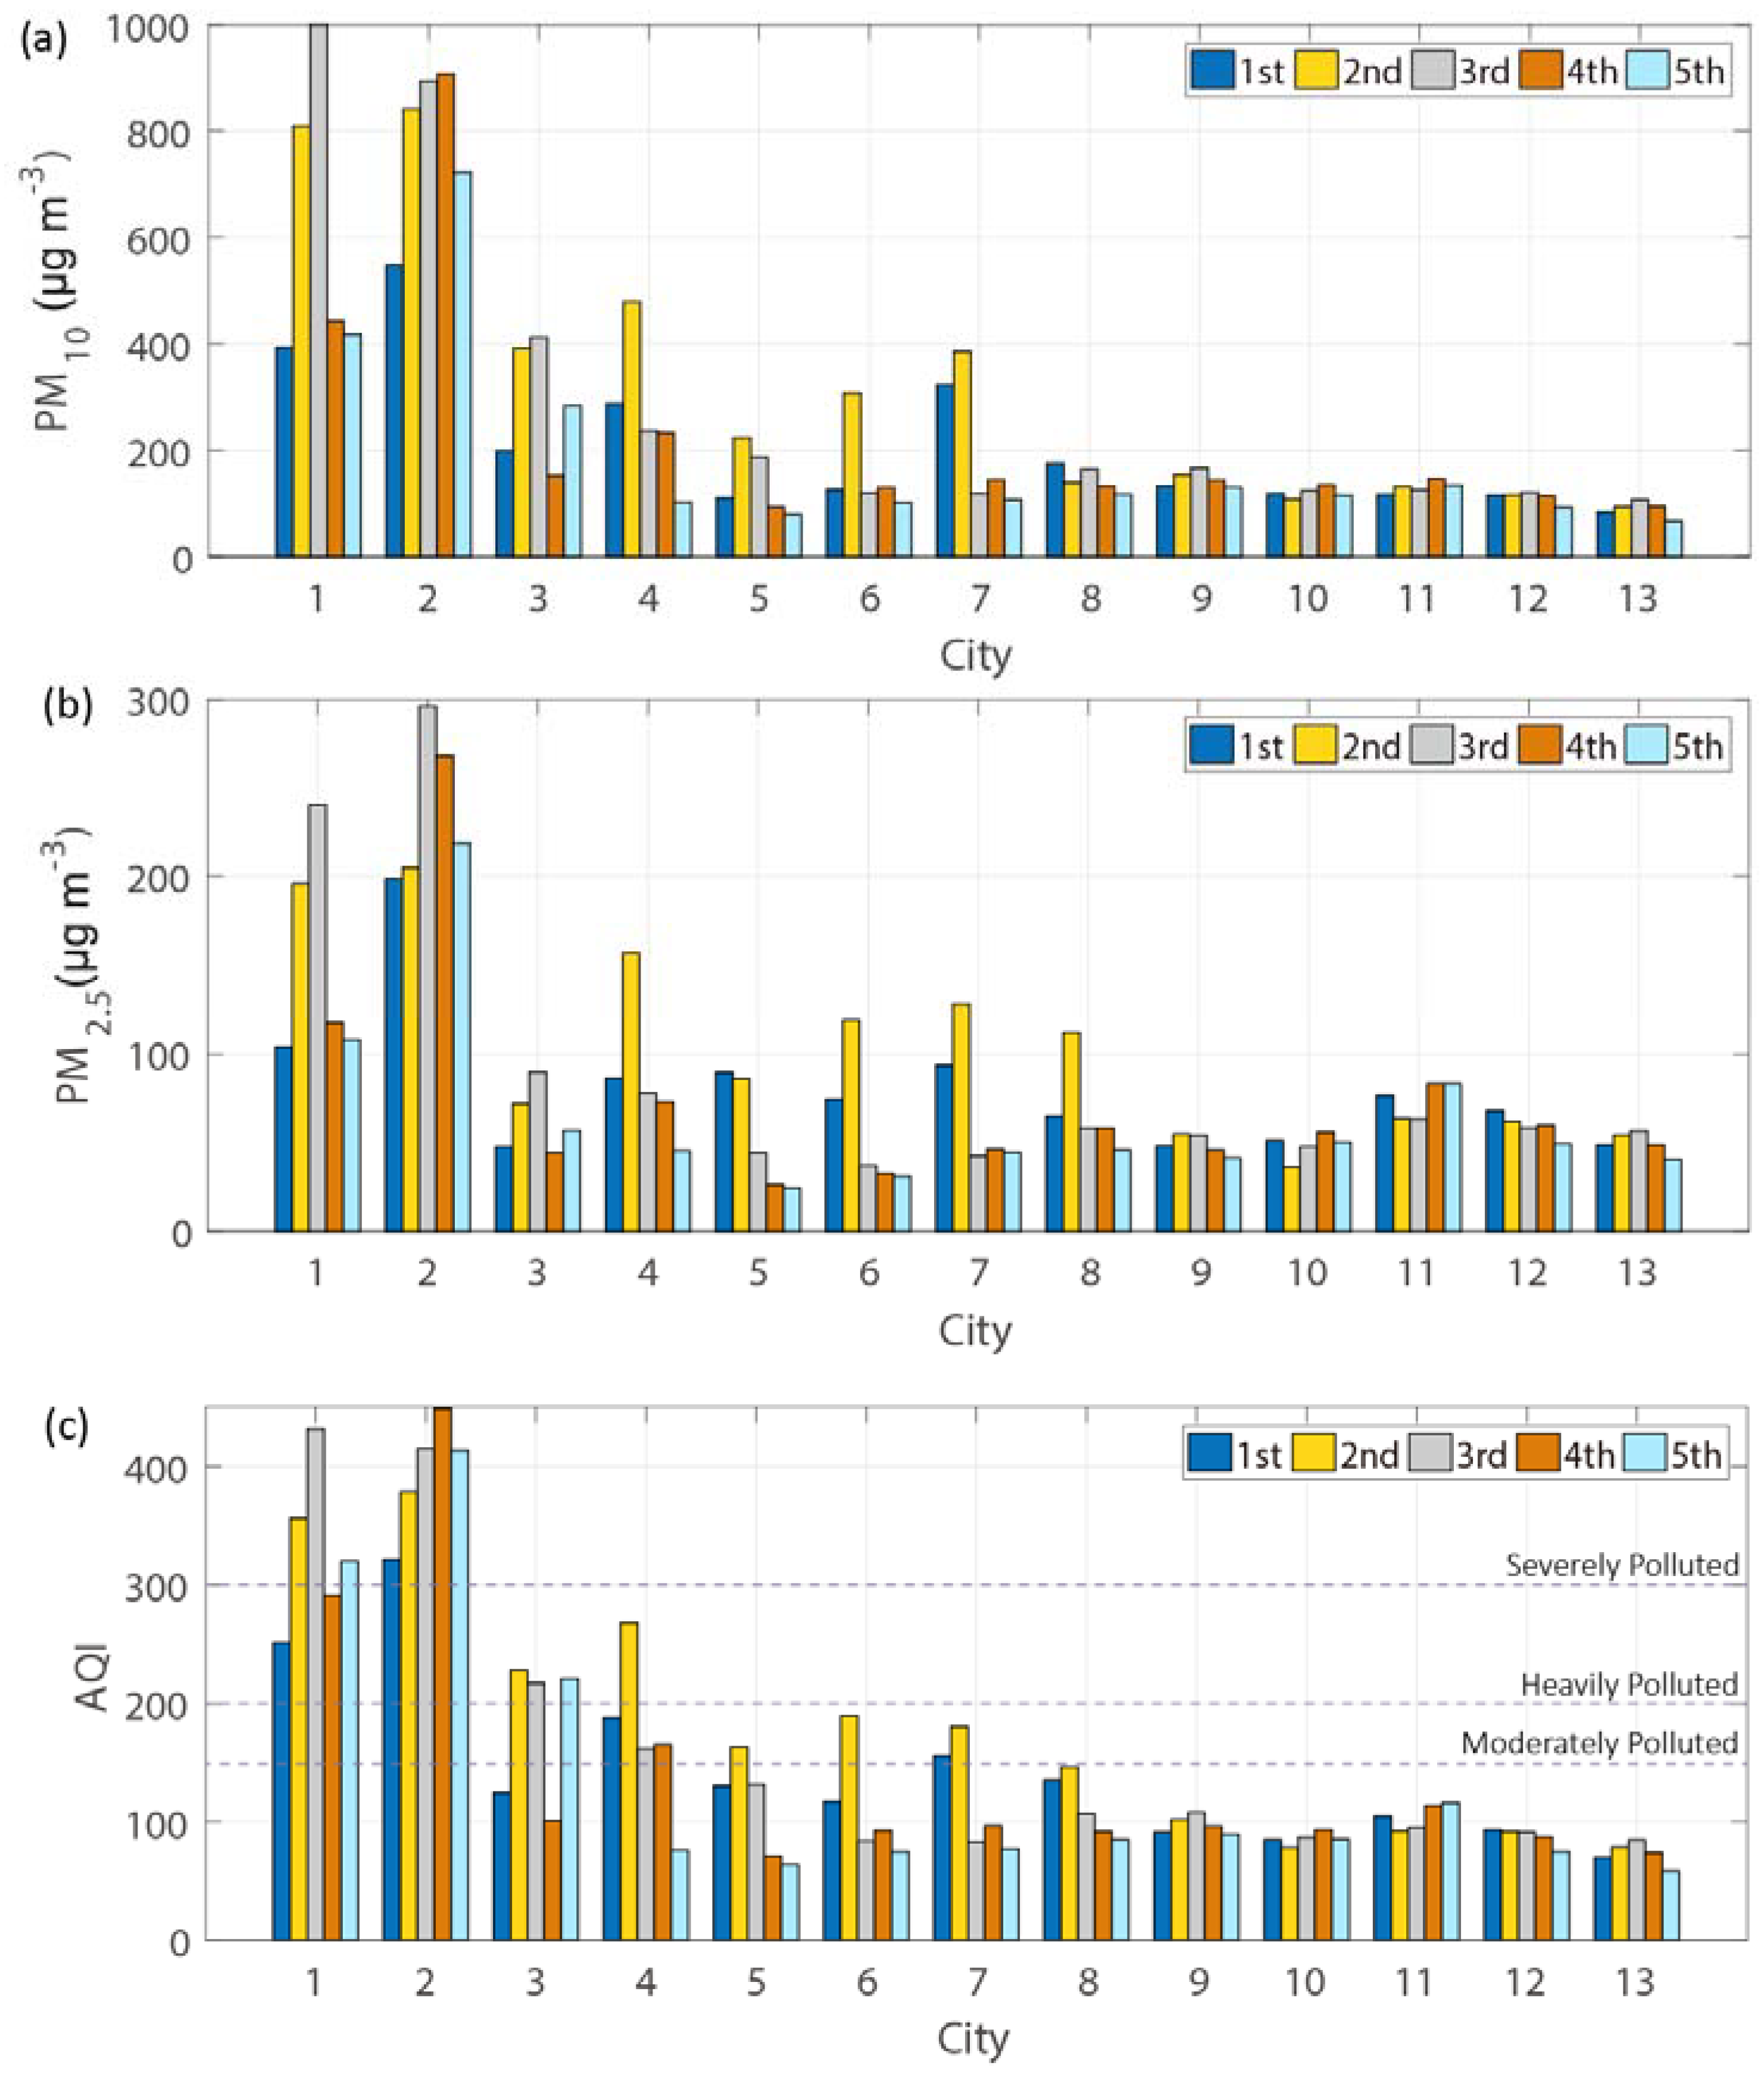
Generally speaking, the period of the impact of the Taklimakan dust transport on the downstream areas did not last for more than five days. To understand the general temporal and spatial characteristics of the Taklimakan dust effects on the air quality of downstream cities, a composite analysis was conducted for the AQI and mass concentrations of PM10 and PM2.5 in the 13 cities from the first day to the fifth day (as event days) during the six dust events defined by the DI in spring of 2015. Then for each corresponding event day of the six major dust events, the AQI and mass concentrations of PM10 and PM2.5 are averaged to construct a composite dust event for each city.
The composite analysis shows that the influence of Taklimakan dust events on urban air quality was mainly limited to Northwest China, and the degree of influence gradually weakened from the source region toward the southeast (Figure 9). Meanwhile, the duration of impact shortened as the distance to the source area increased. The mass concentrations of PM10 (PM2.5) in the Aksu and Hotan of the Taklimakan region were maintained at high levels in all 5 event days since the dust events began. In comparison, for Turpan and Hami located in the eastern part of Xinjiang, as well as Jiayuguan and Jiuquan located in the Hexi Corridor, the high concentrations of PM10 (PM2.5) appeared on the second day of the composite dust event. The peak mass concentrations occurred on the third day of the dust event in Zhangye and Lanzhou, which are farther away from the Taklimakan region, while the peaks occurred on the fourth event day in the more easterly located Xi’an and Luoyang. As the distances between the source region and the affected cities increased, the peaks of PM10 (PM2.5) concentrations decreased because of the settlement and dispersion processes. The AQI in the cities farther than Zhangye did not exceed 150, which suggested that on average the Taklimakan dust events in spring of 2015 did not lead to moderate or more serious pollution events in further downstream cities. The AQI of Aksu and Hotan in the Taklimakan region reached the heavy and severe pollution levels during the whole process of the composite dust event. The air quality conditions in Korla and Turpan in eastern Xinjiang were moderately and heavily polluted during most of the composite dust event, while Hami, Jiayuguan and Jiuquan, further east of the source region, experienced only moderate pollution on the second day of the composite dust event.
4. Conclusions
The occurrence of dust events has important impacts on the AQI and the mass concentrations of PM10 and PM2.5 in the source areas and the downstream cities. In recent years, as the air quality monitoring expanded to cover more regions and types of pollutants, many studies have focused on the spatiotemporal variation of the concentrations of particulate matters and gaseous pollutants across China [2,3]. However, only a few studies have analyzed the characteristics of the impacts of dust events on the air pollution at a large spatial scale in detail. In the current study, the scope, intensity, timing and duration of impacts of the Taklimakan dust events on urban air quality in local and downstream regions in China were explored on the basis of correlation statistics, case study and composite analysis. Since nationwide monitoring of PM2.5 only began in 2014, 2015 is the first year when both PM10 and PM2.5 data are available for analysis for 367 cities in the entire nation. Therefore, results from our study can be considered as the baseline for future similar studies. The following conclusions were obtained:
Taklimakan dust events can be defined by the dust index (DI), which was established by ground monitoring dust weather phenomena and visibility, in combination with satellite data and dust reanalysis data. Six strong dust events were identified in the Taklimakan region in the spring of 2015, of which the strongest dust event was from 31 March to 4 April.
Taklimakan dust events severely affected the air quality of most cities in Northwest China, such as eastern Xinjiang and the Hexi Corridor, and consequently, the mass concentrations of PM10 and PM2.5 in these cities increased significantly with the occurrence of the dust events, although the PM10 levels were much higher than the PM2.5 levels. This confirms the findings from previous studies, such as Chen et al. [72] and Guan et al. [50]. However, we also discovered that the areas with the greatest impact on air quality are located in the west of the Taklimakan Desert, closest to the source region, and that the affected regions extended southeastward progressively to Qinghai, Gansu, Shaanxi, and farthest to western Hubei over four days, which is approximately 2500 kilometres from the source region. Using correlation analysis, we were able to identify the downstream areas where air quality conditions were associated closely with the dust activity in the Taklimakan source region. During the dust days of the Taklimakan region, the mass concentrations of PM10 increased by 11–173% compared with non-dust days in the cities of the source as well as downstream areas, while the PM2.5 concentrations increased by 21–172%. As the distances between the affected cities and the Taklimakan Desert became longer, the increments of the PM10 (PM2.5) concentrations on dust days relative to the non-dust days gradually decreased. For example, the increments of PM10 concentrations in Aksu (the Taklimakan Desert), Turpan (eastern Xinjiang), Jiayuguan (the Hexi Corridor), Lanzhou (eastern Gansu), and Xi’an (the Guanzhong Basin) during dust days in spring of 2015 were 413 μg m−3, 164 μg m−3, 68 μg m−3, 39 μg m−3, and 32 μg m−3, respectively.
Both the correlation and composite analyses showed that the influence of the Taklimakan dust events on the air quality in the downstream cities can usually persist for up to four days, and the impact would become very weak, if any, after the fourth day of the Taklimakan dust storm initiation. The case study for the strongest dust storm event from 31 March to 4 April revealed that along with the southeastward advance of the strong dust storm, the mass concentrations of PM10 and PM2.5 increased successively from the northwest (Turpan) to the southeast (Luoyang) with the distances to the source area changing from near to far. Guan et al. [50] also showed that during a massive dust storm in 2014, the time when the local concentrations of PM reached their peaks lagged from west to east in Gansu with the arrival of the dust event. The composite analysis of six major dust events showed that during the first five days of dust events, the urban air quality in the source area was sustained at the severe pollution level, and the mass concentrations of PM10 and PM2.5 were maintained at high levels as well. The peaks of the PM10 concentrations in the cities of eastern Xinjiang, the Hexi Corridor and the Guanzhong Basin successively occurred on the second, third and fourth event day after the Taklimakan dust event began. In addition, the Taklimakan dust events had a shorter impact on the air quality of the further downstream cities than those closer to the source region.
As a baseline study, results from our analyses revealed temporal and spatial characteristics of the impact of the dust events originated from the Taklimakan region on urban air quality in China. For those downstream areas associated with the Taklimakan dust events, such information can be used in urban air quality forecast, establishment of dust event alert systems, and decision-support processes for local governments in issuing relevant environmental regulatory measures. Future studies are still needed to examine the impact of dust events from other source regions and their combined effects on air quality in different downstream regions. Also, there is a need to separate the effects of long-distance transported dust versus dust from local sources.
Author Contributions
X.L. (Xiaoyu Li) contributed to data curation, visualization, analysis, and drafting the manuscript. X.L. (Xiaodong Liu) designed this study and took part in discussions. Z.Y. participated in the explanation of results and the final revision.
Funding
This work was jointly supported by the National Key Research and Development Program of China (2016YFA0601904), China’s Ministry of Environmental Protection through the Key Task Project (DQGG0104) and the National Natural Science Foundation of China (41572150).
Acknowledgments
We thank the anonymous reviewers for their comments on the manuscript. Additionally, we thank China Meteorological Administration (CMA) and China National Environmental Monitoring Centre for the observational data.
Conflicts of Interest
The authors declare no conflict of interest.
References
- Akimoto, H. Global air quality and pollution. Science 2003, 302, 1716–1719. [Google Scholar] [CrossRef] [PubMed]
- Wang, Y.; Ying, Q.; Hu, J.; Zhang, H. Spatial and temporal variations of six criteria air pollutants in 31 provincial capital cities in China during 2013–2014. Environ. Int. 2014, 73, 413–422. [Google Scholar] [CrossRef] [PubMed]
- Xie, Y.; Zhao, B.; Zhang, L.; Luo, R. Spatiotemporal variations of PM2.5 and PM10 concentrations between 31 Chinese cities and their relationships with SO2, NO2, CO and O3. Particuology 2015, 20, 141–149. [Google Scholar] [CrossRef]
- Zhao, S.; Yu, Y.; Yin, D.; He, J.; Liu, N.; Qu, J.; Xiao, J. Annual and diurnal variations of gaseous and particulate pollutants in 31 provincial capital cities based on in situ air quality monitoring data from China National Environmental Monitoring Center. Environ. Int. 2016, 86, 92–106. [Google Scholar] [CrossRef] [PubMed]
- Chan, C.K.; Yao, X. Air pollution in mega cities in China. Atmos. Environ. 2008, 42, 1–42. [Google Scholar] [CrossRef]
- Zhao, X.J.; Zhao, P.S.; Xu, J.; Meng, W.; Pu, W.W.; Dong, F.; He, D.; Shi, Q.F. Analysis of a winter regional haze event and its formation mechanism in the North China Plain. Atmos. Chem. Phys. 2013, 13, 5685–5696. [Google Scholar] [CrossRef] [Green Version]
- Sun, Y.L.; Zhuang, G.S.; Wang, Z.F.; Wang, Y.; Zhang, W.J.; Tang, A.H.; Zhao, X.J.; Jia, L. Regional characteristics of spring Asian dust and its impact on aerosol chemistry over northern China. Atmos. Chem. Phys. Discuss. 2006, 6, 12825–12864. [Google Scholar] [CrossRef]
- Wang, K.; Zhang, Y.; Nenes, A.; Fountoukis, C. Implementation of dust emission and chemistry into the community multiscale air quality modeling system and initial application to an Asian dust storm episode. Atmos. Chem. Phys. 2012, 12, 10209–10237. [Google Scholar] [CrossRef] [Green Version]
- Goudarzi, G.; Daryanoosh, M.S.; Godini, H.; Hopke, P.K.; Sicard, P.; De Marco, A.; Rad, H.D.; Harbizadeh, A.; Jahed, F.; Mohammadi, M.J.; et al. Health risk assessment of exposure to the Middle-Eastern Dust storms in the Iranian megacity of Kermanshah. Public Health 2017, 148, 109–116. [Google Scholar] [CrossRef] [PubMed]
- Geravandi, S.; Sicard, P.; Khaniabadi, Y.O.; De Marco, A.; Ghomeishi, A.; Goudarzi, G.; Mahboubi, M.; Yari, A.R.; Dobaradaran, S.; Hassani, G.; et al. A comparative study of hospital admissions for respiratory diseases during normal and dusty days in Iran. Environ. Sci. Pollut. R. 2017, 24, 18152–18159. [Google Scholar] [CrossRef] [PubMed]
- Khaniabadi, Y.O.; Fanelli, R.; De Marco, A.; Daryanoosh, S.M.; Kloog, I.; Hopke, P.K.; Conti, G.O.; Ferrante, M.; Mohammadi, M.J.; Babaei, A.A.; et al. Hospital admissions in Iran for cardiovascular and respiratory diseases attributed to the Middle Eastern Dust storms. Environ. Sci. Pollut. R. 2017, 24, 16860–16868. [Google Scholar] [CrossRef] [PubMed]
- Krasnov, H.; Katra, I.; Koutrakis, P.; Friger, M.D. Contribution of dust storms to PM10 levels in an urban arid environment. J. Air Waste Manag. 2013, 64, 89–94. [Google Scholar] [CrossRef]
- Liu, C.M.; Young, C.Y.; Lee, Y.C. Influence of Asian dust storms on air quality in Taiwan. Sci. Total Environ. 2006, 368, 884–897. [Google Scholar] [CrossRef] [PubMed]
- Lue, Y.L.; Liu, L.Y.; Hu, X.; Wang, L.; Guo, L.L.; Gao, S.Y.; Zhang, X.X.; Tang, Y.; Qu, Z.Q.; Cao, H.W.; et al. Characteristics and provenance of dustfall during an unusual floating dust event. Atmos. Environ. 2010, 44, 3477–3484. [Google Scholar] [CrossRef]
- Goudie, A.S. Desert dust and human health disorders. Environ. Int. 2014, 63, 101–113. [Google Scholar] [CrossRef] [PubMed]
- Hong, Y.C.; Pan, X.C.; Kim, S.Y.; Park, K.; Park, E.J.; Jin, X.; Yi, S.M.; Kim, Y.H.; Park, C.H.; Song, S.; et al. Asian dust storm and pulmonary function of school children in Seoul. Sci. Total Environ. 2010, 408, 754–759. [Google Scholar] [CrossRef] [PubMed]
- Tam, W.W.; Wong, T.W.; Wong, A.H.; Hui, D.S. Effect of dust storm events on daily emergency admissions for respiratory diseases. Respirology 2012, 17, 143–148. [Google Scholar] [CrossRef] [PubMed]
- Huang, J.; Wang, T.; Wang, W.; Li, Z.; Yan, H. Climate effects of dust aerosols over East Asian arid and semiarid regions. J. Geophys. Res.-Atmos. 2014, 119, 11398–11416. [Google Scholar] [CrossRef]
- Choobari, O.A.; Zawar-Reza, P.; Sturman, A. The global distribution of mineral dust and its impacts on the climate system: A review. Atmos. Res. 2014, 138, 152–165. [Google Scholar] [CrossRef]
- Shao, Y.; Wyrwoll, K.H.; Chappell, A.; Huang, J.; Lin, Z.; McTainsh, G.H.; Mikami, M.; Tanaka, T.Y.; Wang, X.; Yoon, S. Dust cycle: An emerging core theme in earth system science. Aeolian Res. 2011, 2, 181–204. [Google Scholar] [CrossRef]
- Bristow, C.S.; Hudson-Edwards, K.A.; Chappell, A. Fertilizing the Amazon and equatorial Atlantic with west African dust. Geophys. Res. Lett. 2010, 37. [Google Scholar] [CrossRef]
- Griffin, D.W.; Kellogg, C.A.; Shinn, E.A. Dust in the wind: Long range transport of dust in the atmosphere and its implications for global public and ecosystem health. Glob. Chang. Hum. Health 2001, 2, 20–33. [Google Scholar] [CrossRef]
- Zender, C.S.; Miller, R.L.; Tegen, I. Quantifying mineral dust mass budgets: Terminology, constraints, and current estimates. Eos Trans. Am. Geophys. Union 2004, 85, 509–512. [Google Scholar] [CrossRef]
- Zhang, X.Y.; Gong, S.L.; Zhao, T.L.; Arimoto, R.; Wang, Y.Q.; Zhou, Z.J. Sources of Asian dust and role of climate change versus desertification in Asian dust emission. Geophys. Res. Lett. 2003, 30, 2272. [Google Scholar] [CrossRef]
- Zhang, X.Y.; Arimoto, R.; An, Z.S. Dust emission from chinese desert sources linked to variations in atmospheric circulation. J. Geophys. Res.-Atmos. 1997, 102, 28041–28047. [Google Scholar] [CrossRef]
- Uno, I.; Eguchi, K.; Yumimoto, K.; Takemura, T.; Shimizu, A.; Uematsu, M.; Liu, Z.; Wang, Z.; Hara, Y.; Sugimoto, N. Asian dust transported one full circuit around the globe. Nat. Geosci. 2009, 2, 557. [Google Scholar] [CrossRef]
- Song, H.; Zhang, K.; Piao, S.; Wan, S. Spatial and temporal variations of spring dust emissions in northern China over the last 30 years. Atmos. Environ. 2016, 126, 117–127. [Google Scholar] [CrossRef]
- Wang, X.; Dong, Z.; Zhang, J.; Liu, L. Modern dust storms in China: An overview. J. Arid. Environ. 2004, 58, 559–574. [Google Scholar] [CrossRef]
- Xuan, J.; Sokolik, I.N.; Hao, J.; Guo, F.; Mao, H.; Yang, G. Identification and characterization of sources of atmospheric mineral dust in East Asia. Atmos. Environ. 2004, 38, 6239–6252. [Google Scholar] [CrossRef]
- Sun, J.; Zhang, M.; Liu, T. Spatial and temporal characteristics of dust storms in China and its surrounding regions, 1960–1999: Relations to source area and climate. J. Geophys. Res.-Atmos. 2001, 106, 10325–10333. [Google Scholar] [CrossRef]
- Guo, C.; Han, Z.; Li, A. Research Progress of Dust Storms in the Taklimakan Desert. J. Desert Res. 2016, 36, 1646–1652. Available online: http://www.desert.ac.cn/CN/10.7522/j.issn.1000-694X.2015.00262 (accessed on 24 January 2018). (In Chinese). [CrossRef]
- China Meteorological Administration. Provisional Regulations on Dust Weather Warning Services (Revised); China Meteorological Administration: Beijing, China, 2003; No. 12.
- Wang, S.; Wang, J.; Zhou, Z.; Shang, K. Regional characteristics of three kinds of dust storm events in China. Atmos. Environ. 2005, 39, 509–520. [Google Scholar] [CrossRef]
- Prospero, J. Long-range transport of mineral dust in the global atmosphere: Impact of African dust on the environment of the southeastern United States. Proc. Natl. Acad. Sci. USA 1999, 96, 3396–3403. [Google Scholar] [CrossRef] [PubMed] [Green Version]
- Rodríguez, S.; Querol, X.; Alastuey, A.; Kallos, G.; Kakaliagou, O. Saharan dust contributions to PM10 and TSP levels in Southern and Eastern Spain. Atmos. Environ. 2001, 35, 2433–2447. [Google Scholar] [CrossRef]
- Ganor, E.; Stupp, A.; Alpert, P. A method to determine the effect of mineral dust aerosols on air quality. Atmos. Environ. 2009, 43, 5463–5468. [Google Scholar] [CrossRef]
- Diapouli, E.; Manousakas, M.I.; Vratolis, S.; Vasilatou, V.; Pateraki, S.; Bairachtari, K.A.; Querol, X.; Amato, F.; Alastuey, A.; Karanasiou, A.A.; et al. AIRUSE-LIFE+: estimation of natural source contributions to urban ambient air PM10 and PM2.5 concentrations in southern Europe—Implications to compliance with limit values. Atmos. Chem. Phys. 2017, 17, 3673–3685. [Google Scholar] [CrossRef]
- Chen, L.; Zhang, M.; Zhu, J.; Skorokhod, A. Model analysis of soil dust impacts on the boundary layer meteorology and air quality over East Asia in April 2015. Atmos. Res. 2017, 187, 42–56. [Google Scholar] [CrossRef]
- Jugder, D.; Shinoda, M.; Kimura, R.; Batbold, A.; Amarjargal, D. Quantitative analysis on windblown dust concentrations of PM10 (PM2.5) during dust events in Mongolia. Aeolian Res. 2014, 14, 3–13. [Google Scholar] [CrossRef]
- Wang, S.; Yuan, W.; Shang, K. The impacts of different kinds of dust events on PM10 pollution in northern China. Atmos. Environ. 2006, 40, 7975–7982. [Google Scholar] [CrossRef]
- Xie, S.; Yu, T.; Zhang, Y.; Zeng, L.; Qi, L.; Tang, X. Characteristics of PM10, SO2, NOx and O3 in ambient air during the dust storm period in Beijing. Sci. Total Environ. 2005, 345, 153–164. [Google Scholar] [CrossRef] [PubMed]
- Guo, Y.; Xin, J.; Li, X.; Wang, S.; Li, H. Characteristics of Dust Events and Their Influence on Air Quality of Lanzhou, China. J. Desert Res. 2015, 35, 977–982. Available online: http://ir.lzu.edu.cn/handle/262010/185770 (accessed on 8 November 2016). (In Chinese). [CrossRef]
- Hwang, H.; Kim, H.; Ro, C.U. Single-particle characterization of aerosol samples collected before and during an Asian dust storm in Chuncheon, Korea. Atmos. Environ. 2008, 42, 8738–8746. [Google Scholar] [CrossRef]
- Kim, H.S.; Chung, Y.S.; Yoon, M.B. An analysis on the impact of large-scale transports of dust pollution on air quality in East Asia as observed in central Korea in 2014. Air Qual. Atmos. Health 2016, 9, 83–93. [Google Scholar] [CrossRef]
- Mori, I.; Nishikawa, M.; Tanimura, T.; Hao, Q. Change in size distribution and chemical composition of kosa (Asian dust) aerosol during long-range transport. Atmos. Environ. 2003, 37, 4253–4263. [Google Scholar] [CrossRef] [Green Version]
- Tsai, Y.; Chen, C. Characterization of Asian dust storm and non-Asian dust storm PM2.5 aerosol in southern Taiwan. Atmos. Environ. 2006, 40, 4734–4750. [Google Scholar] [CrossRef]
- Liang, C.S.; Yu, T.Y.; Lin, W.Y. Source apportionment of submicron particle size distribution and PM2.5 composition during an Asian dust storm period in two urban atmospheres. Aerosol Air Qual. Res. 2015, 15, 2609–2624. [Google Scholar] [CrossRef]
- Zhao, T.L.; Gong, S.L.; Zhang, X.Y.; Jaffe, D.A. Asian dust storm influence on north American ambient PM levels: Observational evidence and controlling factors. Atmos. Chem. Phys. 2008, 8, 2717–2728. [Google Scholar] [CrossRef]
- LI, G.; Zhou, M.; Chen, C.; Wang, H.; Wang, Q.; Lou, S.; Qiao, L.; Tang, X.; Li, L.; Huang, H.; et al. Characteristics of particulate matters and its chemical compositions during the dust episodes in Shanghai in spring, 2011. Environ. Sci. 2014, 35, 1644–1653. (In Chinese) [Google Scholar] [CrossRef]
- Guan, Q.; Cai, A.; Wang, F.; Yang, L.; Xu, C.; Liu, Z. Spatio-temporal variability of particulate matter in the key part of Gansu Province, Western China. Environ. Pollut. 2017, 230, 189–198. [Google Scholar] [CrossRef] [PubMed]
- Hsu, N.C.; Tsay, S.C.; King, M.D.; Herman, J.R. Aerosol properties over bright-reflecting source regions. IEEE Trans. Geosci. Remote Sens. 2004, 42, 557–569. [Google Scholar] [CrossRef]
- Hsu, N.C.; Tsay, S.C.; King, M.D.; Herman, J.R. Deep blue retrievals of Asian aerosol properties during ACE-Asia. IEEE Trans. Geosci. Remote Sens. 2006, 44, 3180–3195. [Google Scholar] [CrossRef]
- Hsu, N.C.; Jeong, M.J.; Bettenhausen, C.; Sayer, A.M.; Hansell, R.; Seftor, C.S.; Huang, J.; Tsay, S.C. Enhanced deep blue aerosol retrieval algorithm: The second generation. J. Geophys. Res. Atmos. 2013, 118, 9296–9315. [Google Scholar] [CrossRef]
- Gelaro, R.; McCarty, W.; Suárez, M.J.; Todling, R.; Molod, A.; Takacs, L.; Randles, C.A.; Darmenov, A.; Bosilovich, M.G.; Reichle, R.; et al. The modern-era retrospective analysis for research and applications, version 2 (MERRA-2). J. Clim. 2017, 30, 5419–5454. [Google Scholar] [CrossRef]
- Randles, C.A.; da Silva, A.M.; Buchard, V.; Colarco, P.R.; Darmenov, A.; Govindaraju, R.; Smirnov, A.; Holben, B.; Ferrare, R.; Hair, J.; et al. The MERRA-2 aerosol reanalysis, 1980 onward. Part I: System description and data assimilation evaluation. J. Clim. 2017, 30, 6823–6850. [Google Scholar] [CrossRef] [PubMed]
- Buchard, V.; Randles, C.A.; da Silva, A.M.; Darmenov, A.; Colarco, P.R.; Govindaraju, R.; Ferrare, R.; Hair, J.; Beyersdorf, A.J.; Ziemba, L.D.; et al. The MERRA-2 aerosol reanalysis, 1980 onward. Part II: Evaluation and case studies. J. Clim. 2017, 30, 6851–6872. [Google Scholar] [CrossRef]
- Ministry of Environmental Protection of the People’s Republic of China. Technical Regulation on Ambient Air Quality Index (on Trial). HJ 633-2012. China; 2012. Available online: http://kjs.mep.gov.cn/hjbhbz/bzwb/jcffbz/201203/t20120302_224166.shtml (accessed on 11 January 2017).
- Berrisford, P.; Dee, D.P.; Poli, P.; Brugge, R.; Fielding, K.; Manuel, F.; Kållberg, P.W.; Kobayashi, S.; Uppala, S.; Simmons, A. The Era-Interim Archive Version 2.0. Available online: https://www.ecmwf.int/en/elibrary/8174-era-interim-archive-version-20 (accessed on 2 May 2018).
- McTainsh, G.H.; Leys, J.F.; O’Loingsigh, T.; Strong, C.L. Wind Erosion and Land Management in Australia during 1940–1949 and 2000–2009. Available online: https://soe.environment.gov.au/sites/g/files/net806/f/soe2011-supplementary-land-wind-erosion-and-land-management-australia-during-1940-1949and2000-2009.pdf?v=1487823622 (accessed on 17 January 2017).
- O’Loingsigh, T.; McTainsh, G.H.; Tews, E.K.; Strong, C.L.; Leys, J.F.; Shinkfield, P.; Tapper, N.J. The Dust Storm Index (DSI): A method for monitoring broadscale wind erosion using meteorological records. Aeolian Res. 2014, 12, 29–40. [Google Scholar] [CrossRef]
- Shao, Y.; Yang, Y.; Wang, J.; Song, Z.; Leslie, L.M.; Dong, C.; Zhang, Z.; Lin, Z.; Kanai, Y.; Yabuki, S.; et al. Northeast Asian dust storms: Real-time numerical prediction and validation. J. Geophys. Res. 2003, 108. [Google Scholar] [CrossRef] [Green Version]
- Song, Z.; Wang, J.; Wang, S. Quantitative classification of northeast Asian dust events. J. Geophys. Res.-Atmos. 2007, 112. [Google Scholar] [CrossRef] [Green Version]
- Meteorological Observation Centre of CMA. Pratical Manual for Tachnical Specifications of Ground Meteorological Observation, 1st ed.; China Meteorological Press: Beijing, China, 2016; pp. 30–31. ISBN 9787502963446.
- Wilks, D.S. Statistical Methods in the Atmospheric Sciences, 3rd ed.; Academic Press: Oxford, UK, 2011; pp. 50–54. ISBN 9780123850232. [Google Scholar]
- China Meteorological Administration. Dust Weather Yearbooks of 2015, 1st ed.; China Meteorological Press: Beijing, China, 2017; pp. 36–70. ISBN 9787502965501.
- Wan, R.; Wu, G. Mechanism of the spring persistent rains over southeastern China. Sci. China Ser. D 2007, 50, 130–144. [Google Scholar] [CrossRef]
- WHO. Air Quality Guidelines—Global Update 2005. Available online: http://www.who.int/phe/health_topics/outdoorair/outdoorair_aqg/en/ (accessed on 12 July 2018).
- Ministry of Environmental Protection of the People’s Republic of China. Ambient Air Quality Standards. GB3095-2012. China; 2012. Available online: http://kjs.mep.gov.cn/hjbhbz/bzwb/dqhjbh/dqhjzlbz/201203/t20120302_224165.htm (accessed on 11 January 2017).
- Daryanoosh, M.; Goudarzi, G.; Rashidi, R.; Keishams, F.; Hopke, P.K.; Mohammadi, M.J.; Nourmoradi, H.; Sicard, P.; Takdastan, A.; Vosoughi, M.; et al. Risk of morbidity attributed to ambient PM10 in the western cities of Iran. Toxin Rev. 2017. [Google Scholar] [CrossRef]
- Khaniabadi, Y.O.; Daryanoosh, S.M.; Amrane, A.; Polosa, R.; Hopke, P.K.; Goudarzi, G.; Mohammadi, M.G.; Sicard, P.; Armin, H. Impact of Middle Eastern Dust storms on human health. Atmos. Pollut. Res. 2017, 8, 606–613. [Google Scholar] [CrossRef] [Green Version]
- Tian, S.F.; Yasunari, T. Climatological aspects and mechanism of spring persistent rains over central China. J. Meteorol. Soc. Jpn. 1998, 76, 57–71. [Google Scholar] [CrossRef]
- Chen, J.; Zhao, S.; Yin, D.; Qu, J. Effect of Dust Process on Air Quality in Cities of Northern China. J. Desert Res. 2015, 35, 423–430. Available online: http://www.cqvip.com/qk/97197x/201502/1005689295.html (accessed on 14 November 2016). (In Chinese). [CrossRef]
Figure 1.
(a) Spatial distribution of topographic elevation (shade, unit: m), major geographic regions in China (brown letters) and provinces (blue letters) mentioned in the text; (b) Locations of weather stations in the Taklimakan Desert and the corresponding frequencies of dust events occurring in 2015; (c) Locations of 367 air quality monitoring sites in China and their air quality indices averaged for 2015. The black boxes indicate the Taklimakan Desert region.

Figure 2.
Normalized daily station-observed DI (grey bar), visibility (multiplied by −1, red line), MODIS 550 nm AOD (blue line), MERRA-2 dust surface mass concentration (purple line) in the Taklimakan Desert region from 15 February 2015 to 15 June 2015.
Figure 2.
Normalized daily station-observed DI (grey bar), visibility (multiplied by −1, red line), MODIS 550 nm AOD (blue line), MERRA-2 dust surface mass concentration (purple line) in the Taklimakan Desert region from 15 February 2015 to 15 June 2015.

Figure 3.
Distribution of correlation coefficients of daily DI in the Taklimakan Desert with simultaneous (a), 1-day lagged (b), 2-day lagged (c) and 3-day lagged (d) daily average PM10 mass concentration at 367 cities in China from 15 February to 15 June 2015. Areas above the 95% confidence level are dotted. The stars indicate the locations of 13 cities in Figures 5 and 9.

Figure 4.
Distribution of correlation coefficients of daily DI in the Taklimakan Desert with simultaneous (a), 1-day lagged (b), 2-day lagged (c) and 3-day lagged (d) daily average PM2.5 mass concentration at 367 cities in China from 15 February to 15 June 2015. Areas above the 95% confidence level are dotted. The stars indicate the locations of 13 cities in Figures 5 and 9.

Figure 5.
PM10 (a) and PM2.5 (b) concentrations averaged for dust days and non-dust days, and their increment (the corresponding percentage increments marked in the right Y axis) at 13 cities from 15 February to 15 June in 2015: 1. Aksu, 2. Hotan, 3. Korla, 4. Turpan, 5. Hami, 6. Jiayuguan, 7. Jiuquan, 8. Zhangye, 9. Lanzhou, 10. Xi’an, 11. Luoyang, 12. Chengdu, and 13. Chongqing. The locations of the 13 cities are shown in Figure 3a. The error bars indicate the standard errors.

Figure 6.
700 hPa wind field averaged for the Taklimakan dust days (a) and the difference in the 700 hPa wind fields between the dust days and non-dust days (b). The wind speed legend information is shown in the lower right corner of each panel. The red boxes indicate the Taklimakan Desert region.
Figure 6.
700 hPa wind field averaged for the Taklimakan dust days (a) and the difference in the 700 hPa wind fields between the dust days and non-dust days (b). The wind speed legend information is shown in the lower right corner of each panel. The red boxes indicate the Taklimakan Desert region.

Figure 7.
Spatial distribution of daily anomalies (based on annual average of 2015) of the the MERRA-2 dust surface mass concentration (by the color scale) from 30 March to 4 April in 2015 (a–f). The different markers indicate the air quality levels from moderate to severe pollution.
Figure 7.
Spatial distribution of daily anomalies (based on annual average of 2015) of the the MERRA-2 dust surface mass concentration (by the color scale) from 30 March to 4 April in 2015 (a–f). The different markers indicate the air quality levels from moderate to severe pollution.

Figure 8.
Variations of hourly concentration of PM10 (a) and PM2.5 (b) at five cities (Turpan, Jiuquan, Lanzhou, Xi’an, Luoyang) during a severe dust event (from 30 March to 4 April). The locations of the five cities are shown in Figure 3a.
Figure 8.
Variations of hourly concentration of PM10 (a) and PM2.5 (b) at five cities (Turpan, Jiuquan, Lanzhou, Xi’an, Luoyang) during a severe dust event (from 30 March to 4 April). The locations of the five cities are shown in Figure 3a.

Figure 9.
Mean PM10 (a), PM2.5 (b) and AQI (c) values at 13 cities in the first five event days after the initiation of the composite dust event, averaged for the six severe dust events during the study period. The air quality levels are presented in panel (c). The names of the 13 cities are the same as in Figure 3, Figure 4 and Figure 5: 1. Aksu, 2. Hotan, 3. Korla 4. Turpan, 5. Hami, 6. Jiayuguan, 7. Jiuquan, 8. Zhangye, 9. Lanzhou, 10. Xi’an, 11. Luoyang, 12. Chengdu, and 13. Chongqing. The locations of the 13 cities are shown in Figure 3a.


Table 1.
Statistics of dust indices (DI) during six major dust events in Taklimakan Desert in spring of 2015.
Table 1.
Statistics of dust indices (DI) during six major dust events in Taklimakan Desert in spring of 2015.
| Dust Events | 24–26 February | 10–17 March | 31 March–4 April | 27–30 April | 10–12 May | 9–12 June |
|---|---|---|---|---|---|---|
| Max DI | 57.08 | 75.16 | 86.76 | 81.93 | 81.78 | 68.23 |
| Mean DI | 51.24 | 69.71 | 71.59 | 57.11 | 69.26 | 56.05 |
© 2018 by the authors. Licensee MDPI, Basel, Switzerland. This article is an open access article distributed under the terms and conditions of the Creative Commons Attribution (CC BY) license (http://creativecommons.org/licenses/by/4.0/).
Share and Cite
MDPI and ACS Style
Li, X.; Liu, X.; Yin, Z.-Y. The Impacts of Taklimakan Dust Events on Chinese Urban Air Quality in 2015. Atmosphere 2018, 9, 281. https://doi.org/10.3390/atmos9070281
AMA Style
Li X, Liu X, Yin Z-Y. The Impacts of Taklimakan Dust Events on Chinese Urban Air Quality in 2015. Atmosphere. 2018; 9(7):281. https://doi.org/10.3390/atmos9070281
Chicago/Turabian StyleLi, Xiaoyu, Xiaodong Liu, and Zhi-Yong Yin. 2018. "The Impacts of Taklimakan Dust Events on Chinese Urban Air Quality in 2015" Atmosphere 9, no. 7: 281. https://doi.org/10.3390/atmos9070281
Note that from the first issue of 2016, this journal uses article numbers instead of page numbers. See further details here.