Urban Estuarine Beaches and Urban Water Cycle Seepage: The Influence of Temporal Scales


1
CIIMAR—UP, Interdisciplinary Centre of Marine and Environmental Research of the University of Porto, Novo Edifício do Terminal de Cruzeiros do Porto de Leixões, Avenida General Norton de Matos, S/N, 4450-208 Matosinhos, Portugal
2
ICBAS—UP, Institute of Biomedical Sciences of Abel Salazar—University of Porto, Rua Jorge Viterbo Ferreira 228, 4050-313 Porto, Portugal
*
Author to whom correspondence should be addressed.
Water 2018, 10(2), 173; https://doi.org/10.3390/w10020173
Submission received: 4 October 2017
/
Revised: 18 December 2017
/
Accepted: 6 February 2018
/
Published: 9 February 2018
(This article belongs to the Special Issue Urban Water Cycle Modelling and Management)
Abstract
:Temperate estuarine beaches are an asset to coastal cities. Being located within the transition zone where the river meets the sea can provide several environmental benefits such as warm water temperature during the summer, flat waters, protection from coastal upwelling-induced morning fog, as well as additional recreational and cultural values. In this study we address a major question—can the urban water cycle impair the water quality dynamics during a bathing season in a temperate Atlantic estuary (Douro, Northwest Portugal)? Water quality was assessed according to the EU legal criteria at different time scales. No daily, weekly, or monthly patterns for microbiological descriptors were found, which rather followed the hourly tidal dynamics. Quality decreased during high tide, affecting potentially 800+ beach-users during mid-summer weekends (4 m2 per person). Low water quality was transported upstream from highly populated urban areas. Therefore, the understanding of the dynamics of estuarine systems is essential to adapt the standard official approach, and the obtained results can be used to draw policy recommendations to improve the sampling strategy, aiming for more accurate assessment of the water quality to reduce the risk hazard of estuarine beaches.
1. Introduction
Tourism in coastal areas reached its peak in recent decades, contributing to national economies as well as to the wellbeing of local communities [1]. In addition, when temperatures rise, going to the beach is a top choice for many people with tangible effects on both physical and mental health. If properly managed, a bathing area may be an important source of revenue [2], also providing a range of environmental services beneficial to society [3].
Coastal cities may have oceanic beaches nearby to complement their recreational offers. However, throughout history, estuaries have been strategically chosen for human settlements [4], and if estuarine margins are not unreachable, they provide alternative beaches right at hand, even in no-swim areas, i.e., those not surveyed in terms of water quality assessment according to the legal criteria. Therefore, beach water quality is of particular concern in the coastal zone.
Within the European Union, the current Bathing Water Directive (BWD) [5] regulates the water quality assessment, and swimming interdiction may be imposed or lifted, accordingly. This depends on the outcome of the microbiological assessment that, inherently to the methodologies, does not provide real-time values. Moreover, the mandatory advertisement of water quality for a particular beach may be delayed due to bureaucratic practice, making the utility of such information questionable, introducing confusion to the public, and undermining their confidence.
In line with the US Environmental Protection Agency approach to gauge the level of contamination and to infer potential health risks [6], the BWD determines the use of Escherichia coli and intestinal enterococci as indicators. Two decades before, EPA [7] recommended the use of intestinal enterococci as the sole indicator for ocean water bacterial monitoring. Recently, Fewtrell & Kay [8] reviewed epidemiological studies and quantitative microbial risk assessments of infection risk from recreational water use. Again, the selection of enterococci and/or E. coli as the most suitable water quality indicators was questioned, and the use of models and more locally customized approaches have been proposed, not in line with the current European BWD. Therefore, the way water is tested has strong implications for beach closure and restrictions, i.e., on the use and management. This issue is even more complex when considering the highly dynamic water quality of urban tidal beaches with deficient wastewater treatment, and multiple urban tributaries, as in the case of the Douro estuary.
The current sampling strategy proposed in the BWD [5] does not account for short-term but important variability, such as day-to-day, tide-to-tide, or even morning-afternoon, that occurs in tidal beaches exposed to urban run-off. Moreover, in the directive, only extraordinary short-term pollution events are referenced—which may lead to samples being disregarded if the scheduled collection is performed during those episodes, but not when systematic or periodic events occur. Indeed, levels of contamination affecting the overall water quality can vary substantially on a temporal scale of minutes to hours or days [9,10,11]. Illness of swimmers has been related to bacterial indicator concentrations measured on the same day but not the day before [12], calling the attention for the need of a better performing beach water quality assessment approach.
All around the world, modern approaches to city organization intend to implement the concept of the “urban water cycle”, aiming for environmental, economic, and social sustainability in the use of water sources, while considering water supply and demand management options (for a review see [13]). Nonetheless, the common focus seems to be the supply, the water “entering” the cycle. The water “leaving” the cycle is seldom sufficiently monitored, and its fate is often overlooked. Therefore, if an urban water cycle is not properly closed, wastewater may be released into the environment, impacting the water quality of the receiving water body, including its recreational use.
In this work, we focused on an estuarine beach located in a European metropolitan area with c.a. 2 million inhabitants and deficient sewage treatment [14]. The objective was to assess different variability scales (spatial—within the beach; temporal—morning/afternoon, daily, weekly, and monthly), in the water quality during a bathing season. The ultimate goal was to optimize a sampling strategy to improve the significance of the results for the evaluation of water quality of the urban beaches, providing realistic assurance of bathing safety to the public.
2. Materials and Methods
2.1. Area Description
The work was performed at Zebreiros beach (Figure 1), within the Gondomar municipality, on the upper Douro estuary (41.07786° N, −8.51630° W). This particular beach is located in the large urban area of Porto (NW Portugal), and is highly popular during summer. Infrastructures and accessibilities have been considerably improved by local authorities, with parking, toilets, bars, and first aid assistance by lifeguards, in line with the Blue Flag requirements [15]. The beach was officially recognized as a bathing area in 2016, but the delimitation of the water front with interconnected buoys with a chord lacked any scientific background.
The estuary has semi-diurnal tides (range up to 4 m), and river flow towards the sea—end member depends greatly on the regime of a large hydroelectric power dam on the upper estuarine limit (2 km from the studied area, 21.5 km from the river mouth). Typically, during the summer, daily freshwater inputs range from 0 to 416 m3 s−1 (average ± SE = 139 ± 15). Treated and partially treated sewage from 8 plants is discharged into the estuary (Figure 1).
2.2. Study Design
No detailed historical data on water quality were available. As such, in order to characterize Zebreiros beach and to evaluate its condition according to the relevant European directive for bathing waters [5], an intensive sampling program was implemented during the 4-month 2016-bathing season—officially between 15 June and 15 September.
The sampling program was designed to incorporate different time scale water quality variations, including hourly (during 25 h, 20–21 July), daily (through 8 days, 18–25 July), weekly (during 5 weeks, 4 July–2 August), and monthly (through 4 months, 7 June–6 September. With the exception of the hourly sampling surveys, all samples were collected during the morning low tide.
Within the official delimited beach area, three survey sites were established, namely Z1 (upstream beach limit), Z2 (middle of the beach), and Z3 (downstream beach limit) (Figure 1). The hourly sampling survey was performed at Z2 location only, due to logistic limitations.
During each sampling survey, measurements of subsurface (0–30 cm) key environmental parameters (temperature, conductivity, salinity, dissolved oxygen, turbidity, and pH) were performed with a multiparameter YSI 6000 probe. Tidal height was measured with a pressure sensor (YSI) and was compared to official tidal tables. Water samples were collected with sterile sampling bottles for microbiological analysis, and kept refrigerated in ice chests until processing. Microbiological indicators for the hourly sampling were collected for Z2 only.
Monthly sampling events also included the morphological characterization of the beach, by taking beach profiles with the Emery method [16]. Bathymetric profiles of the river area contiguous to Zebreiros beach were performed with a sonar, in August 2016, resulting in a depth chart of a specific stretch of the upper estuary.
Additionally, the number of beachgoers was recorded as a measure of beach use during all sampling surveys, and the available area per person calculated.
2.3. Analytical Procedures
In the laboratory, water samples were concentrated onto a sterile membrane of 0.45 µm pore size and 47 mm diameter (Schleicher Schull ME 25/21 ST). Escherichia coli were assessed on ChromoCult® Coliform agar (Merck, Darmstadt, Germany), and typical dark-blue to violet colonies were counted after 24 h incubation at 37 °C. Intestinal enterococci (IE) were assessed on Slanetz & Bartley agar (Oxoid Ltd., Hants, England), and typical reddish-brown colonies were counted after 48 h incubation at 44.5 °C [10]. The methods used were in accordance with ISO reference methods required by the BWD.
2.4. Data Treatment
The temporal and spatial variability of the main environmental parameters was mapped with Surfer 11.0 software (Golden Software Inc., Golden, CO, USA), using kriging (linear variogram model) as the gridding method.
Data were tested for normality and homogeneity of variances using Shapiro-Wilk and Levene’s tests, respectively. E. coli and IE values were normalized by logarithm (log10) transformation prior to statistical analysis. Differences between time scales and sampling sites were analyzed by analysis of variance (ANOVA). Whenever significant differences were detected, a post hoc Tukey honestly significant difference (HSD) multicomparison test was performed. Time and space variability of E. coli was assessed by Kruskal-Wallis test since parametric assumptions were not met. Statistical analysis was performed at the 95% confidence level (p < 0.05) using STATISTICA 13.0 (StatSoft, Inc., Palo Alto, CA, USA).
3. Results
3.1. Beach and Bathing Water Abiotic Characterization
Bathymetric data were adjusted to low tide and were coordinated with beach morphology to produce cross-sections of the river bottom and Zebreiros beach surface. An example of the middle of the beach is presented in Figure 1 (insert). The deeper area on the left bank of the river corresponds to the navigational channel, artificially maintained by periodical dredging. The physical profile of the beach was revealed to be dynamic over time, but mainly in the fringe influenced by tides, with sand moving generally upstream (data not shown).
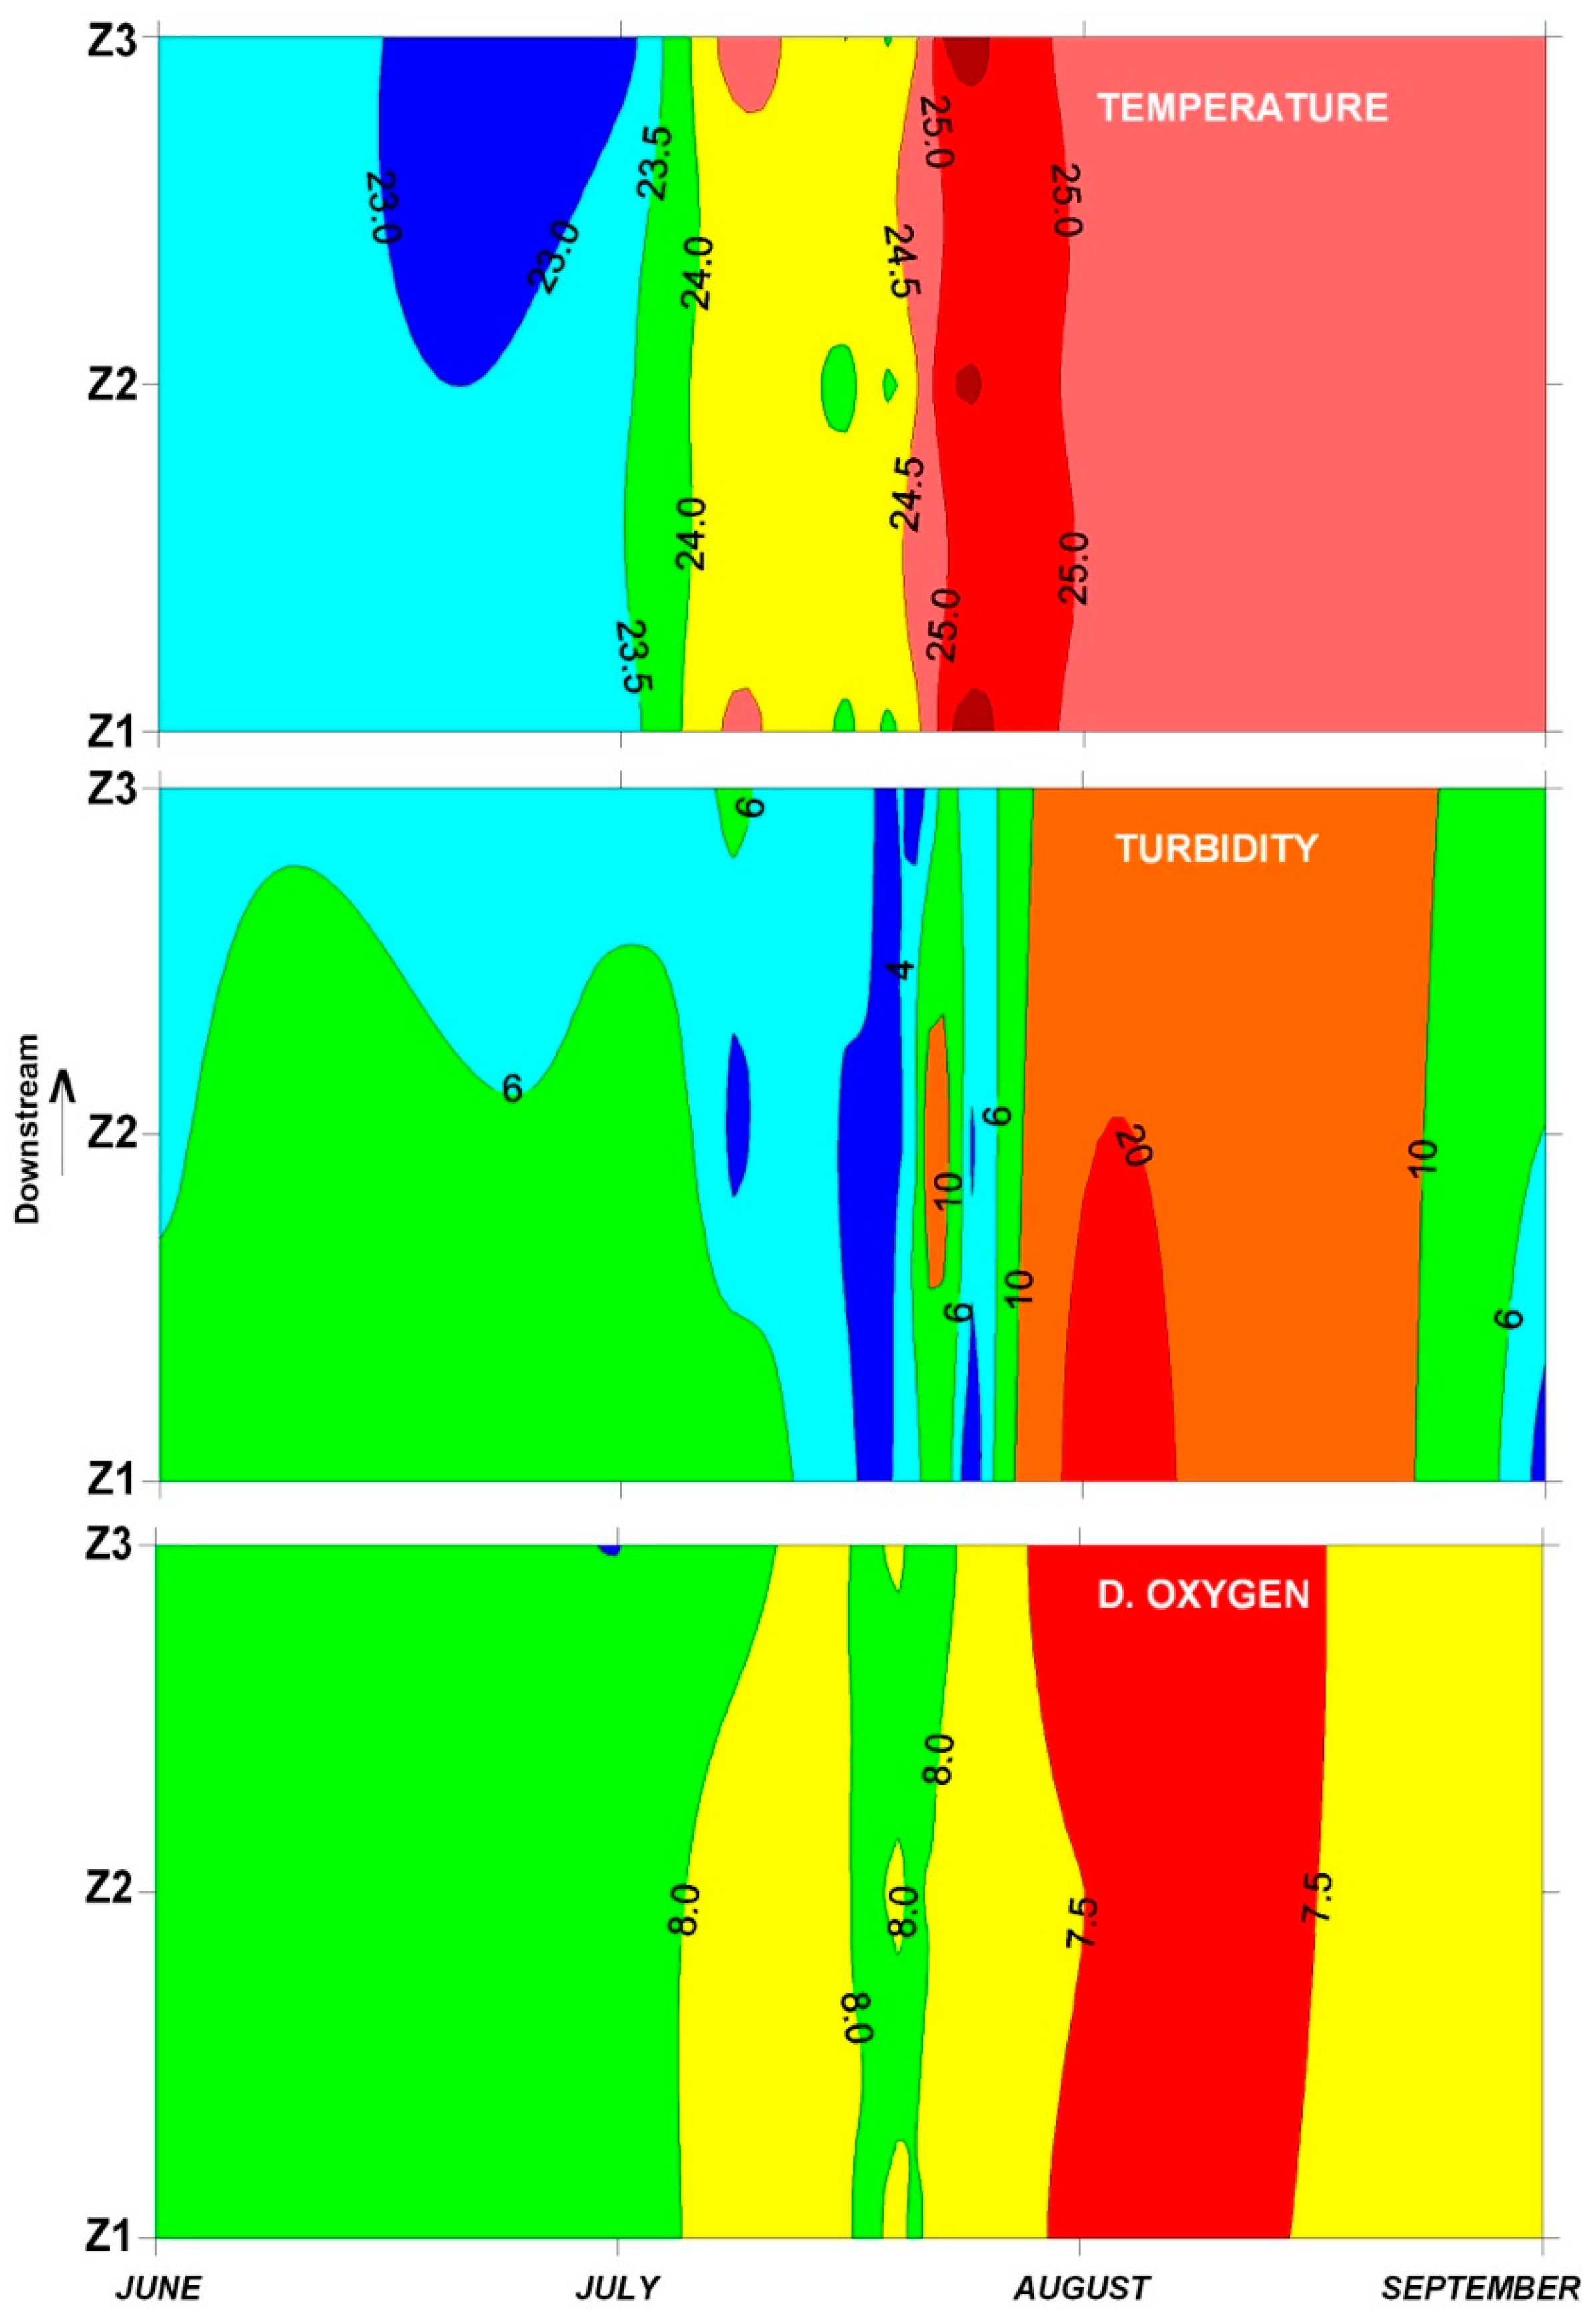
The daily, weekly, and monthly variability of selected water environmental parameters is presented in Figure 2.
The mean temperature was rather stable during the bathing season, ranging from a mean value of 23.12 °C (±0.21) in June to 24.77 °C (±0.03) in August, whereas the mean pH ranged from 7.28 (±0.04) to 7.63 (±0.03). The lowest oxygen saturation mean value occurred in August (7.1 ± 0.12 mg/L), with values over 7.88 mg/L in the other months. Average turbidity was 6 ± 0.8 NTU with the highest values (19.5 ± 3.0 NTU) in August. Water conductivity was rather stable, 300 ± 3 µS cm−1, denoting the low water tidal conditions.
3.2. Water Quality Indicators
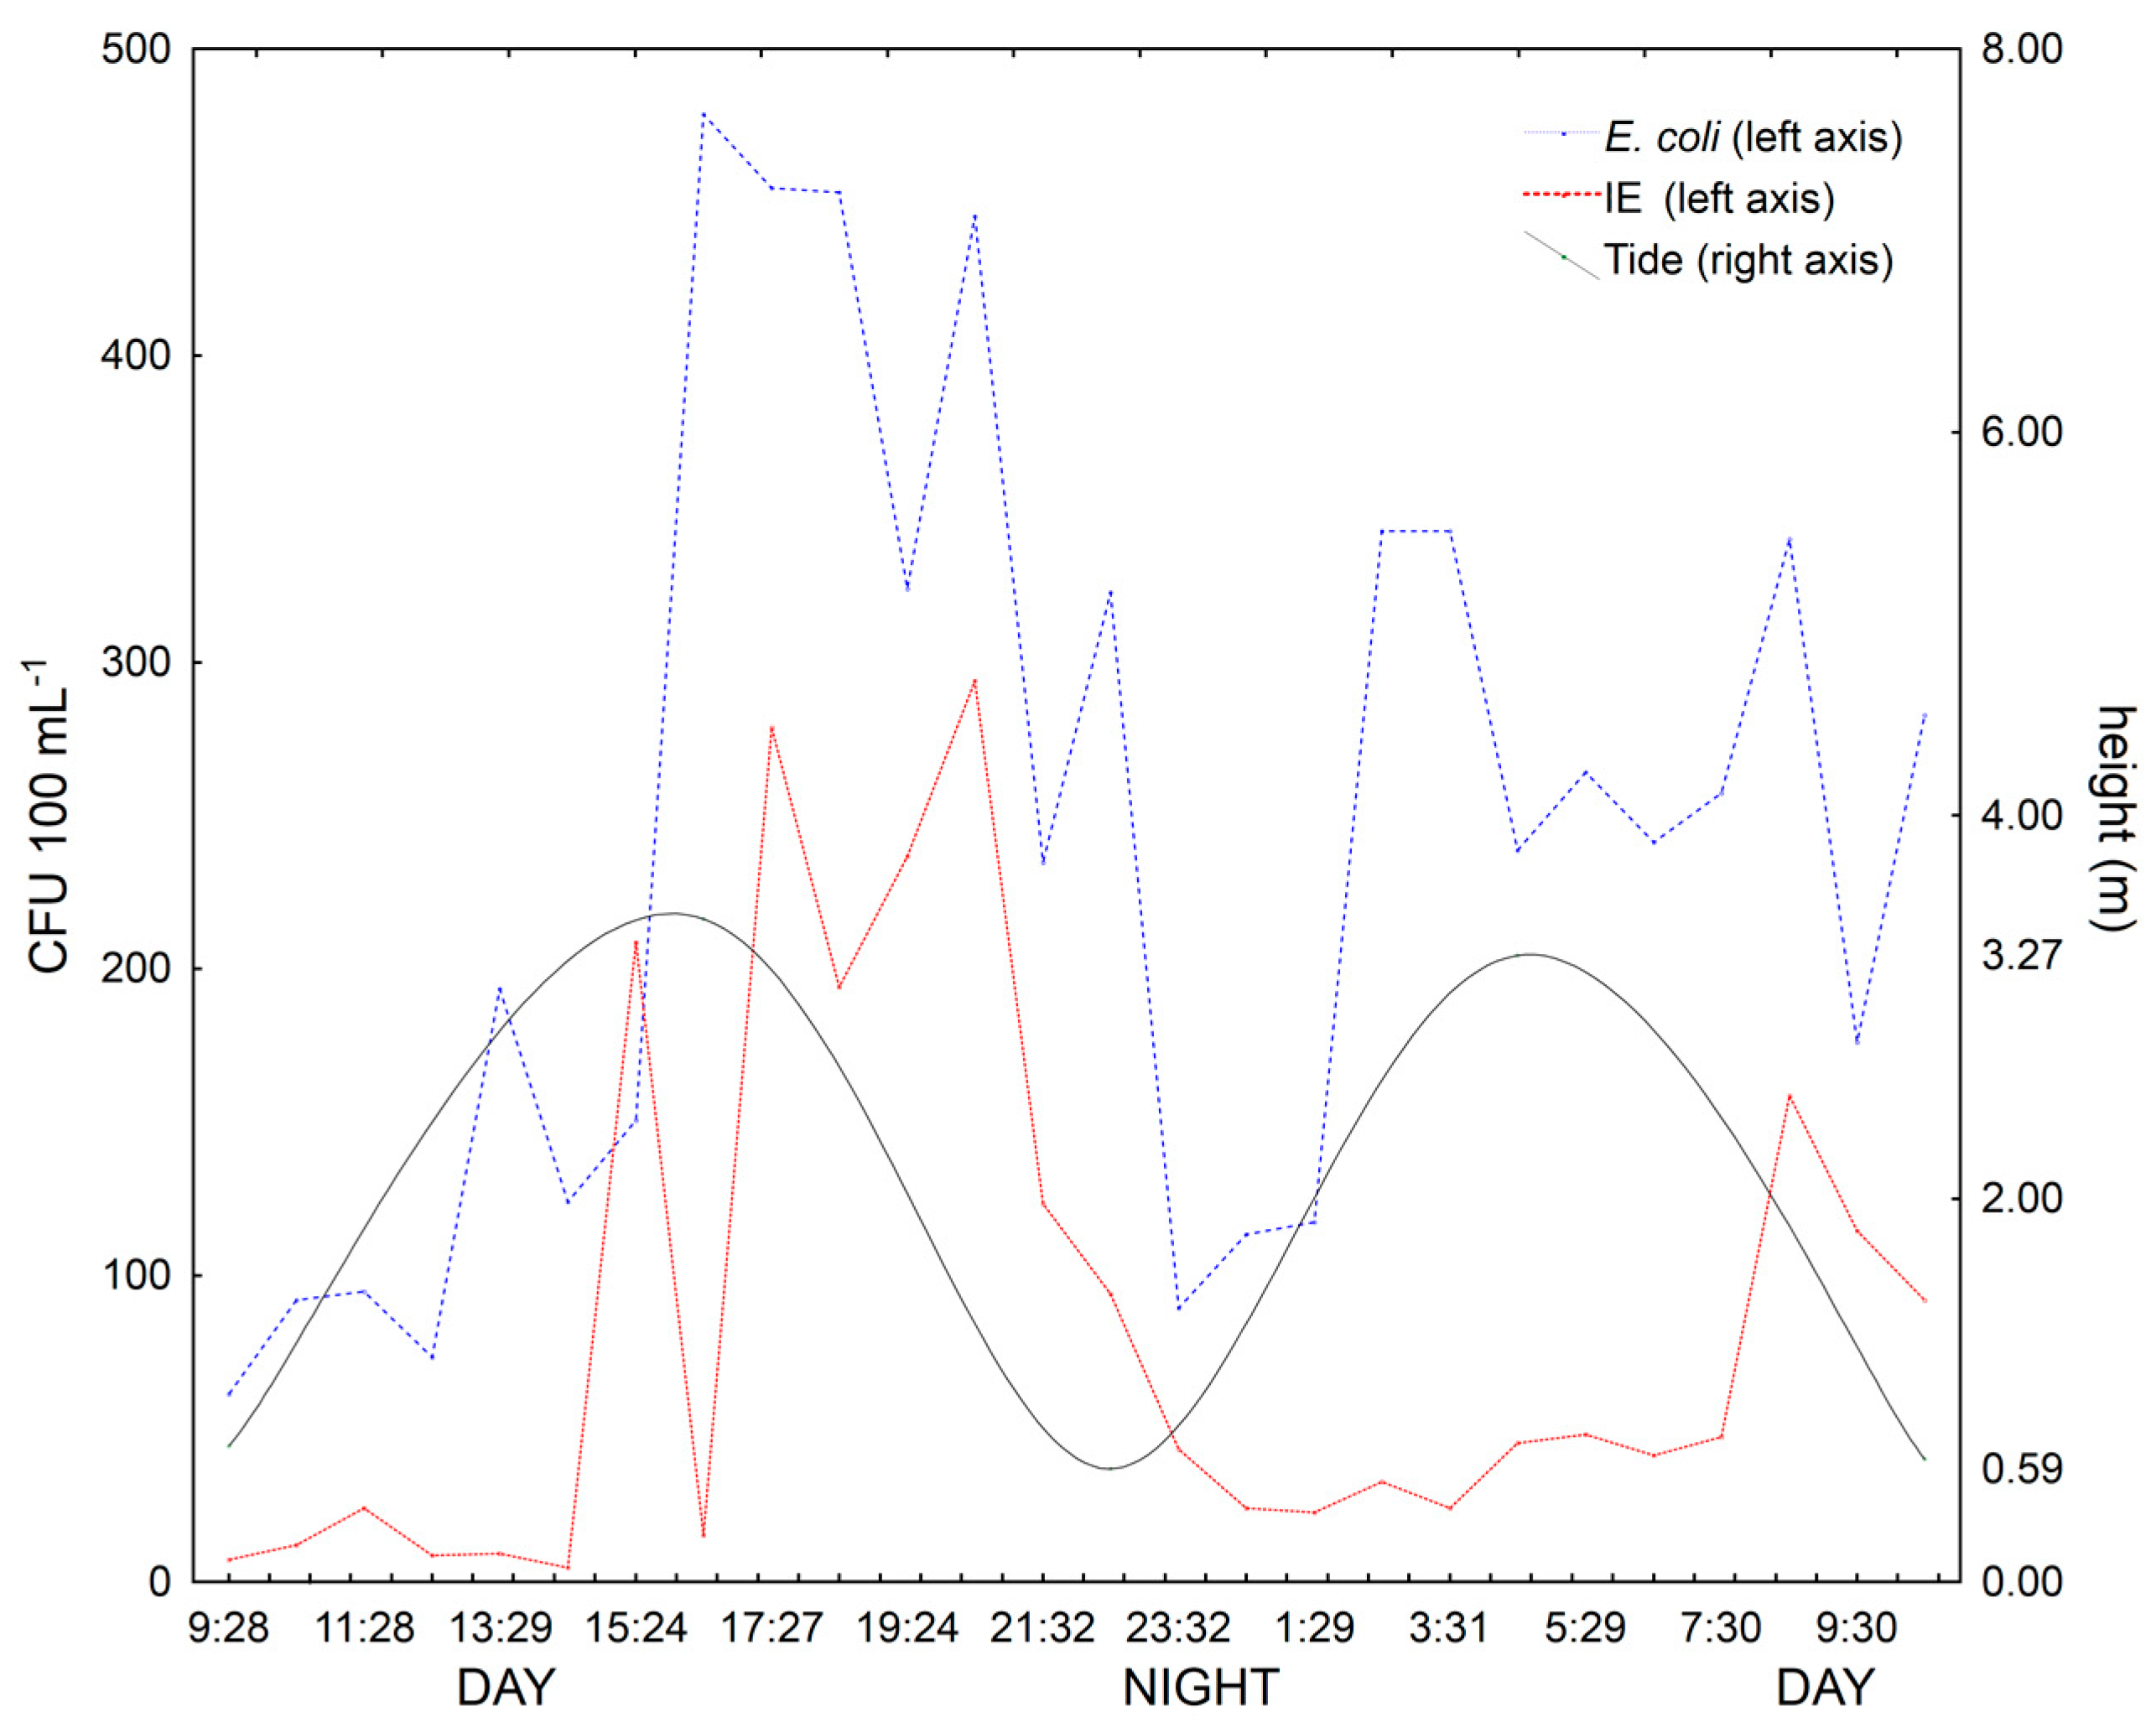
In accordance with the BWD, the number of cfu per 100 mL of E. coli and intestinal enterococci was used for microbiological water assessment, and eventually worsened from the upper (Z1) towards the downstream area of the bathing zone (Z3) in spite of the short distance (Figure 3). Throughout the study, no clear pattern for daily, weekly, or monthly time scales was found, but the hourly sampling seemed to follow the tidal cycle (Figure 4).
It should be noted that microbial indicators tended to increase at mid low and high tide, when the water velocity in the Douro estuary tended to increase (data not shown), downstream and upstream, respectively. E. coli values were not significantly different between time scales, or sites (p > 0.05). With respect to the IE, significant (p < 0.05) differences could be identified between hourly and weekly surveys.
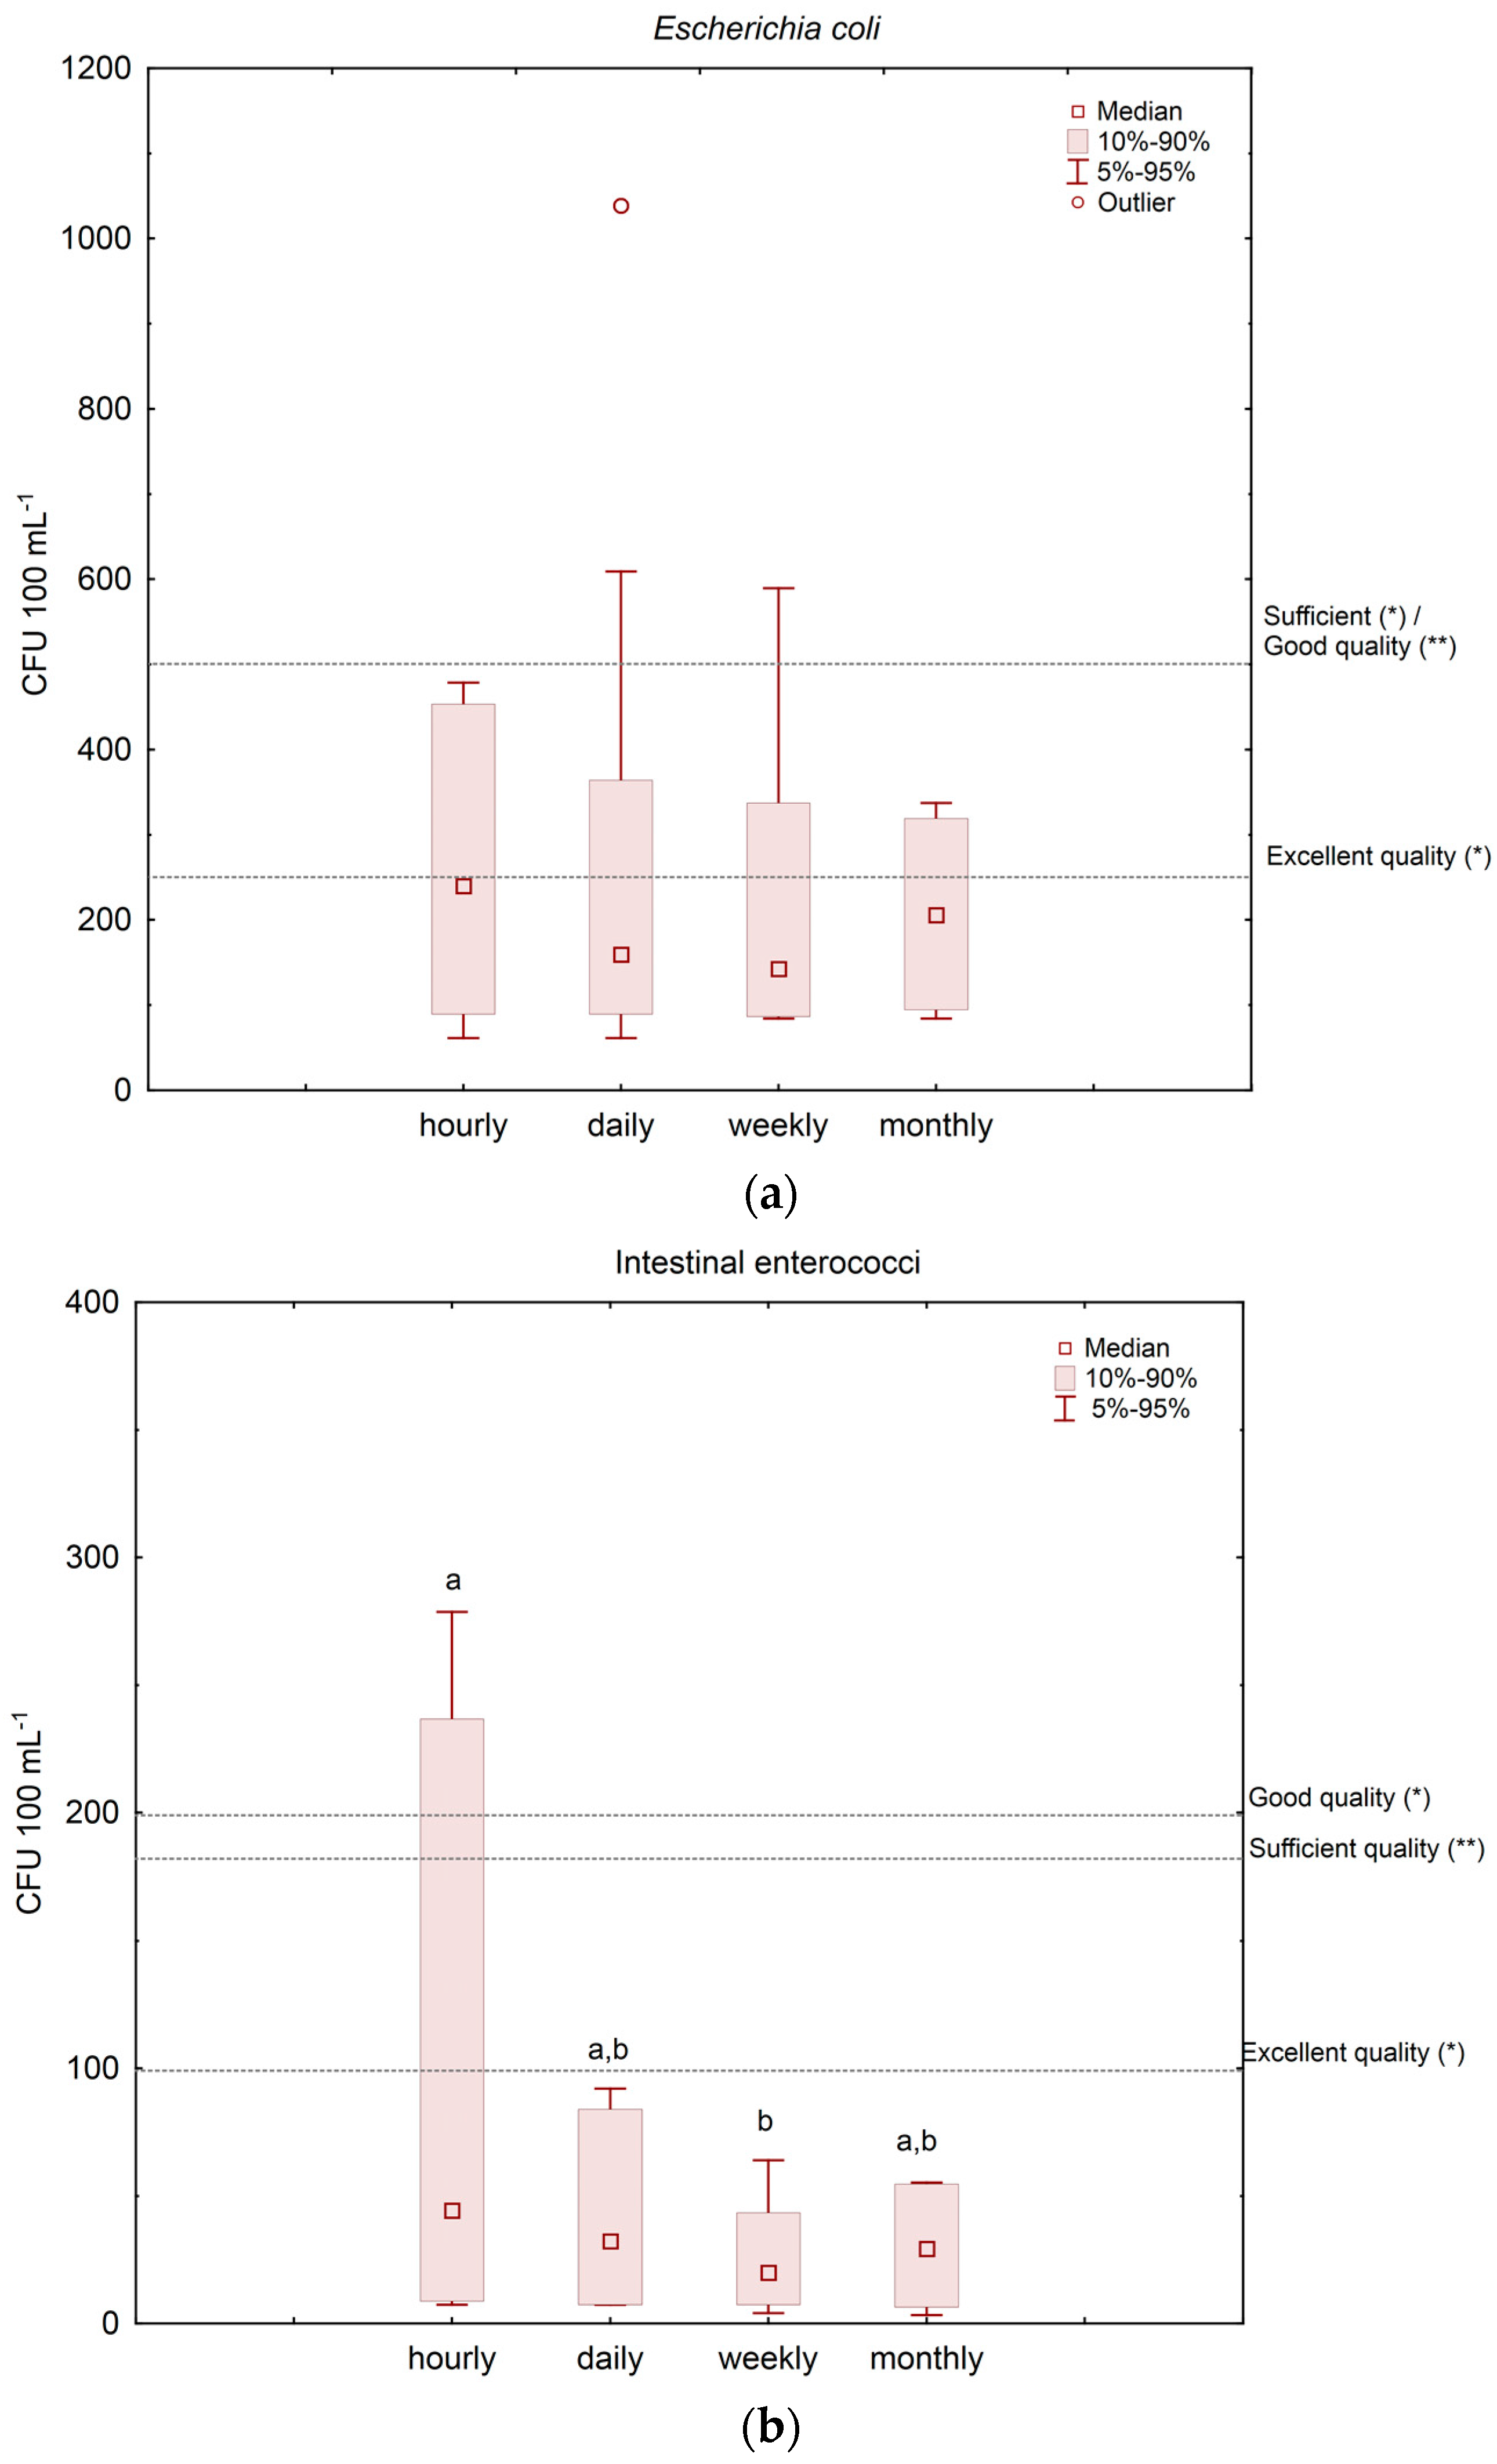
Nonetheless, variance within each temporal scale allows further interpretations. Hourly to monthly scales are represented in Figure 5, with emphasis on the BWD benchmarks. In spite of the overall median values being in the range Excellent (percentile 90 < 250 for E. coli; percentile 90 < 100 for IE), according to the European legal criteria, the variability was important, down to Good (percentile 95 < 500 for E. coli; percentile 95 < 200 for IE) and Sufficient (percentile 90 < 500 for E. coli; percentile 90 < 185 for IE).
3.3. Beach Use
The number of sun seekers using the beach varied greatly during the summer season and with the time of day. We recorded a few beachgoers in the early hours of a mid-week morning to 800+ on a weekend afternoon. Considering the total usable area of the beach with sand (within and outside the delimitation zone), this corresponded to an approximated value of 4 m2 per user during peak periods, attesting the popularity of Zebreiros estuarine bathing waters.
4. Discussion
4.1. Bathing Water Quality
The values recorded for the abiotic parameters in Zebreiros bathing waters are within the acceptable range for recreational purposes. Nonetheless, sampling in August coincided with a period of systemic severe fires in the surrounding unplanted forests, which might explain the noticeable decrease in water abiotic parameter quality, namely, dissolved oxygen and turbidity, owing to the deposition of ash and other debris. Concomitantly, the number of beachgoers also increased, contributing to the re-suspension of bottom fine particles and turbidity, a process that tends to increase IE in the water [8], but not noticed at Zebreiros (see below).
Regarding the water quality indicators according to the European legal criteria, Zebreiros beach would fall into different water quality categories according to the time scale of choice and the microbial indicator—IE or E. coli. As such, samples collected during the morning low tide would lead to a better water quality classification using IE as an indicator, falling within the category of Excellent, at any daily, weekly, or monthly scale; and a classification of Inadequate for bathing when hourly data are considered. Therefore, water quality tended to change faster in a short time period, being rather conservative on a day-to-day up to month-to-month framework. For the other indicator, E. coli, estimated values fell within classifications of Sufficient for daily and weekly scales, while hourly and monthly scales were classified as Good.
In coastal/ocean beaches, the main sources of fecal pollution with major influence on health risks to beach-goers are (i) storm water run-off, particularly when combined systems are still in use; (ii) untreated sewage point-discharge; (iii) fecal polluted rivers, and (iv) poorly treated sewage outflow. Bird droppings—a common endogenous source of bacteria should also be considered (e.g., [17]). Indeed, the removal of birds, such as gulls, may dramatically improve the water quality of ocean beaches [18]. In the Douro estuary, besides gulls, a myriad of other birds inhabit its shores all year round due to the intrinsic protection associated with the environment and the abundant feeding grounds, such as pigeons, ducks, waders, egrets, and sea crows. Their role as local sources of fecal materials is unknown.
The concentration of indicator bacteria has been used for decades to measure recreational water safety [19]. The current BWD [5] removed most tangible indicators except E. coli and intestinal enterococci in order to safeguard public health of beach goers. In this study, which was not designed to identify relationships between the concentration of bacterial indicators and illness among beach goers, IE seems to correlate better with such factors as tides—inferred from the 25-h sampling survey, than E. coli, probably due to the fact that enterococci have a larger decay rate with respect to beach water (e.g., [20]), i.e., survive longer. Indeed, the hourly variation of bacterial indicators seemed to act as a surrogate of the tidal cycle (Figure 4). Thus, the hourly scale, and implicitly the moment of the tidal cycle, might reveal the arrival of fecal spiked water masses from the highly urbanized downstream areas during high tide.
The official surveys performed by the Portuguese Environmental Agency in 2017 [21] showed that the worst cases of contamination, that led to the subsequent closure of Zebreiros beach, occurred around the peak of high tide. For operational reasons, all surveys were accomplished between 9:00 and 11:20 a.m., and the coincidence was unintentional. On the contrary, in 2016, only 7 surveys were carried out, all during low tide between 8:00 and 8:57 a.m., yielding better results.
Management of urban beaches may be problematic owing to the fact that different government and municipal agencies are involved, and jurisdictional limits are not always clear. The situation in the studied beach is further complicated by the fact that is under port jurisdiction. Moreover, no water quality surveys are carried out year-round, and bacteriological assessment of beach water is only performed selectively at the onset of the bathing season, and at least monthly later on (15 June to 15 September).
4.2. Perceived Quality
Roca et al. [22] compiled the recreational carrying capacity thresholds proposed by the literature, as the minimum recommended sand availability per user (m2/user). Recommended values vary with beach type, and increase in accordance with accommodation costs, but the value of 4 m2 per user is presented as the minimum acceptable limit. Although not the most comfortable for beach enjoyment, the value calculated in this study for Zebreiros beach during the peak season barely reaches that minimum limit. Moreover, the slope at the bottom, particularly during the high tide (Figure 1), concomitantly with the dramatic decrease of the dry area as water rises, reduces the available space. Nevertheless, since Zebreiros beach has supporting facilities and is mainly surrounded by semi-wild green areas within an urban zone, beachgoers seem not to be deterred, turning those bathing waters a popular spot during the summer time, regardless of the overall quality.
4.3. The Importance of Recreational Waters
In recent years, attention has been placed on the goods and services ecosystems provide, but in many cases, it is very difficult to infer their economic value. According to Alves et al. [23], non-market economic values hold historical, cultural, social, emotional, or ecological significance, and are economically important, attracting domestic and international visitors to a region.
When beaches are mainly used by locals—as in Zebreiros case for the time been, private investment is limited and municipalities have most of the financial burden, in order to contribute to the community wellbeing and to the regional appeal. On the other hand, the positive or negative perception of tourism by host populations determines the degree of community participation and support for tourism development [24], which must be considered for more effective management.
To the same extent, eventual health risks in the use of recreational waters due to inadequate or insufficient wastewater treatment will potentially harm users but furthermore will damage the external image of the region. In our case, fecal pollution is generated downstream—from the same municipality (Gondomar), and from two others within the same metropolitan area, and brought upstream with the rising of the tide.
As such, deficiencies in the urban water cycle that might jeopardize the water quality for recreational uses, and particularly bathing, come with severe risks at multiple levels, that should be accounted when managing bathing waters. With that in mind, the obtained results raise two pertinent questions: (i) sampling program timeframe, and (ii) urban water cycle leaks. The first one is linked to the meaning and the eventual limited value of sampling if closely undertaken according to the European legal criteria (BWD). Indeed, the possibility to drastically reduce the sampling frequency to just 1 sample/month during the 4-month bathing season seems inadequate to estuarine water quality dynamics. The second has profound management implications at the metropolitan area scale, since the quality decreases substantially during high tide due to the upstream movement of contaminated water from adjacent highly urbanized areas. Dealing with both is crucial to ascertain the risk posed by direct and indirect contact with bathing water, and to provide beachgoers with scientifically sound information in order to make better and informed decisions when dealing with the choice of when and where to go for estuarine bathing.
5. Conclusions
- In the Douro estuary, water quality varies on an hourly scale, depending on the tide, rather than on a daily, weekly, or monthly scale during the bathing season.
- Intestinal enterococci seem to be a better indicator of estuarine water quality than E. coli, particularly during short-term events (hour-to-hour scale).
- The water quality tended to worsen during high tide due to the tidal excursion of more contaminated surface water from downstream highly urbanized areas, where sewage is inadequately treated and dozens of small contaminated urban tributaries discharge their flows.
- The present EU sampling strategy seems inadequate for tidal environments.
Acknowledgments
The authors acknowledge the Hydrobiology laboratory staff that supported field and/or laboratory work; the Mayor of Gondomar for logistical support; and J. Vieira for kindly providing boat transportation. This work was implemented in the Framework of the Structured Program of R&D&I INNOVMAR—Innovation and Sustainability in the Management and Exploitation of Marine Resources (Reference NORTE-01-0145-FEDER-000035), namely within the Research Line ECOSERVICES, supported by the Northern Portugal Regional Operational Programme (NORTE2020), through the European Regional Development Fund (ERDF), which also covered open access publishing costs. C. Teixeira acknowledges FCT for a postdoctoral grant (ref. SFRH/BPD/110730/2015) through POCH, cofunded by MCTES and the European Social Fund.
Author Contributions
All authors conceived, designed and performed the study; and S.C.-D. and A.A.B. wrote the paper with contributions from all co-authors.
Conflicts of Interest
The authors declare no conflict of interest.
References
- Mason, P. Tourism Impacts, Planning and Management, 3rd ed.; Routledge: New York, NY, USA, 2016; ISBN 978-1-315-78106-8. [Google Scholar]
- Rabinovici, S.J.M.; Berknopf, R.L.; Whitman, R.L. Economic and health risk trade-offs of swim closures at a Lake Michigan beach. Environ. Sci. Technol. 2004, 38, 2737–2745. [Google Scholar] [CrossRef] [PubMed]
- Costanza, R.; d’Arge, R.; de Groot, R.; Farberk, S.; Grasso, M.; Hannon, B.; Limburg, K.; d Naeem, S.; O’Neill, R.; Paruelo, J.; et al. The value of the world’s ecosystem services and natural capital. Nature 1997, 387, 253–260. [Google Scholar] [CrossRef]
- Pinto, R.; Marques, J.C. Ecosystem services in estuarine systems: Implications for management. In Ecosystem Services and River Basin Ecohydrology; Chicharo, L., Müller, F., Fohrer, N., Eds.; Springer: Dordrecht, The Netherlands, 2015; pp. 319–341. ISBN 978-94-017-9845-7. [Google Scholar]
- TEPatCotE, Union. Directive 2006/7/EC of the European Parliament and of the Council of 15 February 2006 concerning the management of bathing water quality and repealing Directive 76/160/EEC. Off. J. Eur. Union 2006, L64, 37–51. [Google Scholar]
- Wade, T.J.; Pai, N.; Eisenberg, J.N.; Colford, J.M., Jr. Do U.S. Environmental Protection Agency water quality guidelines for recreational waters prevent gastrointestinal illness? A systematic review and meta-analysis. Environ. Health Perspect. 2003, 111, 1102–1109. [Google Scholar] [CrossRef] [PubMed]
- Environmental Protection Agency (EPA). Bacteriological Ambient Water Quality Criteria for Marine and Freshwater Recreational Waters; PB86-158-045; US EPA: Springfield, VA, USA, 1986.
- Fewtrell, L.; Kay, D. Recreational Water and Infection: A Review of Recent Findings. Curr. Environ. Health Rep. 2015, 2, 85–94. [Google Scholar] [CrossRef] [PubMed]
- Boehm, A.B.; Grant, S.B.; Kim, J.H.; Mowbray, S.L.; McGee, C.D.; Clark, C.D.; Foley, D.M.; Wellman, D.E. Decadal and Shorter Period Variability of Surf Zone Water Quality at Huntington Beach, California. Environ. Sci. Technol. 2002, 36, 3885–3892. [Google Scholar] [CrossRef] [PubMed]
- Bordalo, A.A. Microbiological water quality in urban coastal beaches: The influence of water dynamics and optimization of the sampling strategy. Water Res. 2003, 37, 3233–3241. [Google Scholar] [CrossRef]
- Smith, S.D.A.; Markic, A. Estimates of Marine Debris Accumulation on Beaches Are Strongly Affected by the Temporal Scale of Sampling. PLoS ONE 2013, 8, e83694. [Google Scholar] [CrossRef] [PubMed]
- Colford, J.M., Jr.; Schiff, K.C.; Griffith, J.F.; Yau, V.; Arnold, B.F.; Wright, C.C.; Gruber, J.S.; Wade, T.J.; Burns, S.; Hayes, J.; et al. Using rapid indicators for Enterococcus to assess the risk of illness after exposure to urban runoff contaminated marine water. Water Res. 2012, 46, 2176–2186. [Google Scholar] [CrossRef] [PubMed]
- Rathnayaka, K.; Malano, H.; Arora, M. Assessment of Sustainability of Urban Water Supply and Demand Management Options: A Comprehensive Approach. Water 2016, 8, 595. [Google Scholar] [CrossRef]
- Amorim, E.; Ramos, S.; Bordalo, A.A. Relevance of temporal and spatial variability for monitoring the microbiological water quality in an urban bathing area. Ocean Coast. Manag. 2014, 91, 41–49. [Google Scholar] [CrossRef]
- FEE—Foundation for Environmental Education. Blue Flag Beach Criteria and Explanatory Notes 2017. Available online: https://static1.squarespace.com/static/55371ebde4b0e49a1e2ee9f6/t/5899e01ac534a5036aecbeeb/1486479387823/Beach+Criteria+and+Explanatory+Notes.pdf (accessed on 2 October 2017).
- Emery, K.O. A simple method of measuring beach profiles. Limnol. Oceanogr. 1961, 6, 90–93. [Google Scholar] [CrossRef]
- Araújo, S.; Henriques, I.S.; Leandro, S.M.; Alves, A.; Pereira, A.; Correia, A. Gulls identified as major source of fecal pollution in coastal waters: A microbial source tracking study. Sci. Total Environ. 2014, 470–471, 84–91. [Google Scholar] [CrossRef] [PubMed]
- Converse, R.R.; Kinzelman, J.L.; Sams, E.A.; Hudgens, E.; Dufour, A.P.; Ryu, H.; Santo-Domingo, J.W.; Kelty, C.A.; Shanks, O.C.; Siefring, S.D.; et al. Dramatic improvements in beach water quality following gull removal. Environ. Sci. Technol. 2012, 46, 10206–10213. [Google Scholar] [CrossRef] [PubMed]
- Noble, R.T.; Moore, D.F.; Leecaster, M.K.; McGee, C.D.; Weisberg, S.B. Comparison of total coliform, fecal coliform, and enterococcus bacterial indicator response for ocean recreational water quality testing. Water Res. 2003, 37, 1637–1643. [Google Scholar] [CrossRef]
- Yamahara, K.M.; Sassoubre, L.M.; Goodwin, K.D.; Boehm, A.B. Occurrence and persistence of human pathogens and indicator organisms in beach sands along the California coast. Appl. Environ. Microbiol. 2012, 78, 1733–1745. [Google Scholar] [CrossRef] [PubMed]
- SNIRH—Sistema Nacional de Informação de Recursos Hídricos. Available online: http://www.snirh.pt/snirh/_dadossintese/zbalnear/janela/par_graficos.php?code_cee=PTCE7N&ano=2017#tabela (accessed on 2 October 2017). (In Portuguese).
- Roca, E.; Riera, C.; Villares, M.; Fragell, R.; Junyent, R. A combined assessment of beach occupancy and public perceptions of beach quality: A case study in the Costa Brava, Spain. Ocean Coast. Manag. 2008, 51, 839–846. [Google Scholar] [CrossRef]
- Alves, B.; Ballester, R.; Rigall-I-Torrent, R.; Ferreira, O.; Benavente, J. How feasible is coastal management? A social benefit analysis of a coastal destination in SW Spain. Tour. Manag. 2017, 60, 188–200. [Google Scholar] [CrossRef]
- Rasoolimanesh, S.M.; Ringle, C.M.; Jaafar, M.; Ramayah, T. Urban vs. rural destinations: Residents’ perceptions, community participation and support for tourism development. Tour. Manag. 2017, 60, 147–158. [Google Scholar] [CrossRef]
Figure 1.
Zebreiros beach within the Douro estuary (NW Portugal). Inserts—cross section of the river bottom relative to the beach; and sampling location with beach delimitation.
Figure 1.
Zebreiros beach within the Douro estuary (NW Portugal). Inserts—cross section of the river bottom relative to the beach; and sampling location with beach delimitation.
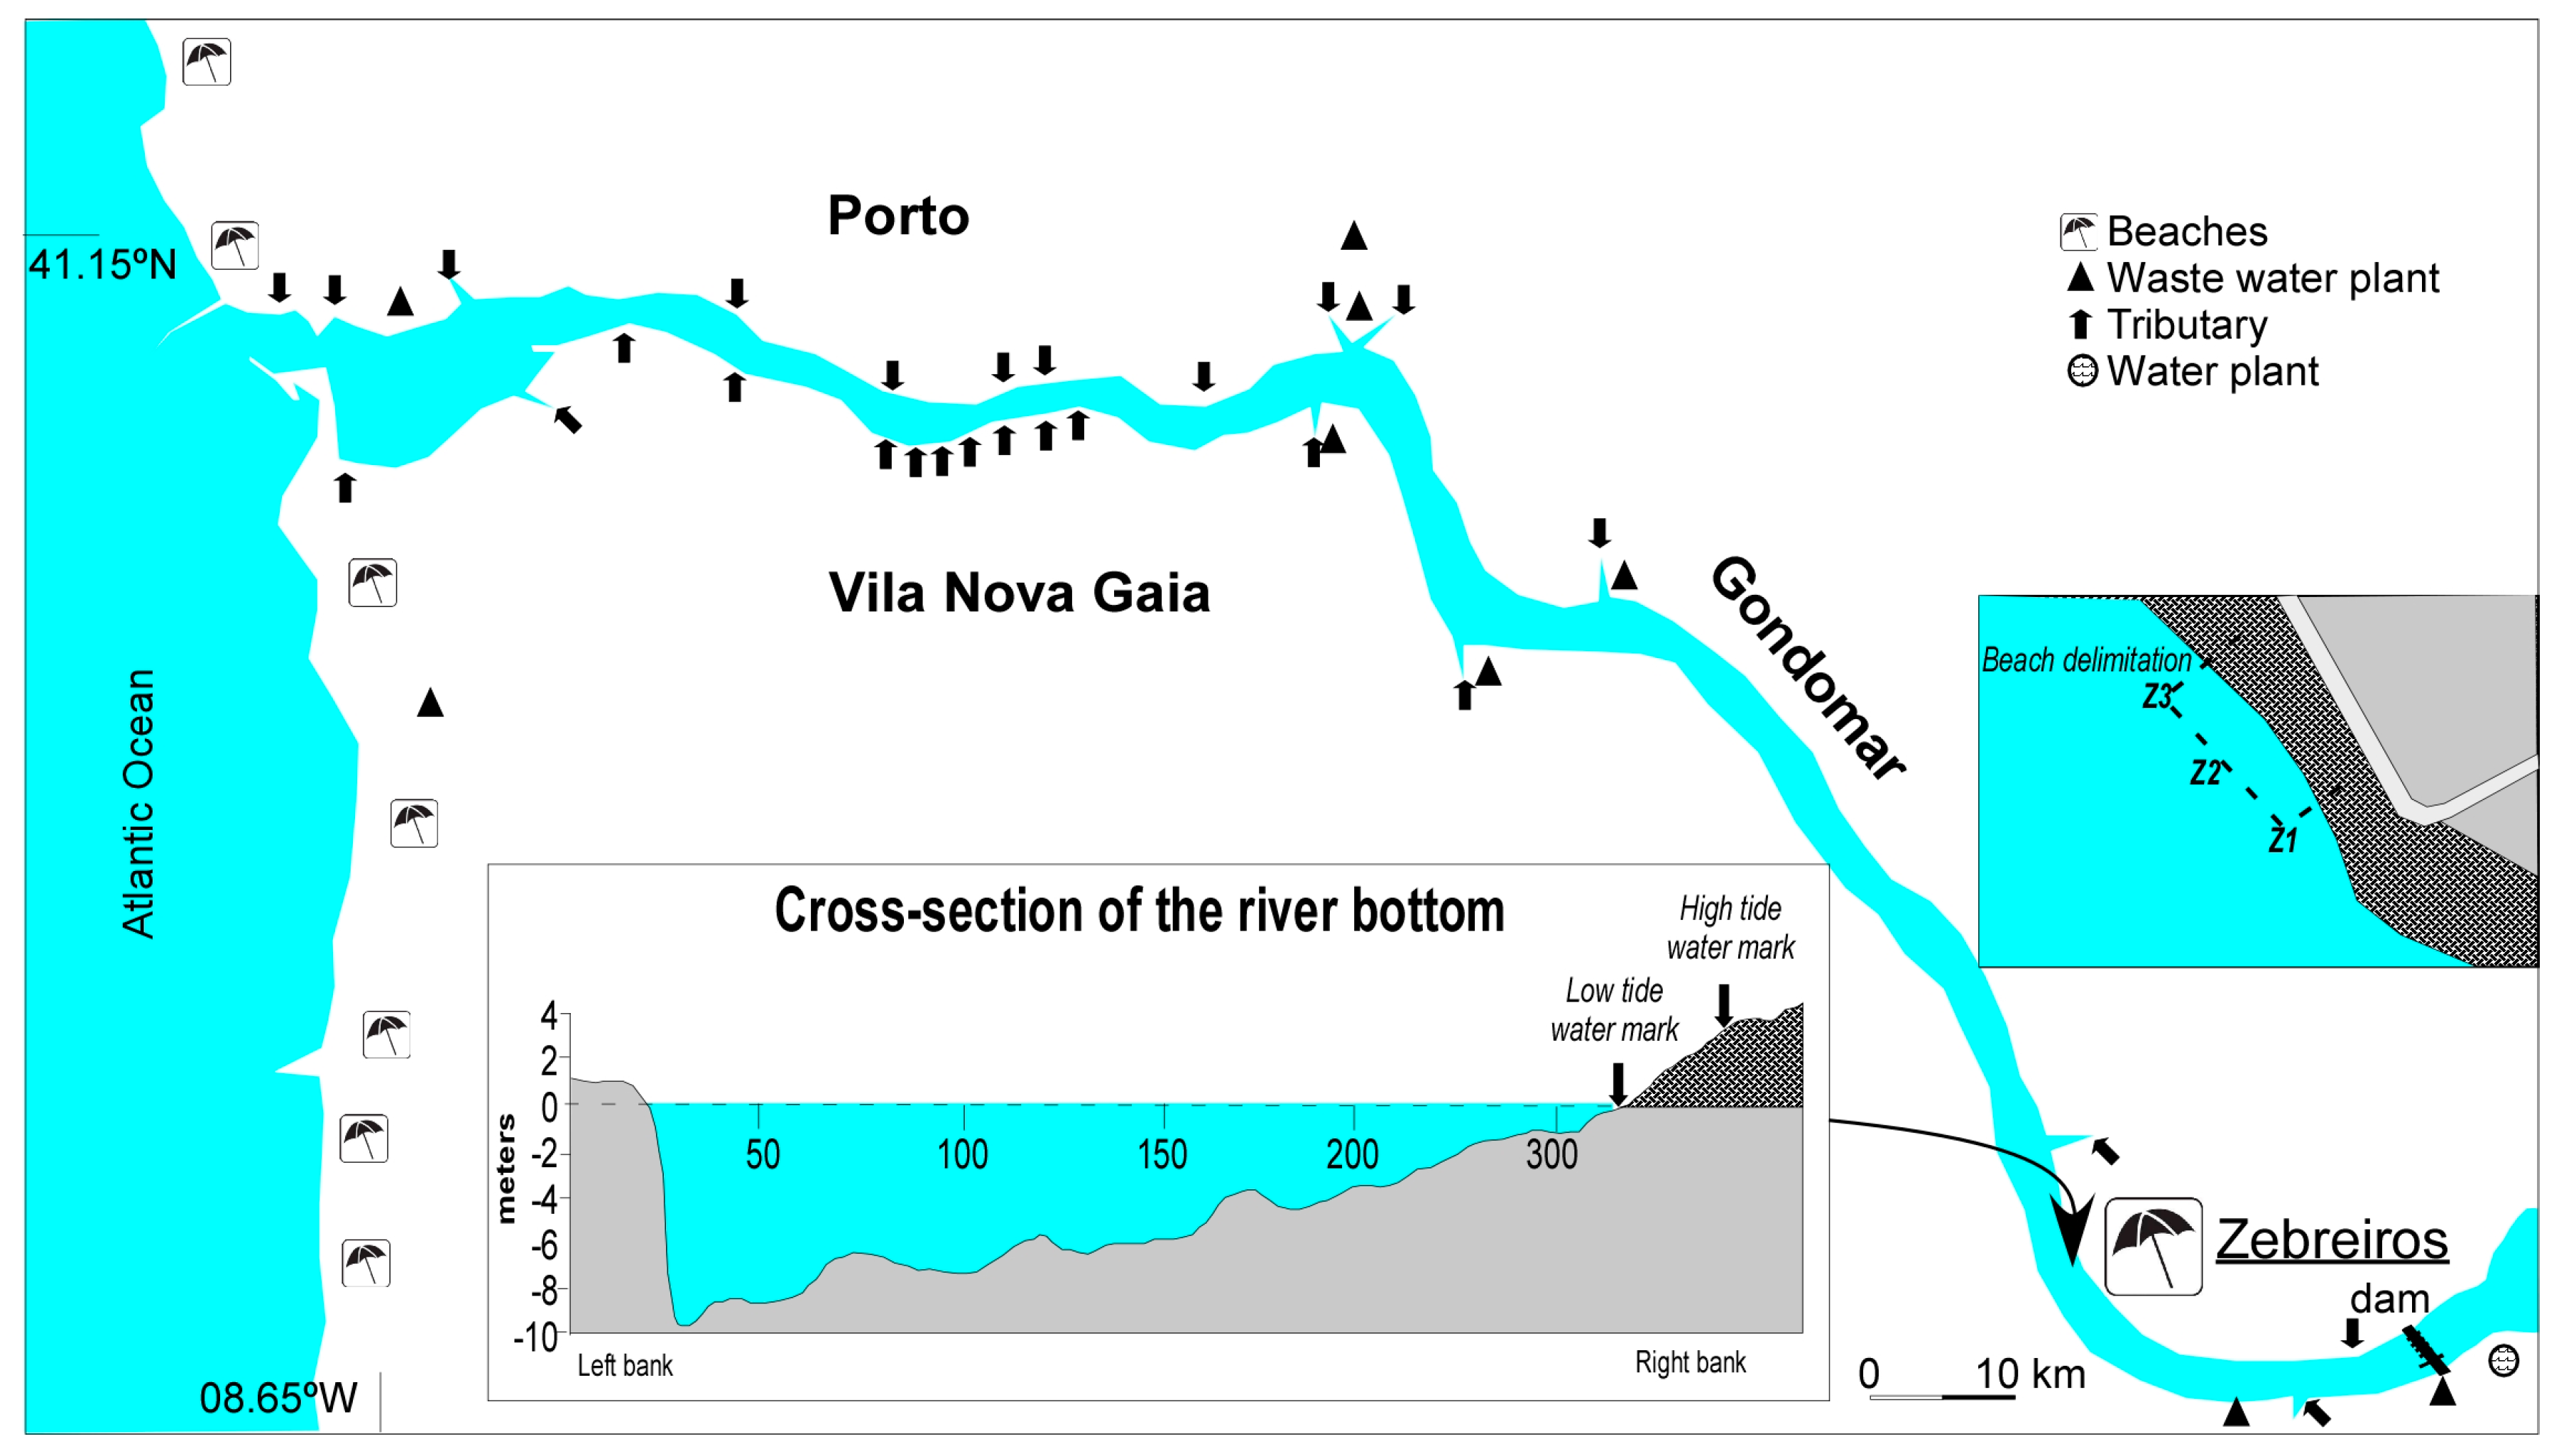
Figure 2.
Spatial (Z1 through Z3) and temporal (June through September) distribution of key environmental descriptors: temperature (°C), turbidity (NTU) and dissolved oxygen (mg L−1) at Zebreiros beach during the 2016 bathing season.
Figure 2.
Spatial (Z1 through Z3) and temporal (June through September) distribution of key environmental descriptors: temperature (°C), turbidity (NTU) and dissolved oxygen (mg L−1) at Zebreiros beach during the 2016 bathing season.

Figure 3.
Spatial (Z1 through Z3) and temporal (June through September) distribution of E. coli and intestinal enterococci (cfu per 100 mL).
Figure 3.
Spatial (Z1 through Z3) and temporal (June through September) distribution of E. coli and intestinal enterococci (cfu per 100 mL).
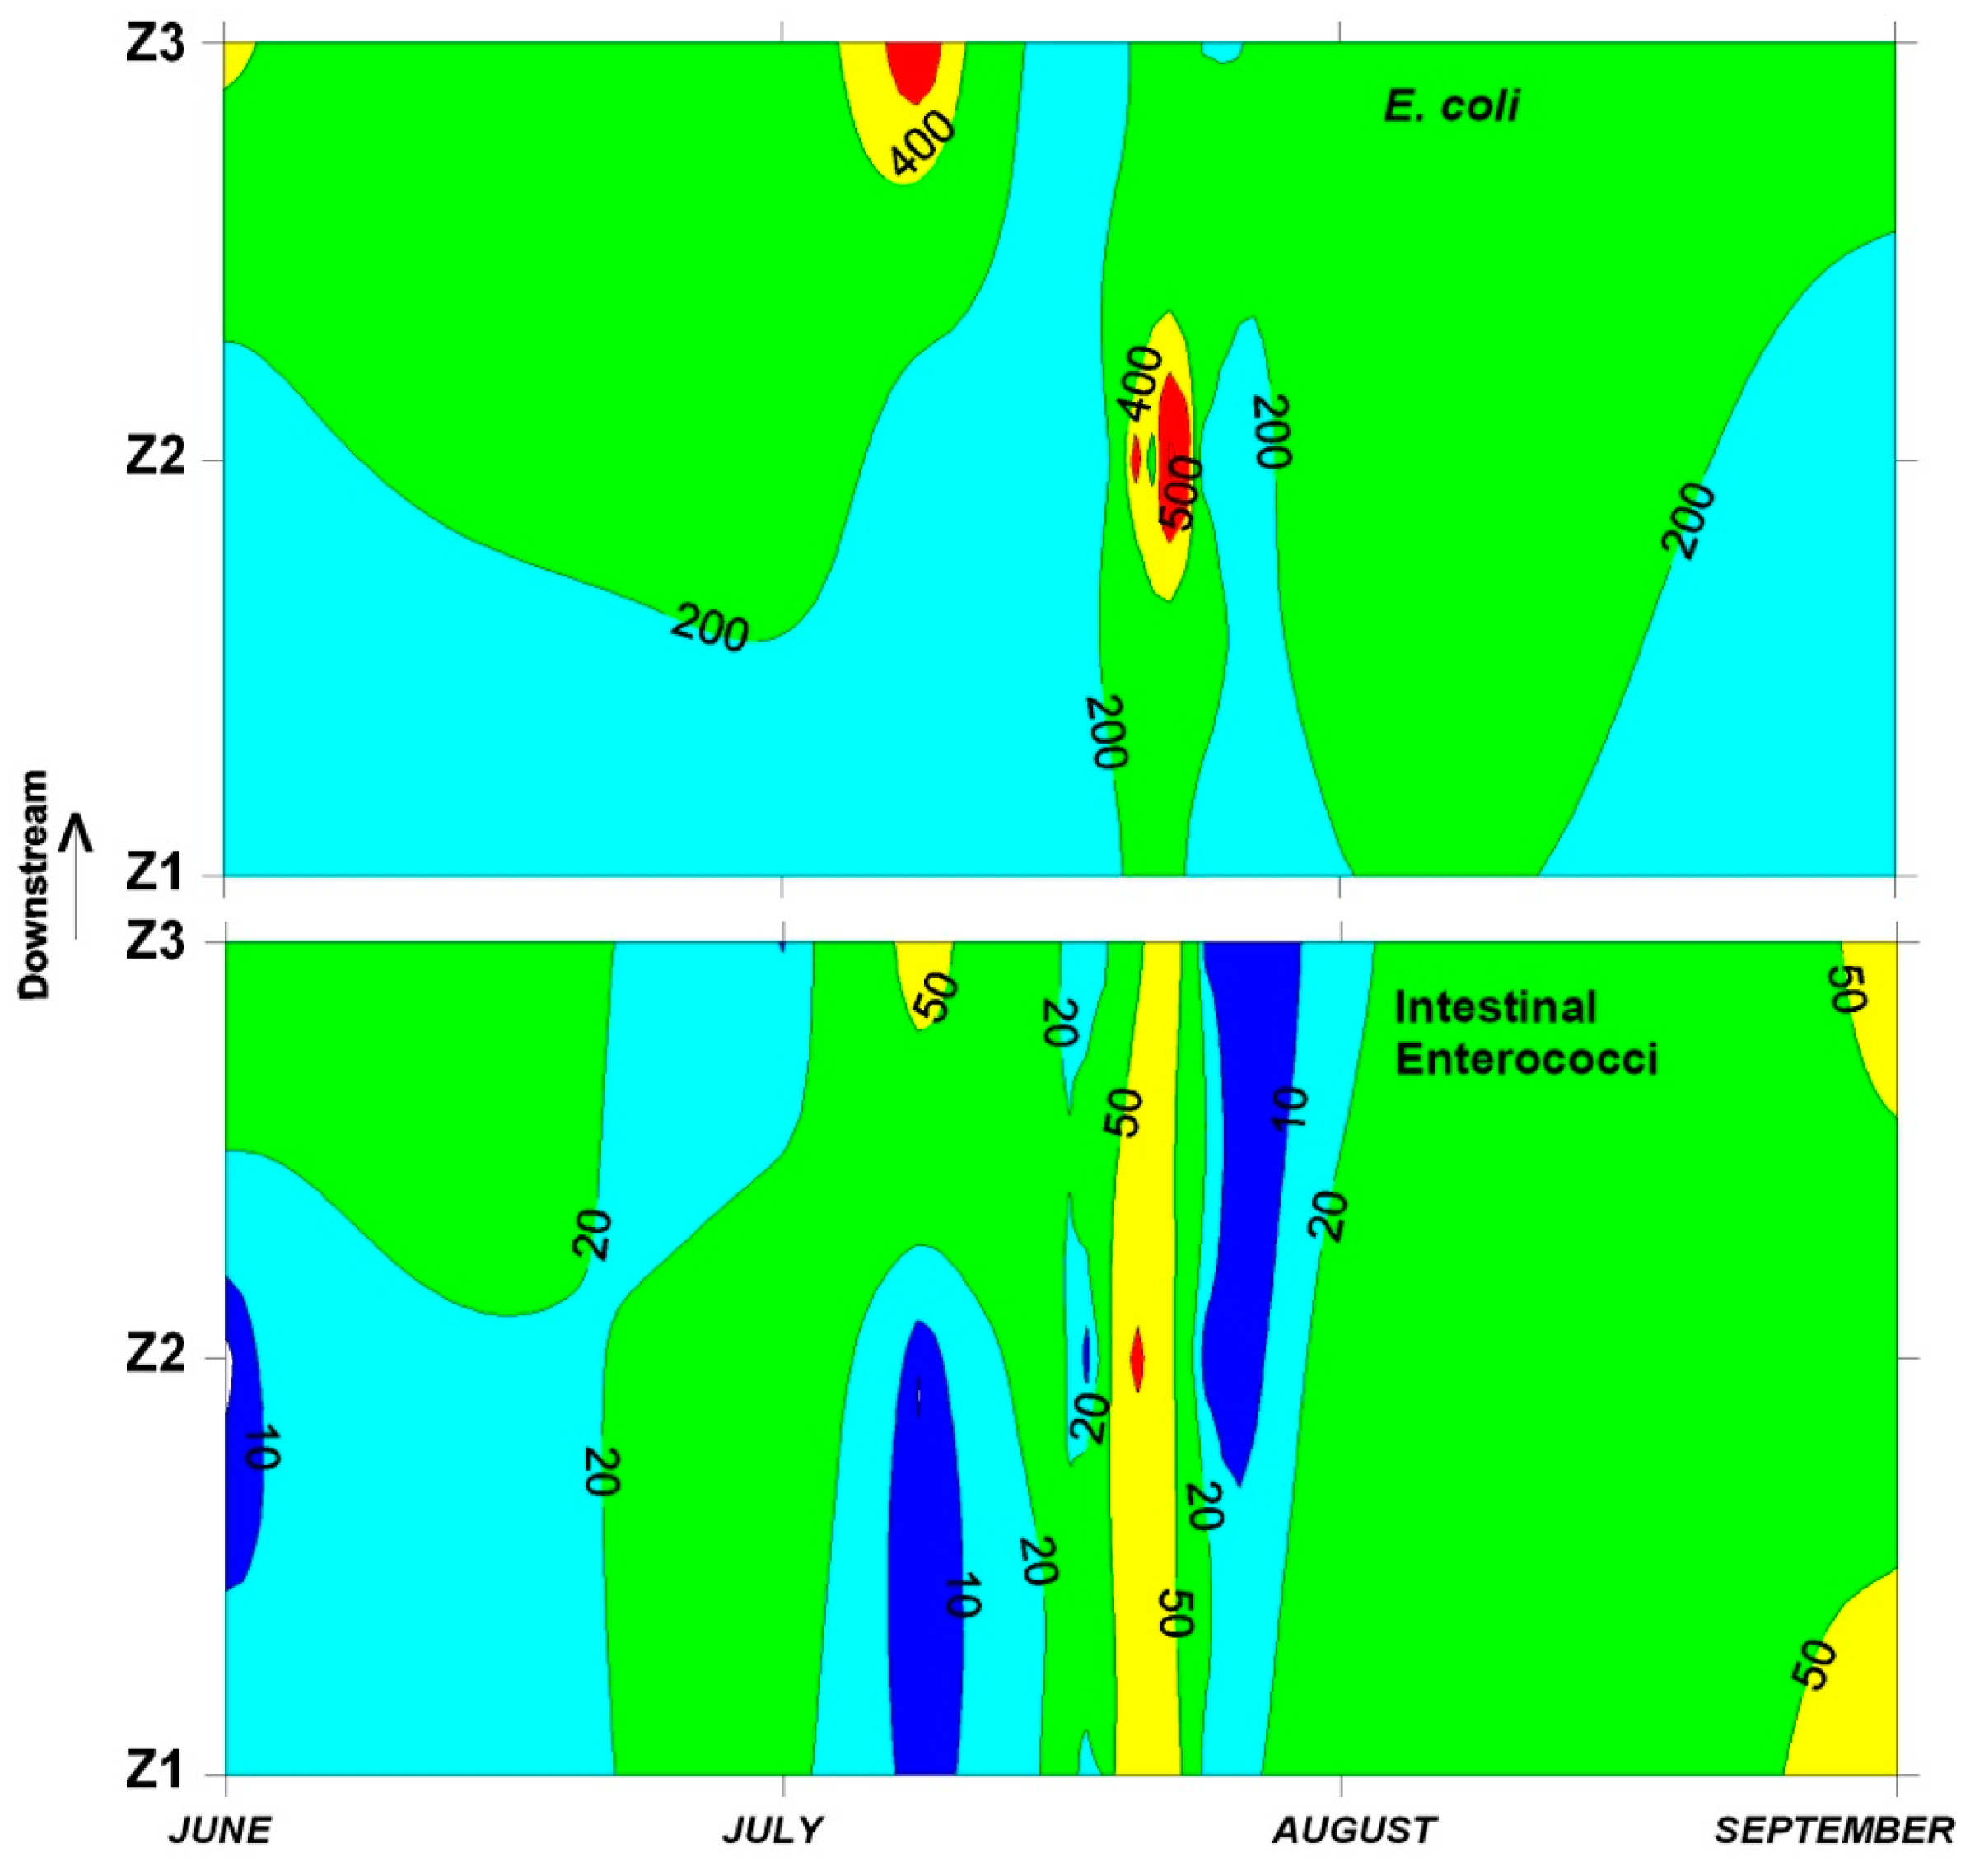
Figure 4.
Hourly variability of the tidal height during two consecutive tidal cycles (m) and the distribution of E. coli and intestinal enterococci (IE) (cfu 100 mL−1) at Zebreiros beach (20–21 July 2016).
Figure 4.
Hourly variability of the tidal height during two consecutive tidal cycles (m) and the distribution of E. coli and intestinal enterococci (IE) (cfu 100 mL−1) at Zebreiros beach (20–21 July 2016).

Figure 5.
Temporal scale variances for the microbiological indicators: (a) E. coli; (b) Intestinal enterococci, measured at Z2 BWD benchmarks are given (Sufficient/Good/Excellent quality; assessment based on * percentile 95; ** percentile 90). Letters correspond to different homogeneous groups derived from ANOVA.

© 2018 by the authors. Licensee MDPI, Basel, Switzerland. This article is an open access article distributed under the terms and conditions of the Creative Commons Attribution (CC BY) license (http://creativecommons.org/licenses/by/4.0/).
Share and Cite
MDPI and ACS Style
Costa-Dias, S.; Machado, A.; Teixeira, C.; Bordalo, A.A. Urban Estuarine Beaches and Urban Water Cycle Seepage: The Influence of Temporal Scales. Water 2018, 10, 173. https://doi.org/10.3390/w10020173
AMA Style
Costa-Dias S, Machado A, Teixeira C, Bordalo AA. Urban Estuarine Beaches and Urban Water Cycle Seepage: The Influence of Temporal Scales. Water. 2018; 10(2):173. https://doi.org/10.3390/w10020173
Chicago/Turabian StyleCosta-Dias, Sérgia, Ana Machado, Catarina Teixeira, and Adriano A. Bordalo. 2018. "Urban Estuarine Beaches and Urban Water Cycle Seepage: The Influence of Temporal Scales" Water 10, no. 2: 173. https://doi.org/10.3390/w10020173
Note that from the first issue of 2016, this journal uses article numbers instead of page numbers. See further details here.