Influence of a Storm Surge Barrier’s Operation on the Flood Frequency in the Rhine Delta Area


Abstract
:1. Introduction
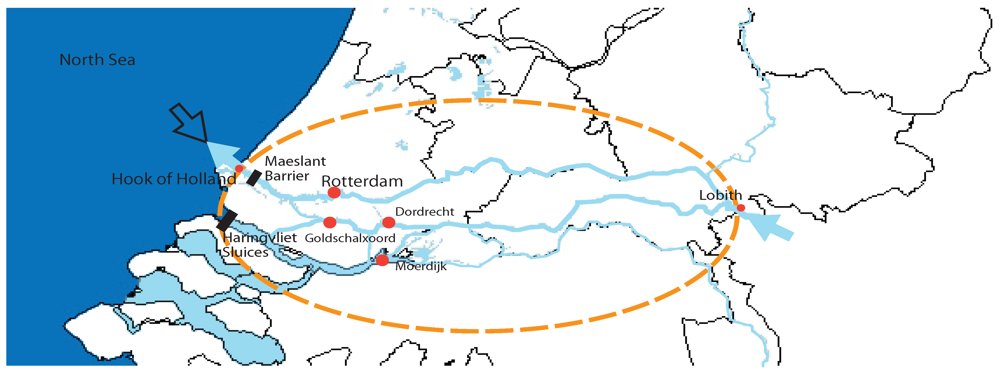
2. Description of the Rhine Delta


| Gauge station | Unit | Period (years) |
|---|---|---|
| Hook of Holland | High sea water level (m MSL one high water recording at every tide cycle) | 1887–2009 |
| Lobith | Mean daily discharge (m3/s) | 1901–2009 |
| Rotterdam | Water level (m MSL one high water recording at every tide cycle) | 1940–2009 |


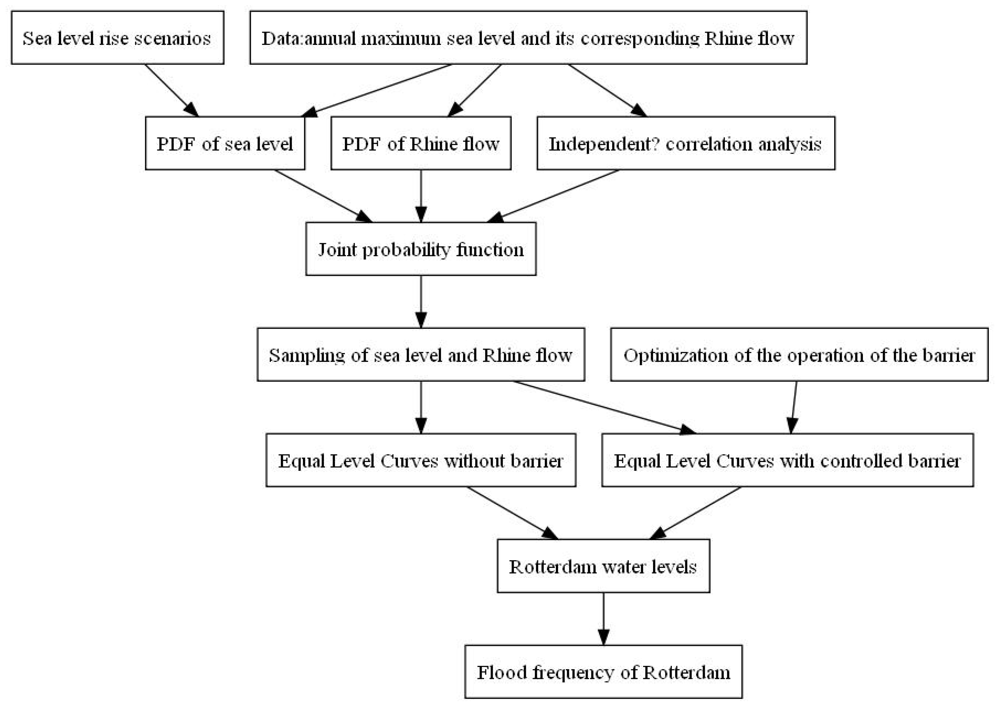
3. Methodology
- (1) To investigate the historical observations in order to detect and remove trends and discontinuities.
- (2) To derive the probability density functions for annual maximum sea levels and their corresponding Rhine flows.
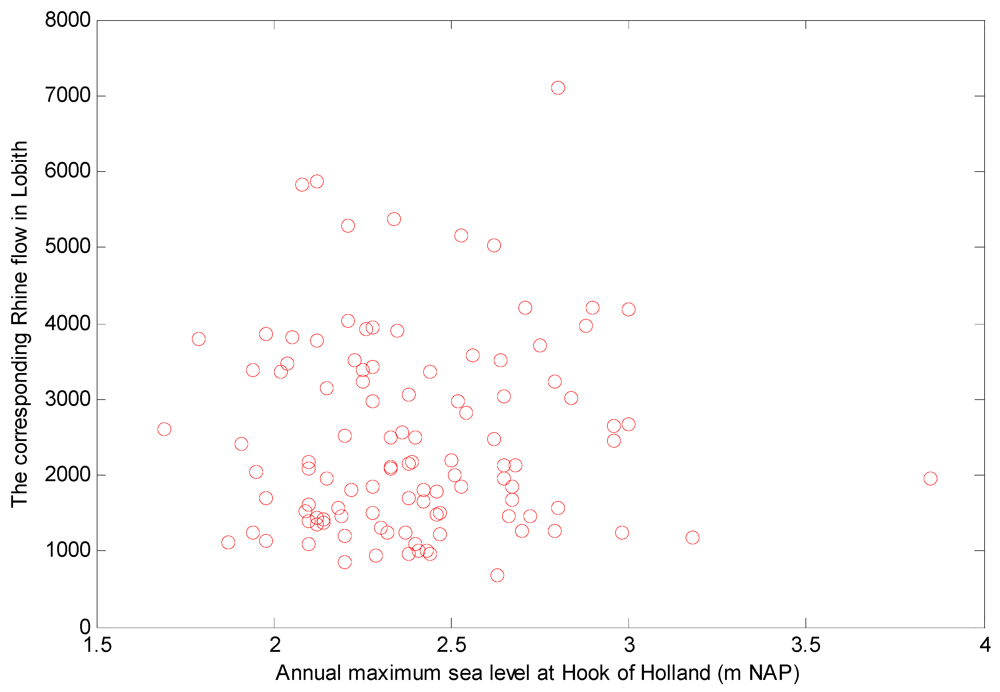
- (3) To examine the degree of correlation between the above sea levels and Rhine flows.
- (4) To develop an exceedance probability function of the Rotterdam water level using the above probability functions and ‘Equal Level Curves’.
- (5) To work out the exceedance joint probability function using Monte Carlo Simulations.
- (6)To repeat steps 2 to 6 to build up future sea level rising scenarios.

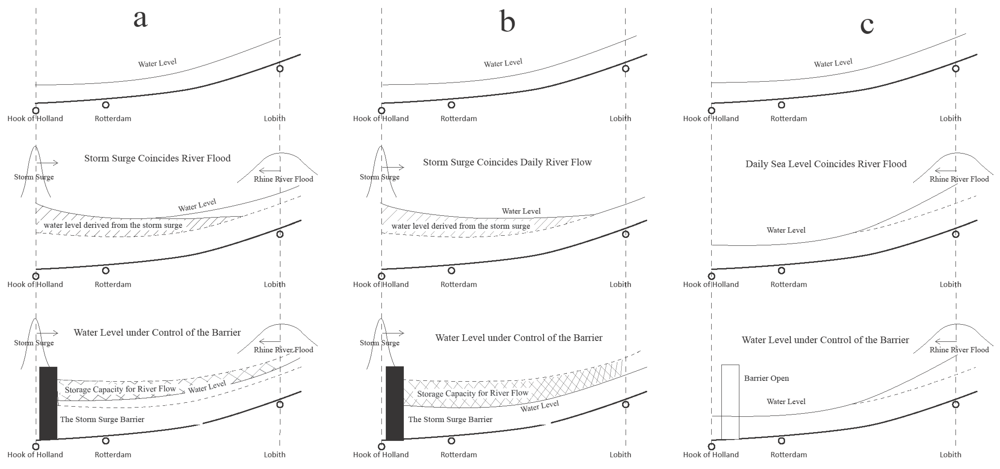
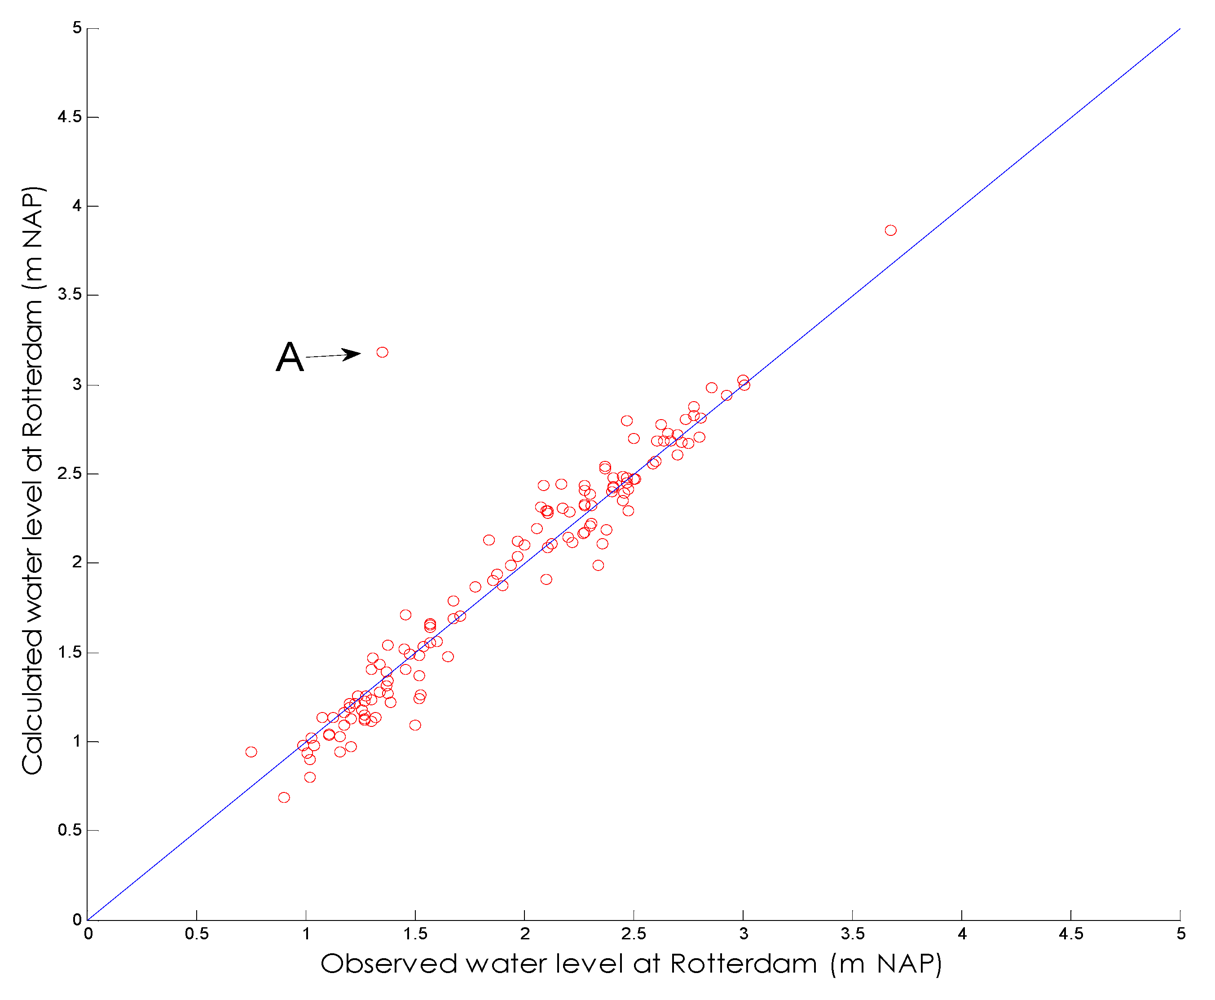
4. Simulation of the Water Level at Rotterdam
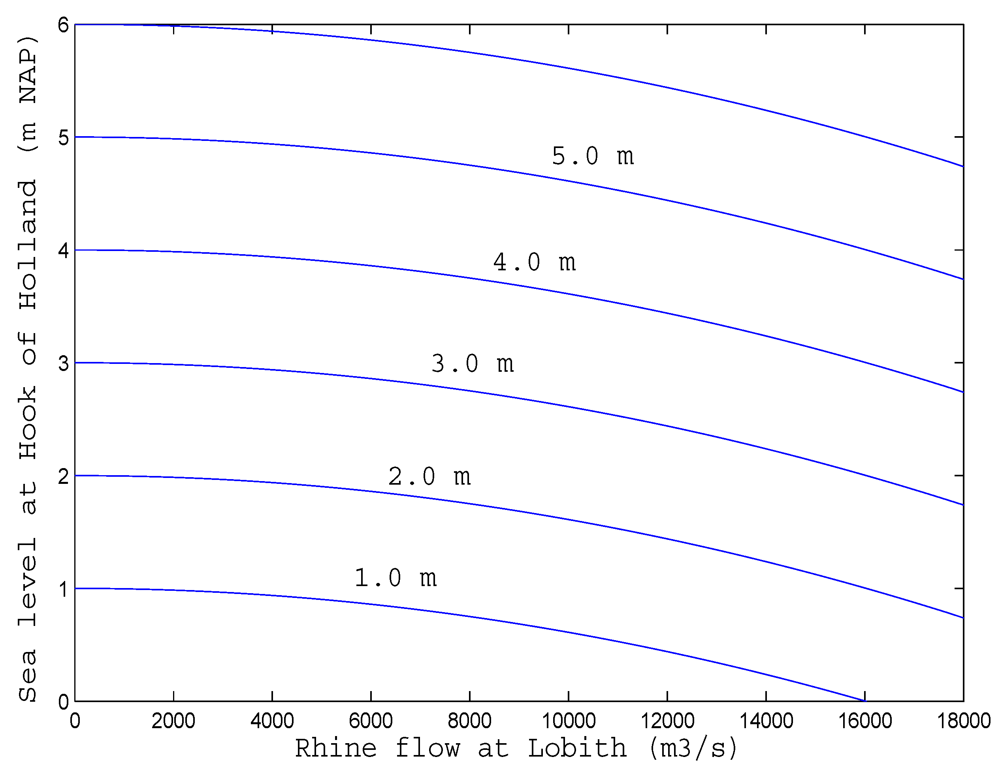
4.1. Equal Level Curves


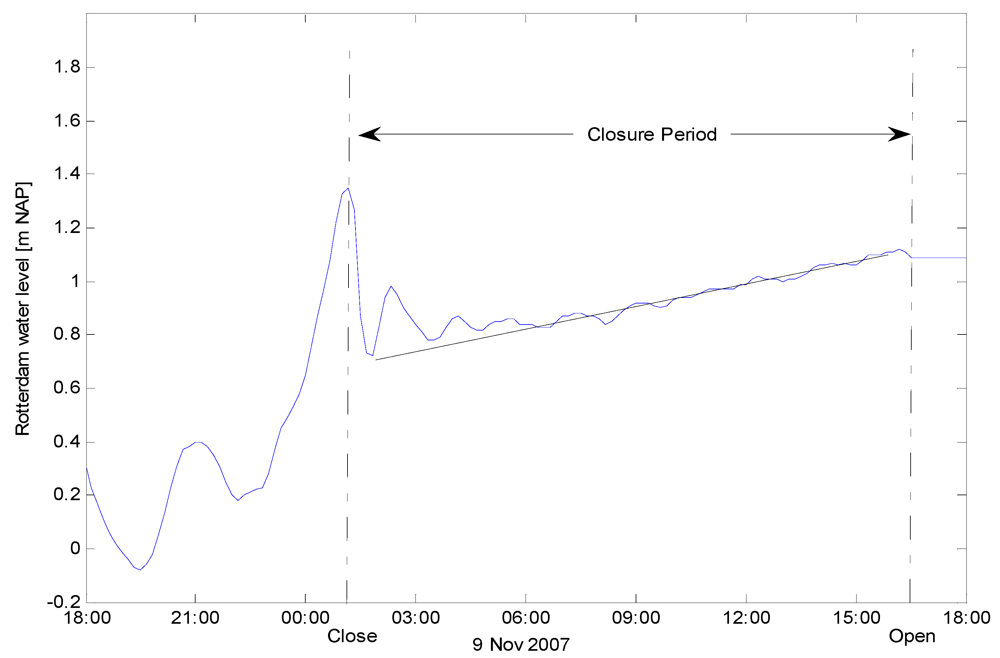
4.2. Reservoir Model after Closure of the Maeslant Barrier


5. Flood Frequency Analysis
5.1. Historical Data Analysis
| Annual maximum sea level in Hook of Holland | Trend test | Jump test | |
|---|---|---|---|
| Test (at the significance level 0.05) | Mann Kendall test | Spearman’s rank correlation coefficient method | Jump test |
| Null hypothesis (H0) | No trend | No trend | No abrupt points |
| P-value | 0.0058 | 0.0054 | 0.1318 |
| Reject H0 | Yes | Yes | No |
| Annual maximum sea level in Hook of Holland | Trend test | Jump test | |
|---|---|---|---|
| Test | Mann Kendall test | Spearman’s rank correlation coefficient method | Jump test |
| Null hypothesis (H0) | No trend | No trend | No abrupt points |
| P-value | 0.71 | 0.69 | 0.21 |
| Reject H0 | No | No | No |
| Rhine flow in Lobith | Trend test | Jump test | |
|---|---|---|---|
| Test | Mann Kendall test | Spearman’s rank correlation coefficient method | Jump test |
| Null hypothesis (H0) | No trend | No trend | No abrupt points |
| P-value | 0.98 | 0.96 | 0.16 |
| Reject H0 | No | No | No |
5.2. Probability Density Functions of Annual Maximum Sea Levels and the Corresponding Daily Rhine Discharge

 is −0.02; the value of
  is 0.26 m MSL; the value of
  is 2.35 m MSL; x stands for the sea level at Hook of Holland and its unit is m MSL.
 is 7.69 m3/s; the value of
  is 0.50 m3/s; x stands for the daily mean Rhine discharge and its unit is m3/s.
5.3. Relationship between High Sea Level and Rhine Discharge
5.4. The Exceedance Joint Probability Function of Rotterdam Water Level


5.5. Sea Level Rise
| Year | Mean Sea Level Rise (m) |
|---|---|
| 2050 | 0.35 |
| 2100 | 0.85 |
6. Results
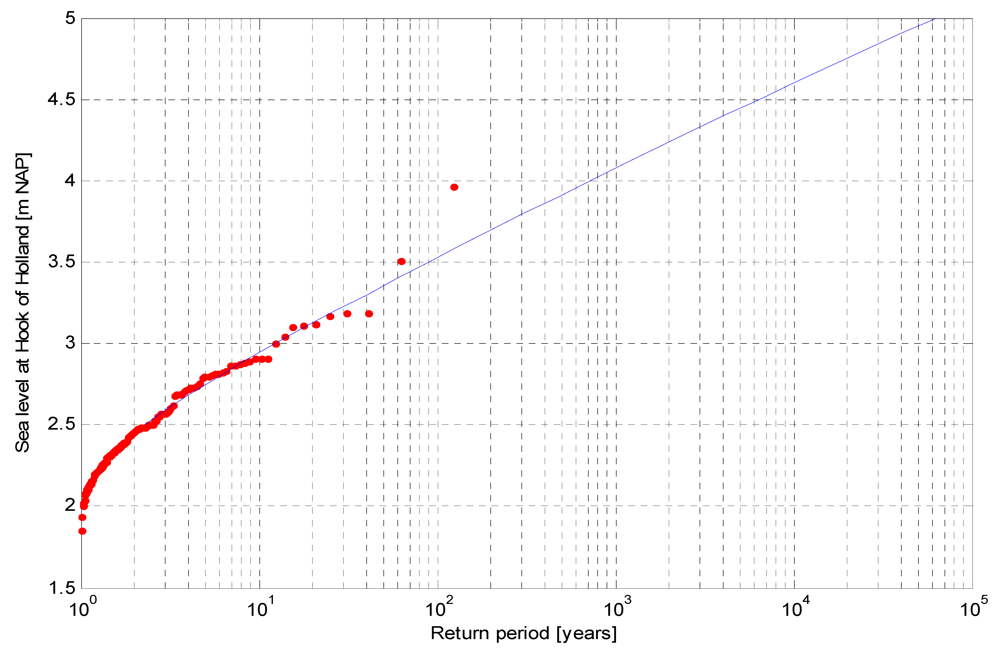
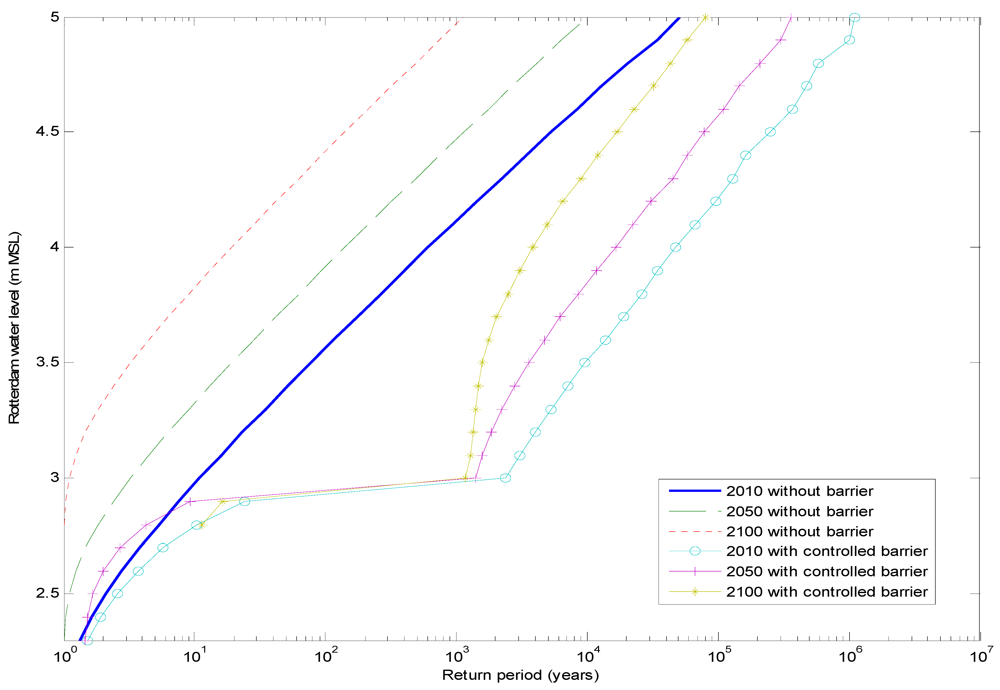
6.1. Return Period Results

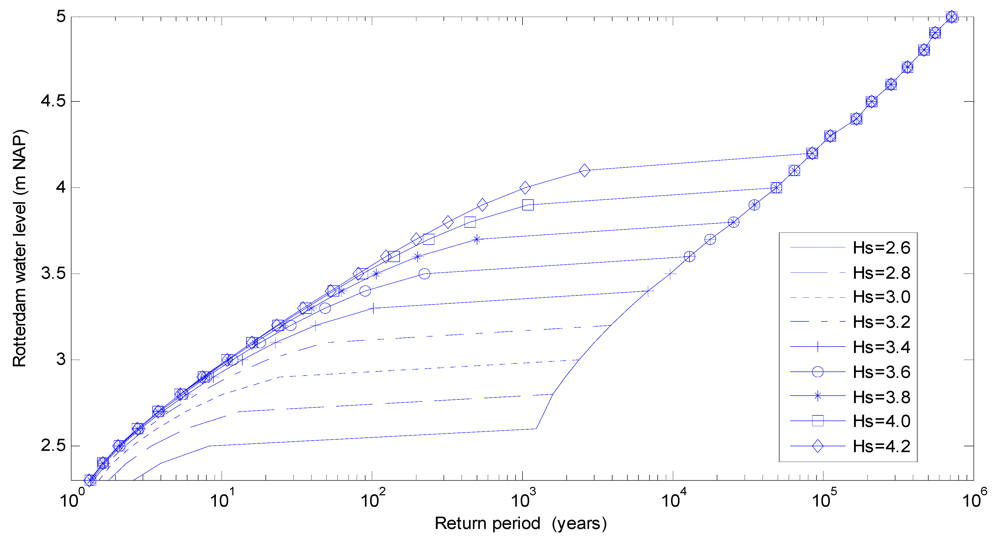
6.2. Sensitivity Test

7. Conclusions and Recommendations
- (1) The uncertainty in Equal Level Curves and in the statistic analysis of extreme North Sea level will be investigated.
- (2) Instead of the Equal Level Curves approach, a more advanced numerical hydrodynamic model should be applied.
- (3) Both the sea level and Rhine discharge are not a constant peak value of a certain duration. In this research a semi-unsteady sea level boundary condition seems to be an overestimation. A design hydrograph of the sea level at Hook of Holland is preferred. The sea level consists of several variables like the wind set-up and the astronomical tide; the former occurs randomly and the other occurs deterministically. The phase difference between them is statistically important. In other words, an improved probability analysis of the hydraulic boundary conditions is required.
- (4) Considering the effects of the control parameters in the operation in an integrated manner, constraints on other objectives such as navigation and fresh water supply will influence the parameters. Moreover, instead of one barrier in the mouth of a simplified estuary, there are several barriers and flood gates in the Rhine delta, with different operational controls. All these barriers and other hydraulic structures define a whole system, where an advanced model predictive controller should be applied [24,25].
References
- Rosenzweig, C.; Solecki, W.D.; Blake, R.; Bowman, M.; Faris, C.; Gornitz, V.; Horton, R.; Jacob, K.; LeBlanc, A.; Leichenko, R. Developing coastal adaptation to climate change in the New York City infrastructure-shed: Process, approach, tools, and strategies. Clim. Chang. 2011, 106, 93–127. [Google Scholar] [CrossRef]
- Jonkman, S.N.; Kelman, I. Deaths during the 1953 North Sea storm surge. In Proceedings of the Solutions to Coastal Disasters Conference, American Society for Civil Engineers, Charleston, VA, USA, 8–11 May 2005; pp. 749–758.
- Van Dantzig, D. Economic decision problems for flood prevention. J. Econom. Soc. 1956, 276–287. [Google Scholar]
- Vergeer, G.J.H. Probabilistic Design of Flood Defences; Report 141; Centre for Civil Engineering Research and Codes (CUR): Gouda, The Netherlands, 1990. [Google Scholar]
- Van der Made, J.W. Design levels in the transition zone between the tidal reach and the river regime reach. Hydrol. Deltas 1969, 2, 257–272. [Google Scholar]
- Jorigny, M.; Diermanse, F.; Hassan, R.; van Gelder, P. Correlation analysis of water levels along Dike-Ring areas. In Proceedings of Computational Methods in Water Resources, Book Series: Developments in Water Science; Hassanizadeh, S.M., Schotting, R.J., Gray, W.G., Pinder, G.F., Eds.; Elsevier : Amsterdam, The Netherlands, 2002; 47, pp. 1677–1684. [Google Scholar]
- Vrijling, J.K.; Gelder, P.H.A.J.M. Probabilistic Design in Hydraulic Engineering; Delft University of Technology: Delft, The Netherlands, 1996; Volume III, pp. 16–27. [Google Scholar]
- Van den Hurk, B.; Klein Tank, A.; Lenderink, G.; van Ulden, A.; van Oldenborgh, G.J.; Katsman, C.; van den Brink, H.; Keller, F.; Bessembinder, J.; Burgers, G. KNMI Climate Change Scenarios 2006 for The Netherlands; WR-2006-01; KNMI: De Bilt, The Netherland, 2006. [Google Scholar]
- Engel, H. The flood events of 1993/1994 and 1995 in the Rhine River basin. In Proceedings of Destructive Water: Water-Caused Natural Disasterstheir Abatement and Control, Anaheim, CA, USA, June 1996; IAHS: Rennes, France, 1997; pp. 21–32, International Association of Hydrological Sciences Publications No. 239. [Google Scholar]
- Chbab, E.H. How extreme were the 1995 flood waves on the rivers Rhine and Meuse? Phys. Chem. Earth 1995, 20, 455–458. [Google Scholar] [CrossRef]
- Berger, H. Hydraulic boundary conditions in the Netherlands, at present and in future. Extrem. Hydrol. Event. New Concept. Secur. 2007, 78, 409–416. [Google Scholar]
- Tol, R.S.J.; van der Grijp, N.; Olsthoorn, A.A.; van der Werff, P.E. Adapting to climate: A case study on riverine flood risks in the Netherlands. Risk Anal. 2003, 23, 575–583. [Google Scholar]
- Katsman, C.A.; Sterl, A.; Beersma, J.; van den Brink, H.; Church, J.; Hazeleger, W.; Kopp, R.; Kroon, D.; Kwadijk, J.; Lammersen, R. Exploring high-end scenarios for local sea level rise to develop flood protection strategies for a low-lying delta—The Netherlands as an example. Clim. Chang. 2011, 109, 617–645. [Google Scholar]
- Deltacommissie, Working Together with Water. A Living Land Builds for its Future. Findings of the Deltacommissie 2008; Technical Report; Hollandia Printing: Den Haag, The Netherlands, 2008.
- Bol, R. Operation of the ‘Maeslant Barrie’: (storm surge barrier in the Rotterdam New Waterway). In Flooding and Environmental Challenges for Venice and Its Lagoon: State of Knowledge; Fletcher, C.A., Spencer, T., Eds.; Cambridge University Press: Cambridge, UK, 2005; p. 311. [Google Scholar]
- Vrijling, J.K.; Bruinsma, J. Hydraulic Boundary Conditions. Hydraulic Aspects of Coastal Structures; Delft University Press: Delft, the Netherlands, 1980; Volume 1, pp. 109–133. [Google Scholar]
- Mann, H.B. Nonparametric tests against trend. J. Econom. Soc. 1945, 13, 245–259. [Google Scholar]
- Kendall, M.G. Rank Correlation Measures; Charles Griffin: London, UK, 1975; p. 202. [Google Scholar]
- Lehmann, E.L. Nonparametric Statistical Methods Based on Ranks; Holden-Day: San Francisco, CA, USA, 1975. [Google Scholar]
- Sneyers, R. On the Statistical Analysis of Series of Observations; World Meteorological Organisation: Geneva, Switzerland, 1990; Volume 415. [Google Scholar]
- Wall, F.J. Statistical Data Analysis Handbook; McGraw-Hill: New York, NY, USA, 1986. [Google Scholar]
- Van Gelder, P.H.A.J.M. Statistical Methods for the Risk-Based Design of Civil Structures.
- Hawkes, P.J. Joint probability analysis for estimation of extremes. J. Hydraul. Res. 2008, 46, 246–256. [Google Scholar]
- Van Overloop, P.J.; Negenborn, R.R.; Schutter, B.D.; Giesen, N.C. Predictive control for national water flow optimization in the Netherlands. Intell. Infrastruct. 2010, 42, 439–461. [Google Scholar]
- Van Overloop, P.J. Operational Water Management of the Main Waters in the Netherlands; Technical Report; Delft University of Technology: Delft, the Netherlands, 2009. [Google Scholar]
© 2012 by the authors; licensee MDPI, Basel, Switzerland. This article is an open-access article distributed under the terms and conditions of the Creative Commons Attribution license (http://creativecommons.org/licenses/by/3.0/).
Share and Cite
Zhong, H.; Van Overloop, P.-J.; Van Gelder, P.; Rijcken, T. Influence of a Storm Surge Barrier’s Operation on the Flood Frequency in the Rhine Delta Area. Water 2012, 4, 474-493. https://doi.org/10.3390/w4020474
Zhong H, Van Overloop P-J, Van Gelder P, Rijcken T. Influence of a Storm Surge Barrier’s Operation on the Flood Frequency in the Rhine Delta Area. Water. 2012; 4(2):474-493. https://doi.org/10.3390/w4020474
Chicago/Turabian StyleZhong, Hua, Peter-Jules Van Overloop, Pieter Van Gelder, and Ties Rijcken. 2012. "Influence of a Storm Surge Barrier’s Operation on the Flood Frequency in the Rhine Delta Area" Water 4, no. 2: 474-493. https://doi.org/10.3390/w4020474